1
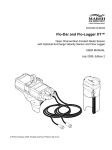
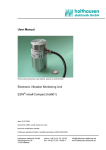
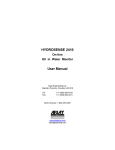
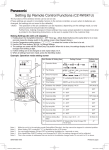
User Manual for data portals User Manual EcoLayers www.ecolayers.com This document is a general reference guide for navigation and use of on-line data portals developed by EcoLayers, Inc. While it is not a comprehensive manual for the use of the features available on the all portal levels offered, this manual should provide sufficient instruction for most users to successfully navigate, sort, query and export data from a portal. While this User Manual is edited for each customer based upon the features and capabilities provided for their portal, there may appear instruction or references to features and capabilities not available for that particular user’s portal. Contents Accessing the Portal .................................................................................................................................... 3 Recommended Browsers ........................................................................................................................ 3 Enable Pop-ups ....................................................................................................................................... 3 Portal Access ........................................................................................................................................... 3 Navigating the Left, Right, and Center Panes of the Portal ..................................................................... 5 Key Features ............................................................................................................................................... 6 The Portal Landing page ............................................................................................................................. 8 Adding a New Site ................................................................................................................................... 9 Defining Filter Criteria for Selected Features ........................................................................................ 10 Creating New Layers Using the Query Box ............................................................................................ 10 Viewing Site Details and Item Reports for Selected Features ............................................................... 11 Viewing Data in Item Reports and Charts ................................................................................................. 12 Running Queries on Item Reports ......................................................................................................... 12 Querying Column (tabular) Reports ...................................................................................................... 13 Querying Chart or Histogram Reports ................................................................................................... 14 Export to Google Earth ............................................................................................................................. 14 Other......................................................................................................................................................... 15 Portal Interaction for Administrative User ................................................................................................ 15 EcoLayers on-line data portal User Manual 2 Accessing the Portal Recommended Browsers For best performance with EcoLayer’s data portals, it is suggested that Google Chrome or Mozilla Firefox be used as the internet browser. Enable Pop-ups Pop-ups must be enabled for use this Portal. Refer to your browser Help files on how to allow all popups for this site: www.ca-watersheds.org. Portal Access The Portal is accessed by typing http:// 75.101.159.147/ xxxxxxx in your browser’s search bar. There are three modes for using most EcoLayer’s portals. Portal navigation in this guide is explained in the context of these three modes. The modes are: 1. Public (non-registered user) can access data and run basic queries and reports. Click “Continue as unregistered user”. A public user can also register on this page; see yellow arrow. 2. Registered users have access to multiple data layers at the same time and run advanced queries and reports. Type xxxxxxxxxxx for the User Name and Password. See yellow arrow. 3. Administrative mode to access a portal back end (not be available for all portal levels). This user may add, edit or delete data, programs and features. This user can also set sharing permissions and approve uploads from other users. EcoLayers on-line data portal User Manual 3 EcoLayers on-line data portal User Manual 4 Navigating the Left, Right, and Center Panes of the Portal The Portal has three main information panes: left pane for interaction with spatial and data layers, center pane for interactions with the map, and right pane to view reports and support special user interactions. Pane widths can be adjusted by placing the cursor on the border between two panes. When all panes are maximized, some information may be wrapped in the adjacent pane or hidden from view. The yellow arrows on the screen shot below show the locations of buttons and scroll bars that allow the user to maximize, minimize, or scroll though information in each pane. (Vertical scroll bar not visible) EcoLayers on-line data portal User Manual 5 Key Features The main features of the Portal are numbered in the figure below and correspond to the feature descriptions that follow. 4 3 11 6 13 7 1 8 2 12 5 9 10 1. Base layers. These layers are static. 2. Information layers specific to this Portal. Queries and data reports are linked to these layers 3. Tool bar. Starting on the left, the tool bar icons and their functions are: a. Magnifying glass: Opens the query box to refine data displayed for selected layer b. Two arrows: Reset or clear the selected layers from the map c. Shaded polygon: draws point, polyline or polygon around area of interest and selects data features within. d. Paper and magnifying glass: performs analysis on selected polygon e. Recycling basket: Users can add a site manually f. Hand: Clears selected area for analysis g. Blue globe: exports data features as KMZ file. Links to portal data are maintained in this file type. EcoLayers on-line data portal User Manual 6 h. Printer: Sends map image to printer. i. Impacted Area Line: Allows user to draw line along impacted area and add this as an impacted region. j. Impacted Area Poly: Allows user to draw line around impacted area and add this as an impacted region. k. Draw NGO area: Allows user to draw the geographical area of interest for a Stewardship Organization. 4. Main Google map 5. User-selected spatial features (sites) for the active layers drawn on Google Map 6. Links to site level item reports, charts, and other user action. See #10 “Item Report.” 7. Return to Home Page. This returns the right pane to the Home Page where a user can add a site under “Mark Watershed Location On Map” 8. Right pane that displays address box for adding new sites or data and information from selected sites. 9. Preview. Opens a preview pane below the Google map frame consisting of the list of spatial features displayed on the map for the active layer. 10. Item Report Links. Shows links to data in selected layer in format of tabular reports, charts, and other user interactions in the right pane. a. When a particular record or site is clicked on in the map for a data layer, a conversation bubble will appear with links to “View Reports and Charts”. Clicking this will take the user to the Item Report outputs for that particular site. b. If the Item Report link is clicked below the map, the right pane will display links to data for all records or sites in the selected layer. 11. Site information window that appears when a site icon or a spatial feature is left clicked. 12. Site locater icon. The colored icons in the Preview Window, when left clicked, will open a site information window for the selected feature in the active layer. 13. Select Partner Organization or Program. This is a drop down list of Partners or other Programs for the portal. When a Partner or Program is selected from the list, a new web page opens to the Partner’s site or Program and the Partner’s data folder in the left pane becomes active. EcoLayers on-line data portal User Manual 7 The Portal Landing page After logging into the portal or accessing as a non-registered user, the user arrives at the portal landing page, similar to the screen below. Clicking “Preview” to the right will display all records of the active layer Enter location to place site on map and click “Go” On portals with this feature, the user defines their area of geographical interest by typing an address in the right window pane and clicks “Go”. The map will zoom into the location entered. For portals without this feature on the landing page, the portal will open the geographical area of interest for that particular portal. EcoLayers on-line data portal User Manual 8 Adding a New Site River Steward folder Information fields to enter after clicking “Add Site” Scroll bar On portals with this feature, after the user clicks “Go” next to the address entered, the screen above will appear. A conversation bubble will appear above the location icon. Click “Add Site” and the information fields will appear in the right pane. The user then enters all information for the new site as well as uploads photos. Use the scroll bar on the right pull the pane down to click Save. This site will appear in the appropriate folder in the left window pane after the portal administrator approves the site. EcoLayers on-line data portal User Manual 9 Defining Filter Criteria for Selected Features When a user toggles the box for the data folder from the left window pane, the search criteria box opens for that Feature. Using this function, the user can filter the data by Date, Analyte, Results or other parameters. After selecting the filter criteria for the parameters of interest, click the blue ‘go’ button on the top-right of the search criteria box. To see all data for the Feature, click ‘go’ without selecting any filter criteria. If the ‘go’ button is not visible, minimize the right window pane (see yellow arrow). New Layer Go button Toggle box for features in this folder Creating New Layers Using the Query Box If the “New Layer” option is selected, the results of your query will be shown as a new layer. New layers created this way may be deleted later. To enter another query, select (toggle) the main or sub-layer and click the first tool bar above the map. Sub-layers may be added only to the main layer. EcoLayers on-line data portal User Manual 10 Viewing Site Details and Item Reports for Selected Features After selecting the Feature, with or without filter criteria, the icons will appear on the map. Click on Preview to see all records for the Feature To find a particular location: o Select the desired layer in the ‘Select Layer’ drop down list below the map. o Click on “Site Locate on Map” icon in the Preview window for a conversation bubble to point to the location of the record o Click directly on the icon on the map for links to Site Details Click Item Report below the map or Site Detail in the conversation bubble and the right pane will show available data output formats for a location. o Click on the links in the conversation bubble to view data and reports for that a particular location/ record. o Click on Item Report button below the map on the right side to view data and reports for all records in the selected layer. Use ‘Select Layer’ to choose which layer to show records for Site Locate on Map and Preview pane EcoLayers on-line data portal User Manual Site Detail and Item Report options information Preview and Item Report buttons 11 Viewing Data in Item Reports and Charts A user can obtain data and other information such as documents at the layer level (all selected sites for that layer), or by individual site or spatial feature through any of the following options. Click the spatial feature on the map or the icon in the Preview Window. A site information window for the selected site will open. Click the link in the site information window to view reports and charts for the selected site only. Report and chart options appear on the right. Click the “Item Report” link on the Preview Window to view reports and charts for all selected sites for that layer. In addition to reports for the queried selection (through the Query Box), individual sites may be selected for a composite report or chart by clicking the “Add to Selection” link in the site information window. This selection may be removed by clicking “Remove Selection” in the Preview Window. After clicking “View Reports and Charts” from the site information window, or “Item Report” from the Preview Window, the right pane will show the list of data display and report options. Depending upon the layer and portal configuration, the user can choose one of the following for data displays. The selection will be shown in blue highlight: 1. Column (tabular). 2. Chart (time series) 3. Histogram (frequency of occurrence) Running Queries on Item Reports For each data display (Column, Chart, or Histogram), the user selects the desired data report. The availability of different data reports depends upon the data associated with the layers for each individual portal. Some report/ chart links may open additional user filter options, e.g., date range, analyte. Click “Go!” after selecting the report/chart filters. Data and charts meeting the report/ chart filter conditions are displayed for sites or spatial features shown on the map EcoLayers on-line data portal User Manual 12 Querying Column (tabular) Reports Column (tabular) reports may be queried as described below. Define criteria or filter data using drop down boxes Select items from the drop down boxes above the data table. Starting on the left, define the query by using these drop-down selections: i. Column Name ii. Logical operator (=, Like, Contains, <, >, etc.) iii. Value from the data table iv. And/ Or (to define a complex query). If the tabular report has many rows, it may take a few seconds for the logical operator dropdown to appear. Click on Go, look for the running panther, and wait for results to appear. The previous query may be deleted or additional filters added by using the drop-down boxes above the table. Clicking the Download Report link above the table will export the data into Excel as a .csv file. If your browser or PC security settings prevent this from happening, then right- click the mouse button on the Download Report link and select, “Save File As” to manually save the table as a file into your selected folder. EcoLayers on-line data portal User Manual 13 Querying Chart or Histogram Reports For illustrative purposes, the layout of the Chart interface is shown below with four user filters for the Outfall Dry Weather data set: i. Program ii. Date range iii. Analyte For Chart or Histogram iv. Result Export to Google Earth Important: This feature requires Google Earth be installed on your computer. Visit Google's website for more information. The custom map view that you created above may be exported to Google Earth. Click the Google Earth icon in the tool bar above the map. Click the new icon that appears in the tool bar menu next to the Google Earth icon to download the KMZ file or view your custom map directly in Google Earth. This may take several seconds. When the KMZ file is opened in Google Earth, reports and charts for individual sites may be viewed by clicking the individual sites or spatial features. Data for a collection of sites cannot be viewed in Google Earth. You can now add your own layers (in KMZ format), save the file on your local drive or email it to others! EcoLayers on-line data portal User Manual 14 Other Google Map Views Select different map views from the drop down on Google Map. To view in Google Earth, you must first download the plug-in from the Google site. Disclaimers The water quality data is being provided as a public service Accuracy or completeness of any data from this or an affiliated site is neither implied nor guaranteed Appropriateness of use of any features or data from this or affiliated site is neither suggested nor implied If and how the Portal and its data are used will be determined solely by you and you will be solely responsible for the outcomes resulting from the use of the Portal and its data such as any loss or damages, consequential or otherwise, including but not limited to time, money, or goodwill, and you further agree to indemnify, defend, and hold harmless all other parties. Your use of the Portal does not grant you any ownership, rights or interests in the data, software or any other aspect of the Portal Availability and performance of the Portal and its affiliated sites, their service features and their content cannot be guaranteed Any information you provide through the Portal or in connection with its use will be treated as public information and may be made public. Note: If your session is idle for too long, you will get an “Exception” error. Click the “Clear Map” tool bar to refresh the map. Portal Interaction for Administrative User For administrative issues such as data management and approval of publicly submitted sites, log-in at http:// 75.101.159.147 with the User ID and password provided for your portal. Portal administration is a feature available on higher level portals. EcoLayers on-line data portal User Manual 15