1
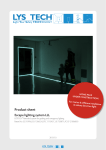
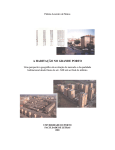
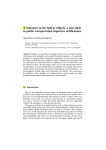
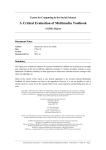
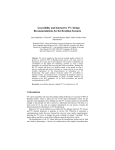
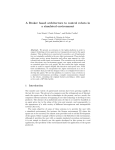
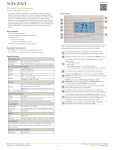
Evaluating the Utility and Usability of an
Adaptive Hypermedia System
Kristina Höök
SICS, Box 1263, 164 28 Kista, Sweden
+46-8-752 15 00, [email protected], http://www.sics.se/~kia/
Abstract
We have evaluated an adaptive hypermedia system, named PUSH, and compared it to a
non-adaptive variant of the same system. The PUSH system either infers users’ information-seeking tasks from their actions at the interface, or the users can set the task
themselves. Based on the information-seeking task, the system chooses what to show
and what to hide in a page using a stretchtext1 technique. The purpose is to avoid information overload.
We studied how successful the subjects were in retrieving the most relevant information, and found that the subjects’ solutions were influenced by the choice made by the
adaptive system. We also studied how much the adaptivity reduced the amount of actions needed, and found that subjects made substantially fewer actions in the adaptive
case. A third measurement was the subjects subjective preferences for the adaptive or
the non-adaptive system, were we found that the subjects clearly preferred the adaptive
system. It seems as if it requires less decisions on behalf of the subject, thereby reducing their cognitive load.
We also discuss the general problem of evaluating adaptive systems.
Keywords: Adaptive hypermedia, empirical evaluation, intelligent interfaces, usability
1 Introduction
Adaptive hypermedia is a new direction of research within the area of user-adaptive systems. The earliest systems dates back to 1990, but most systems have been developed
and described during the last three years (1993-1996). As Peter Brusilovsky (1996)
points out, hypermedia has gained ground during the last few years as a tool for userdriven access to information. In particular, the widespread use of www (which is hypertext based) has set a de facto standard for documentation of various kinds. The simplicity of the hypermedia interaction model is part of why it has been so successful.
From a user perspective, all one has to do is to move between ”pages” of information
by following ”links”. Usually, the pages of information consists of text and/or some
1
Stretchtext is a special kind of hypertext. Instead of moving to a new page of text, an activation of a
hotword in a stretchtext will instead replace the activated hotword (or a phrase with this word), extending
the text of the current page (Brusilovsky 1996).
1
ready-made pictures. Following a link is done by clicking on a hotword 2 or clicking on
a hotspot in the graphics. The result of the action is (usually) that we move to another
page of information.
Unfortunately, hypermedia also has some serious drawbacks. When the information
space grows to be very large, users easily become ”lost in hyperspace” (Conklin 1987).
Another problem is how to design the information space to allow for users with different goals and needs to be able to navigate and retrieve information that is relevant to
them. According to Brusilovsky (1996), it is in these cases, when the system is expected
to be used by people with different goals and knowledge and where the hyperspace is
reasonably big, that it is worthwhile making the hypermedia tool adaptive. An adaptive
hypermedia system can help the user to search for and isolate the information most
relevant to his/her needs, thereby limiting the hyperspace.
Adaptive hypermedia is different from other kinds of adaptive systems in that it marries
the passive hypermedia information model with the means to make systems actively
adapt to the user. The systems implemented so far occupy the middle-ground between
user-controlled and system-controlled information retrieval.
The system we studied here, PUSH, was designed to adaptively help users to find information in an on-line manual (Höök et al. 1996, in press, Höök et al. 1995). The system utilises Netscape and Java on the client side to realise the interface, while on the
server side we have implemented the database and the adaptive system in Prolog
(Espinoza and Höök 1996). The interface in WWW offers some interesting interaction
possibilities not normally available in Netscape: a form of stretchtext, hotlists that associate hotwords with follow-up questions on the hotword, and local maps of the information space that can be used to navigate in the information space. In the study, we also
evaluated these aspects of the interface, even if the main goal was to evaluate the adaptive behaviour of the system.
The adaptive parts of the PUSH system were designed to fulfil two goals:
• to reduce the information overflow problem,
• to aid the user in getting at the most relevant information, given that the user has a
particular information seeking task.
The adaptation made by the system does not affect how the user can navigate between
pages, it only affects how much information is presented within a page.
A problem with adaptive systems in general is that they might make wrong adaptations
based on guesses they make about the user (Kay 1994). It is therefore of crucial importance to allow the user to control the adaptivity and to alter the assumptions made by
the system. We shall explain how PUSH allows the user to correct its faulty assumptions, and how users perceived those possibilities.
Before we turn to our study, in which we compare PUSH to a non-adaptive variant of
the same system, we discuss some of the difficulties of evaluating adaptive systems,
and we also provide an introduction to the PUSH system and the target domain.
2
Hotword is used to denote the word or icon that the user can click on to get to the next page of information (Kobsa et al. 1994).
2
2 Evaluating adaptive systems
Evaluating systems is a difficult task, and it becomes even more difficult when the system is adaptive. It is of crucial importance to be able to distinguish the adaptive features
of the system from the general usability of the designed tool. This is probably why most
studies of adaptive systems are comparison of the system with and without adaptivity
(Meyer, 1994; Boyle and Encarnacion, 1994; Brusilovsky and Pesin, 1995; Kaplan et
al., 1993). The problem with those studies is obvious: the non-adaptive system may not
have been designed ’optimally’ for the task. At least this should be the case since adaptivity should preferably be an inherent and natural part of a system - when removed the
system is not complete. Still, it is very hard to prove that it is actually the adaptivity that
makes the system better unless that condition can be compared with one without adaptivity. The study presented here is no exception to the ”comparative studies” set-up.
Still, as we shall see, the non-adaptive variant of the system we exposed the subjects to
was a good system in itself. It did not overload the users with information, but just kept
everything initially closed, thus forcing the subjects to open those piece of information
that they believed would be relevant to their needs. Also, the non-adaptive system offered all the other features mentioned above: stretchtext, hotlists and maps to the information space.
An alternative view on how to study adaptive system, is put forth by Oppermann,
(1994), who prefers to see them as part of the design cycle. Since adaptivity is a complex machinery, there must be several rounds of studies which aid the designers in getting the adaptivity right. For example, if the adaptive hypermedia system is supposed to
provide different kinds of information to users depending on their knowledge, goal or
needs, it may be necessary to make several studies before the right relevance-criterion
can be set up between the users goal and the preferred information content (or information presentation). Prior to the study described here, we did a couple of ”bootstrapping”
studies with the goal of finding the relevant relations between users’ informationseeking tasks and the information the system should adaptively provide the users
(Espinoza and Höök 1996). The results from these studies fed into our design of the
relevance criterion that our adaptive mechanisms make use of.
Another important issue is what to measure when evaluating the adaptivity. There are
few studies of adaptive systems in general, and even fewer of adaptive hypermedia. In
the studies of adaptive hypermedia by (Boyle and Encarnacion 1994; Brusilovsky and
Pesin 1995; Kaplan et al. 1993) the main evaluation criterion is task completion time.
This should obviously be one important criterion by which some systems should be
evaluated. In our case, though, the goal of the adaptive hypermedia system is to provide
the user with the correct, most relevant, information and make sure that users are not
lost on their way to this information. The time spent in retrieving information is not
relevant, the effectiveness of the search and the quality of the result is.
Boyle and Encarnacion also measured reading comprehension through a diagnostic test
put to the subjects after having used the system. Kaplan et al. measured how many
nodes the users visited - in their case the more nodes the users visited, the better. Finally, Brusilovsky and Pesin measured how many times their students revisited
”concepts” they were attempting to learn.
The evaluation of our PUSH system was designed to address the goals of the system,
namely to reduce information overflow and aid the users in finding the most relevant
information. So we wanted to measure whether the users actually found the most rele-
3
vant information and whether or not they were lost in the information space while
searching. A related measurement is the amount of ”within-page” navigation. A good
adaptation should preferably open up the most relevant information, and the user should
not be forced to open more information in order to be satisfied, i.e. the fewer actions
that affect the contents of the page, the better.
Finally, we were also interested in subject’s own evaluation of how well the adaptive
system worked compared to the non-adaptive one, and whether they felt in control of
the adaptive parts of the system.
A last difficulty in making studies of adaptive systems, is in the procedure of the study.
Most adaptive systems will be really useful when they are part of the users work for a
longer period: only during that longer period can we see how the users needs and goals
varies in a ”natural” way. Obviously, this may not be feasible in a research project
which has to be finished in limited time. Instead, we have to make the subjects solve a
pre-defined set of realistic tasks to which we know that the system will be able to adapt.
3 The PUSH system
The system studied here is named PUSH (Plan- and User Sensitive Help - and is described in Höök et al. 1996, in press; Espinoza and Höök 1996). It is an adaptive hypermedia system that utilises Netscape and Java on the client side to realise the interface, while on the server site we have implemented the database and the adaptive system in SICStus Prolog objects (SICStus).
The hypertext database contains information about a software development method,
SDP, consisting of processes and object types. The method is documented in more than
500 documents consisting of 5 - 20 pages of text and graphs each. In our studies of the
domain and its users (Bladh and Höök 1995), we found that the main problem for users
was in retrieving the right information from this large information space. We know that
users avoid scrolling down a page to see past the first page of information, (Bladh and
Höök 1995, Nielsen 1995), and so it is important to show only the most relevant information. Once the right information was found by the users, they sometimes also experienced difficulties in interpreting the information. Again, this tells us that it is important
to choice the right, most relevant information.
When the user has posed a query to the system they are presented with what we call an
answer page. The answer page consists of both some graphics and also some text under
different headings. The answer page is divided into three frames (frames are subparts of
the Navigator application window that can be scrolled and resized independently of
each other and that each contain a web page or Java applet):
• a textual description of the method consisting of chunks of tests under different
headings. We call these pieces information entities. The information entities can be
stretched: by clicking on the IE heading, the corresponding text under the heading is
either inserted (or collapsed). Hiding information means collapsing the IE, but the
heading will still be available for the user to open as they wish.
• a graphics window consisting of two graphs: one process graph with the current
process in focus, and one object type graph. Surrounding the process in focus, we see
its input and output objects (left and right), its superprocess and its subprocesses (up
and down). This is the local map of the information space. The user can click on the
symbols and thereby navigate to another process or an object type.
4
• a guide to the textual description, consisting of the headings of the information entities. Those marked in bold are currently open in the textual description.
In the textual frame, we also see the hotlists marked in bold. A hotlist can be ”opened”,
which means that we insert a list of follow-up questions that the user can choose from.
In Figure 1, the user has opened the ”object-oriented analysis” hotlist, and we can see
the possible follow-up questions: ”Describe object-oriented analysis” and ”Compare
object-oriented analysis and design”.
Finally, the interface also offers the possibility to pose queries via menus available in
the Java applet window.
The adaptive system follows users’ actions (clicking in graphs, menus, hotlists, and
stretchtext actions) in the background. It tries to detect any pattern in users’ actions,
using plan recognition, that can indicate that they have entered the system with some
specific information-seeking task (Wærn 1994; Wærn 1996; Höök et al. 1996 in press).
The system has a set of such information-seeking tasks, and each task decides which
information entities should be opened and which should be closed. In Figure 2 we see
some examples of rules that connect tasks with information entities.
Textual information
Guide frame
Graphs
Figure 1. The basic interface to PUSH.
5
Learning the structure of SDP →
Basic introduction, Purpose, List of activities, Input objects, Output objects, Relations to other processes, Simple example
Project planning →
Project planning information, What is done in this process, Information model, Simple example
Performing an activity in SDP →
Summary, How to work in this process, Release information, Input objects, Output objects, Relations to other processes, Entry criteria,
Exit criteria, Information model, Advanced example, Frequently asked
questions
Working in a reverse engineering fashion →
Information model, What is done in this process, Release information
Figure 2. Rules for describing the relation between some tasks and information entities
for the question ”describe process”.
There are two ways users can reject the assumption made by the system. One is explicit:
users are informed of which task the system has assumed best describes their intention,
and they can at any time set it to another task using a menu available in the Java applet
window (”Change task”). The other way of rejecting the systems assumption is indirect:
by opening new information entities or closing the information entities chosen by the
system, the user in effect says that the inferred task is wrong. Since the system is continuously adapting, it may in these circumstances change the inferred task as it tries to
follow the user’s intentions.
Thus the adaptivity in PUSH will only affect how much information is presented in a
page, not the navigation between pages.
The non-adaptive variant of the system looks exactly the same. The only difference is
that no information entities are opened, instead everything is closed when the user enters a new page.
4 The study set-up
The study was done in a usability laboratory at Nomos Management AB. Subjects were
videotaped and an image of POP interaction was recorded on the same video tape. The
test team sat behind a one-way mirror but could communicate with the subjects if
needed via microphone. Subjects’ actions were tracked using DRUM3 and statistics of
task completion time, actions performed, inefficient use of the system, etc. could be
easily computed using this tool.
There were 9 subjects in the study, 3 female and 6 male. Each solved a set of five tasks,
where two tasks were designed to test the explanations provided by the system rather
than test the usefulness of the system as such. These two tasks also served as a means to
introduce the system to the users.
Subjects spent approximately two hours in the experiment, of which one hour was spent
solving these five tasks. The rest of the time was used for questions on their back-
3
DRUM: Diagnostic Recorder for Usability Measurement.
6
ground, small diagnostic tests on their understanding of certain concepts in the on-line
manual before and after using our system, and finally some questions about their preferences regarding the adaptive versus the non-adaptive system.
Each of the subjects solved a set of five tasks, were two tasks, no 1 and 4, were designed to test the explanations provided by the system rather than test the usefulness of
the system as such. These two tasks also served as a means to introduce the system to
the subjects. The subjects first solved three tasks either with (or without) adaptivity. We
then switched system, and they solved another two tasks without (or with) adaptivity.
We did not vary the order of the tasks since information could be found while solving
one task which would affect the answer of the next. The tasks were (translated from
Swedish):
1. Find an explanation of the concept ”information element”. Find the hotword in some
description of an object (e.g. ROM) under the heading ”Descriptions of information
elements”. Once you have found the explanation, answer the following questions:
Was the information good and relevant? Did it add anything to your understanding
of the concept? How much sense could you make of the explanation? Was anything
missing from the explanation? Other comments?
2. Where in subD does object-oriented analysis and object-oriented design happen and
what is the difference between the two? Write down the process-name(s) and a keyword or two about the difference.
3. Imagine that your project has completed the FSAD phase and you are now approaching the phase where you are supposed to do object-oriented analysis. Your
project manager has asked you to compile some information to be used as a basis for
deciding how to plan the project from now on. As usual you are under stress and
only want to do what your project requires and no more. Find out what you must do
in subD:iom and write down the headers under which you found relevant information.
4. Find an explanation of what an ”object” is. Go to the object IOM and look under
”Basic introduction” or ”summary”. Choose the hotword ”Object type” and then
choose the hotword ”Object” (in the explanation of ”Object type”). Once you found
the explanation, answer the following questions: Was the information good and relevant? Did it add anything to your understanding of the concept? How much sense
could you make out of the explanation? Was anything missing from the explanation?
Other comments?
5. Imagine that your project has completed the FSAD phase and you are now approaching the phase where you are supposed to do object-oriented modelling. Your
project manager has asked you to compile some information to be used as a basis for
deciding how to plan the project from now. As usual you are under stress and do
only want to do what your project requires and no more. Find out what you must do
in subD:rom and write down the headers under which you found relevant information.
Tasks 3 and 5 are similar, but concern different processes in SDP. This to enable comparison between subject performance with and without adaptivity for a particular task.
Task 2 is a search for one particular piece of information, while tasks 3 and 5 are solved
through picking out a set of IE’s that put together will provide the reader with an understanding of the two processes.
7
Usually, the system adapted correctly to what the subjects were up to, which meant that
it adapted the explanation for task 1, 2 and 4 to be Learning details about SDP,
tasks 3 and 5 triggered the task Planning a SDP project. If the system inferred that
the subject was planning a project, it would open five IE’s (Project planning information, List of activities, Release information, Entry criteria and
Exit criteria).
5 Results
Our results are divided into those concerning:
• the navigation within and between pages, where we found that the adaptive system
reduced the number of within-page actions
• the quality of the answers and their relation to whether the subjects saw what the
adaptive system had chosen, where we found that the adaptive system influenced
subjects choice of information entities to be included in the solution
• the subjects satisfaction with the system, where we see that the subjects prefer the
adaptive system over the non-adaptive variant
• some remarks concerning task completion time, where we can see a weak tendency
that the adaptive system will, in the long run, reduce search time
5.1 Navigation
PUSH adaptivity is supposed to affect the problem of information overflow within a
page. By choosing to open only that information which is most relevant, the users
should not be overwhelmed by the amount of information in the page. In Table 1, we
see that the total number of times that the subject had to open or close an information
entity (within-page actions) is substantially less (half) in the adaptive case as compared
to the non-adaptive version. As the non-adaptive system requires that subjects themselves open or close the information entity, this may not seem to be a particularly
strange result. But if the adaptive system had not adapted in an effective way, we would
have seen even more opening and closing of information entities as the subjects tried to
correct the systems choice.
8
Number of actions in total
140
121
120
102
100
80
85
Adaptive
Non-adaptive
66
60
40
20
0
Within
page
Between
pages
Table 1. The number of open/close information entity actions (within page) and navigational actions (between pages) in the adaptive versus the non-adaptive conditions.
In Table 1, we also see that the number of navigational actions between pages (clicking
on graphs, making menu-choices, and clicking on hotwords) that subjects take is not
much different in the adaptive and the non-adaptive cases. This confirms the result that
PUSH affects the within-page actions, but not the navigation between pages.
5.2 Quality of answers
3,00
2,50
2,00
Graphics
Hotwords
Menues
1,50
1,00
0,50
Total
Task 5
Task 4
Task 3
Task 2
0,00
Task 1
Mean number of times used
We attempted to use realistic tasks in our test, collected in previous studies of users and
their information needs (Bladh and Höök, 1995). For real information-seeking tasks in
this domain there are no definite right or wrong answers. When collecting information
that helps the project manager, as in tasks 3 and 5 in our study, the users will make different choices. This was reflected in their choices of which information entities they
decided to pick out as good answers to these two tasks. In Figure 3 we see that not only
does the choice of information entities vary over subjects, but almost all subjects make
different choices for tasks 3 and 5 despite the fact that these are in effect identical. In
Table 2. The choice of navigational tools for the five different tasks, and in total.
9
Group
1
Group
2
Subjects
1
2
3
4
5
6
Tasks 2 and 5
A N A N A N A N N A N A
Project planning
1 1 1
1 1 1 1 1
What is done
1 1
1 1
How to work
1
1
1
List of activities
1
1 1
1
1
Release
1
Summary
1 1
1 1
1
Basic introduction
1 1
1
Entry criteria
Exit criteria
FAQ
1
Activity descriptions
1 1
Super/related processes
1
7
8
N A N
1 1 1
1 1
1
1
1 1
1
Sys.
9
A N A
1 1 1
1
1
1
1
1
1
1
1 1
1
1
1
1
Figure 3. Choice of information entities in tasks 2 and 5. A = adaptive, N = nonadaptive. Group 1 first used the adaptive system, while group 2 started with the nonadaptive system.
the last column we see the system’s choice of information entities (if the system has
assumed that the user is planning a project).
In order to see whether the adaptive system was influencing users’ choice of information entities, we studied the relation between how the system had adapted and users’
choice of information entities4. We found that in the adaptive case, users chose an information entity that was opened by the system to be included in their solution in 70%
of the cases. (Out of the 27 information entities opened by the system, subjects choose
19).
The subjects did not often open new information entities to check whether they could
potentially be relevant. In total, our nine subjects only opened another twelve information entities that the system had not opened in the adaptive case, and of those twelve,
they chose to include seven in their answers.
In the non-adaptive case our subjects were, of course, forced to open up many more
information entities (since everything was closed initially). In total our nine subjects
opened up in total 39 information entities out of which they choose 27 to be part of their
answers.
We draw the conclusion that our subjects had limits on how many information entities
they could open up, study, and decide whether to reject or include in their answer. Also,
we can see that the choice of information entities made by the adaptive system did influence what subjects believed to be a relevant and good answer. Assuming that the
adaptive system makes a good choice of information entities based on the inferred task,
this kind of system would help the user find the most relevant information, and also
draw the user’s attention to information entities that they otherwise might not have discovered.
4
As the adaptive system sometimes did not adapt correctly, we base our calculations on how the system
had adapted in each case.
10
4,1
No, I repeatedly
had to change the
answers I got in
order to find the
right information.
7
7
1
4
010
010
2
11
7
No, I never
saw that the
system
changed.
322
232
0
7
Did the adaptive
system make good
adaptations to your
needs?
0 0 11
1
Did you see when
4,6
the adaptations happened in the adaptive
system?
No, they were
very similar.
1
Was the difference
5,3
between the adaptive
and the non-adaptive
system obvious?
3 3
0
01 1 1
4
The nonadaptive was
definitely better.
4
5,0
4
Did you prefer the
adaptive or the nonadaptive system?
Table
4
Mean
1
Query
The adaptive was
definitely
better.
Yes, it was
obvious that
they were
different.
Yes, it was obvious
when the system
changed task and
opened new information.
Yes, it managed to get
relevant information.
Table 3. Subjects evaluation of the adaptive versus the non-adaptive system.
5.3 User satisfaction
After the subjects had used the two variants of the PUSH system, we asked them to
provide their viewpoints on various aspects of the system. We did this through eleven
questions, and they were also asked to freely comment on various aspects of the system.
For the eleven questions the subjects put a cross on a scale grading from 1 to 7 - the
interpretation of the scales can be seen from the statements to the left and right of the
graphs in Table 3 and Table 4.
In Table 3 we see the result of the queries on how the users perceived the adaptive system. As we can see, the users preferred the adaptive system (mean 5.0), the difference
between the two systems was obvious (mean 5.3), and they felt that the system made
good adaptations to their needs (mean 4.1). Also, they claim that they saw when the
system changed the inferred task (mean 4.6). In Meyer’s study, (1994), of an adaptive
system her subjects claimed not to have seen that the system adapted. In our case, we
told the users that the system would adapt and what would happen when it did. If we
had not told them they might not have seen it.
It should be observed that we used beta-releases of Netscape and Java when we did the
study (in February 1996). Also our adaptive system was an early prototype version.
This meant that the system sometimes crashed and that there were several bugs in the
interface. This of course affected our subjects’ evaluation of the system, but despite this
they were in favour of the system and, in particular, they preferred the adaptive system.
The users also seemed to like the interface (Table 4). What we can see, and what was
also commented upon in the free form queries, is that the local map we provided was
not sufficient to help users keep track of where they are in the information space. As
they could not make use of the BACK-function in Netscape (for technical reasons) and
11
Table
5,1
Did you like the
combination of
graphs and texts?
5,4
1
1
000
1
2 32
0
1
00111
0
5
2
11
000
3
4
0010
1
7
No, there are
too many
details and it is
confusing.
0
6
1
No, it is difficult to find the
right icon and
use it.
2
1
No, in the
beginning it
was very
difficult.
7
Are the different
icons easy to understand and use?
5
2
011
Yes, I really
liked using it.
7
5,3
1
Yes, I can make
the program do
what I want.
7
Did you find it easy
to get started?
I got lost
several times
and did not
know where I
was.
3
0010
I knew all
along exactly
where I was.
7
4,4
4
7
Did you easily get
lost in the information space?
No, it feels as
if the program
controls me.
Good, the work
would be very
efficient
Yes, it is possible to get
started right
away.
Yes, they are
easily understood.
7
5,0
4
Do you feel in control while using
POP?
0
4
No, it is very
demanding
and unpleasant
to use.
000
4
5,3
2
4
Did you like using
POP?
5
2
4
Badly, the
program gets
in the way
1
How efficiently
5,0
would you be able to
work with POP?
4
Mean
4
Query
Yes, the interface is very
appealing.
Table 4. Subjects evaluation of the interface to POP.
there was no history of pages, they could not move back and forth in order to make
clear to themselves where they were.
The decision to include a map in the interface was partly based on a study of the relation between spatial ability and ability to navigate in a hypermedia structure (Höök,
Sjölinder and Dahlbäck, 1996; Dahlbäck et al. 1996). Users with low spatial ability get
lost in large hypermedia structures, and may be (partly) helped by visual cues to where
in the information space they are. Exactly how to design these visual cues is not clear
yet, and it seems as though a too local map was not sufficient.
From the comments on the system we also drew the conclusions that:
• We should make the graphics and the text more integrated. In the previous version of
the system (tested in December 1995), the graphs were placed in the Netscape window (at the top). The users then made more extensive use of the graphs and seemed
12
to regard the graphs as part of the solution to a larger extent than they did in this
study.
• We should either allow for a dialogue history or a global map of the information
space with a visual trace of where the users have been previously. This is unfortunately not trivial as the system keeps adapting and it is not obvious what ”going
back” would mean: should we make the system take on the previously inferred task
that was relevant when we visited the previous node, or should we just add this action to the history that the adaptive mechanism uses to infer the user’s task? If we
choose the latter, it might well be that going back to a previous page will be quite
confusing as the system now may have inferred another task and therefore will open
other information entities. The page will therefore, potentially, look very different.
• The scrolling is of crucial importance when the pages grow to be as large as they are
in this system. Nielsen (1995) claims that users will only read the first page of information and seldom scroll. We can verify this result from other studies we have
made (Bladh and Höök 1995). Our scrolling function was, at the time of the study,
unstable and did not work as intended. This interfered with users’ understanding of
the system, and ability to retrieve information.
• The adaptive system only adapted the presentation when the user moved from one
page to the next. In this study we saw that adapting within the page directly after
each action by the user would better follow the user’s change of intentions.
5.4 Time Spent
As stated above, we were not interested in whether the adaptive system would make it
possible to spend less time retrieving information. In the long run, this would be desirable, but for a short experiment like this, the users spend quite some time just on learning the systems, so the effects would not appear until after some time of usage. This
potential can be seen in Table 5 where we see that they first spend more time when the
system is adaptive, but as they come to task 4 and 5, they spend less time with the
adaptive system as compared to the non-adaptive.
Also, we did not expect our version of the non-adaptive system to require much more
time than the adaptive version since all the headers were closed and they did not have to
Time spent solving the tasks
16.48
14.24
Time
12.00
09.36
Adaptive
Non-adaptive
07.12
04.48
02.24
Table 5. Time spent solving the different tasks.
13
Task 5
Task 4
Task 3
Task 2
Task 1
Mean
00.00
navigate back and forth in a large information space. In fact, the non-adaptive version
of the system also aids in reducing the user’s cognitive load as it keeps all the information entities closed. If we had used a fully expanded page to be the behaviour of the
non-adaptive tool, users would have had to navigate within the page to a larger extent
than what was needed now. This would have meant spending more time on each page in
order to find the relevant information. A fully expanded page might be on the order of
20 A4 pages long, and therefore quite hard to get an overview of.
6 Discussion
Evaluating adaptive systems is often done through comparing a non-adaptive version of
the system to an adaptive system. Our last study is no exception to this approach. Still,
an adaptive system should preferably be designed in such a way that the adaptivity is
only one instrument in the repertoire of design techniques that together form the tool
that in its entirety meets users’ needs and individual differences.
Our interface contains several different parts that are each designed to meet certain
needs: the graphs should support navigation in the hyperspace, the hotlists should make
it possible for users with little knowledge of the domain to ask follow-up questions on
unknown concepts, and the adaptivity should help prevent users from being overloaded
with information within the page, etc. From our study, we can see that we have met
some of these goals, in particular, the adaptive system was preferred by the subjects, it
required fewer actions within the page, and the choices made by our adaptive system
influenced subjects’ choice of information entities to include in the solution.
What is potentially lacking from our design is additional help on how to navigate between pages. As we have included quite a lot of information in each page, we have
made the information space smaller than it would have been if each page had been divided into several smaller pages. So our adaptivity is, in fact, helping to make the information space smaller and thereby easier to navigate in. Still, a global map or a dialogue history, or potentially even an adaptive solution that affects the navigation between pages might have improved the situation.
What is needed next, not only for our system, but for intelligent interfaces in general, is
to prove that they are also useful in a longer time perspective. This can only be shown
through studying users in real working conditions under longer periods of time.
7 Acknowledgement
We would like to thank the 9 anonymous subjects from Ericsson who took part in our
study. Involved in helping with the study were also Klas Karlgren and Fredrik Espinoza. We would also like to thank Nomos Management AB, in particular Richard
Whitehand and Robbin Battison, who lent us their usability laboratory and commented
on this manuscript. The co-operation was organised through CID, the Centre for IT Design.
The work was funded by NUTEK as a part of the PUSH project.
14
8 References
Bladh, Malin and Höök, Kristina (1995). Satisfying User Needs Through a Combination of Interface Design Techniques, In: K. Nordby, P.H. Helmersen, D.J. Gilmore and
S.A. Arnesen (eds.), Human-Computer Interaction INTERACT’95, Chapman & Hall,
Oxford.
Boyle, Craig and Encarnacion, Antonio O. (1994). MetaDoc: An Adaptive Hypertext
Reading System, User Models and User Adapted Interaction, (UMUAI) 4, pp. 1 - 19.
Brusilovsky, Peter (1996). Methods and Techniques of Adaptive Hypermedia, Journal
of User Modeling and User-Adapted Interaction, special issue on Adaptive Hypermedia, UMUAI 6, in press.
Brusilovsky, P. and Pesin, L. (1994). ISIS-Tutor: An adaptive hypertext learning environment In H. Ueono & V. Stefanuk (eds.), Proceedings of JCKBSE’94, Japanese-CIS
Symposium on knowledge-based software engineering, Tokyo: EIC.
Conklin, J. (1987). Hypertext: An Introduction and Survey, IEEE Computer, 20:17-41.
Dahlbäck, Nils, Höök, Kristina and Sjölinder, Marie (1996). Spatial Cognition in the
Mind and in the World: The case of hypermedia navigation, The Eighteenth Annual
Meeting of the Cognitive Science Society, CogSci’96, University of California, San
Diego, July.
Espinoza, Fredrik and Höök, Kristina (1996). A WWW Interface to an Adaptive Hypermedia System, Conference on Practical Application of Agent Methodology
(PAAM’96), London, April.
Höök, Kristina, Karlgren, Jussi and Wærn, Annika (1995). A Glass Box Approach to
Intelligent Help, IMMI-1 (First workshop on Intelligent Multi-Modal Interaction), Edinburgh, U.K.
Höök, Kristina, Karlgren, Jussi, Wærn, Annika, Dahlbäck, Nils, Jansson, Carl-Gustaf,
Karlgren, Klas, and Lemaire, Benoit (1996). A Glass Box Approach to Adaptive Hypermedia, Journal of User Modeling and User-Adapted Interaction, special issue on
Adaptive Hypermedia, in press.
Höök, Kristina, Sjölinder, Marie and Dahlbäck, Nils (1996). Individual differences and
navigation in hypermedia, European Conference on Cognitive Ergonomics, ECCE-8,
Grenada, Spain, September.
Kay, Judy (1994). Lies, damned lies, and stereotypes: pragmatic approximations of users, In A. Kobsa and D. Litman (eds.), Proceedings of the 4th International Conference
on User Modeling, pp. 73 - 78, Hyannis, Massachusetts, Mitre Corp.
Kaplan, Craig, Fenwick, Justine, and Chen, James (1993). Adaptive Hypertext Navigation Based On User Goals and Context, User Modeling and User-Adapted Interaction
3, pages 193-220.
Kobsa, A., Müller, D. & Nill, A. (1994). KN-AHS: An Adaptive Hypertext Client of
the User Modeling System BGP-MS, Fourth Int. Conference on UM Hyannis, MA,
1994.
Meyer, Beth (1994). Adaptive Performance Support: User Acceptance of a SelfAdapting System, Fourth International Conference on UM Hyannis, MA.
Nielsen, Jacob (1995). Interface Design for Sun's WWW Site, invited talk at the
INTERACT’95 conference in Lillehammer.
15
Oppermann, Reinhard (1994). Adaptively supported adaptability, International Journal
of Human-Computer Studies 40:455-472.
SICStus Prolog User's Manual (Release #3). Swedish Institute of Computer Science,
Box 1263, S-164 28 Kista, Sweden, ISBN 91-630-3648-7.
Wærn, Annika (1994). Cooperative Enrichment and Reactive Plan Inference - applying
plan inference outside Natural Language Dialog, SIG meeting at Fourth Int. Conference on UM, Hyannis, 1994.
Wærn, Annika (1996). Recognising Human Plans: Issues for Plan Recognition in Human-Computer Interaction, Ph.D. Thesis, ISBN 91-7153-456-3, SICS Dissertation Series 20, Stockholm, Sweden.
16