1
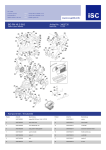
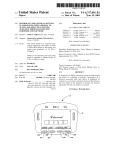
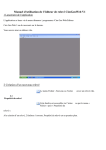
Science Engineering & Education Co. “Helping you SEE the data” DRAFT Feb. 26, 2009 SEE Co Model MS4 Mössbauer Spectroscopy System User Manual The SEE Co Model MS4 is a highly integrated, efficient and convenient system for the acquisition and analysis of Mössbauer Spectra. This manual contains a brief introduction to Mössbauer Spectroscopy and describes the design and use of the MS4 hardware and software. INTRODUCTION Mössbauer Spectroscopy is Resonant Gamma-ray Spectroscopy (RGS) All nuclei possess excited states, some of which are accessible from the ground state by photon absorption. Often the excited states of the absorber are long-lived and the range of photon energies which will resonantly excite the absorption is extremely narrow. If strong absorption is to be observed, a significant fraction of the energy of the source radiation must be within this range. Such a source may obviously consist of excited nuclei of the same isotope as the absorber. The excited nuclei may be decay products of appropriate parent nuclei. It was once thought that conservation of momentum requires the recoil of the emitting nucleus and that the photon would not have the full transition energy and hence would not resonantly excite the absorber. If the nucleus is free, the recoil momentum and energy are taken by the nucleus itself. In a solid the momentum and energy go into lattice vibrations, i.e., phonons. The temperature dependence of the absorption cross-section of Ir191 led Mössbauer (1958) to be the first to realize that a photon could be emitted with the entire solid recoiling as one rigid mass. The energy lost to the recoil in this situation is negligible and the emitted photon may resonantly excite the absorber. Resonant Gamma-ray Spectroscopy is commonly called Mössbauer Spectroscopy in honor of its discoverer, Prof. Rudolph Mössbauer. See http://nobelprize.org/nobel_prizes/physics/laureates/1961/mossbauer-bio.html. Nuclear Physics of Fe57 The isotope with the strongest recoilless resonant absorption is Fe57. Since the vast majority of the work reported in the Mössbauer literature is for iron, this discussion is limited to that isotope. Figure 1 shows the decay of Fe57 from its parent Co57. Of all the excited Fe57 nuclei, about 10% will emit a 14.4 keV gamma ray via a magnetic dipole transition from the metastable I = 3/2 state to the I = 1/2 ground state (I is the nuclear spin). The ratio of recoil-free 14.4 keV photons to all the 14.4 keV photons emitted is f, the recoil-free fraction of the source. f varies with the properties of the solid and decreases monotonically with increasing temperature. The line width of the emitted radiation is limited in theory by t, the mean life of the I = 3/2 state. In Fe57, t = 0.14 micro sec, and the energy distribution is given by a Lorentzian with a full width at half maximum of Γnat = 4.7 x 10⁻⁹ eV (Lang, 1970). The intensity per unit energy of the Mössbauer radiation is many orders of magnitude greater than the background radiation, and we shall henceforth refer to the gamma beam as if it were 100% Mössbauer radiation unless we specifically note otherwise. We shall also assume that the nuclear levels of the source are not split, and the energy distribution of the beam is given by a single Lorentzian. SEE CO 7385 Bush Lake Rd. Edina, MN 55439 USA Tel. 952-831-0409 FAX 612-395-5558 e-mail: [email protected] SEE Co MS4 Mössbauer Spectroscopy System Manual Co 27 Page 2 57 837 keV, I = 7/2, ( = 270 days) e- e (Electron Capture) Fe 26 57 136 keV, I = 5/2 M2 1 11% 85% 14.4 keV, I = 3/2 ( = 1.4 x 10⁻⁷ sec) M1 =9 8.4% 0, I = 1/2 Figure 1. Decay scheme of Fe57 from its parent Co57. The red oval specifies the transition that generates the 14.4 keV Gammas that are counted for the Mössbauer experiment. 8.4% of Co57 decays cause a 14.4 keV Gamma to be emitted. Of those, a fraction f are recoil-free. Modulation of the Gamma-ray energy via the Doppler Shift To use our Mössbauer source as a spectroscopic tool we must be able to vary its energy over a significant range. This is accomplished by Doppler shifting the energy of the gamma beam. Moving the source at a velocity of 1 mm/sec toward the sample will increase the energy of the photons by 14.4 keV (v/c) = 4.8 x 10⁻⁸ eV or ten natural line widths. The "mm/sec" is a convenient Mössbauer unit and is equal to 4.8 x 10⁻⁸ eV for Fe57. A Mössbauer spectrometer consists of a source which may be moved relative to the sample and a counter to monitor the intensity of the beam after it has passed through the sample. The Mössbauer spectrum is a plot of the counting rate against the source velocity, i.e., the beam energy. If the sample nuclear levels are not split and the I = 3/2 to I = 1/2 transition energy equals that of the source, then the effective cross-section for absorption is a function of gamma energy as given by Fraunfelder (1963) eff = 2 I*+ 1 2 2 I + 1 2 f' 2(1+) nat (eq 1) (E-E)2+ nat where I = 1/2 and I* = 3/2 are the ground and excited nuclear spins, α = 9.0 is the internal conversion coefficient (ratio of betas to gammas in the 14.4 keV decay), λ = 8.61 x 10⁻⁹ cm is the wavelength of the radiation, (E-Eϒγ) is the difference between mean incident and resonant gamma energy, Γnat is the energy width of the excited nucleus, and f ' is the probability of recoilless absorption. The spectrum will be a single Lorentzian centered at v = 0 with a linewidth (FWHM) of 2Γnat = 0.19 mm/sec. The line width is 2Γnat since the observed line arises from the convolution of the source energy distribution and absorber cross section. SEE Co MS4 Mössbauer Spectroscopy System Manual Page 3 MECHANICAL SETUP Figure 2 shows the relationship of the primary components of the MS4 hardware. Those components are: 1. 2. 3. 4. 5. 6. Gamma source manufactured by Ritverc GmbH. SEE Co VT400 Linear Velocity Transducer SEE Co W302 Resonant Gamma-ray Spectrometer SEE Co W202 Gamma-ray Spectrometer Kr Gas Proportional Counter made by LND, Inc. MS Windows PC with USB interface The MS4 software installed on the PC includes the W202 control program, the W302 control program and the WMOSS Mossbauer spectral analysis software. Also, the MS4 includes a group license for the WMOSS software allowing WMOSS to be installed on other PC’s within the customer’s local work group. Figure 2. Schematic Diagram of the MS4 Spectroscopy System Select an area sufficiently stable and without vibrations! Vibrations will superimpose on the linear motion of the motor and will change the Doppler shift of the photons which will distort the Mössbauer spectrum. SEE Co MS4 Mössbauer Spectroscopy System Manual Page 4 Figure 3. MS4 Room Temperature Version The MS4 Support Frame comes pre-assembled. Source shield and counter shield are included. W302 RGS unit shown behind the VT400 velocity transducer. Figure 4. MS4 Low Temperature Version The MS4 Cryogenic Support Frame comes pre-assembled and provides for positioning the velocity transducer and gamma detector around the tail of a cryostat. Source shield and counter shield are included. W202 unit shown connected to Kr gas counter. SEE Co MS4 Mössbauer Spectroscopy System Manual Page 5 W202 Setup and Operation SEECo’s Model W202 Gamma-ray Spectrometer provides both pulse-height analysis and dual single-channel analysis. The user interface is connected via a USB link to a Windows PC. The W202 SCA TTL pulse output may be routed to the input of a separate Multi Channel Scalar, e.g. a SEE Co W302. In the following it is assumed that the W202 is part of a Mössbauer spectrometer with a Kr-gas proportional counter. Other applications of the W202 are possible. Figure 5. Front and Rear views of the SEE Co W202 Gamma-ray Spectrometer. Dimensions are 5 cm x 10 cm x 12 cm. (SEE Co. was formerly named WEB Research Co. New W202 units display the SEE Co name.) Fig 3. Figure 6. W202 Block Diagram and External Connections Connect cables as shown in Figure 6 and then plug in 120 VAC outlet or battery-backed UPS. The W202 has no on/off switch. If a computer was purchased with the W202, user interface software will be already installed. If not, see the W202 PC software documentation for installation instructions. Start the program by double clicking on the W202 icon on your desktop. A dialog box as shown in Figure 7 will appear. The drop down list will show all W202 units connected to the PC. Select the unit you require and then click OK. SEE Co MS4 Mössbauer Spectroscopy System Manual Page 6 Figure 7. Initial “Select Device” dialog box. Clicking the down arrow will display a list of all W202 units connected to the PC. After the Select Device form closes, the Main Form of the W202 PC software will appear as shown in Fig. 8. The central area is used to plot the pulse height spectrum. On the right is a vertical bar graph that indicates the DC voltage applied to the detector in Volts. The voltage is controlled by clicking on the arrows below the vertical bar graph. After changing the voltage it takes 10 to 20 seconds to stabilize the voltage at the detector before which an accurate pulse height spectrum will not be generated. Use the Clear button to remove any data collected during the time of unstable voltage. Figure 8 W202 Main Form Clicking TEST causes internally generated pulses of two fixed heights to be routed to the peak detector input. This verifies the proper working of the W202 independent of the detector. The positions of the test pulses on the PHA plot are independent of the high voltage setting. Click on “Gas Counter” to activate the input from the detector. If the W202 is connected to a Kr gas counter (detector), use the arrow buttons in the lower right corner to set the voltage to approximately 1750 Volts. Again, after the HV has been changed, it can take as long as 20 s for the voltage at the detector to stabilize. Once the HV is stable and if you have a Co-57 gamma-source shining on the detector window, you will see the pulse height spectrum growing in amplitude as shown in Fig. 9. The actual HV required depends of the particular detector and the gain and filter settings in the W202. Normally, for a Kr gas counter with 1 atmosphere Kr/CO2 gas pressure and a 0.002 inch diameter center wire, the HV will be in the range of 1,500 V to 2,000 V. SEE Co MS4 Mössbauer Spectroscopy System Manual Page 7 Figure 9. The pulse height spectrum of a 25 mCi Co-57 Mössbauer source with a Rh matrix. The source to detector distance was 8 cm. A Pb shield with a 1.2 cm diameter aperture was in front of the Kr gas counter. Acquisition time was approximately 10 s. From left to right, the peaks are: the 2 keV Escape peak due to the 14.4 keV γ-rays, the 6 keV Fe X-rays, the 14.4 keV γrays and the 22 keV Rh X-rays. For Fe-57 Mössbauer spectroscopy the 14 keV Gamma peak and the 2 keV Escape peak need to be counted. The 6 keV X-rays are unwanted. At higher count rates they can generate pulses in the detector that overlap in time with the pulses due to the gammas which reduces the gamma counting efficiency. Often nonresonant absorption by the sample in a transmission mode experiment will reduce the 6 keV rate so that the X-rays are not a problem. If not, then a high pass filter can be placed in the beam to absorb the 6 keV X-rays before they enter the detector. Figure 10 shows the effect as placing a 1 mm thick paper filter in front of the detector window. Figure 10. Same experiment as Fig. 5 but with 1mm paper filters in beam. The 6 keV Fe X-ray peak is suppressed relative to the 14 keV Gamma peak and the 2 keV Escape peak. Also, the Escape peak at 10 keV due to the 22 keV Rh X-rays is now partially resolved. SEE Co MS4 Mössbauer Spectroscopy System Manual Page 8 Once the beam geometry is defined, we set the Single Channel Analyzers (SCA) windows. Two independent SCA’s windows exist in the W202 hardware. The two SCA’s are provided to optimize the system for counting the 14 keV Gammas detected by a Kr gas counter. Approximately 1/3 to 1/2 of the 14 keV gammas absorbed in a Kr gas counter generate a 12 keV Kr X-ray that leaves (“escapes”) the counter without interacting with the gas. For those escape events only a net energy of 2 keV is deposited in the detector by the 14 keV Gamma. Hence the peak at 2 keV is observed in the PHA spectrum. Figure 11. Setting the window for SCA #1. Set the window of SCA #1 by clicking on “Set Window 1”. A vertical line appears on the PHA plot and a set of 4 Arrow buttons and one OK button appear to the right of the Get Data check box. Use the Arrow Buttons to move the cursor on the plot to the left edge of the peak to be counted. Then click OK. This defines the voltage level for the Lower Level Detector for SCA #1. Click the Arrow Buttons again to define the width of the window. When the right edge of the window is at the right edge of the peak, click OK. Set the window for SCA #2 by clicking the “Set Window 2” command button and following the same procedure as for SCA #1. See Fig. 12. Figure 12. Setting the window for SCA #2 After setting both windows, click Send Windows to transfer the window settings to the dual SCA’s in the W202. This action clears the windows from the screen and sends the window information from the PC to the W202 hardware. The “Counts Out” signal will now be a stream of TTL pulses generated by detector events that have a peak voltage height that falls within Window 1 or Window 2. These counts are routed to the W302 Resonant Gamma-ray Spectrometer “Counts-1 In” or “Counts-2 In” when collecting a Mössbauer spectrum. Close the W202 PC program. The W202 will continue to generate the dual SCA output pulses until its power is removed or its settings changed via the W202 PC program. The W202 PC program is only used to set the dual SCA windows and does not need to be running to collect a Mössbauer spectrum. SEE Co MS4 Mössbauer Spectroscopy System Manual Page 9 W302 Setup and Operation Figures 13 and 14 show the front and rear views of the W302 Resonant Gamma-ray Spectrometer. Figure 15 depicits the internal organization of the W302 and its external connections. Figure 13. Front view of the SEE Co. Model W302 Resonant Gamma-ray Spectrometer. Case dimensions are 190 mm x 250 mm x 90 mm. Figure 14. Rear view of the SEE Co. Model W302 Resonant Gamma-ray Spectrometer. The primary internal components are: 1. C8051f120 8-bit MCU with 12 bit ADC and 12 bit DAC 2. 64 kByte dual port RAM 3. C8051f320 with USB interface W302 Resonant Gamma-Ray Spectrometer 4. Variable gain Velocity Sensor amplifier 5. Variable gain and variable 16k x 32-bit C8052f120 bandwidth Drive amplifier Dual-port RAM C8051f320 8-bit MCU 8-bit MCU VT400 Amp Drive Signal Vref 12-bit DAC USB Vmonitor 12-bit ADC Velocity Sensor Signal 25 MHz Clock Source 16 16 Sample MCS Address SCA Output Kr Gas Counter 32-bit Counter W202 USB PC MCS Data (Mössbauer Spectrum) SEE Co MS4 Mössbauer Spectroscopy System Manual Page 10 References Belozerski, G. N. (1993) Mössbauer Studies of Surface Layers, Studies in Physical and Theoretical Chemistry 81, Elsevier, Amsterdam. Cranshaw, T. E., Dale, B. W., Longworth, C. O. and Johnson, C. E. (1985) Mössbauer Spectroscopy and its Applications, Cambridge Univ. Press. Debrunner, P. G. (1993) "Mössbauer Spectroscopy of Iron Proteins" in Biological Magnetic Resonance, 13, eds. Berliner, L. J. and Reuben, J., Plenum, New York, 59-101. Edwards, P. R. , Johnson, C.E and Williams, R. J. P. (1967) "Mössbauer Spectra of Some Tetrahedral Iron(II) Compounds", J. Chem. Phys. 47, 2074-2082. Fee, J.A., Findling, K.L., Tatsuro,Y., Hille, R., Tarr, G.E., Hearshen, D.O. Dunham, W.R., Day, E.P., Kent, T.A. and Münck, E. (1984) "Purification and Characterization of the Rieske Iron-Sulfur Protein from Thermus thermophilus", J. Biol. Chem. 259, 124-133. Fraunfelder, H. (1963) The Mössbauer Effect, W. A. Benjamin, New York. Greenwood, N. N. and Gibb, T. C. (1971) Mössbauer Spectroscopy, Chapman and Hall, London. Huynh, B. H. and Kent, T. A. (1984) in Advances in Inorganic Biochemistry, eds. Eichhorn, G. L. and Luigi, G. M., Elsevier, New York, 163-223. Ingalls, R. (1964) "Electric Field Gradient Tensor in Ferrous Compounds", Phys. Rev. 133, 3A, A787-A795. Lang, G., (1970) "Mössbauer Spectroscopy of Haem Proteins", Quart. Rev. Biophysics 3, I 1-60. Lang, G. and Marshall, W. (1966) "Mössbauer Effect in Some Hemoglobin Compounds", Proc. Phys. Soc. 87, 3-34. Mössbauer, R. (1958) "Kernresonzflureszenz von Gammastrahlung in Ir191", Z. Physik 151, 124-143 Preston, R. S. , Hanna, S. S. and Heberle, J. (1962) "Mössbauer Effect in Metallic Iron*", Phys. Rev. 128, 2207-2218. Press, W. H., Flannery, B. P., Teukolsky, S. A. and Vetterling, W. T. (1986) Numerical Recipes, Cambridge University Press, Cambridge. Rancourt, D. G. and Ping, J. Y. (1991) “Voigt-based methods for arbitrary-shape static hyperfine parameter distributions in Mössbauer spectroscopy”, Nucl. Instr. Meth., B58 85-97. Thosar, B. V. and Iyengar, P. K., Eds. (1982) Advances in Mössbauer Spectroscopy, Elsevier, New York. Varret, F. (1976) "Crystal-Field Effects on High-Spin Ferrous Ion", J. de Phsyique, Collogue CG, Supplement 12, Tome 37, 437-456. Whittaker, J. W., Lipscomb, J.D., Kent, T.A. and Münck, E. (1984) "Brevibacterium fuscum Protocatechuate 3,4Dioxygenase Purification, Crystallization and Characterization", J, Biol. Chem. 259, 4466-4475