1
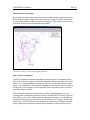
TRGRAPH
Transportation Network-Oriented
Interactive Graphics Workspace
User Documentation
© Copyright 2003 ALK Technologies, Inc. All rights reserved.
TRGRAPH User Manual
Table of Contents
Table of Contents
The TRGRAPH workspace..............................................................................................1
Introduction to TRGRAPH ..................................................................................2
What is TRGRAPH .................................................................................2
What TRGRAPH does.............................................................................2
User Requirements...................................................................................2
Initial Setup ..............................................................................................3
Special APL Keys ....................................................................................3
Loading TRGRAPH.............................................................................................5
APL System Commands ..........................................................................6
Exiting TRGRAPH ..................................................................................6
Mapmaker ........................................................................................................................7
Introduction to MapMaker ...................................................................................8
The screen definition menu..................................................................................11
Map edit menus....................................................................................................12
General features of map edit menus.........................................................12
Introduction to the MAPSETUP options menu .......................................15
BAR - bar charts ......................................................................................17
PIE - pie charts.........................................................................................25
Network mapping: NET and CARRIER panes........................................28
ROUTE - route maps ...............................................................................38
Traffic density charts................................................................................42
Advanced use of the MAPSETUP options menu ....................................53
Advanced functions in the screen definition menu..............................................56
Redrawing the entire screen .....................................................................56
Saving your work .....................................................................................56
Making a hard copy..................................................................................56
Exiting from the screen definition menu .................................................57
Network Data ...................................................................................................................58
Network Storage ..................................................................................................59
Network Editing...............................................................................................................67
Introduction to Network Editing ..........................................................................68
What is Network Editing .........................................................................68
Uses of Network Editing..........................................................................68
Loading a network ...................................................................................68
Saving a network......................................................................................69
Controlling the screen display..................................................................69
Working with links ..............................................................................................71
Working with nodes.............................................................................................75
Example in network editing .................................................................................78
TRGRAPH command language.......................................................................................80
Introduction..........................................................................................................81
Command syntax .................................................................................................82
i
TRGRAPH User Manual
Table of Contents
Function arguments..................................................................................82
Function results........................................................................................85
Writing your own functions .................................................................................88
Function editors .......................................................................................88
Order of Operation ...................................................................................88
Branching and looping .............................................................................89
Saving your work .................................................................................................90
Saving functions and variables in files ....................................................90
Saving applications as packages ..............................................................91
Help facility..........................................................................................................93
Remembering function names .................................................................93
Detailed information on a function ..........................................................95
Searching for a character string................................................................95
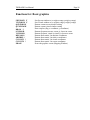
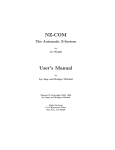
TRGRAPH Commands Reference ..................................................................................96
Introduction..........................................................................................................98
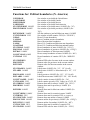
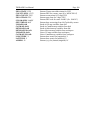
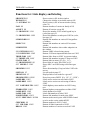
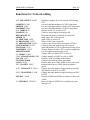
Functions for: Basic graphics...............................................................................99
Functions for: Political boundaries (N. America)................................................100
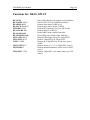
Functions for: BEAS, SPLCS ..............................................................................102
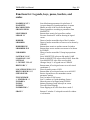
Functions for: Legends, keys, panes, borders, and scales ....................................103
Functions for: Reading networks in and out ........................................................104
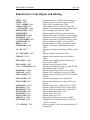
Functions for: Link display and labeling .............................................................105
Functions for: Node display and labeling ............................................................107
Functions for: Zooming in and windowing..........................................................108
Functions for: Minimum path routing..................................................................109
Functions for: Link volume display .....................................................................110
Functions for: Pie charts ......................................................................................111
Functions for: Bar charts......................................................................................112
Functions for: Network editing............................................................................113
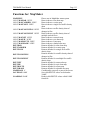
Functions for: MapMaker ....................................................................................114
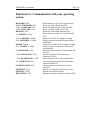
Functions for: Communication with your operating system................................115
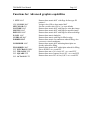
Functions for: Advanced graphics capabilities ....................................................116
Functions for: Hard copy .....................................................................................117
Functions for: Utility subroutines ........................................................................118
Functions for: User-written functions ..................................................................119
Functions for: Documentation and help facility...................................................120
ii
TRGRAPH User Manual
The TRGRAPH workspace
Page 1
TRGRAPH User Manual
Page 2
Introduction to TRGRAPH
TRGRAPH is one component of the Princeton Transportation Network Model and
Graphic Information System (PTNM). The PTNM is a graphics tool developed to
meet the specific needs of managers in the transportation industry. The PTNM
integrates network data, traffic models, and presentation graphics to aid in
transportation analysis.
What is TRGRAPH
TRGRAPH, like ALKFLOW, OPTFLOW and QNET, is a Dyalog APL/WTM
workspace. A workspace is a collection of operators, functions and variables, and is
stored as a file with extension “.DWS”.
TRGRAPH.DWS has functions and variables required for accessing, editing,
manipulating, and displaying geopolitical and network data. Such data is provided as
part of the PTNM in the form of text or APL-readable files. The user can also import
data from a variety of outside sources. The PTNM contains geopolitical data for
countries, states, provinces, Business Economic Areas, counties, Metropolitan
Statistical Areas, Standard Point Location Codes, and zip codes in North America.
What TRGRAPH does
TRGRAPH provides transportation decision-makers with geographic mapping and
network analysis capability. Maps of transportation networks with political boundary
overlays, geographic bar and pie charts, and traffic density maps can be made using
TRGRAPH.
TRGRAPH contains facilities for editing transportation networks and for importing or
creating other networks. Transportation networks of the U.S., Canadian and Mexican
railroad systems, the U.S. and Canadian highway systems, and the U.S. inland
waterway system are available as options when licensing PTNM from ALK. In
addition, users can import their data or data provided by a third party into TRGRAPH.
Built-in functions are available to code important network changes (for example, a
bridge collapse, track washout, or waterway blockage), and to modify the network for
doing “what if” studies.
User Requirements
Most functions that constitute the PTNM model have been written in APL (A
Programming Language). Some functions use external subroutines coded in C or
FORTRAN. The model works on PCs running Microsoft Windows (95, 98, NT,
2000, ME and XP), and requires installation of Dyalog APL/W version 8.0 or above.
A single user license for Dyalog APL/W costs approximately $2,000 and can be
obtained from www.dyadic.com.
TRGRAPH User Manual
Page 3
All workspace objects, namely functions and variables, and map graphics created by
TRGRAPH can be printed out easily using printers accessible from the workstation.
The map graphics can also be stored as postscript files (.PS). To access and print
TM
is required. This application opens the .PS file and
these files, Adobe Distiller
converts it to a .PDF format, which can be viewed, text-edited and printed using
Adobe Acrobat TM. Both these programs belong to the Adobe Acrobat suite of
products and can be obtained from www.adobe.com.
Initial Setup
Once Dyalog APL/W is installed on the PC, certain configuration changes have to be
made before TRGRAPH can be used for the first time. These changes to the default
settings are saved by the application and do not have to be done for subsequent uses.
Select Configure from the Options pull down menu at the top left corner of the APL
window. Dyalog APL/W Configuration box appears in a separate window.
Select Keyboard tab. Choose "unify2us.din" from drop-down menu for Input Table
File.
Select Workspace tab. Add <c:\ptnmw> to list of the search paths. Set maximum
workspace size to 65534.
Click OK button to complete the modifications.
Create a folder on your C drive and name it PTNMW. Copy all contents from the
PTNMPC installation CD obtained from ALK Technologies to this folder.
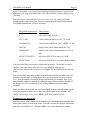
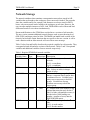
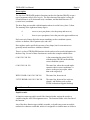
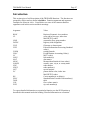
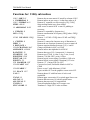
Special APL Keys
APL language uses an extended character set that include characters not printed on a
standard keyboard. There are several keyboard layouts available in Dyalog APL/W.
The symbols required for the TRGRAPH workspace can be generated using the
Unified keyboard layout.
Each key can be used to generate four symbols by:
1. Pressing the key
2. Pressing the key + Shift
3. Pressing the key + Ctrl
4. Pressing the key + Ctrl + Shift
TRGRAPH User Manual
Page 4
The first two of these generate ASCII characters as in any other Windows application.
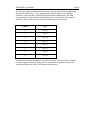
Pressing the alphabet key + Ctrl + Shift generate underlined upper-case alphabet
characters, used sometimes in TRGRAPH function and variable names. The third
option generates Greek characters and symbols mostly used to denote APL primitive
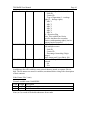
operators. Some commonly used symbols and their keys are listed below.
Symbol
Keys
←
Ctrl + [
→
Ctrl + ]
ρ
Ctrl + R
∆
Ctrl + H
↑
Ctrl + Y
↓
Ctrl + U
ι
Ctrl + I
□
Ctrl + L
To learn more about these character sets, refer to Chapter 2 of User Guide or Chapter
8 of the Language Reference Dyalog APL/W user manual. The latter also provides
detailed descriptions of all the APL functions and operators.
TRGRAPH User Manual
Page 5
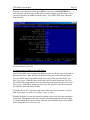
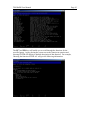
Loading TRGRAPH
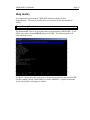
An existing Dyalog APL/W workspace can be loaded in the following three ways:
1. Start Dyalog APL application. Select Open from the File pull down menu. A
file chooser window appears and lets the user browse and select a workspace
for loading.
2. Select workspace file (example: TRGRAPH.dws) from the Windows
Explorer. Double click the file name to start Dyalog APL application and load
the workspace.
3. Start the Dyalog APL application. The cursor is on the workspace window.
All APL commands entered from this window executed immediately.
)LOAD wsname
loads the workspace wsname.
wsname.dws has to be present in one of the default directories
specified in the Options – Configurations – Workspace tab. Since
C:\PTNMW has been included in this list, and TRGRAPH.dws (along
with other support files on CD) has been copied to the same folder, the
user can load TRGRAPH by typing:
)LOAD TRGRAPH
Note that though APL language is case sensitive as far as identifying workspace
objects (functions and variables stored in the workspace), it does not differentiate
between upper and lower cases in workspace names and workspace commands.
Hence, the following commands will also execute without any errors:
)load trgraph
)Load trgraph
)LoAd TRgraph
etc.
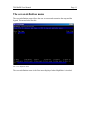
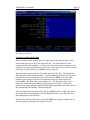
When the TRGRAPH workspace is loaded, along with the various functions and
variables contained in it, a separate Mapping Window for displaying graphics
appears. This window will initially be blank and its dimensions will hold the
continental states in the USA by default.
When the cursor reappears in the workspace window, TRGRAPH is ready for use.
TRGRAPH User Manual
Page 6
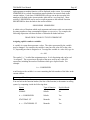
APL System Commands
APL system commands come with the Dyalog APL application and have been
developed by the programmers at Dyadic Systems, as opposed to TRGRAPH
functions developed by programmers at ALK.
A complete list and explanation of these system commands can be obtained from the
Language Reference User Manual (Chapter 6). Here is a list of commands most
commonly used by PTNM users.
)LOAD wsname – Load workspace wsname
)SAVE - Save current workspace (use with caution, all variables and functions that
exist in the workspace will be saved, including large network variables.)
)SAVE wsname2 – Save current workspace with a different name
)CLEAR - clears workspace
)COPY wsname3 object – copies object (function or a variable) from another
workspace wsname3
)ERASE object – erases object (function or a variable) from workspace
)OFF – terminates APL session
Exiting TRGRAPH
To exit current session of TRGRAPH the user can do any one of the following:
1. )CLEAR – to exit TRGRAPH, but not APL session
2. )LOAD anotherWorkSpace – exit TRGRAPH and start using another
workspace (eg: ALKFLOW)
3. )OFF – to exit TRGRAPH and APL
4. Click on close (X) button on the top right corner of the APL window – to exit
APL
5. Select Exit from the File pull down menu at the top left corner of the APL
window – to exit APL
TRGRAPH User Manual
Mapmaker
Page 7
TRGRAPH User Manual
Page 8
Introduction to MapMaker
MapMaker is a user-friendly tool in TRGRAPH for the creation of standard types of
maps and graphs. One way to load MapMaker is by entering the command
MAPMAIN from the TRGRAPH workspace. The other way is by selecting
MapMenu in the Map pull down menu at the top left corner of the Mapping Window.
The graphics created in TRGRAPH, by MapMaker or by calling functions directly
from the workspace, are displayed in a separate window called the Mapping Window.
As mentioned earlier, the Mapping Window is opened when the TRGRAPH
workspace is loaded. If, by accident, the user closes this window, the graphics
functions will abort with error. The Mapping Window can be recreated without
reloading TRGRAPH by executing the function SET∆MAPWIN.
A coordinate system is a method of associating numbers with points on a surface or in
space. The most commonly used coordinate system is that associated with a
rectangular grid on a flat surface, such as a grid on a piece of paper or the matrix of
dots on a terminal screen. These coordinates, called Cartesian coordinates (after the
French mathematician, Rene Descartes), are described by a pair of numbers (x,y)
which represent the offset in the horizontal and vertical directions from a certain fixed
point called the origin. In TRGRAPH, your graphics screen is a coordinate system
made up of units called screen coordinates. These units are called screen coordinates
because they correspond to the physical makeup of the screen, either directly or
through some constant ratio. In TRGRAPH, the origin of the screen coordinates is
always the lower left-hand corner of the screen, and there are 1024 units horizontally
across the screen. The number of units vertically will depend on the height of your
particular workstation screen relative to its width.
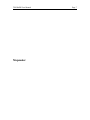
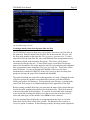
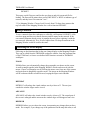
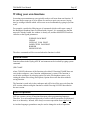
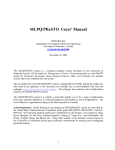
TRGRAPH also supports a system of virtual coordinates that is related to screen
coordinates through the relationship of the screen and virtual windows. The screen
window is that portion of the screen containing the virtual coordinates. The virtual
window relates the origin and range of the virtual coordinate system to the origin and
range of the screen window. The illustration below shows the relationship between
virtual and screen windows.
TRGRAPH User Manual
Page 9
Screen window versus virtual window
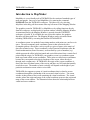
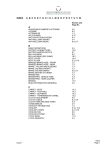
The default mode for display and print of the graphics screen is Landscape. To display
and print in the Portrait mode, the flip option is used. The following illustrates flip:
Flip = no
TRGRAPH User Manual
Page 10
Flip = yes
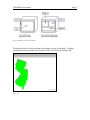
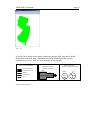
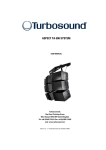
A legend can be drawn in each map to explain the purpose of the map and to identify
the symbols used on the map. MapMaker provides a default legend that you can
customize as you wish. Here are some examples of map legends.
New York State Highway
Limited Acess Free
Limited Acess Toll
Divided
Traffic Density Of
Bulk Liquid Products
(In 000's Of Net Tons)
1000
500
$250
500
1000
Examples of map legends
Co .
$1000
.Z
Co
Non-Divided
Ferry
Revenue Shares By
Competitor Of Originated Traffic
X
.Y
Co
TRGRAPH User Manual
Page 11
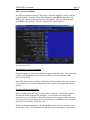
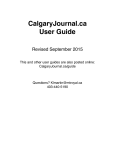
The screen definition menu
The screen definition menu allows the user to create and customize the map and the
legend. The menu looks like this:
The screen definition menu
The screen definition menu is the first menu displayed when MapMaker is invoked.
TRGRAPH User Manual
Page 12
Map edit menus
Each MapMaker map or graph type has a unique map edit menu with options specific
to that type.
Map edit menus also have certain general features that are common to many map or
graph types. These general features will be described first, followed by the specific
map edit menu for each map type.
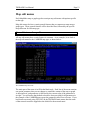
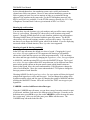
General features of map edit menus
All map edit menus have certain features in common. As an example, let us look at
the map edit menu for the CARRIER map type, as shown below:
The CARRIER map edit menu
The main part of the menu is in fill-in-the-blank style. Each line of the menu contains
one option parameter that you can change to control the content of the map or graph.
A description of each parameter is followed by the current value of the parameter to
its right. You will notice that default values have been provided for all parameters in
the example of the CARRIER pane except the parameter called Network name. If you
had chosen a network using PICKNET on the TRGRAPH main menu, then the name
of that network would be supplied as the default for the network name.
TRGRAPH User Manual
Page 13
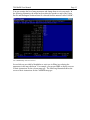
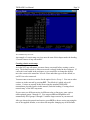
You can examine the list of map parameters and change them to suit your needs. In
the following illustration, the menu has been altered to produce a map of the Union
Pacific and Burlington Northern Santa Fe railroads from the network called “00WB”:
The CARRIER map edit menu altered
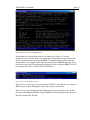
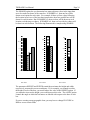
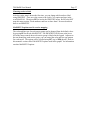
Several aids are provided by MapMaker to assist you in filling in or altering the
parameters in the map edit menu. For example, you can press PF1 to display a screen
of basic instructions for the relevant map type. The following illustration shows the
screen of basic instructions for the CARRIER map type.
TRGRAPH User Manual
Page 14
Basic instructions for the CARRIER map type
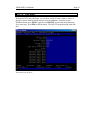
Most parameters in map edit menus have a limited set of choices. For these
parameters, you can select from a list of alternatives by placing the cursor on the line
for the desired parameter and pressing PF10. You then make your choice from the
list presented. For example, in the map edit menu for the CARRIER map type, place
the cursor to the right of the parameter description Window and press PF10. You will
be presented with a list of choices that looks like this:
List of choices for the Window option
Tab the cursor to the choice you want and press ENTER. Alternatively, you can press
PF3 to return without changing the choice that was previously made.
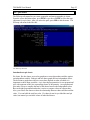
After you review the map options and change them to suit your needs, you can draw
the map on the Mapping Window by pressing PF12. The map drawn by the choices in
the above menu looks like this:
TRGRAPH User Manual
Page 15
A carrier map of the Union Pacific and Burlington Northern Santa Fe systems
After the first drawing of the map, you may want to change more options and redraw
the revised map. To do this, change the options you want and press PF12 again.
Depending on which options you changed, the map may be drawn much faster the
second time. MapMaker looks at what changes you have made in the options, and
only re-executes those program steps that are affected by the changed options. This
enhances your productivity by reducing the computation time required when
redrawing.
While the map or graphic is being created, certain messages may appear in the upper
left-hand corner of the menu. These messages tell the user what program step is
being performed at the time the message appears.
In the bottom of the menu is the command line (===>). From the command line, you
can execute TRGRAPH commands or user-defined APL functions. For example,
after drawing the CARRIER map, you could label ‘Los Angeles CA’ on the screen by
entering LABEL ‘LOS ANGELES CA’. When you are finished editing the map, you
can return to the screen definition menu by pressing PF3.
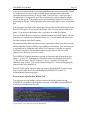
Introduction to the MAPSETUP options menu
A good map or graph will include a legend that identifies its purpose and explains the
symbols used. Each MapMaker pane includes a default legend, as well as defaults for
map symbols such as color, shape, and size. You can customize the default legend or
TRGRAPH User Manual
Page 16
change the characteristics of map symbols using the MAPSETUP options menu. The
MAPSETUP options menu looks like this:
The MAPSETUP options menu
You can invoke the MAPSETUP options menu for a pane by pressing PF9 in the map
edit menu, or by entering MAPSETUP from the TRGRAPH workspace window. In
MAPSETUP, various parameters are displayed. Use the arrow keypad, the tab key, or
the mouse to move the cursor to a parameter whose value you wish to change. Then
type over the existing value with the new value.
If you want more information about a particular parameter, move the cursor to that
parameter and press PF1. A brief explanation of the parameter will be displayed at the
bottom of the screen.
The feature parameter, which is at the top center in the MAPSETUP options menu, is
used to alter the set of parameters displayed by MAPSETUP in order to accommodate
different map types.
The “==>” prompt at the bottom of the menu indicates the command line. Any valid
TRGRAPH or APL command can be executed by typing that command at the prompt
and then pressing ENTER, in the same manner as the command line in the map edit
menu. For example, you could draw the U.S. political boundaries on the screen by
typing the word USMAP and pressing ENTER.
To exit MAPSETUP, press PF3. This will return you to the map edit menu. Press
PF3 again to return to the screen definition menu. The rest of this chapter will
describe the map edit menu for each map type.
TRGRAPH User Manual
Page 17
BAR - bar charts
The BAR map edit menu lets you create geographic or non-geographic bar charts.
From the screen definition menu, press PF10 or type the word BAR to select the map
edit menu for a bar chart. After you select the pane, press PF8 to edit the menu. The
BAR map edit menu looks like this:
The bar map edit menu
Introduction to bar charts
Bar charts are used to graph one or more dependent variables against an independent
variable. A bar chart graphs are used when the independent values are discrete (as
opposed to continuous) and are particularly well suited to graphs where the
independent values are non-numeric.
TRGRAPH User Manual
Page 18
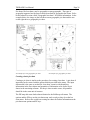
In the PTNM, bar charts may be geographic. For example, the bars may be located at
cities, or at centers of states and provinces. In this case, location is the independent
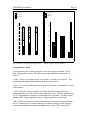
variable being graphed. Bar charts can also be non-geographic. In the example which
follows, the pane on the left shows a non-geographic bar chart and the pane on the
right shows a geographic bar chart
An example of a non-geographic bar chart
An example of a geographic bar chart
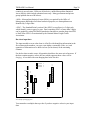
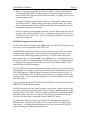
Multiple bars may be drawn at each location (for example, to show the ratio of
originating and terminating traffic), and each bar may also have shares (for example,
to show market shares by carrier, or the proportion of traffic by commodity). In the
example which follows, the chart on the left shows bars for values A, B and C with
multiple shares and the chart on the right shows multiple bars for values A, B, and C.
TRGRAPH User Manual
Page 19
Share 1
Share 2
Share 3
Share 1
Share 2
Share 3
60
100
50
75
40
50
30
20
25
10
0
A
B
C
0
A
Bars for values A, B, and C with multiple shares
B
C
Multiple bars for values A, B, and C
Geographic bar charts
If your input data file contains geographic codes in the left most column, you can
draw a geographic bar chart. The types of geography MapMaker supports are as
follows:
• Node - Nodes are locations (such as cities, towns, or stations) on a network. They
are identified by right-justified numbers from one to five digits.
• State - U.S. state, Canadian provinces, and Mexican estados are identified by 2-letter
abbreviations
• FIPS - Each U.S. county is assigned a 5-digit Federal Information Processing
Standards (FIPS) code. The first two digits identify the state. FIPS are maintained by
the U.S. Department of Commerce, National Bureau of Standards. The FIPS option
handles either 2-digit (graphed by state) or 5-digit (graphed by county) input.
• BEA - BEAs are groups of counties called Business Economic Areas as defined by
the U.S. Department of Commerce Bureau of Economic Analysis. BEAs typically
represent metropolitan areas and surrounding rural counties. They often include
TRGRAPH User Manual
Page 20
counties in several states. BEAs are all-inclusive, unlike Metropolitan Statistical
Areas (MSAs) which include urbanized areas only. Many government and private
groups publish data on a BEA basis.
• MSA - Metropolitan Statistical Areas (MSAs), recognized by the Office of
Management and Budget for Federal statistical purposes, are metropolitan areas
identified by 5-digit codes.
• SPLC - The Standard Point Location Code (SPLC) as used here is a 2-digit code,
which identify a state or part of a state. Data containing SPLCs of more than 2-digits
can be graphed by using TRGRAPH translation functions to translate them into FIPS
or Node form. SPLCs are maintained by the National Motor Freight Traffic
Association.
Bar chart input data
The input needed to create a bar chart is a flat file with identifying information in the
first column (node numbers, car types, state alphas, commodity codes, etc.) and
quantities of information to be shown as bars (or bar shares) in the remaining
columns.
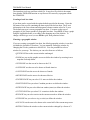
For the bar chart to make sense, all quantities should use the same unit of measure. If
the data contains negative values, the bars which represent those values will be
hanging. A bar chart with some hanging bars looks like this:
69
Share 1
Share 2
Share 3
15
35
33
50
25
0
-19
25
-47
50
An example of hanging bars
You cannot have multiple shares per bar if you have negative values in your input
data.
TRGRAPH User Manual
Page 21
The input data is always read from a disk file. It may be a file which is the output
from another TRGRAPH function or any flat text file created by a program outside
the PTNM/GIS.
Creating a basic bar chart
A bar chart can be created with the option defaults provided in the menu. Enter the
full name of the text file containing the data required for the bar chart. The X-axis
information is the first column and subsequent columns contain values for Y-axes.
The default map type is a non-geographic bar chart. You must set the type of
geography if you want to produce a geographic bar chart. Press PF12 to draw a graph
using the supplied defaults, or to redraw after changing any of the defaults. To
change a default, type over it, or use PF10 to pick from permitted values.
Choosing a geographic window
If you are creating a geographic bar chart, the default geographic window is one that
just holds the locations of your data. You can manually control the window by
changing the Window parameter to MANUAL. You can press PF4 to select a
window for your map. The choices you can select from are as follows:
• QVWINDOW leaves the current window unchanged.
• ZOOM lets you use the graphic cursors to define the window by zooming in on a
map that is already drawn.
• USWINDOW sets the area to be shown as the U.S.
• NAWINDOW sets the area to be shown as North America.
• CANWINDOW sets the area to be shown as Canada.
• MEXWINDOW sets the area to be shown as Mexico.
• STATEWINDOW lets you select U.S. states to define the window.
• PROVWINDOW lets you select Canadian provinces to define the window.
• ESTWINDOW lets you select Mexican estados (states) to define the window.
• CNTYWINDOW lets you select U.S. counties to define the window.
• WINDOW lets you select carriers in the current network to define the window.
• NWINDOW lets you select a city (or cities) to define the window.
• ADVANCE sets the area to be shown as the center half of the current map screen.
• RETREAT defines the window as the current window enlarged by a factor of 2.
TRGRAPH User Manual
Page 22
Re-locating or aggregating bars
After the bar chart is drawn the first time, you can press PF5 to use the graphic cursor
to shift the locations of any overlapping bars. If you have a lot of overlap, you may
want to aggregate a group of bars to show the summation of them at one location.
Press PF7 to use the graphic cursor to aggregate bars.
Options on the bar chart menu
• If you are creating a geographic bar chart of type Node, you must enter the name
of a network for the Network name option. Press PF10 to select a network from
the list of networks available to you. You must select a rail network if you have
rail node numbers in your input data. You must select a highway network if you
have highway node numbers in your input data. For more information on
networks, see this manual's section called “Network Mapping.” If you are
creating a non-geographic bar chart or a geographic bar chart of a type other than
Node, you may leave the Network name option blank.
• Enter the name of your input data file on the menu line Data file. You may enter
just the name of the file if it is in “C:\PTNMW\DATA” directory, or alternatively,
enter the full file name along with the pathname and extension.
• If your input data file contains geographic codes in the left most column, you can
draw a geographic map. Place the cursor on the line Type of geography in data
file and press PF10 to choose the geography that matches your data. You may
need to press PF2 first to peek at your data file.
• Choose ALL for the option Label Values to display the numerical value
represented by each bar at the top of the bar. No bars values will be labeled if
you choose NONE. The AUTO choice will label all bar values on non-geographic
charts, and no values on geographic charts. If you have bars with more than one
share, the value labeled will be the sum of all the shares in the bar.
• Choose ALL for the option Label bars to label the text of the bar names at the
base of each bar (or group of bars, if you have multiple bars). The bar names
default to the first column of the input data. No bar names are labeled if you
choose NONE. The AUTO choice will label all bars on non-geographic charts
and no bars on geographic charts.
• Choosing YES for the option Totals in legend will calculate the sum of the
dependent values in the data and show the total in the legend. The totals will not
be shown if you choose NO.
• A legend text is generated automatically. To change the text either before or after
the map is first drawn, change the Legend text option to MANUAL and press the
PF9 key to type in your own text using MAPSETUP. Choose AUTO to generate
text automatically. No legend will be drawn if you choose NONE.
TRGRAPH User Manual
Page 23
• If you are creating a geographic bar chart, the window is selected automatically.
To change this either before or after the map is first drawn, change the Window
option to MANUAL and press PF4 to choose a window. Choosing AUTO selects
a window automatically.
• The graph is flipped using the Flip or no option. Choosing NO keeps the screen
in Landscape mode. Choosing YES puts the map in Portrait mode. The AUTO
choice will automatically flip or not flip the map based for geographic bar charts,
based on the spatial layout of the bars.
• If you are creating a non-geographic bar chart, your text input on the menu line Xaxis text will be drawn under the X axis. Your input on the menu line Y-axis text
will be drawn next to the Y-axis. If you are creating a geographic bar chart, these
parameters are ignored.
MAPSETUP options used in bar charts
As in the map edit menu for line graphs, PF9 invokes the MAPSETUP options menu.
You can type in your legend text in the TEXT area.
The IDENTIFICATION area in the lower left of the menu controls how the controls
are labeled in the graph legend. Adjacent to the text identifying each line you can
control the color and line type pattern of each line. If you have more than 8 lines,
these options can be scrolled using PF7 (up) or PF8 (down). To change the colors of
the bars, move the cursor underneath the COLOR option and type in a different color.
To change the line-type pattern of the lines, move the cursor underneath the LTYP
option and type in a different pattern.
The COLUMNS option lets you determine how many columns to use to show the bar
identifications. For example, if you have four different bar identifications and you set
COLUMNS equal to 1, then the legend will show one column with all four bars. If
you set COLUMNS equal to 2, then the legend will show two columns with two bars
in each column. You can control the spacing between the bar identifications with the
SPACING option.
You may need to change the FEATURE option to BAR in order to have access to the
IDENTIFICATION and other options.
The DOLLAR option lets you control whether or not to place a dollar sign before the
bar values on the graph and in the legend. This is handy for indicating that bar values,
such as revenue, are in dollars. The size of the bar value labels is controlled with the
LAB SIZE option. This size is in terms of a fraction of the standard lettering size.
The font of the bar labels is controlled with the LAB FONT option.
To change bar colors, move your cursor into the COLOR option area and type in
different colors. With the cursor in this area, you can press PF1 to display a list of
color choices. To change the shading patterns, move your cursor into the PATRN
option area and type in different pattern numbers.
TRGRAPH User Manual
Page 24
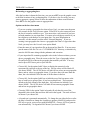
The SHARES option lets you determine how many adjacent values in the input data
are to be stacked as shares of the same bar. If SHARES is 1, then one bar will be
drawn at each point for each value. For example, if there are four values following
the location in each row of the bar chart input matrix, then four parallel bars will be
drawn for each location. But if SHARES is 2, then two bars will be drawn at each
location, each having two shares. If SHARES is 4, then one bar with four shares will
be drawn at each location. The following illustrates this example using SHARES:
30
15
10.0
20
7.5
10
5.0
10
5
2.5
0
One share
0
Two shares
0
Four shares
The parameters HEIGHT and WIDTH control the maximum bar height and width,
respectively, measured in screen coordinates. If, for example, you wanted to reduce
the height of each of the bars, you would reduce the value of the HEIGHT option. If
you wanted to increase the height, you would increase this value. The ANGLE option
controls the angle at which the bar names are labeled with respect to the base of each
bar.
If you are creating a non-geographic chart, you may have to change FEATURE to
BAR to access certain fields.
TRGRAPH User Manual
Page 25
PIE - pie charts
The PIE map edit menu lets you create geographic and non-geographic pie charts.
From the screen definition menu, press PF10 or type the word PIE to select the map
edit menu for a pie chart. After you select the pane, press PF8 to edit the menu. The
PIE map edit menu looks like this:
The PIE map edit menu
Introduction to pie charts
Pie charts, like bar charts, are used to graph one or more dependent variables against
an independent variable. Both pie and bar charts graph discrete independent values.
The decision to graph data with pies versus bars depends on what you think it is
important to show about your data. A pie chart depicts quantities as area proportional
pies with segments of the pies representing shares of the quantity. Area proportional
pies make it easy to compare the total of the shares between the independent values.
Bars are height proportional and make it easier to compare values in adjacent bars.
Also, you can use bar shares to show the relationship between shares and the total bar
value. You can label the total bar value. Pie charts do not let you label the total pie
value, but instead you can label values of individual shares.
TRGRAPH User Manual
Page 26
Pie charts, like bar charts, may be geographic or non-geographic. The types of
geography supported are the same as those described for geographic bar charts. Refer
to this manual's section called “Geographic bar charts” for further information. In the
example below, the image on the left shows a non-geographic pie chart and the one
on the right shows a geographic pie chart:
An example of a non-geographic pie chart
An example of a geographic pie chart
Creating a basic pie chart
Creating a pie chart is similar to the procedure for creating a bar chart. A pie chart of
input data can be created with the option defaults provided in the menu. The input
data needed is the same as needed for a bar chart; a matrix with identifying
information in the first column and quantities of information to be shown as pie
shares in the remaining columns. For the pie chart to make sense, all quantities
should be in the same unit of measure.
The PIE map edit menu looks almost identical to the BAR map edit menu. The
options and the PF keys on the pie chart menu work exactly as they do on the bar
chart menu. Refer to the section on creating bar charts for further information on the
pie chart menu options and PF keys.
TRGRAPH User Manual
Page 27
MAPSETUP options used in pie charts
As in the BAR map edit menu, PF9 invokes the MAPSETUP options menu. You can
use many of the MAPSETUP options described in this manual's section called
“MAPSETUP options used in bar charts” to customize your pie chart.
You can also label pie values with percentage share in addition to or instead of actual
values using the PCT option. PCT controls whether to label pie values with actual
numbers (PCT=0), percentages (PCT=1) or both (PCT=2).
The RESOLUT option controls the resolution (number of points) of the pie circles. A
value of 3 is recommended for page-size plots, but should be increased if you will be
plotting the map in a large size. The MAX SIZE option is the radius, in screen
coordinates, of the largest pie. Decrease MAX SIZE to make the pies smaller, and
increase MAX SIZE to make them bigger.
TRGRAPH User Manual
Page 28
Network mapping: NET and CARRIER panes
At the heart of the PTNM is its ability to work with network databases. The PTNM
can be licensed with detailed and accurate representations of the North American rail,
highway and waterway systems, and you can import your own network data or
network data provided by third party logistics. Each network is defined in terms of
nodes and links. Nodes represent locations such as cities, stations, or intersections.
The nodes are connected together by links, which represent the highways, railroads, or
waterways. Each node has an associated coordinate on an X-Y grid that allows maps
of the networks to be drawn. The coordinate system on all three networks conforms
to that of the PTNM’s political boundary and other databases so that combined
overlays can be drawn. Each link has associated with it various attributes such as
distance and road quality.
Using networks with the PTNM
Networks are stored in disk files (with extension .ntw) so they can be used in different
PTNM workspaces. You can load a network into the TRGRAPH workspace and use
the TRGRAPH functions for accessing, editing, manipulating, and displaying network
data.
The PTNM North American rail, highway, and waterway networks
The PTNM North American rail network contains approximately 43,000 nodes
representing 70,000 freight stations, and approximately 44,000 links representing
250,000 route-miles of rail lines. All Class I and II, and nearly all Class III railroads
in the U.S., Canada, and Mexico are represented.
Each node on the network is coded with one or more station names (city and state or
province), Freight Station Accounting Codes (FSACs), Standard Point Location
Codes (SPLCs), “3-3-3” Eastern Railroad Presidents’ Conference (ERPC) format
station names, and Rule 260 Junction Alpha Codes.
Every link on the PTNM rail network is coded with its actual railroad distance, taken
from timetables or other official sources; the state or province the link is in; the AAR
number and initials of the railroad company owning the link; the AAR number and
initials or railroads having operating rights on the link; and a designation of track and
route quality (high-density mainline, medium density mainline, medium density
branch line, or low density branch line).
The PTNM highway network contains approximately 100,000 nodes, which are
matched to 150,000 place names, and approximately 130,000 links which represent
over 650,000 miles of highways in the U.S. and Canada. All interstate, federal, and
primary state highways are included in the network, as well as some secondary and
local highways.
TRGRAPH User Manual
Page 29
Each node on the highway network is coded with one or more place names (city and
state or province), and Standard Point Location Codes (SPLCs). U.S. Postal Service
Zip Codes are contained in an auxiliary file for use with the network.
Every highway network link is coded with its actual highway distance, taken from
official state and provincial highway maps; one or more highway route numbers; the
state or province the link is in; type of road (limited access non-toll, limited access
toll, open access divided, open access non-divided, and ferries); and type of vehicles
permitted (all vehicles, or automobiles only). The highway network separately
identifies automobile-only from truck-usable links.
The PTNM waterway network contains approximately 10,000 nodes, which are
matched to 52,000 port and dock locations, and approximately 10,000 links, which
represent 400,000 miles of inland and coastal waterways, as well as major ocean and
Great Lakes shipping routes, in the U.S. and Canada. Each node is coded with one or
more of the U.S. Corps. of Engineers’ port and dock codes. Nodes along the inland
and gulf intra-coastal waterways have a waterway and mile designation as well. Each
link of the network is assigned a distance and channel depth.
Importing non-PTNM networks into the PTNM
The networks described above are the ones continuously supported and maintained by
ALK. A variety of other networks are used with the PTNM software. These include
a world-wide shipping network; Chinese railroads; New York City streets; New
Jersey bus routes; train schedule and blocking networks; airline schedule networks;
and U. S. Census' Topological (TIGER) files. Use TRGRAPH command language to
import non-PTNM networks.
TRGRAPH User Manual
Page 30
NET - network attributes
The NET map edit menu lets you draw maps of network attributes, such as road type
or route numbers. From the screen definition menu, press PF10 or type the word
NET to select the map edit menu for network mapping. After you select the pane,
press PF8 to edit the menu. The NET map edit menu looks like this:
The NET map edit menu
Introduction to network mapping
Network mapping is used to draw maps showing network attributes. You can overlay
a sketch of an optional background network while you look at attributes of the
foreground network.
By default, the amount of attribute detail shown will increase the more you zoom in.
You can fix the level of detail independent of the window by changing the default
options.
Creating a basic network map
Before creating a network map, you must choose a network. The default network is
the network already loaded in the workspace. If a network is not loaded in the
workspace or you would like to change the default, move the cursor to the menu line
Foreground network and either type over the default, or use PF10 to select a network
from the list of networks available to you.
Within the foreground network, you can highlight certain carrier(s) or state(s) you
define as the scope. The default is to include all carrier(s) and state(s) as part of the
TRGRAPH User Manual
Page 31
scope. For example, if you select carrier Burlington Northern Santa Fe and the state
Illinois for your scope only BNSF links in the state of Illinois would be displayed on
your map.
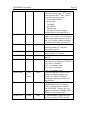
Move the cursor to the menu line Carriers in scope (0 for all), and type over the
default with the carriers you want. Carriers are entered in this menu using standard
TRGRAPH nomenclature, which is as follows.
TRGRAPH nomenclature what it means
0
All carriers in the network
250 777 802
Carriers whose numbers are 250, 777 or 802
'WC BNSF UP'
Carriers whose initials are “WC”, “BNSF” or “UP”
FAM 'WC'
Family of the carrier whose initials are “WC”
FAM 250 400
Family of the carriers whose numbers are 250 or
400
ALLBUT FAM 'KCS'
All carriers EXCEPT the family of “KCS”
ALLBUT 400
All carriers EXCEPT the one whose number is 400
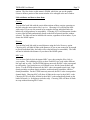
You can further limit your scope to certain states/provinces. The default is to show
all states. Move the cursor to the States in scope menu line and type the
state/province abbreviations (in quotes; for example, 'FL' for Florida) for the selected
states.
You can also show the portion of the foreground network that is not in the scope, in a
different color/line-type, by changing the Show foreground network not in scope to
YES. You can underlay an optional background network (for example, show a rail
network under a highway network) by typing the name of the network to the right of
the Background network menu line or by pressing PF10 to choose from those
available.
After you choose the network and scope, press PF12 to draw a network map using the
rest of the supplied defaults, or to redraw after changing any of the defaults. To
change a default, type over it, or use PF10 to pick from permitted values.
Zooming in to see more detail
After the network map is drawn for the first time, you can change the geographic area
shown (the window) to show more detail. Move the cursor to the Window option and
type in the word MANUAL. Then press PF4 to select from the menu of window
TRGRAPH User Manual
Page 32
options. The first choice on this menu is ZOOM, which lets you use the graphic
cursor to define a portion of the current window to be enlarged as the new window.
Link attributes and how to show them
Carriers
You can label each link with the carrier abbreviations of those carriers operating on
the link using the menu option Label carriers. Choosing ALL will label the links
with carriers (if you are not zoomed in far enough to discern individual links, the
labels will overlap and may be unreadable). Choosing AUTO will determine whether
or not to label all links automatically based on the kind of network and the window
selected. The links will not be labeled with carriers, regardless of the window, if you
choose the NONE option.
Distance
You can label each link with its actual distance using the Label distances option.
Choosing ALL will label all links with distances (if you are not zoomed in far enough
to discern individual links, the labels will overlap and may be unreadable). The links
will not be labeled with distances if you choose the NONE option.
MLC code
You can show links by their designated MLC type codes using the Show links in
scope option. The symbology used is to show each MLC type code with a different
line-type and /or color. For the PTNM highway network, the MLC codes correspond
to road quality: free limited access, toll limited access, divided, non-divided, and
ferries. For the PTNM rail network, the MLC codes correspond to track type: high
density mainline, medium density mainline, medium density branchline, and low
density branchline. For the PTNM waterway network, the MLC codes correspond to
channel depth. Choosing MLC will show all links in the scope by their MLC codes.
Choosing AUTO will show all links by their MLC codes automatically based on the
kind of network (i.e. for highway networks only). Choosing YES will show all links
in scope without showing MLC codes.
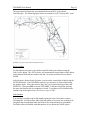
TRGRAPH User Manual
Page 33
The map legend will show the correspondence between MLC code and line
color/line-type. The following figure shows an example of a NET map by MLC code:
Example of a map created with the NET pane menu
Route numbers
For the highway networks, you can label each link with route numbers using the
Label routes option. The AUTO choice will automatically choose links to label based
on the network kind and the window selected. No routes are labeled if you choose
NONE.
After the map is drawn for the first time, you can select certain links to label using the
GETLINKS menu. The GETLINKS menu lets you interactively choose links using
the graphic cursor. Move the cursor to the Label routes option and type in the word
MANUAL. Then press PF6 to invoke GETLINKS. Links are selected by pressing
the space bar between the two endpoints of a link. Your choice will be limited to the
current scope if the option Limit selections to scope is YES.
Link numbers
You can label each link with its link number using the Label link numbers option.
Choosing ALL will label all the links with link numbers (if you are not zoomed in far
enough to discern individual links, the labels will overlap and may be unreadable).
The links will not be labeled with link numbers if you choose the NONE option.
TRGRAPH User Manual
Page 34
Node attributes and how to show them
You can label each node with the PTNM node number or city name it represents
using the Label nodes option. The AUTO choice will automatically determine
whether or not to label nodes based on the window selected. The BOTH option will
label each node with its name and number. Choosing NUMS will label all nodes with
their node numbers. Choosing NAMES will label all nodes with their city names.
The NONE option will suppress labeling. If you are not zoomed in enough to discern
individual links, the node labels placed with the NAMES, NUMS, or BOTH options
will overlap and may be unreadable.
The city name labels are drawn at an angle such that they avoid overlapping each
other, running off the edges of maps, or overwriting any links to be drawn on the map.
You can force city names to be labeled horizontally by using the choices AUTO0,
SOME0 and MANUAL.
After the map is drawn for the first time, you can select certain nodes to label using
the IDENTIFY menu. The IDENTIFY menu lets you interactively choose nodes
using the graphic cursor. Move the cursor to the Label nodes option and type in the
word MANUAL. Then press PF5 to invoke IDENTIFY. Your choice will be limited
to the current scope if the option Limit selections to scope is YES.
For the PTNM rail network, each of the station names at a node is associated with a
unique Freight Station Accounting Code (FSAC) assigned by the Association of
American Railroads (AAR). For most nodes, there will also be one or more Standard
Point Location Codes (SPLCs), a geographic coding system designed by the National
Motor Freight Traffic and matched to the FSACs by the AAR.
SPLCs are 6 digit codes which correspond to individual place names in the U.S. and
Canada. They are assigned in a hierarchical manner so that SPLCs which are close
numerically correspond to places that are close geographically. The first digit of the
SPLC designates a region of the U.S. (number 1-8) or Canada (number 0), or Mexico
(number 9). The second digit indicates a state, province, or part of a state or province.
The third digit identifies a county or group of adjacent counties: the fourth digit
indicates a specific county or portion of that county. The fifth and sixth digits,
indicate a specific place within that county or portion of that county. For example,
the SPLC for Princeton, N.J. is 194537, and each digit indicates the following:
1 - region (Northeastern U.S.)
9 - state or portion (New Jersey)
4 - county or adjacent counties (Central New Jersey)
5 - county or portion (Mercer County)
3 - area within county or portion (N. Central Mercer County)
7 - specific place (Princeton, N.J.)
The FSAC numbers are 8-digit numbers indicating a specific rail freight station. The
first 3 digits indicate the railroad, according to the AAR's numbering system, and the
last 5 digits indicate the station on that railroad. As the station numbers are assigned
TRGRAPH User Manual
Page 35
by the railroads themselves, the numbering system varies widely and cannot be
counted on to follow any pattern. However, many railroad numbering systems do
follow a pattern of some sort, such as stations in order on a certain line having
adjacent FSAC numbers in the same order. For the PTNM highway network, only
SPLCs (no FSACs) are available. For the PTNM waterway network, the U.S. Corps
of Engineers' Port and Dock Codes are given instead of SPLCs or FSACs.
Showing zip code locations
You can show zip code locations, zip code numbers, and post office names using the
Show zip codes option. Choosing LOC shows all zip code locations using small
squares. Choosing NUMS shows all zip code locations with their zip code numbers.
Choosing NAMES shows all locations with their post office names. The BOTH
choice shows all zip code locations, numbers, and post office names. Zip codes are
not shown if you choose the NONE option, which is the default. If you are displaying
a network outside of North America, Show zip codes is not supported.
Showing a legend & altering symbology
In the NET map edit menu, the default is to show a legend. Changing the Legend
text, colors, line-types option to AUTO suppresses the drawing of a legend but
chooses the colors and line-types to use in the map automatically. You can change
the colors and line-types chosen by changing the Legend text, colors, line-types option
to MANUAL, and then pressing PF9 to invoke the MAPSETUP menu. The Legend
text, colors, line-types option on the NET map edit menu is a bit different from other
panes in that options chosen on the pane menu control which identifications are
shown in the legend Move the cursor underneath the COLOR option to change the
color of each identifier. Move the cursor underneath the LTYP option to change the
line-type pattern of each identifier.
Choosing ASHOW for the Legend text, colors, line-types option will show the legend
using default legend text, colors, and line-types. You can change the wording of the
legend text and the colors and line-types by changing the option to MSHOW and then
invoking the MAPSETUP menu. Move the cursor to the TEXT area to type in your
legend text.
CARRIER - carriers in different colors/line-types
Using the CARRIER map edit menu, you can draw a map of an entire network or part
of a network, and draw each carrier in a different color or line-type. From the screen
definition menu, press PF10 or type the word CARRIER to select the map edit menu
for a carrier map. After you select the pane, press PF8 to edit the menu. The
CARRIER map edit menu looks like this:
TRGRAPH User Manual
Page 36
The CARRIER map edit menu
An example of a carrier map was given near the start of this chapter under the heading
“General features of map edit menus”.
Creating a basic carrier map
As in the NET map edit menu, you must choose a network before creating a carrier
map. The default network is whatever network is already loaded in the workspace. If
a network is not loaded in the workspace or you would like to change the default,
move the cursor to the menu line Network Name and either type over the default, or
use PF10 to select a network.
You must enter a carrier or carriers for the option Carrier Group 1. You can see what
carriers are in the network by pressing PF2. The default is 0 which selects all
carriers. Carriers are entered in this menu using the standard TRGRAPH
nomenclature described earlier in this manual, under the heading “Creating a basic
network map” of the NET map menu.
If you want to see different carriers in different colors or line-types, enter carriers
under optional groups 2 through 12. You can press PF6 and MapMaker will
automatically fill in groups 1 through 12 with the largest carriers in your network.
After you choose the network and carriers, press PF12 to draw a carrier map using the
rest of the supplied defaults, or to redraw the map after changing any of the defaults.
TRGRAPH User Manual
Page 37
Choosing nodes to label
After the carrier map is drawn the first time, you can change which nodes to label
using IDENTIFY. First, move the cursor to the Label Cities option and type in the
word MANUAL. Then press PF5 to invoke the IDENTIFY menu. Refer to the NET
map edit menu section “Node attributes and how to show them” for more details on
how to use IDENTIFY.
MAPSETUP options used in carrier mapping
The color and line type for each carrier group can be changed from the default values
by pressing PF9 to invoke MAPSETUP. The IDENTIFICATION area at the lower
left of the menu controls how each carrier group is labeled in the legend. Adjacent to
the text identifying each carrier group, you can control the color and line type pattern
for each carrier. The options can be scrolled using PF7 (up) of PF8 (down). Refer to
this manual's section called “MAPSETUP options used in bar graphs” for information
on other MAPSETUP options.
TRGRAPH User Manual
Page 38
ROUTE - route maps
With the ROUTE map edit menu, you can draw a map of routes within a carrier or
group of carriers from an origin to one or more destinations. From the screen
definition menu, press PF10 or type the word ROUTE to select the map edit menu
for a route map. Press PF8 to edit the menu. The ROUTE map edit menu looks like
this:
The ROUTE map edit menu
TRGRAPH User Manual
Page 39
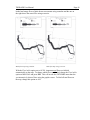
Introduction to route maps
Route maps are used to show intra-carrier routes within a single transportation mode.
Route maps can show a single route, routes from one origin to multiple destinations,
or routes from multiple origins to multiple destinations. The example below shows a
route map with one origin and multiple destinations:
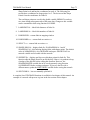
An example of a map created with the ROUTE map menu
How routes are computed
The PTNM includes a minimum impedance routing program for computing routes.
Each link in the network has an associated impedance, based on distance, travel time,
dollar cost, accident probability, population exposure, or other link attributes either
singly or in combination. The minimum impedance route between any two nodes on
the network is the sequence of connecting links whose impedance sum is less than
any other sequence of links.
Each of the three modal networks supplied with the PTNM (highway, rail, and
waterway) has a calibrated impedance formula called BESTROUTE which replicates
most likely service routes On the highway network, the formula is a combination of
distance and road type (free limited access, toll limited access, divided, non-divided,
and ferries). On the rail network, the formula is a combination of distance and route
quality (high-density mainline, medium density mainline, medium density branch
TRGRAPH User Manual
Page 40
line, and low-density branch line). On the waterway network, the formula is
minimum distance.
Creating a basic route map
For the ROUTE map edit menu, you must choose a network, one or more carriers, an
origin, and at least one destination. Move the cursor to the menu line Network name
and either type over the default, or use PF10 to select a network. Carriers are entered
in this menu using the standard TRGRAPH nomenclature described above in this
manual on network mapping. You can see what carriers are in the network by
pressing PF2.
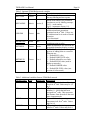
Origins and destinations may be specified such as
location
what it means
'CHICAGO IL'
Chicago, Illinois
16434
The node whose number is 16434
SPLC2NODE 380000
The node corresponding to SPLC 380000
FSAC2NODE 02200001
The node corresponding to FSAC 02200001
'CHICAGO IL, ST LOUIS MO'
Chicago, Illinois and St. Louis Missouri
16434 13599
The nodes whose numbers are 16434 or 13599
Move the cursor to the menu line Origin and type in an origin location. Move the
cursor to the menu line Destination and type in a destination location. You can press
PF5 to automatically generate a list of major destinations after you have selected a
network and carrier(s).
Press PF12 to draw a route map using the rest of the supplied defaults, or to redraw
the map after changing any of the defaults.
Adjusting routing criteria
In the ROUTE map edit menu, you can select the routing criteria MapMaker will use
to compute the routes. The default routing criteria is BESTROUTE. Move the cursor
to the menu line Routing criteria and type over the default or press PF10 to select a
criteria from the list of choices. The two other choices are DIST and
SHORTROUTE. The DIST formula is pure minimum distance routing, using the
values in the network variable DIST. The SHORTROUTE formula is the same as
DIST for the rail and waterway networks; for the highway network, it is the minimum
distance formula with someconsideration of road quality, but not as much as
BESTROUTE.
TRGRAPH User Manual
Page 41
Labeling miles
The distance to each destination is labeled on the map using the option Label miles to
each dest. If you choose the default YES, the mileage will be labeled next to each
destination. The mileages will not labeled if you choose NO.
Multiple origins
You can generate routes from multiple origins by specifying more than one origin in
the menu. On the menu line Origin, type in each origin city and state name separated
by a comma. For example, if you type in:
'ST LOUIS MO, CHICAGO IL'
as origins, MapMaker compares the routes from both St. Louis, MO and Chicago, IL
to each of the destinations, and displays the minimum impedance route based on the
routing criteria to each destination. Each destination will be connected to the origin
that is “closest” based on the routing criteria that you specify.
TRGRAPH User Manual
Page 42
Traffic density charts
Introduction to traffic density mapping
Given a database containing the amount of traffic between various origins and
destinations, the PTNM's ALKFLOW traffic assignment program can compute the
volume of that traffic on each link of a network. The program efficiently computes
the route for each traffic record and sums up the amount of traffic routed over each
link. The result of the traffic assignment can then be listed in a table or displayed
graphically as a traffic density chart.
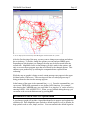
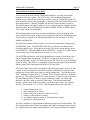
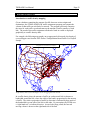
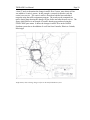
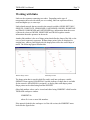
For example, the following map graphs, on an aggregated rail network, the density of
covered hopper cars from the 2001 Surface Transportation Board Public Use Waybill
Sample.
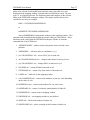
Geographic Flow of Loaded Covered Hoppers
Traffic density chart of covered hopper cars on an aggregated rail network
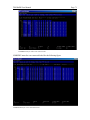
In a traffic density chart, the amount of traffic on each network link is shown as a
bandwidth around the link, where the width of the band is proportional to the amount
of traffic. The relative proportion of traffic by direction is indicated by how much of
the bandwidth is on one side of the link or the other. By convention, the PTNM uses
a “right-hand rule” to indicate direction. As one looks along a link, the forward
moving volume is drawn on the right-hand side of the link.
TRGRAPH User Manual
Page 43
A traffic density chart can show: a single traffic flow, a single traffic flow with the
maximum (headhaul) and minimum (backhaul) volumes on a link in different colors
or line-types, multiple traffic flows, or changes in flow (gains and losses).
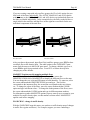
Format of input data
The link volume matrices used by MapMaker have link numbers in the first column
followed by one or more two-column groups of link volumes called flow groups. An
example of a flow record looks like this:
1031
40
0
1900
0
This record is a result of flowing a set of traffic volume data with two volumes
associated with each record. The numbers represent the following:
1031
40
0
1900
0
link number
volume 1 in forward direction on link 1031
volume 1 in backward direction on link 1031
volume 2 in forward direction on link 1031
volume 2 in backward direction on link 1031
Refer to ALKFLOW, and OPTFLOW User Documentation, for more information on
creating a flow file from origin-destination data.
FLOW - simple traffic density chart
With the FLOW map edit menu, you can draw a traffic density map of a single traffic
flow. From the screen definition menu, press PF10 or type the word FLOW to select
the map edit menu for a traffic density chart. After you select the pane, press PF8 to
edit the menu. The FLOW map edit menu looks like this.
TRGRAPH User Manual
Page 44
The FLOW map edit menu
Creating a traffic density chart
Before creating a traffic density chart, you must enter in the menu the name of the
network that was used to flow your input flow file. The default network is the
network loaded in the workspace. If a network is not loaded in the workspace or you
would like to change the default, move the cursor to the menu line Network Name and
either type over the default, or use PF10 to select a network.
Enter the name of your input flow file on the menu line Flow file. The default flow
file is the most recent one on your disk. To pick another file from those on your disk,
place the cursor on the menu line for Flow file and press PF10. You can see the
number of flow groups in the flow file and what carriers are in the network by
pressing PF2. The default flow group number is 1. The default for the Carriers
option is 0 which selects the volumes for all carriers to be shown. Carriers are
entered in this menu using the standard TRGRAPH nomenclature described earlier in
this manual under the heading “Network mapping”.
After you choose the network and flow file, press PF12 to draw a traffic flow map of
the chosen flow group using the rest of the supplied defaults, or to redraw the map
after changing any of the defaults.
After the first drawing of the map, you can use PF8 to see unit-mile statistics on all
the flow groups for the carrier(s) you have selected.
TRGRAPH User Manual
Page 45
Choosing nodes to label
After the traffic density map is drawn for the first time, you can choose which nodes
to label using IDENTIFY. The IDENTIFY menu lets you interactively choose nodes
using the graphic cursor. First, move the cursor to the City labels option and type in
the word MANUAL. Then press PF5 to invoke the IDENTIFY menu. Refer to the
NET map edit menu section “Node attributes and how to show them” for more details
on how to use IDENTIFY.
Choosing links to label
After the traffic density map is drawn for the first time, you can choose which flows
to label using GETLINKS. The GETLINKS menu lets you interactively choose links
using the graphic cursor. To invoke GETLINKS, move the cursor to the Flow labels
option and type in the word MANUAL. Then press PF6 to invoke the GETLINKS
menu. Refer to the NET map edit menu section “Link attributes and how to show
them” for more details on how to use GETLINKS.
Other options on the flow map menu
When graphing very large volume matrices, the number of links with volumes is so
large that the result produced can be illegible due to links and volumes overwriting
one another. You can aggregate adjacent links with near-identical volumes and/or
eliminate those links with volumes less than a certain percent of the maximum to
make the map more readable. The number of unique volume boxes or bands drawn
can be reduced by aggregating links. You can choose to aggregate adjacent links by
changing the default to YES for the option Aggregate similar adjacent flows. The
Minimum pct of max flow to show option, can be used to eliminate volumes less than
a percentage of the maximum volume. For example, if you leave the default
minimum percent at 1 and the maximum flow in your input file is 4800 units, then
any flow less than 48 units will not be shown.
Choose FILLED for the option Open or filled flows to fill in the flow boxes with fill
colors or patterns. If you choose OPEN, the flows will be drawn as outline boxes.
The AUTO choice will determine whether or not to fill the flow boxes based on the
workstation type you are using.
Choose YES for the option Unit-miles in legend to calculate the number of unit-miles
and display the total in the legend.
MAPSETUP options used in flow mapping
Press PF9 to invoke the MAPSETUP options menu. To change the color in which
the flow is drawn, move your cursor next to the FCOLOR option and type over the
default with a different color. You can also change the fill pattern for filled flows
using the FILL PATT option. Move your cursor next to the FILL PATT option and
type over the default with a different fill pattern. The fill pattern values range from 1
to 15.
TRGRAPH User Manual
Page 46
You can highlight the directionality of a flow by drawing the maximum and minimum
flows on a link in different colors. You can do this by specifying two different colors
for the FCOLOR option, separated by a slash (/). For example, if you type in
GREEN/RED for the FCOLOR option, the maximum volume on each link will be
filled in green and the minimum volume on each link will be filled in red. On
monochrome workstations and printers, different shades of gray will correspond to
each color designation.
The flows in MapMaker are drawn with either automatic or manual scaling. With the
AUTOSCALE option as 1, MapMaker will automatically scale the width of the
largest flow volume. If you set the AUTOSCALE option to 0, scaling will be
determined according to the value in the MAXVOL parameter. By adjusting the
MAXVOL parameter, the width of the largest box on the map can be increased or
decreased as desired. For example, if you have set up a multiple-pane screen and
wish to draw flows at a common scale in all panes, set the AUTOSCALE option to 0
for manual scaling after drawing the first pane. The flows in the rest of the panes will
be drawn with respect to the maximum volume of the flow in the first pane.
Three MAPSETUP parameters, DOLLAR, CUTLAB, and OUTLAB can be used to
control flow labeling. The DOLLAR option lets you control whether or not to place a
dollar sign ($) before the flow values on the map and in the legend. Set this option to
1 if you want the dollar sign drawn. If you set the CUTLAB option to 1, labels will
be suppressed on links which are too short for the label to fit. If the OUTLAB option
is 1, labeling of flows will be forced outside of flow boxes; if the OUTLAB option is
0, labeling will be made inside the flow boxes if it can fit there.
FLOWMULT - multiple traffic densities on one chart
With the FLOWMULT map edit menu, you can draw a traffic density map of multiple
traffic flows, stacked either on top of or adjacent to each other on a link. For
example, you can show: loaded and empty equipment flows on one map, flow of a
commodity as a portion of total flow, or flow of several equipment types on one map.
Use a multiple flow map whenever you want to see the individual components of a
total flow as well as the total on one map. From the screen definition menu, press
PF10 or type the word FLOWMULT to select the map edit menu for a traffic density
chart of multiple flows. After you select the pane, press PF8 to edit the menu. The
FLOWMULT map edit menu looks like this:
TRGRAPH User Manual
Page 47
The FLOWMULT map edit menu
Creating a density chart showing more than one flow
The FLOWMULT menu can show two or more flows from one or two flow files on
the same map. Enter the name of the first flow file on the menu line Flow file and
the flow group number on the menu line Flow groups(s), innermost first. To show
other flows from the same flow file, enter each additional flow group number next to
the number selected as the innermost flow group. These flows will be drawn
consecutively after the first one. To show flows from a second flow file enter the
name of the second flow file on the menu line Add'l flow file and enter each additional
flow group number on the menu line Flow grp(s) for add'l. file. These flows will be
drawn outermost. You are not limited in the number of flows you can show
simultaneously with the FLOWMULT menu, but if you try to show too many flow
groups on one map, the map will be cluttered and unreadable.
The order of stacking has a big effect on the appearance of a map. Changing the order
of the flow groups may produce a map that better represents your data and better
fulfills your purpose for showing it. After producing your first map, try changing the
order of the flow groups to see whether that improves the appearance of the map.
Before creating a multiple flow map, you must enter the name of the network that was
used in the traffic assignment program to flow both input files. The default network
is the network loaded in the workspace. If a network is not loaded in the workspace
or you would like to change the default, move the cursor to the menu line Network
Name and either type over the default, or use PF10 to select a network.
You can cumulate flows (display the second group outside the first), or overwrite
flows (draw the first flow on top of the second). The default for the Cumulate or
Overwrite option is cumulate. In the following example, the image on the right shows
TRGRAPH User Manual
Page 48
loaded and empty flows of plain boxcar movements using cumulate and the one on
the right shows the same flows using overwrite.
Multi-flow map using cumulate
Multi-flow map using overwrite
With the Flow labels option set to AUTO, important total flows are labeled
automatically on the map. To change which flows are labeled, change the Flow labels
option to MANUAL and press PF6. This will invoke the GETLINKS menu that lets
you interactively choose flows using the graphic cursor. To label all total flows on
the map, change this option to ALL.
TRGRAPH User Manual
Page 49
If you are creating a map with only two flow groups, the Flow labels option lets you
label each of the flows individually. The AUTO2, MANUAL2, and ALL2 choices
work the same as the AUTO, MANUAL, and ALL choices except that both flows on
the links are labeled individually. In the example below, the flows on the left have a
single label for the total flow and the flows on the right have two labels for the two
individual components of the total flow.
17
7
5
12
15
24
One flow label
11
4
5
12
12
12
Two flow labels
After you choose the network, input flow file(s) and flow groups, press PF12 to draw
a multiple flow traffic density chart. The other options in the FLOWMULT pane
menu work the same as in the FLOW pane menu. To change a default, type over it,
or use PF10 to pick from permitted values. Press PF12 to redraw the map after
changing any of the defaults.
MAPSETUP options used in mapping multiple flows
Press PF9 to invoke the MAPSETUP options menu. You can use the
IDENTIFICATION field of MAPSETUP to identify the different flows on the map.
You can change the text, color and fill pattern of each identifier. To enter text, move
the cursor underneath the IDENTIFICATION area and type. The first line
corresponds to the innermost flow, the second line corresponds to the next closest,
etc. To change the colors of the flows, move the cursor underneath the COLOR
option and type in different colors. To change the shade patterns of the flows, move
the cursor underneath the PATRN option and type in different pattern numbers.
For information on other MAPSETUP options you may want to use to customize your
multiple flow traffic density chart, see this manual's section called “MAPSETUP
options used in flow mapping”.
FLOWCHNG - change in traffic density
With the FLOWCHNG map edit menu, you can draw a traffic density map of changes
in traffic flows (gains and losses). For example, suppose you were conducting a
TRGRAPH User Manual
Page 50
“what if” study to determine the change in traffic flow if a new, more direct rail line
was added to a carrier's system. In this example, a network is edited to code the
carrier's new service. The carrier's traffic is flowed on both the base and edited
networks using the traffic assignment program. The results can be compared in a
traffic density map showing the changes in flow before and after the new service. The
figure which follows is an example of a traffic density map produced using the
FLOWCHNG pane menu. It shows the changes in traffic flow on the Norfolk
Southern system due to the addition of a rail line from Centralia, Illinois to Corinth,
Mississippi.
Traffic density chart showing changes in flow on the Norfolk Southern system
TRGRAPH User Manual
Page 51
From the screen definition menu, press PF10 or type the word FLOWCHNG to
select the map edit menu for a traffic density chart of changes in traffic flows. After
you select the pane, press PF8 to edit the menu. The FLOWCHNG map edit menu
looks like this:
The FLOWCHNG map edit menu
Creating a map of changes in traffic density
The FLOWCHNG menu computes the difference between flow groups in the same or
different flow files. Enter the name of the before flow file on the menu line Before
flow file and the flow group number as the first entry on the menu line Before and
after flow groups. Enter the name of the after flow file on the menu line After flow
file and the flow group number as the second entry on the menu line Before and after
flow groups. If both flow groups are in the same file, enter the same flow file name
for both the before and after flow files.
The difference in flows will only make sense if the same unit of measure is used in
both flow groups (i.e. trailers vs. trailers, or tons vs. tons).
Whether the gains or losses are drawn last (drawn on top) may affect the appearance
of the map. Changing the order may produce a map that better represents your data.
To control which flow is drawn on top, enter the word LOSSES or the word GAINS
on the menu line Flow to draw on top.
TRGRAPH User Manual
Page 52
After you choose the network, input flow file(s) and flow groups, press PF12 to draw
a map of changes in traffic density. The other options in the FLOWCHNG pane menu
work the same as in the FLOW pane menu. To change a default, type over it, or use
PF10 to pick from permitted values. Press PF12 to redraw the map after changing
any of the defaults.
MAPSETUP options used in mapping the change in flows
Press PF9 to invoke the MAPSETUP options menu. You can use the
IDENTIFICATION field of MAPSETUP to customize how the gains and losses are
identified on the map. You can change the text, color and fill pattern of each. To
enter text, move the cursor underneath the IDENTIFICATION area and type. The
first line corresponds to the flow drawn first and the second line corresponds to the
flow drawn last (on top). To change the colors of the flows, move the cursor
underneath the COLOR option and type in different colors. To change the shade
patterns of the flows, move the cursor underneath the PATRN option and type in
different pattern numbers. If you press PF1 (Help) with the cursor in one of these
fields, additional help (such as color choices) will be given on the screen.
For information on other MAPSETUP options you may want to use to customize your
traffic density chart of flow changes, see section in this manual under the heading
“MAPSETUP options used in flow mapping”.
Advanced use of the MAPSETUP options menu
Each MapMaker pane includes a default legend that you can customize using the
MAPSETUP options menu. Specific MAPSETUP options which will customize
legends for particular map types are described in the section for that map type. The
section which follows describes ways to make more advanced use of the MAPSETUP
options menu to customize any map legend.
Customizing the legend
You may want to add your initials to the map legend so that a person reading the map
will know what person created it. Using the MAPSETUP options menu, you can add
your initials under the legend border next to the date. Move the cursor next to the
word INITIALS and type in your initials. Next time the map is drawn, your initials
will appear on the map. If you prefer not to add your initials and to have the date
removed, enter NO for the INITIALS option.
On some maps, there may not be any area of unused space large enough to draw the
legend without drawing the legend on top of the political boundaries. This can cause
a legibility problem. In this case, you can place the legend flush in a corner by setting
the FLUSH option to YES. Next time the map is drawn, the political boundaries that
would have been drawn in the legend area will be clipped off around the legend box.
TRGRAPH User Manual
Page 53
You may also want to change what corner MapMaker has selected to place the legend.
To do this, move the cursor to the CORNER option and type in the number that
represents your desired choice: 0 for top center, 1 for lower left, 2 for lower right, 3
for upper right, 4 for upper left, and 5 lets you choose the location using the graphic
cursor. If you type in 5, the graphic cursor will immediately appear for you to use in
positioning the legend. Follow the menu instructions which apply to your workstation
type.
You can control the width of the empty space between the legend and the border with
the GUTTER option. If you increase the default value, you increase the width of the
gutter. If you decrease the default value, you reduce the width of the gutter.
The size of labels drawn on a map are controlled with the LAB SIZE option. The size
parameter is a fraction of the standard lettering size. You can specify the font to use
for labels using the LAB FONT option.
The particular fonts which are shown on your workstation or hard-copy device may be
different than the requested font because of hardware limitations. You can always get
a requested font by setting the value of the PLOT option to 1, but this may greatly
increase the amount of time needed to redraw the map, since it will force each
character to be drawn as a series of vectors.
The LINESPACE option controls the spacing for line-types and fill patterns on pen
plotters. A value of 1 is adequate for normal size plots, but should be decreased to
.25 for wall size maps. The PLOT option, if set to 1, generates all filling and
characters using vectors. This will be automatically set to 1 when creating pen plots,
otherwise this value should be 0.
The FEATURE option, which is at the top center in the MAPSETUP options menu,
may be used to alter the set of fields displayed by MAPSETUP in order to
accommodate different map types.
Previewing the legend within MAPSETUP
You can preview what changes you have made to the legend without leaving
MAPSETUP and without redrawing the entire map. Press PF9 within MAPSETUP
to invoke a menu that looks like this.
Legend, border, crest, and scale options in MAPSETUP
TRGRAPH User Manual
Page 54
Select SHOWLEGEND from this menu to draw your legend using the most current
option settings. If you made an adjustment to the gutter size and wanted to check the
result, you could select BORDER to draw a border around your map. Or, if your
legend is flush in the corner, you could select LBORDER to draw an “L-shaped
border” around your map.
Selecting LOCATESCALE lets you place a scale of miles (or kilometers) at any place
on the pane. The size of the scale box can be controlled by changing the SCALE
SIZE option in the MAPSETUP options menu.
TRGRAPH User Manual
Page 55
Advanced functions in the screen definition menu
You can return to the screen definition menu by pressing PF3 from any of the map
edit menus. Once you have finished editing panes, you may want to save the panes on
disk, save the screen definition on disk, or create hard copies. You can do any of
these things from the screen definition menu.
Redrawing the entire screen
You can draw or redraw the contents of a screen by pressing PF12. This will redraw
all panes on the screen.
Saving your work
The MAPSETUP options can be saved by entering
SAVEMAP legendname
The options are saved in the C:\PTNMW folder as legendname.mst file. To load the
map options, function loadmap can be used as follows:
LOADMAP legendname
Making a hard copy
When in MapMaker, you can generate a hard copy of the screen at any time by
pressing PF2 in the screen definition menu. Pressing PF2 invokes a menu that looks
like this:
Hard copy options in MapMaker
There are three ways to generate a hard copy of the contents in the Mapping Window.
They are explained below.
1. Print to attached printer: Select Print from the Map pull down menu at the top
left corner of the Mapping Window. Option Select Printer lets you change
printer.
2. Create Adobe Acrobat file: Select option PS from the menu. Type full path
name (including extension .ps) for the file. Once the file is created, use Adobe
TRGRAPH User Manual
Page 56
Distiller to convert to a .pdf file format. This file could be viewed and printed
using Adobe Acrobat.
3. Screen capture: Make sure that the Mapping Window is displayed on top.
Press CTRL+ PrintScreen to capture the contents of your monitor screen.
Open Microsoft Word or Powerpoint, and paste it on an empty page. Some
picture editing (Format Picture) might be necessary. This is a quick and easy
method for users who do not have Adobe Acrobat suite, but the quality of the
images is compromised.
Exiting from the screen definition menu
To exit from the screen definition menu, press PF3. This will return you to the
TRGRAPH main menu.
TRGRAPH User Manual
Network Data
Page 57
TRGRAPH User Manual
Page 58
Network Storage
The network attributes that constitute a transportation network are stored in APL
variables that are brought to the workspace when a network is loaded. The networks
share the variable names (for example, link distances are always stored in DIST);
hence, only one network can be loaded to the workspace at one time. However, the
user can open multiple instances of APL, load TRGRAPH in each of them and load
different networks to view them simultaneously.
Recent modifications to the PTNM have resulted in two versions of rail networks.
The new version contains additional network features such as smart drawing level
(SDLEVEL) and shape points for links. TRGRAPH can handle both versions of the
network, but includes certain functions that are specific to the new version. A call to
such a function with an older network will exit with an error message.
Table 1 below lists and briefly describes the required variables for rail networks. They
correspond to both old and new versions of the network. Tables 2 and 3 list optional
variables and additional variables for new network respectively.
Table 1: Required PTNM Rail network variables
Variable Name
COORD
Type
Matrix
Dimensions
(nodes,2)
DIST
Vector
links
FAMILIES
Matrix
varies
LINKOWNER
Vector
links
LINKS
Matrix
(links,2)
Description
Nth row holds (x,y) coordinates for the
nth node.
Col 1: x-coordinate
Col 2: y-coordinate
Nth element holds distance for the nth
link. Values are miles in integer
tenths of miles.
Each row defines a group of railroads
that are a corporate family and/or have
coordinated service. Variable has as
many rows as necessary to hold all
groups. Variable has as many
columns as necessary to hold the
largest group.
Nth element holds code number for the
railroad that owns the track for the nth
link. For links with multiple owners, it
has the index (1000*starting row
number + number of rows) into the
PARTOWNER matrix.
Nth row holds node pair for the nth
link.
Col 1: A-node number
Col 2: B-node number
TRGRAPH User Manual
Page 59
MLC
Matrix
(6,links)
OWNER
Matrix
(n,links)
RRACTIVE
Vector
999
RRALPHAS
Matrix
(1000,4)
RRNAME
Matrix
(1000,n)
RRWINDOWS
Matrix
(999,4)
SHORTLINE
Vector
of
vectors
varies
TRANS
Vector
999
LINKSTATE
Vector
links
Each row holds MLC (mainline code)
values for a service type. Nth column
holds values for the nth link. Service
types and associated row are:
1 – General Merchandise
2 – Intermodal
3 – Coal/Bulk
4 – Auto Racks
5 – Double stack
6 – NS (special codes to support
custom software developed for NS)
For the n largest railroads, each row
holds 1’s (yes) and 0’s (no) indicating
whether the railroad operates on the
link. See TRANS variable to identify
the railroad associated with each row.
Nth element holds 1 (yes) or 0 (no)
indicating whether nth railroad is
active in the network.
(N+1)st row holds character
abbreviation for nth railroad.
(N+1)st row holds name for nth
railroad.
Nth row holds coordinates for a map
frame that nicely holds the nth railroad.
Col 1: start x-coordinate
Col 2: x-coordinate range
Col 3: start y-coordinate
Col 4: y-coordinate range
Each element holds a vector of link
numbers on which a railroad can
operate. See TRANS variable to
identify the railroad associated with
each element.
Nth element is a pointer to OWNER or
SHORTLINE for the nth railroad.
Values 1-999 are pointers to the kth
row of OWNER. Values 1001+ are
pointers to elements of SHORTLINE.
(Pointer is value minus 1000).
Nth element holds 2-digit FIPS code
for state in which nth link is located.
TRGRAPH User Manual
Page 60
Table 2: Optional PTNM Rail network variables
Variable Name Type
Dimensions Description
Abbreviation for distance units to use
DISTTYPE
Vector
2
for map labeling and text reports.
Holds node numbers for prominent
locations to use for labeling on maps.
KEYNODES
Matrix
(varies,2)
Col 1 – node number.
Col 2 – importance factor (1-9).
Nth element indicates bi-directional or
unidirectional train operations
permitted on the nth link. Values are:
LINKDIR
Vector
links
0: unidirectional in A-node to B-node
direction.
1: bi-directional.
Conversion factor for screen
MILERATIO
Scalar
null
coordinate units to miles
Name of function to use as default for
NETBNDS
Vector
varies
geographic boundary display on maps.
Holds default values to use during
process of adding links to a network.
Elements are:
1 – Default MLC value
2 – Default LINKSTATE value
NETDFLTS
Vector
5 or 6
3 – Default railroad for new links
4 – Default RNUM value (used in
highway networks)
5 – Default LINKDIR value
6 – Default SDLEVEL value (new
version of rail network)
Table 3: Additional variables for new PTNM Rail network
Variable Name Type
Dimensions Description
SDLEVEL
Vector
links
Nth element holds the Smart Drawing
Level for nth link. Values may be 1,2
or 3
NIV
Vector
nodes
Nth element contains an importance
number (0 – 9999) that has been
assigned to nth node. This represents
the distance from the node to the next
more important node
OPIMP
Vector
nodes
Nth row holds node operating
importance info for nth node. Values
may be 0-9
SIZEIMP
Vector
nodes
Nth row holds node size importance
info for nth node. Values may be 0-9
TRGRAPH User Manual
Page 61
LOPVAR
Matrix
(varies,10)
PARTOWNER
Matrix
(varies,3)
SHAPEFLAG
Scalar
null
Holds Carrier Specific Link Attributes
1 – Link ID
2 – Carrier ID
3 – Type of Operation (1 – trackage
rights; 2 – haulage rights)
4 – MLC 1
5 – MLC 2
6 – MLC 3
7 – MLC 4
8 – MLC 5
9 – MLC 6
10 – Direction Flag
Note: This variable has Carrier
Specific Attributes for secondary
carriers (with operating rights), not for
primary carriers (owners).
Holds the Owner information for links
with multiple owners
1 – Link ID
2 – Carrier ID
3 – Percentage Ownership (2 digit
integer)
Note: ensure total % per link is 100
Indicates if Shape Data is available for
network
0 – No
1 – Yes
In addition to the APL variables, some network data are stored as separate files on
disk. The file names are stored in variables, mentioned below along with a description
of their contents.
Node Names File (*.nms)
Network variable name: NAMEFILE
Field
1
2
Length Description
13
City Name
2
State/Province Abbreviation
Note: (n+1)st record of file holds node name for nth node.
TRGRAPH User Manual
Page 62
Stations File (*.spl)
Network variable name: SPLCFILE
Field
1
2
3
4
5
6
7
Length
6
3
5
13
2
5
9
Description
SPLC Code for Station
Railroad Code for Station
FSAC Code for Station
Station Name
State/Province Abbreviation
Node Number
ERPC
Note: Railroad Code/FSAC Code combination is unique key for file. File is sorted by
SPLC Code.
Rule 260 Master File (jct*.260)
Network variable name: JCTFILE
Field
1
2
3
4
5
6
Length
5
6
27
2
5
1
Description
Rule260 Junction Alpha
SPLC
Junction Name
Junction State Abbreviation
Node Number
Active/Inactive Flag
Shape Data (*.shp)
Network variable name: SHAPEFILE
Field
1
2
Length Description
10
X Coordinate
10
Y Coordinate
Node/SPLC Index File (*.sp4)
Network variable name: NSFILE
Field
1
2
3
4
5
Length
4
4
4
4
4
Description
SPLC Code (first 4 digits) with a Station Assigned to the Node
SPLC Code (first 4 digits) with a Station Assigned to the Node
SPLC Code (first 4 digits) with a Station Assigned to the Node
SPLC Code (first 4 digits) with a Station Assigned to the Node
SPLC Code (first 4 digits) with a Station Assigned to the Node
Note: nth record holds entry for nth node.
TRGRAPH User Manual
Page 63
Railroad Names File (*.rrn)
Network variable name: RRNFILE
Field
1
Length Description
x
Railroad Name (full spelling)
Note: File has 1,000 records. (n+1)st record of file holds railroad name for nth railroad
(based on AAR railroad code number).
Shape Pointer File (Shp*.ptr)
Network variable name: SHPPTRFILE
Variable Name
SHAPE∆POINTER
Type
Vector
Dimensions
links
Description
Nth element is a pointer to the
Shape Data file for the nth link.
Value is the (starting row
number*100) + (number of
rows)
Pointers File (*.ptr)
This file holds a group of APL variables in APL-encoded format.
Network variable name: POINTFILE
Variable Name
SPLC∆POINTER
Type
Vector
Dimensions
9999
SPLC∆PTR2
Vector
100
SHAPE∆POINTER
Vector
links
RR∆POINTER
Binary
Matrix
1000,100
GEO∆STATEALPHAS
Matrix
57,2
Description
Nth element is a pointer to the
Stations File for the nth 4-digit
SPLC. Value is the (starting
row number*1000) + (number
of rows).
Nth element indicates the
beginning record number and
number of records for that 2didgit SPLC in the
SORTSPLC file
Nth element is a pointer to the
Shape Data file for the nth link.
Value is the (starting row
number*100,000) + (number
of rows)
Position of ‘1’s in the nth row
indicates the 2-digit SPLCs
served by the (n-1)th railroad
Nth row contains the 2
character state abbreviation for
that LINKSTATE in US
TRGRAPH User Manual
Page 64
CAN∆STATEALPHAS
Matrix
13,2
MEXALPHA
Matrix
33,2
Nth row contains the 2
character state abbreviation for
that (LINKSTATE-80) in
Canada
Contains the 2 character state
abbreviation for that States in
Mexico – not used currently
TRGRAPH User Manual
Page 65
TRGRAPH User Manual
Network Editing
Page 66
TRGRAPH User Manual
Page 67
Introduction to Network Editing
TRGRAPH workspace contains many APL functions that can be used to modify and
update PTNM rail, highway, and waterway networks, as well as create and edit other
transportation networks.
What is Network Editing
Network editing constitutes altering the contents of any of the variables or disk files
mentioned in the previous chapter. There are several ways to edit a network. You can
edit the variables directly from the TRGRAPH workspace window using either APL
primitive operators or functions (refer to Chapters 3 and 4 in the Language Reference
User Manual for Dyalog APL/W) or user-defined APL functions.
Variables could be written to text files using READFIX, and edits could be made
using text editor applications such as NotePad or TextPad. These files could be read
back into APL variables using WRITEFIX.
However, a popular and less-clumsy way to browse and edit network attributes is by
using user-friendly TRGRAPH functions, mentioned in the following sections.
Uses of Network Editing
With the network-editing functions, you can input proposed changes to a
transportation system in order to assess the costs and benefits of your proposals. For
example, a new rail line could be added to a rail carrier's system, permitting a “whatif” analysis of resulting changes in traffic flow.
The functions also provide a mechanism to input important network changes prior to
receiving the next PTNM update. These include temporary changes, such as a track
washout or a bridge collapse, as well as permanent changes, such as the opening of a
new interstate highway.
Loading a network
A pre-existing network can be loaded to the workspace using any of the following
ways:
1. Use function LOADNET. If you know the name of the network to be loaded, type
LOADNET netname
where netname is the name of the network, without the prefix RWY/HWY/WWY.
2. Use function PICKNET. If you do not know the exact name of the network that you
want to load, type
TRGRAPH User Manual
Page 68
PICKNET
This opens a pick file menu, and lets the user browse and pick a network file for
loading. The network file names have prefix RWY/HWY or WWY to indicate type of
network, and they have file extension “.ntw”.
3. Use Mapping Window. Choose Load Network from File drop down menu at the
top left corner of the Mapping Window for a call to function PICKNET.
Saving a network
To save a network from the workspace to a disk file, call function SAVENET. A file
save box opens and lets user choose directory and file name for the network. If the
user-entered filename already exists, it prompts the user before replacing it with the
new network. Alternatively, Save Network option from File drop down menu in the
Mapping Window could be used for the same.
Controlling the screen display
Following are the functions that let the user change display on the Mapping Window.
They can be called from the TRGRAPH workspace window, from the command line
of any PTNM tool, or from a user-defined APL function executed in TRGRAPH
workspace.
ZOOM
ZOOM allows you to dynamically change the geographic area shown on the screen.
A small rectangle appears in the Mapping Window, which can be moved with the
mouse. Choose a rectangular area by clicking the mouse once from one of the corners
and again from its diagonally opposite corner. The image on the Mapping Window
will be redrawn with this zoomed-in area, keeping the aspect ratio constant.
RETREAT
RETREAT will enlarge the virtual window area by a factor of 2. The area just
outside the window edges can be viewed.
ADVANCE
ADVANCE will reduce the virtual window area by a factor of 2. The central part of
the screen is enlarged and the area near the window edges will disappear from view.
REFRESH
REFRESH allows you to redraw the screen, incorporating any changes that you have
made. For example, if you change any of the parameters on the map edit menu, a call
TRGRAPH User Manual
Page 69
to REFRESH permits you to see the results of your changes. This function can also be
called using PF12 key from any PTNM tool menu.
ERASE
ERASE clears the Mapping Window. This function can also be called from the Map
pull down menu in the Mapping Window.
TRGRAPH User Manual
Page 70
Working with links
Links are the segments connecting two nodes. Depending on the type of
transportation network with which you are working, links can represent rail lines,
roads and highways, or waterways.
Links related network data are stored in the network variables LINKS, DIST, MLC,
SDLEVEL, LINKSTATE, LINKOWNER, PARTOWNER, OWNER, SHORTLINE
and TRANS. LINKOWNER and PARTOWNER have information about the owner
of the tracks, whereas OWNER, SHORTLINE and TRANS together contain
information about the operators on the tracks.
Another link attribute is the set of shape points that define the shape of the link, or the
curve of track segment it represents. Without shape points, links are displayed as
straight lines, whereas, links displayed with shape points reflect the actual shape of
tracks. The following figures illustrate this.
Without Shape Points
With Shape Points
The shape point data is stored in disk files, and is read into workspace variable
SHPMAT when required. SHAPEFLAG variable indicates if shape data is available
for the network. ∆SHAPESON is assigned 1 to display links with shapes points.
Shape points can be edited using function SHPEDIT.
Other link attribute values can be viewed and edited using LINKEDIT called from the
TRGRAPH workspace window.
LINKEDIT lks
where lks is one or more link numbers.
If the network loaded in the workspace is of the old version, the LINKEDIT menu
looks like the figure below.
TRGRAPH User Manual
LINKEDIT menu for old version rail networks
LINKEDIT menu for a new network looks like the following figure.
LINKEDIT menu for a new railroad network
Page 71
TRGRAPH User Manual
Page 72
To edit any attribute for a link, place cursor in the corresponding field and change its
value. To change an attribute for all links displayed in the window, place cursor in
first row (Link field value is ALL) of corresponding field and type the new value.
LINKEDIT makes changes to the network variables in the workspace. The
network has to be saved before exiting workspace, or the changes will be lost.
Links can be selected for editing using the GETLINKS tool.
GETLINKS linkset
displays a menu next to the mapping window and lets the user manually select
links from the set of links linkset. With the help of the mouse, the user chooses links
to be selected (or discarded from selection) using a movable cross-wire displayed on
the mapping window. Selected links are highlighted in magenta, and discarded links
are shown in black. The user types ‘E’ to complete selection. The function returns the
link numbers of the selected links to the TRGRAPH workspace window. The output
could be directed to a variable for use later, for example
LKS ← GETLINKS LINKSINWIN
or
LINKEDIT GETLINKS LINKSINWIN
where LINKSINWIN is another TRGRAPH function that selects all links in
the virtual mapping window. This and other functions used for link related network
editing are listed below:
1. rr ADDLINKS lks – adds links lks to carrier rr
2. rr ADDNEWLINK nds – creates a new link on rr between pairs of nodes nds
3. ASSIGNDIST lks – assigns distance to links lks based on straight-line
4. CHLINKS nds – returns links connecting nds
5. rr DROPLINKS lks – drop links lks from carrier rr
6. GETSHP lks – returns shape points for links lks. The output is a four column
matrix with the following format:
Link# Shape Point# X-coordinate Y-coordinate
The coordinates of end nodes are also included at the top and bottom of each
set of shape points for the link arranged in a sequential manner from Node A
to Node B. Node A is the first element of the corresponding row in variable
LINKS, and Node B is the second element in the same row. If a link AB has
five shape points, there are seven records in the output. The first record has
TRGRAPH User Manual
Page 73
Shape Point# as 0 and has the coordinates for node A. The following five
records have coordinates for shape points 1 to 5. The last record has Shape
Point# 6 has the coordinates for Node B.
The read shape points are saved in the global variable SHPMAT in order to
save time during subsequent reads of the same data. Changes to this variable
can be committed to disk using function SAVESHP.
7. LABELDIST lks – labels link distances of links lks
8. LABELINKS lks – labels link numbers of links lks
9. LINKSINWIN – returns links in mapping window
10. LINKSONRR rrs – returns links on carriers rrs
11. SELECT rrs – returns link on carriers rrs
12. SHOWLINKS lks – displays links lks. If ∆SHAPESON is 1 and if
SHAPEFLAG is 1, this function displays links with shapes points. The default
value of ∆SHAPESON is 0 in TRGRAPH workspace. SHAPEFLAG is a
network variable and is loaded with the network.
13. SHPEDIT lks – displays and lets user edit shape points for links lks. This
function edits the Shape Data file on disk directly. Hence, it is prudent to keep
a backup of the disk file before calling this function. However, the
SHAPE∆POINTER variable has to be saved separately using function
SAVESHP∆PTR before exiting workspace. If you save the file with a
different name, update the SHPPTRFILE variable before saving the network.
14. SPLITLINK lk – lets user manually split link lk
A complete list of TRGRAPH functions is available in last chapter of this manual. An
example of a network edit process is given in the last section of this chapter.
TRGRAPH User Manual
Page 74
Working with nodes
Nodes represent points, such as cities, junctions, intersections, and ports on the rail,
highway, and waterway networks.
Node related network data are stored in variables COORD, NIV, OPIMP and
SIZEIMP. Node names, station and junction information are stored in separate files
on disk.
The node attribute variables can be viewed and edited using function NODEEDIT,
similar to LINKEDIT. The variables are updated in the workspace and will be lost if
the user exits from workspace without saving network. Changes made to the City and
State names are restricted to the workspace. To change node names permanently, the
Node Names file on disk has to be edited.
The figure below shows the NODEEDIT menu.
NODEEDIT menu
Nodes can be selected from the Mapping Window using the function GETNODES,
similar to GETLINKS.
GETNODES nodeset
displays a menu next to the mapping window and lets the user manually select
nodes from the set of nodes nodeset. With the help of the mouse, the user chooses
TRGRAPH User Manual
Page 75
nodes to be selected (or discarded from selection) using a movable cross-wire
displayed on the mapping window. Selected nodes are labeled on screen. The user
types ‘E’ to complete selection. The function returns node numbers of the selected
nodes to the TRGRAPH workspace window. The output could be directed to a
variable for use later, for example
NDS ← GETNODES NODESINWIN
or
NODEEDIT GETNODES NODESINWIN
where NODESINWIN returns nodes numbers in the mapping window. This
and other node related functions helpful in network editing are listed below. These
functions can be called from the TRGRAPH workspace window or from the
command line of any PTNM tool.
1. ADDNEWNODES – add new nodes using menu at user selected cursor
positions
2. ADDNODES c – add new nodes at coordinates c (x,y)
3. fsac CHANGEFSAC nde – moves FSAC fsac to node nde
4. nds CHANGENAME phrases – changes node names for nds to phrases
5. splc CHANGESPLC nde – changes SPLC at node nde to splc
6. CHLINKS nds – returns all links connected to nds
7. GETNAMES nds – returns City, State names of the nodes nds
8. LABEL nds – labels nds in the mapping window
9. code NAMESFOR nds – returns node attributes or just city, state depending
on the value of code
10. NODEFOR names – returns node numbers for city, state names
11. NODEPAIRS lks – returns 2-col matrix (anode,bnode) for links lks
12. NODESINWIN – returns nodes in mapping window
13. NWINDOW nds – sets mapping window to just hold nds
14. SHOW nds – labels node numbers of nodes nds
15. SHOWNODES nds – places a triangle at the locations of nodes nds
TRGRAPH User Manual
Page 76
A network edit process, using the functions described so far, is illustrated in the next
section. A complete list of TRGRAPH functions is available in last chapter of this
manual.
TRGRAPH User Manual
Page 77
Example in network editing
Suppose you want to study the effect of not letting trains with Auto Racks use CSXT
tracks between Newark, DE and Arden, DE. You would do this by creating a second
network with very high MLC values for service type 4 for links between these two
locations, and comparing routes on this network with those on the original.
The following steps illustrate one method of creating the new network.
1. Load TRGRAPH and original rail network (say RWYBASE.ntw)
)LOAD TRGRAPH
LOADNET ‘BASE’
2. Change virtual window to show Delaware and draw US boundary.
STATEWINDOW ‘DE’
USMAP
3. Label the two cities and show CSXT tracks. Zoom in to this area.
LABEL ‘NEWARK DE¨ARDEN DE’
(¨ is generated by pressing Ctrl + 1)
‘RED’ SHOWLINKS LINKSONRR ‘CSXT’
ZOOM
(manually choose the new virtual window to include both cities)
4. If you find that the labels are too small to read, you can change the font size
(default is 0.6) and redraw. You do not have to Zoom again, because the
window remains the same even if you erase the screen.
∆SCL ← 1
ERASE
‘RED’ SHOWLINKS LINKSONRR ‘CSXT’
LABEL ‘NEWARK DE¨ARDEN DE’
5. You might notice that Newark is on a different track than Arden. The reason
for this is that Newark, like many cities, has several nodes with the same
name. To see the correct node, you can display all the station names on CSXT
in the window.
TRGRAPH User Manual
Page 78
LABEL NODESONRR ‘CSXT’
Now you can see another Newark station on the western line that goes through
Arden. To see the exact location of these stations, SHOWNODES is used. It
puts a small triangle at each node.
SHOWNODES NODESONRR ‘CSXT’
6. Choose links to be modified using GETLINKS. A separate menu appears next
to the Mapping Window. Move cross-wires to link using mouse and press
Enter or press Space Bar or left-click mouse to select link. Select the eight
links between Newark and Arden on the western line. Enter ‘E’ after
completing selection.
LKS ← GETLINKS LINKSONRR ‘CSXT’
7. Check if LKS has the correct number of links.
ρLKS
should output 8.
8. View links attributes of the eight selected links.
LINKEDIT LKS
9. Change MLC for Auto Racks service to 99 for these links. Place cursor on the
fourth column of MLC fields for each link and change value to 99.
Alternatively, you can place cursor in the first row (ALL links) and type 99.
This will change the MLC(4) value to 99 for all links in the LINKEDIT
window. Exit LINKEDIT (Press PF3).
10. Save network with new name (say CASE1).
SAVENET
Type CASE1in the field for file name. Network will be saved as
RWYCASE1.ntw.
TRGRAPH User Manual
TRGRAPH command language
Page 79
TRGRAPH User Manual
Page 80
Introduction
TRGRAPH contains its own rich command/macro language, which the experienced
user can use to construct specialized applications or preformed specialized analyses.
The full Dyalog APL/W language is also available to you from the TRGRAPH
workspace window and from the command line on PTNM menus.
A brief introduction of the APL language, along with examples specific to
TRGRAPH workspace, is included in this section.
TRGRAPH User Manual
Page 81
Command syntax
Function arguments
A function is a one-word command which tells the computer to do something (draw a
map, add two numbers, etc.). Some functions have no user inputs (arguments).
These are called niladic, which means “no arguments”. These are entered all to
themselves in a single line. NAMAP is an example of a niladic function:
NAMAP
This function does exactly one thing: it overlaps a map of North America on the
screen, in whatever screen and virtual windows are currently set.
Another group of functions needs a single argument which gives the function
necessary additional information on what to do. These are called monadic, meaning
one (mono) argument. The argument to a monadic function is called a “right
argument” because it is typed to the right of the function name. STATEMAP is an
example of a monadic function:
STATEMAP 'NJ'
This function will draw a map of the state(s) given in quotes as its right argument.
Because of their much greater flexibility, most of the functions in TRGRAPH are
monadic.
In TRGRAPH there are some functions which have both left and right arguments.
These are called dyadic, meaning two arguments. SHADESTATE is an example of a
dyadic function, as it takes state names as its right argument, and a shading parameter
as its left argument:
3 SHADESTATE 'NJ'
Optional left arguments
In some dyadic functions specifying a left argument is optional. In functions where
left arguments are optional, the function assumes a default value for the left argument
if it is omitted. OVERLAY is an example of a dyadic function with an optional left
argument.
OVERLAY 'BNSF'
would draw the Burlington Northern Santa Fe network in the default (solid black)
line-type.
'DOT RED' OVERLAY 'BNSF'
TRGRAPH User Manual
Page 82
would draw the Burlington Northern Santa Fe network with a dotted red line-type.
Using quotation marks to enter character data
In TRGRAPH, you input character data as a string of characters surrounded by single
quotation marks. The single quotation marks on input are punctuation and indicate
the presence of a character. They are not part of the data and so are not displayed
when APL displays the character data. Quotation marks distinguish character data
from function names that are also strings of characters.
If the character you want to enter is itself a single quotation mark, you must double it
and then put it within a pair of delimiting quotation marks. That is, to write a scalar
character quote, you must enter four quotation marks (the character quotation mark
doubled and the required surrounding quotation marks).
Argument syntax
Depending on the function, arguments can be scalars, vectors, or matrices. Some
functions can handle character data and others which perform arithmetic operations
can handle only numerical data. Other functions can handle either character or
numerical data. Many TRGRAPH functions use certain general types of syntax.
These are as follows:
Carriers
Carriers can be entered as arguments in TRGRAPH as follows:
0
All carriers in the network
712 555
Carriers whose numbers are 712 or555
'UP NS CSXT'
Carriers whose initials are “UP”, “NS” or “CSXT”
FAM 'UP'
Family of the carrier whose initials are “UP”
FAM 400 8
Family of the carriers whose numbers are 400 or 8
ALLBUT FAM 'UP'
All carriers EXCEPT the family of “UP”
ALLBUT 802
All carriers EXCEPT the one whose number is 802
States/provinces
States and provinces can be entered as function arguments using the following
varieties of syntax:
'WV'
West Virginia.
'NJFLTX'
New Jersey, Florida, and Texas
TRGRAPH User Manual
Page 83
'NJ FL TX'
New Jersey, Florida, and Texas
'NJ, FL, TX'
New Jersey, Florida, and Texas
46
Arizona and California (which have the FIPS codes
4 and 6 respectively)
'MB'
Manitoba
Links
A network link is a section of railroad track, waterway, or road between two cities
(nodes). A link can be specified by either a unique link number or by the two node
numbers defining the end points of the link. Link numbers can be specified using
scalar, a vector, or a matrix with an odd number of columns, containing the link
number in column one. If links are defined as two node numbers, they must be
specified in a matrix with an even number of columns, containing the A node in
column 1 and the B node in column 2.
14302
Link number 14302
16434 16435
Links numbered 16434 and 16435
1 2 ρ 16434 16435
Link defined by nodes 16434 and 16435
(“rho” is shift-R on the APL keyboard)
LINKSONRR 'NS'
All links on Norfolk Southern
LINKSINWIN
All links in current virtual window
Nodes
Nodes in TRGRAPH represent locations. Each node has a node number, and may
have an associated city name. TRGRAPH functions will recognize either the city
name in quotes or the node number. A spelling helper is available to assist spelling
city names.
16434
Node number 16434.
'CHARLESTON WV'
Charleston, West Virginia.
'PIT* PA'
Cities in Pennsylvania, whose names start
with the letters PIT
'NEWARK NJ,BOSTON MA'
Newark, New Jersey and Boston,
Massachusetts
16434 12999
Nodes 16434 and 12999
TRGRAPH User Manual
Page 84
Draw triplets
The low-level TRGRAPH graphics functions (such as the function DRAW) accept a
type of argument called a draw triplet. The first element of the triplet is a flag, the
second element is an X (horizontal axis) coordinate, and the third element is a Y
(vertical axis) coordinate.
The draw flags are encoded with information when viewed in binary (base 2) form.
The meaning of the right-most binary digit is:
0
move to (on a pen plotter, raise the pen up and move to)
1
draw to (on a pen plotter, lower the pen to the paper and draw to)
Each successive binary digit also means something, such as coordinate system,
relative or absolute, line or pattern style, and color.
Draw triplets can be specified in an array of any shape, but for convenience are
generally stored in matrices with three columns.
There is a class of TRGRAPH functions which can be used to encode information in
the draw flag. Several of these functions are used in the examples which follow:
0 100 150 1 200 300
A line connecting the point (100,150)
with the point (200,300) in the absolute
screen coordinate system
0 100 150 9 100 150
The same line, where the second triplet
contains relative screen coordinates i.e.
relative to the previous triplet, rather
than to the origin (0,0)
'RED' COLOR 0 100 150 1 200 300
The same line, drawn in red
2 LTYP BLINK 0 100 150 1 200 300
The same line, drawn in line style two
(dotted), and blinking (only certain
PTNM workstations support blinking)
Function results
Explicit results
A function returns an explicit result if the function header assigns the result to a
variable using the APL left assignment arrow. The function header is the first line of
the function.
Any of the three function types (niladic, monadic, or dyadic) may return an explicit
numerical or character result that, unless it is assigned to a variable name or used as a
TRGRAPH User Manual
Page 85
right argument to another function, will be displayed on the screen. For example,
LINKSINWIN is a niladic function that returns numbers for network links in the
current window. Used alone, LINKSINWIN will type out on the screen the link
numbers of the links in the current window (this can be a very long list!). More
usefully, LINKSINWIN can be used as a right argument to the monadic function
SHOWLINKS to draw the links in the current window:
SHOWLINKS LINKSINWIN
A whole series of functions which need arguments and return results can sometimes
be strung together to form a meaningful sentence or expression. For example, the
following expression will draw the state of Nebraska in dashed red lines:
DRAW 'RED' COLOR 2 LTYP STATEBNDS 'NE'
Assigning explicit results to variables
A variable is a name that represents a value. The value represented by the variable
may be changed. For example, the variable A may have the value 100 or the value
2.1, depending on what is assigned to it. To assign the variable A a value 100, type in:
A ←100
The symbol “←” is called the assignment arrow. It is left-pointing and can be read
“is assigned”. The expression to the right of the arrow may be any valid APL
expression, including the results of functions which give explicit results. For
example:
A ← LINKSINWIN
would assign to the variable A a vector containing the link numbers of the links in the
current window.
Summary of function syntax
You can look at the function header (first line of the function) to determine its calling
syntax, by comparing it with the following chart:
Syntax
Type of function
Explicit Result
NAMAP
Niladic
No
A ← LINKSINWIN
Niladic
Yes
STATEMAP ST
Monadic
No
A ← STATEBNDS ST
Monadic
Yes
TRGRAPH User Manual
Page 86
N SHADESTATE ST
Dyadic
No
VOL ← RR GETVOL FILE
Dyadic
Yes
The comment at the top of a function will describe what each argument is and
whether the left argument of a dyadic function is optional or not.
TRGRAPH User Manual
Page 87
Writing your own functions
In creating a presentation map, one typically needs to call more than one function. If
the same map or map type is to be drawn over and over again, one can save keying
time by writing a function which will execute several commands by typing in just one
word.
For example, consider the following set of commands which would create a map of
the Burlington Northern Santa Fe railroad with a legend. It is assumed here that the
network is already loaded, the window is already set, and that MAPSETUP has been
called to set the legend parameters:
WINDOW FAM 'BNSF'
USMAP
OVERLAY FAM 'BNSF'
LABELCITIES FAM 'BNSF'
BORDER
SHOWLEGEND
The above commands will be executed when the function is called.
Function editors
Function editors in the Dyalog APL/W environment can be invoked by typing system
command
)ED FNAME
where FNAME is the name of the function to be edited. If function FNAME does not
exist in the workspace, a new function with that name is created. The function is
saved in the workspace by selecting option Fix in the File dropdown menu, or by
exiting the editor after saving (Exit option). Option Abort exits the editor without
saving function.
The function is saved only in the workspace and will be lost if the user exits from the
APL session without saving the function to a disk file using SAVEFN described in
the next section.
Order of Operation
APL has a greater variety of functions than many other programming languages.
Therefore, to avoid complicated hierarchy of order in which operations are performed,
there is no hierarchy. Instead, APL always executes expressions from right to left.
As in other languages, parentheses may be used to change the order of operation.
TRGRAPH User Manual
Page 88
Branching and looping
Both branching and looping can be accomplished in TRGRAPH functions using the
branch symbol →. A branch can be unconditional, always branch to a specific
location or conditional and branch only if a statement is true. The destination location
for a branch (where we are branching to) can be defined in three ways. First, a branch
can be to a statement label (for example, SKIP:). Second, a branch can be to a
specific line number in the program. The problem with using line numbers is that
adding and deleting lines in the program will renumber the lines but not change the
branches. The third method is to branch a specific number of lines above or below
the current line. The safest and most widely used method is to branch to a statement
label.
An example of a branch statement is:
→ (A=5)/END
This is a conditional branch based on A reaching the value of 5. When A is equal to
5, the program will branch to the line with the label END.
Looping in APL is accomplished by continually branching to a section of code until a
specific condition is met. For example:
LOOP: → (10=I)/END
I ← I + 1
→ LOOP
END: 'PROGRAM SUCCESSFULLY COMPLETED'
This program will test the statement: the variable I is equal to 10. If it is true, the
program will branch to END and print the words “PROGRAM SUCCESSFULLY
COMPLETED”. If the statement ‘I equal to 10’ is false, the program will move to the
next line which adds 1 to I and then performs an unconditional branch to the line
labeled LOOP. When I equals 10, the program will end. Note that in this example if
I has an initial value greater than 10 an infinite loop will occur.
TRGRAPH (and APL) commands are interpreted not compiled, so code which loops
will be less efficient than code that does not loop. For efficiency, try to use a
TRGRAPH or APL syntax that does not require looping. Loop only as a last resort.
TRGRAPH User Manual
Page 89
Saving your work
Saving functions and variables in files
When a function is created, it is only saved in the workspace for the duration of the
workstation session. It is not written to disk and therefore will disappear when you
log off. To write a function to disk so that you can use it in future sessions, the
function SAVEFN should be used, which takes as its right argument the name of the
function to be saved in quotes. For example:
SAVEFN 'TEST'
would save the function TEST to a disk file with file name TEST and file extension
‘.afn’. To read in a saved function at your next session, the function LOADFN should
be used, as in:
LOADFN 'TEST'
to read in the function TEST.
When a variable is created, it is also only saved in the workspace for the duration of
the session. It is not written to disk and therefore will disappear when you log off.
To write a variable to disk so that you can use it in future sessions, the function
SAVEVARS should be used, which takes as its right argument the name of the output
file in quotes and as the left argument the variable name(s) in quotes. For example:
('SMALLMAP' 'SMALLMAP2') SAVEVARS 'TEMP.DCF'
To read in a saved variable(s) at your next session, the function LOADVARS should
be used, as in:
LOADVARS 'TEMP.DCF'
to read in the variables stored in the file TEMP.DCF.
Character matrices from APL can be saved as text files on disk using function
WRITEFIX. To convert an APL variable to character format, an operator with symbol
is used. For example, the contents of the two-column matrix LINKS is written to a
text file using
( LINKS) WRITEFIX 'LINKS.TXT'
The file can be read into the workspace and assigned to the variable by
LKS ← READFIX 'LINKS.TXT'
TRGRAPH User Manual
Page 90
LKS will be a character matrix and not two columns of numbers. It will have as many
columns as there are characters in each row of LINKS.TXT. To convert the character
matrix to a matrix of numbers, functions CHAR∆TO∆NUM can be used. For
example:
LKS ← CHAR∆TO∆NUM READFIX 'LINKS.TXT'
However, this function will not work correctly if the columns are not easily
identifiable. In that case, the columns are explicitly defined as arguments using
function CHAR2NUM. For example:
LKS ← 5 0 5 0 CHAR2NUM READFIX 'LINKS.TXT'
where LINKS.TXT has 2 columns of 5 digit integer numbers. Suppose the last
two digits of each field are decimal places, then 5 2 5 2 is used as the left argument.
Alternatively, the variable could be saved as an APL file using function WRITEAPL.
The file is saved with extension ‘.DCF’, and can be read in using READAPL. These
two functions are similar to WRITEFIX and READFIX.
Saving applications as packages
TRGRAPH provides a way to save a group of functions and variables as an
application package.
LST SAVEPKG 'PKGNAME'
will save the package described in LST as a package on disk. PKGNAME will be the
file name of the output package. LST is an optional left argument which is a
character matrix containing a list of the contents of the package. If omitted, the
function will look for the variable PKGNAME. Each row specifies an item in the
package in columns 3 and following. Column 1 contains one of the following codes
for each item:
N
the first line in the list and is the name of the variable
in which the list will be stored when reloaded.
V
variable to be saved in the package file
F
function to be saved in the package file
D
function saved to disk (using SAVEFN) but not
saved in the package file, but will be loaded into the
workspace when the package is loaded.
L
(optional) the final entry in the list and is the latent
expression to be executed when the package is
loaded.
TRGRAPH User Manual
Page 91
Column 2 should be left blank.
LOADPKG 'PKGNAME'
will load the package into the workspace and execute its latent expression, if any.
TRGRAPH User Manual
Page 92
Help facility
As a supplement to this manual, TRGRAPH contains complete on-line
documentation. This section describes how to access the on-line documentation
facility.
Remembering function names
The function HELP serves as an on-line index to the functions in TRGRAPH. To use
HELP, type in the command HELP and press ENTER. The following menu will
come up on the screen:
To choose a group, place the cursor next to the desired group name and press ENTER.
For this example, choose LINK DISPLAY AND LABELING. A panel of functions
for the group chosen will appear as follows:
TRGRAPH User Manual
Page 93
The PF7 and PF8 keys will enable you to scroll through the functions for the
specified group. Again, placing the cursor next to the function in question and
pressing ENTER will display a detailed description of that function. For example,
choosing the function OVERLAY will give the following information:
TRGRAPH User Manual
Page 94
Detailed information on a function
The function SEE can be used to request detailed information on a particular function.
SEE takes a function name in quotes as its right argument. For example, to get
detailed information on the function ADDLINKS, type in:
SEE 'ADDLINKS'
In response to this command, the following information will appear on your screen:
RR ADDLINKS LNKS
ADDS LINK(S) <LNKS> TO RAILROAD <RR>
EXAMPLES:
'ATSF' ADDLINKS 256 2654 14526 15426 16542
22 ADDLINKS 17657
OPPOSITE OF THIS FUNCTION IS <DROPLINKS>
The same detailed function information is also accessible using HELP, as described in
the preceding section.
Searching for a character string
The function FIND will search every function in TRGRAPH for a given character
string, and will return a list of the names of functions containing that string. The
character string may occur anywhere in the function except the comments. For
example, to list all the functions containing the character string 'LINKS', type:
FIND 'LINKS'
FIND takes a relatively large amount of execution time and therefore should be used
sparingly.
TRGRAPH User Manual
TRGRAPH Commands Reference
Page 95
TRGRAPH User Manual
Page 96
TRGRAPH User Manual
Page 97
Introduction
This section gives a brief description of the TRGRAPH functions. The functions are
grouped by subject and are shown in boldface. Function arguments and argument
examples are shown in italics. Listed below are some of the common function
arguments used in this section and their meanings.
Argument
Value
BEAS
CL
Business Economic Area numbers
color and/or line-type, index into
MAPSETUP values
commodity flow group number
highway road designation
file name or dataset name
Federal Information Processing Standard
code(s)
routing formula
Freight Station Accounting Code(s)
MLC code(s)
link number(s)
data matrix
Metropolitan Statistical Area code(s)
country, state, city st, or county name
node number
node number(s)
special options
pattern and/or color, index into
MAPSETUP values
Carrier number(s) or alpha(s)
Standard Point Location Code number(s)
table
flow volume matrix
zip code number(s)
CMD
DESIG
FILE
FIPS
FORM
FSAC
LC
LNKS
MAT
MSAS
NAMES
NDE
NDES
OPT
PC
RR
SPLC
TABL
VOL
ZIPS
To request detailed information on a particular function, use the SEE function as
described in this manual under the heading “Detailed information on a function”.
TRGRAPH User Manual
Page 98
Functions for: Basic graphics
SWINDOW W
VWINDOW W
QSWINDOW
QVWINDOW
DRAW P
SCURSOR
VCURSOR
REL2ABS I
ABS2REL I
CONVS2V I
CONVV2S I
ERASE
Sets Screen-window to (x-origin,x-range,y-origin,y-range)
Sets Virtual-window to (x-origin,x-range,y-origin,y-range)
Returns current screen window setting
Returns current virtual window setting
Draws triplets (flag, x-coordinate, y-coordinate)
Returns (keynum,screen-x,screen-y) closest to cursor
Returns (keynum, virtual-x,virtual-y) closest to cursor
Returns draw matrix I in absolute coordinates
Returns draw matrix I in relative coordinates
Returns draw matrix I in virtual coordinates
Returns draw matrix I in screen coordinates
Erases the graphics screen (Mapping Window)
TRGRAPH User Manual
Page 99
Functions for: Political boundaries (N. America)
USWINDOW
CANWINDOW
MEXWINDOW
NAWINDOW
STATEWINDOW NAMES
PROVWINDOW NAMES
ESTWINDOW NAMES
CNTYWINDOW FIPS
USMAP
CANMAP
MEXMAP
NAMAP
COASTMAP
STATEMAP NAMES
PROVMAP NAMES
ESTMAP NAMES
COUNTYMAP NAMES
CNTYMAP FIPS
STATESINWIN
PROVINWIN
ESTINWIN
STATELABEL NAMES
STLABEL NAMES
PROVLABEL NAMES
ESTLABEL NAMES
COUNTYLABEL NAMES
CNTYLABEL FIPS
STATEBNDS NAMES
PROVBNDS NAMES
ESTBNDS NAMES
COUNTYBNDS NAMES
CNTYBNDS FIPS
STATEOUTLIN NAMES
PROVOUTLIN NAMES
ESTOUTLIN NAMES
CNTYOUTLIN FIPS
STATE∆FIPS NAMES
Sets window to just hold the United States
Sets window to just hold Canada
Sets window to just hold Mexico
Sets window to just hold North America
Sets window to just hold state(s) NAMES (Ex: 'NJ')
Sets window to just hold province(s) NAMES (Ex:
'PQ')
Sets the window to just hold Mexican state(s) NAMES
Sets window to hold counties FIPS (Ex: 'COOK IL')
Draws US state boundaries
Draws Canadian province boundaries
Draws Mexican state boundaries
Draws US, Canadian and Mexican state boundaries
Draws US, Canadian and Mexican national borders
Draws boundaries of states NAMES (Ex: ‘NY,NJ’)
Draws boundaries of provinces NAMES (Ex: ‘ONPQ’)
Draws boundaries of Mexican states NAMES
Draws county boundaries of states NAMES (Ex: ‘MA’)
Draws boundaries of counties FIPS (Ex: ‘MERCER
NJ’)
Returns FIPS codes for states in the current window
Returns codes for provinces in the current window
Returns codes for Mexican estados in the current
window
Labels states NAMES (Ex: ‘NY’; ‘US’ for all)
Labels states NAMES w/ abbreviation (Ex: ‘NY’; ‘US’
for all).
Labels provinces NAMES (Ex: ‘PQ’; ‘CN’ for all)
Labels Mexican states NAMES (Ex: ‘SO’; ‘MX’ for all)
Labels counties in states NAMES (Ex: ‘CA’)
Labels counties given by FIPS Code(s) or (CNTY, ST)
Returns draw mat for state(s) NAMES (Ex: ‘NYNJ’)
Returns draw mat for province(s) NAMES (Ex:
‘ONPQ’)
Returns draw mat for Mexican estados NAMES (Ex:
‘SO,BN’)
Returns draw mat for counties in states NAMES
Returns draw mat for counties FIPS or (county,st)
Returns draw mat outline of state(s) NAMES
Returns outline for province(s) NAMES (Ex: ‘ONPQ’)
Returns outline for estado(s) NAMES (Ex: ‘MX’)
Returns draw mat for outline of counties FIPS
Returns FIPS code for states NAMES (Ex: ‘NYNJ’)
TRGRAPH User Manual
FIPS∆STATE FIPS
COUNTY∆FIPS CNTY
FIPS∆COUNTY FIPS
FIPS∆STNAM FIPS
STNAM∆FIPS NAMES
GETSTRINGS MAT
USMAPLOAD
CANMAPLOAD
MEXMAPLOAD
MEXMAPUNLOAD
USMAPUNLOAD
CANMAPUNLOAD
LONGITUDE N
LATITUDE N
ALBERS IN
Page 100
Returns 2-letter state abbreviation for FIPS
Returns FIPS for (county, state) (Ex: 'MERCER NJ')
Returns county name for 5-digit FIPS
Returns state name for 2-digit FIPS
Returns FIPS code for states NAMES (Ex: 'MAINE’)
Returns draw mat strings from MAT picked by cursors
Reads in US map variables from disk
Reads in Canadian map variables from disk
Reads in Mexican map variables from disk
Erases Mexican map variables from workspace
Erases US map variables from workspace
Erases Canadian map variables from workspace
Returns draw matrix for longitude(s) N
Returns draw matrix for latitude(s) N
Returns (x,y) for (latitude,longitude) IN
TRGRAPH User Manual
Page 101
Functions for: BEAS, SPLCS
BEAMAP
BEALABEL BEAS
BEABNDS BEAS
BEAOUTLIN BEAS
FIPS∆BEA FIPS
BEA∆NAME BEA
BEAMAPLOAD
BEAMAPUNLOAD
SPLC∆FIPS SPLC
SPLC2FIPS SPLC
TSPLC NAME
SPLCOUTLIN N
SPLCBNDS N
FIPS∆SPLC FIPS
Draws BEA (Business Economic Area) boundaries
Labels BEAS (0 for all) with BEA numbers
Returns draw matrix for BEA(s) N
Returns draw matrix outline of BEAS
Returns BEA number(s) for given FIPS codes
Returns name(s) for BEA(s)
Reads in BEA map variables from disk
Erases BEA map variables from workspace
Returns FIPS county code(s) for 4-digit SPLC
Returns 2-digit FIP(s) for 2-digit SPLC
Returns the 2-digit SPLC(s) for the state or prov
NAME
Returns outline of 1, 2, 3 or 4-digit SPLC areas N
Returns internal boundaries at next level for SPLC
areas N
Returns 4-digit SPLCs for county name(s) or FIPS
code(s)
TRGRAPH User Manual
Page 102
Functions for: Legends, keys, panes, borders, and
scales
MAPDEFAULT N
MAPSETUP
BLANKLEGEND
SHOWLEGEND
LEGENDBOX
LDRAW EX
BORDER
LBORDER
BORDERLINE
LBORDERLINE
USBORDER
SAVEMAP NAME
LOADMAP NAME
LISTMAP
N CHTEXT PHRASE
BESTCORC C
LOCATELEGEND CORN
BESTCORNER LNKS
SIZELEGEND
FULLWINDOW
A MWINDOW B
FLIPAREA
FLIPON
FLIPOFF
FLIPDECIDE C
SHAPE V
Sets default map parameters for plot factor N
Accepts changes in legend parameters via menu
Blanks out area of the screen for the legend
Draws legend box according to parameters from
MAPSETUP
Returns draw matrix for legend box outline
Executes function EX with no drawing in legend
corner
Draws a border around the edge of the S-window
Draws a border around the screen area to be shown by
LDRAW
Returns draw matrix to outline current S-window
Returns draw mat to outline screen area to be shown
by LDRAW
Draws a border around the US map in proportions
11x17
Saves MAPSETUP values on disk under NAME
Reads in MAPSETUP values called NAME from disk
Lists MAPSETUP value files saved on disk
Changes line(s) N of legend text to PHRASE
Returns num of best legend corner to avoid virtual
coordinates C
Places legend in corner CORN
Returns num of best legend corner to avoid LNKS
Resizes legend box to accommodate current
parameter settings
Sets S-window to full screen
Sets V-window as B with shrinkage factor A
Show the area to be flipped using FLIPON
Initiates flipping of map sideways on screen
Turn offs screen flipping
Turns flipping on or off to best show coords C
Returns V-window V reshaped to match S-window
w/o distortion
TRGRAPH User Manual
Page 103
Functions for: Reading networks in and out
PICKNET
LISTNET
LOADNET NAME
SAVENET
NETUNLOAD
Lets user pick and load a network from those
available
Lists networks saved on disk
Reads in network NAME from disk
Saves network with user menu
Erases network variables from workspace
TRGRAPH User Manual
Page 104
Functions for: Link display and labeling
SHOWNET RR
WINDOW RR
CL OVERLAY RR
FAM RR
ALLBUT RR
CL SHOWLINE NUM
CL SHOWLINKS LNKS
LINKSONRR RR
SELECT RR
LINKSINWIN
PRV GETLINKS LNKS
NUM KEYLINKS LNKS
TRIMLINKS LNKS
ST TRIMSTATE LNKS
STATELINKS ST
LC SHOWMNLINE RR
OPT SHOWLC LNKS
SHOWDIR LNKS
SEETOLL ST
SHOWTOLL ST
SHOWROUTES DESIG
LABELRRS LNKS
LABELRRS2 LNKS
OPT LABELROUTES LNKS
FINDROUTES LNKS
LABELDIST LNKS
LABELINKS LNKS
NODES2LINKS NDES
MILES NDECLEAN NDERR
CHECKRR RR
OPT CHLINKS NDES
RRSON LNKS
Draws carrier(s) RR in their window
Changes the window to just hold carrier(s) RR
Draws carrier(s) RR in current window (using
color CL)
Returns numbers of carriers in family of RR
Returns all carriers except RR
Draws line number NUM in link legend key in
(color,line-type) CL
Draws link numbers or node pairs LNKS in (color,
line-type) CL
Returns link numbers on carriers RR irregardless
of window
Returns link numbers on carriers RR in current
window
Returns link numbers where either endpoint is in
the window
Returns LNKS selected using cursors
Returns NUM most important links from set LNKS
Returns links from set LNKS in current window
Returns link numbers in states ST from set LNKS
Returns links in state(s) ST (Ex: ‘NJ’)
Draws links of carrier RR of MLC(s) LC
Shows MLCs on LNKS using colors/line-types
OPT
Shows directionality (if any) on links LNKS with
arrows
List toll roads in state ST
Displays links of toll roads for a given ST
Draws hwy routes DESIG (Ex: ‘I95’; ‘I’; ‘US50’)
Labels active carriers on each link in LNKS
Labels active carriers on each string of links in
LNKS
Labels highway route numbers on LNKS using
text
Returns highway route numbers on links LNKS
Labels distances on LNKS
Labels link numbers of links LNKS
Returns link numbers for node pairs NDES
Returns (node,carrier) pairs with NDERR cleaned
up to be on the carrier within MILES
Returns number(s) of RR if valid
Returns all links connected to NDES
Returns numbers of carriers on each of LNKS
TRGRAPH User Manual
RRSON2 LNKS
FINDRRS LNKS
RR∆ALPHA RR
RRFOR ALPH
N KEYROUTES LNKS
ROUTELINKS DESIG
LC MLCLINKS RR
SEGMENT LNKS
Page 105
Returns set of numbers of carriers on any of LNKS
Returns the set of carrier alphas on LNKS
Returns carrier alphas for carrier(s) RR
Returns carrier numbers for alphas ALPH
Returns N key links for labeling with route
numbers from LNKS
Returns links for routes in DESIG (Ex: ‘I95’)
Returns links of LC on carrier RR
Returns aggregated segment information
(segnum,link,a,b) for LNKS
TRGRAPH User Manual
Page 106
Functions for: Node display and labeling
SHOW NDES
LABEL NDES
NDES NLABEL LNKS
LABELCITIES RR
N KEYCITIES LNKS
SHOWNODES NDES
NODESINWIN
TRIMNODES NDES
NWINDOW NDES
PRV GETNODES NDES
NODESONRR RR
RRSAT NDES
NODEPAIRS LNKS
RIV MP MPST
OPT CHLINKS NDES
CHOOSE NDES
GETNODES NDES
GETNAMES NDES
CODE NAMESFOR NDE
NODEFOR NAMES
SPLCFOR NAMES
SPLC∆NAME SPLC
SPLC∆NODE SPLC
SPLC2NODE SPLC
NODE2SPLC NDES
READSPLC SPLC
READSPLC2 SPLC
FSAC2NODE FSAC
FSAC2SPLC FSAC
FSAC2NAME FSAC
SHOWJCT NDES
JCT∆NODE JCTS
INT CONCIRC NDE
Outputs number(s) of NDES at their locations
Outputs city names at the locations of NDES
Labels NDES avoiding links LNKS
Labels approx 15 key cities on carrier(s) RR
Returns N most important nodes on links LNKS
Places a triangle at location of NDES
Returns numbers of nodes in current window
Returns nodes from set NDES in current window
Changes the window to just hold node(s) NDES
Returns nodes from set NDES selected by cursor
Returns numbers of nodes on carrier(s) RR
Returns numbers of carriers operating at NDES
Returns 2-col matrix (anode,bnode) for links
LNKS
Returns node number for milepost MPST on river
RIV
Returns all links connected to NDES
Returns nodes connected directly by links to
NDES
Allows cursor identification and selection of
nodes from set NDES
Returns (city,st) for node(s) NDES
Returns node attributes or just city, state for NDE
depending on value of CODE
Returns node number(s) for (city,st) NAMES
Returns SPLC number(s) for (city,st) NAMES
Returns name(s) for SPLC(s) (Ex: SPLC∆NAME
380000)
Returns node number(s) for 6-digit SPLC
Returns node number(s) for 6-digit SPLC with
cleanup
Returns representative 2-digit SPLC for NDES
Returns records from disk file for 4-digit SPLC
Returns records from disk file for 2-digit SPLC
Returns node numbers for FSACs
Returns SPLCs for FSACs
Returns names for FSACs
Displays Rule 260 junction codes at NDES
Translates Rule 260 junction codes JCTS (Ex:
‘CHGO’) to nodes
Draws concentric circles at distance interval INT
around NDE
TRGRAPH User Manual
Page 107
Functions for: Zooming in and windowing
ZOOM
RETREAT
ADVANCE
PER BACKWINDOW CORN
Use cursors to define area to be enlarged
Enlarges V-window area by a factor of 2
Shrinks V-window area by a factor of 2
Increases window PER percent in corner CORN
TRGRAPH User Manual
Page 108
Functions for: Minimum path routing
RR FORMNET FORM
BESTROUTE
SHORTROUTE
MINPATH NDES
ROUTE N
PATH NDES
SHOWPATH
PATHNODES NDES
PATHLINKS NDES
PATHVIA NDE
NODESVIA NDE
LINKSVIA NDE
PATHDIST NDES
PATHLIST NDE
CHECKCONNECT
NDES GETSUM FORM
GETORIG NDES
MPUNLOAD
Sets up carrier RR with impedance formula FORM
Returns impedance formula for “best route”
Returns impedance formula for “shortest” route
Calculates the minimum path tree from node(s)
NDES
Return impedance formula for “actual” route
according to row N of MLC matrix
Draws the path to node(s) NDES
Draws the entire minimum path tree
Returns predecessor nodes from NDES
Returns links along path(s) to NDES
Shows the links served via NDE from treesource
Returns nodes reached via NDE from treesource
Returns links reached via NDE from treesource
Places name and distance from treesource at NDES
Lists route from treesource to NDE in menu
Returns disconnected nodes from the last
MINPATH
Returns sum of FORM to each of NDES
Returns origin node on tree for each of NDES
Erases the global variables created by MINPATH
TRGRAPH User Manual
Page 109
Functions for: Link volume display
LISTVOL
RR GETVOL FILE
VOLSTATS VOL
CMD SHOWFLOWS VOL
CMD SHOWFLOWS∆DOT VOL
CMD SHOWKEY VOL
CMD SHOWFLOWS∆MULT VOL
CMD SHOWFLOWMAX VOL
CMD SHOWFLOWMIN VOL
CMD FLOWLINKS VOL
PRV GETLINKS VOL
VOL LINKMATCH LVOL
CMD LABELFLOWS VOL
CMD LABELFLOWS∆MULT VOL
CMD FILLFLOWS VOL
CMD
CMD
CMD
CMD
SHOWKEYFILL VOL
FILLFLOWMAX VOL
FILLFLOWMIN VOL
FILLFLOWS∆MULT VOL
CMD SMOOTHFLOWS VOL
N CUTVOL VOL
MIN CUTVOL2 VOL
MIN CUTVOL3 VOL
PCT CUTVOL4 VOL
TRIMVOL VOL
AGGVOL IN
PARM AGGVOL2 VOL
BMAT GETCHANGE AMAT
Returns list of volume files saved on disk
Returns volumes for RR from flow file FILE
Lists certain information about VOL
Draws volumes from 2-column group CMD of
matrix VOL
Draws volumes from 2-column group CMD of
matrix VOL in dots
Draws volume key in legend
Draws volume from group CMD around lowernumber groups
Draws the greater volume on links in VOL
Draws the lesser volume on links in VOL
Draws links of non-zero flows for grp CMD of
matrix VOL
Returns rows of volume mat VOL selected by
cursors
Extracts from VOL those links in LVOL
Labels volumes from 2-col group CMD of mat
VOL
Labels volumes from group CMD around lowernumber group
Fills volumes from 2-col group CMD of matrix
VOL
Fills volume key in legend
Fills the greater volume on links in VOL
Fills the lesser volume on links in VOL
Fills vols from group CMD outside lowernumbered groups
Smoothes out filled flows by filling in gaps
Returns VOL cut back to highest N links
Returns VOL cut back to one-way volumes
greater than or equal to MIN
Returns VOL cut back in continuous segments
Returns VOL cut back to one-way volumes
greater than PCT of maximum one-way volume
of any flow group in VOL
Returns VOL trimmed to only links in window
Aggregates identical volumes in IN on
adjoining links
Aggregates VOL according to parameters
PARM
Returns volume gains and losses by comparing
BMAT and AMAT
TRGRAPH User Manual
Page 110
Functions for: Pie charts
PIFORM∆NODE MAT
PIFORM∆FIPS MAT
PIFORM∆SPLC MAT
PIFORM∆STATE MAT
PIFORM∆BEA MAT
PIFORM∆GRAPH MAT
COORD PIFORM MAT
PICHART XYV
SLICE PIFILL XYV
PIKEY XYV
SLICE PIKEYFILL XYV
PIVALUE XYV
NAMES PILABEL XYV
N PILABEL∆NODE MAT
L PILINKS MAT
TRIMXY MAT
PIEDIT XYV
AGG GENAGG MAT
FILLKEY
FILLBOX N
SHOWTITLE
Assigns coords to (Node,values) matrix MAT
Assigns coords to (FIPS,values) matrix MAT
Assigns coords to (SPLC,values) matrix MAT
Assigns coords to (state/prov,values) matrix MAT
Assigns coords to (BEA,values) matrix MAT
Assigns coords to non-geographic matrixMAT
Assigns coords using COORD to (location,values) matrix
MAT
Draws pie and slice outlines using data in matrix XYV
Fills in slice(s) number SLICE of piechart matrix XYV
Places scale pies and labels in legend
Fills slice(s) SLICE in pie chart map legend
Places value next to each pie slice
Places NAMES below each pie in XYV
Labels top N node numbers in MAT[;1] by volume in
MAT[;2 3....]
Returns draw mat for links L trimmed around pies MAT
Returns (x,y,values) MAT trimmed to those points in
window
Returns piformed XYV with centers moved by cursors
Aggregates matrix MAT using cursors
Draws the key and ids on a non-geographic chart
Fills in key on a non-geographic chart
Places title at the top center of the screen
TRGRAPH User Manual
Page 111
Functions for: Bar charts
BARFORM∆NODE MAT
BARFORM∆FIPS MAT
BARFORM∆SPLC MAT
BARFORM∆STATE MAT
BAFFORM∆BEA MAT
BARFORM∆GRAPH MAT
COORD BARFORM MAT
BARCHART XYV
I BARFILL XYV
BARKEY XYV
BARVALUE XYV
NAMES BARLABEL XYV
BARSCALE XYV
FILLKEY
FILLBOX N
INT BARGROUP MAT
INT BARRANGE MAT
TRIMXY MAT
BAREDIT XYV
SHOWTITLE
Assigns coords to (Node,values) matrix MAT
Assigns coords to (FIPS,values) matrix MAT
Assigns coords to (SPLC,values) matrix MAT
Assigns coords to (state/prov,values) MAT
Assigns coords to (BEA,values) matrix MAT
Assigns coords to non-geographic matrix MAT
Assigns coords using COORD to (location,values) matrix
MAT
Draws bar outlines using data in matrix XYV
Fills share or (share,bar) I of barchart matrix XYV
Draws the legend key for barchart matrix XYV
Places value at top of each bar
Places NAMES below each group of bars
Draws a left-hand scale for non-geographic bar charts
Draws the key and ids on a non-geographic chart
Fills in key on a non-geographic chart
Returns observations MAT grouped into intervals INT
Draws a range scale below each group of bars in MAT
Returns (x,y,values) MAT trimmed to those points in
window
Returns barformed XYV with centers moved by cursors
Places title at the top center of the screen
TRGRAPH User Manual
Page 112
Functions for: Network editing
OPT CREATENET NAME
LINKEDIT LNKS
SHPEDIT LNKS
NODEEDIT NDES
OUT MERGE IN
FAMILIZE RR
DEFAMILIZE RR
ADDRR RR
RR ADDLINKS LNKS
RR DROPLINKS LNKS
RR ADDNEWLINK NDES
RR BUILDLINKS LNKS
SPLITLINK NUM
ASSIGNDIST LNKS
ADDNEWNODES
LC CHMLC LNKS
NDES CHANGENAME PHRS
LOCATE NDE
CHANGECOORD
LASSO NDES
PRV CLOSEST NDES
JCTS CHANGEJCT NDES
SPLC CHANGESPLC NDE
NETMAT NAME
CL NETDRAW NETMAT
Initializes variables for a new network NAME using
OPT
Lets user edit link attributes of LNKS using menu
Lets user edit shape points for links LNKS using menu
Lets user edit node attributes of NDES using menu
Merges carriers IN as carrier OUT
Creates a carrier family from carriers RR
Eliminates the family composed of carriers RR
Adds carrier RR to the network
Adds LNKS to carrier RR
Deletes LNKS from carrier RR
Creates a new link on RR between pairs of NDES
Construct links and nodes using etch-a-sketch
Splits link number NUM at point entered using cursor
Assigns distance to links LNKS based on straight-line
Lets user add new nodes using cursor
Changes MLC on links LNKS to value LC
Changes name(s) of NDES to (city,st) PHRS
Relocates NDE by calling up the cursors
Change node locations using cursor input
Returns nodes from NDES within a user-created area
Returns node from set NDES closest to graphics
cursor
Changes the node number assigned to the given Rule
260 junction code JCTS to NDES
Changes the node number assigned to the given SPLC
to NDE
Returns COORD and LINKS in window for network
NAME
Draws all links in NETMAT (coord,links) in (color,
line-type) CL
TRGRAPH User Manual
Page 113
Functions for: MapMaker
MAPMENU
OLDP MAPBAR NEWP
OLDP MAPCARRIER NEWP
OLDP MAPFLOW NEWP
OLDP MAPFLOWCHNG NEWP
OLDP MAPFLOWMULT NEWP
OLDP MAPNET NEWP
OLDP MAPPIE NEWP
OLDP MAPROUTE NEWP
OLDP MAPSHADE NEWP
DFLTBAR
DFLTCARRIER
DFLTFLOW
DFLTFLOWCHNG
DFLTFLOWMULT
DFLTNET
DFLTPIE
DFLTROUTE
DFLTSHADE
MAPERASE N
SAVEMAP NAME
LOADMAP NAME
Places user in MapMaker menu system
Draws/redraws a bar chart map
Draws/redraws a carrier map
Draws/redraws a single flow traffic density
chart
Draws/redraws a traffic density chart of
changes in flow
Draws/redraws a traffic density chart of
multiple stacked flows
Draws/redraws a network map
Draws/redraws a pie chart map
Draws/redraws a route map
Draws/redraws a shaded area map
Returns defaults for a bar chart map
Returns defaults for a carrier map
Returns defaults for a single flow traffic
density chart
Returns defaults for a traffic density chart of
changes in flow
Returns defaults for a multiple flow traffic
density chart
Returns defaults for a network map
Returns defaults for a pie chart map
Returns defaults for a route map
Returns defaults for a shaded area map
Conditionally erases all or part of the screen
Saves MAPSETUP values on disk under
NAME
Reads in MAPSETUP values called NAME
from disk
TRGRAPH User Manual
Page 114
Functions for: Communication with your operating
system
READARR FILE
ARRAY WRITEARR FILE
VARS LOADVARS FILE
VARS SAVEVARS FILE
READFIX FILE
IN WRITEFIX FILE
FILE PARTSHR PARMS
VAR PARTPROC PARMS
DASHR PARMS
OUT DAPROC PARMS
SL READSOME FILE
COND READCOND FILE
COLS READFIXCOLS FILE
FW CHAR2NUM MAT
CHAR∆TO∆NUM MAT
EXISTFILE FILE
GETDISK NAME
RECSINFILE FILE
Reads contents of FILE into a general array
Writes any APL ARRAY into FILE
Reads in variables saved in disk file FILE
Writes variables VARS to file FILE
Reads in a fixed-length character FILE
Writes character matrix IN as a fixed length
FILE
Opens/closes FILE for reading or writing
Reads/writes data to/from file opened using
PARTSHR
Opens/closes a disk file for reading or writing
Reads or writes records from a file opened
using DASHR
Reads in certain records of a fixed-length disk
file FILE
Reads records from FILE which meet
conditions COND
Reads columns COLS of fixed-length FILE
Converts character matrix MAT to numbers
with field widths FW
Changes character-stored matrix MAT to
numerical
Returns a 1 if disk file FILE exists, o if not
Returns file NAME with disk
Returns the number of logical records in FILE
TRGRAPH User Manual
Page 115
Functions for: Advanced graphics capabilities
L LTYP MAT
CLR COLOR MAT
SETCOLOR CLR
NOSTORE MAT
MOVING MAT
DEFOCUS MAT
PANEL MAT
OVERLAP MAT
PORDER MAT
NOPORDER MAT
FILLORDER MAT
PTS PUTCHAR WORDS
SCL TRIANGLE PTS
SCL SQUARE PTS
SCL OCTAGON PTS
Returns draw matrix MAT with flags for line-type fill
pattern L
Assigns color CLR to draw matrix MAT
Sets the override color CLR or '' to reset defaults
Returns draw matrix MAT with flags for write-thru image
Returns draw matrix MAT with flags for movable image
Returns draw matrix MAT with flags for defocused image
Returns draw matrix shaded in
Returns draw matrix with flag for filled overlap
Returns draw matrix for continuous ordered filling, also
converts to virtual coordinates
Returns draw matrix MAT indicating that triplets are
already ordered for filling
Returns draw matrix MAT with triplets ordered for filling
Places WORDS at v-coord PTS
Returns draw mat of ∆’s size(s) SCL at v-coord PTS
Returns draw mat of squares size(s) SCL at v-coord PTS
Returns draw mat of O’s of size(s) SCL at v-coord PTS
TRGRAPH User Manual
Page 116
Functions for: Hard copy
PRINT_MAP PRTNAME
PRINTER_SELECT
PSON FILE
PSOFF
PSPROMPT
Sends contents on Mapping Window to printer
PRTNAME
Lets user select printer from list of attached printers
Initializes trapping graphic in Postscript file FILE
Closes Postscript file
Prompts user for file name for PSON
TRGRAPH User Manual
Page 117
Functions for: Utility subroutines
COLS SORT IN
A INORDERAS B
COLS SUMDATA IN
STRIP ARRAY
IN ADDTOMAT ROW
A EXPAND B
IOTA FREQ
NUMS IOTAPLUS FREQ
A CENTER B
INDIV B
B DISTANCE A
CHAR CH∆CHAR MAT
ALPHADEX ALPHAS
DATATYPE IN
STORTYPE VAR
EXISTFILE FILE
EXISTVAR VAR
EXISTFN FN
STR LOOKFOR LIST
CHAR PADIT MAT
CHAR PARSE V
SCL PLACE OUT
CAP IN
UNCAP IN
ALLCAP IN
ALLUNCAP IN
UNUND IN
STCC∆NAME IN
Returns char or num matrix IN sorted by columns COLS
Returns indices to put vector A in the same order as B
Returns IN summed over like records of IN[;COLS]
Strips trailing blanks/zeros from ARRAY
Adds vector or matrix ROW to mat IN, padding as
necessary
Returns B expanded by frequencies A
Returns concatenation of frequency FREQ where FREQ
is a vector
Returns -1+NUMS+ FREQ where NUMS and FREQ
are vectors
Returns B centered in character array of dimensions A
Returns the set of unique elements of vector or matrix B
Returns cartesian distance between (X,Y) A and B
Changes all blanks in MAT to CHAR
Returns indices into alphabet for ALPHAS
Returns data type of IN (0=numerical, 1=character)
Returns type of VAR (1=char, 2=log, 3=int, 4=real)
Returns a 1 if disk FILE exists, 0 if not
Returns logical vector telling if variable(s) VAR exist
Returns logical vector telling if function(s) FN exist
Returns a ‘1’ if string STR is in LIST
Converts lead, trail, and double blanks in MAT to
CHAR
Parses vector V with delimiter(s) CHAR
Types variable OUT on the graphics screen at size SCL
Returns phrase IN with first letter of each word
capitalized
Returns upper case matrix IN as mixed upper/lower case
Returns character array IN with all capital letters
Returns character array IN uncapitalized
Turns all underlined chars in IN to upper case
Translates 2-5 digit STCC codes to names
TRGRAPH User Manual
Page 118
Functions for: User-written functions
LOADFN NAME
SAVEFN NAME
LOADPKG PKG
LST SAVEPKG PKG
Reads in function NAME (Ex: ‘MYMAP’)
Saves function NAME on disk (Ex: ‘MYMAP’)
Loads package PKG into the workspace and executes
its latent expression
Saves contents of LST as package PKG on disk
TRGRAPH User Manual
Functions for: Documentation and help facility
HELP
SEE FN
LIST FNS
FIND NAME
Requests help for functions by group
Prints header and leading comments in function FN
Returns list of functions in mat FNS with description
Returns names of functions containing character string
NAME
Page 119