1
Indiana University-Purdue University Fort Wayne
Department of Engineering
ENGR 410 -ENGR 411
Capstone Senior Design Project
Report #2
Project Title:
Electronically Controlled Expansion Valve for Use in a
Geothermal Heating System
Team Members:
Mark Adams (ME)
David Clendenen (EE)
Randon Ripley (ME)
Kurt Shively (EE)
Faculty Advisor:
Dr. Hosni Abu-Mulaweh (ME)
Dr. Hossein Oloomi (EE)
Date:
4/28/2008
1
Table of Contents
1.
Acknowledgement ………………………………………………… 3
2.
Design Abstract and Summary ……………………………............. 5
3.
Section I: Selected Conceptual Design………………………...........7
4.
Section II: Description of the building process. ……………………12
5.
Section III: Testing: ……………………………………….……… 35
6.
Section IV: Evaluation and Recommendations…………………… 50
7.
Conclusion ………………………………………………………… 52
8.
References …………………………………………………………. 54
9.
Appendix …………………………………………………………... 56
2
Acknowledgement
3
The group would like to send a special thank you to WaterFurnace International for
giving the opportunity, financial contribution, and guidance for this project.
Some other contributors and specific WaterFurnace employees that deserve recognition
are:
Dr. Hosni Abu-Mulaweh – IPFW. Mechanical engineering advisor
Caleb Chichester – WaterFurnace. Electrical engineering consultant
Nick Hartman and Michael Taylor – WaterFurnace. Test lab Technicians
Bill Jeffries – Geisting and Associates. Electronic component sales representative
Chris Manz – WaterFurnace. Project manager and mechanical engineering consultant
Dr. Donald Mueller – IPFW. Mechanical engineering advisor
Dr. Hossein Oloomi – IPFW. Electrical engineering advisor
Edward Uslar – Tritech Manufacturing, Inc. Printed circuit board manufacturer.
4
Abstract
5
WaterFurnace International of Fort Wayne, Indiana wishes to control an
electronic expansion valve (EEV) for use in a geothermal heating and cooling system.
Electronic expansion valves provide higher system efficiency, can be used on different
tonnage systems and can be controlled more precisely than other types of expansion
valves. WaterFurnace desires an electronic control board to be designed to interface with
temperature and or pressure sensors located in the geothermal system and use the output
of the sensors to aid in the control of the EEV. The valve must control the temperature of
the refrigerant to 10°F +/- 2°F of superheat at the inlet of the compressor.
In order to begin the design process, models of the system were constructed to
better understand its functionality. A system was tested at WaterFurnace. The test
results were then used as baseline for modeling and the development of the control. With
a model of the system, a simulation was set up to test this method and compare its results
to those from the testing using the same input data. The simulation of the control method
supported the initial testing results and the design selection process began.
The design selection process consisted of determining the best method to
implement the controller by use of a decision matrix with weighted values. After the
design selection procedure was completed a final design and a backup design were
selected. The final design that was constructed consisted of a microcontroller based board
loaded with a control algorithm, and interfaced with one pressure sensor and one
temperature sensor. The control algorithm then took the information that the
microcontroller obtained from the pressure and temperature sensor and adjusted the valve
accordingly to control the amount of superheat.
To show that the final design operated as specified a final stage of testing was planned.
The final design was taken to WaterFurnace and was tested. The control board was
connected to the same unit from the initial testing, and data was collected. Two types of
tests were used to show that the controller worked. One that demonstrated that the
controller could bring the superheat to the desired point and maintain it and the other
demonstrated that the controller could maintain the desired superheat when the system
was introduced to disturbances. The results of this testing showed that the control board
was able to control the valve and bring down the superheat (or bring up) to the desired
level and maintain it there.
6
Section I: Selected
Conceptual Design
7
Selected Design
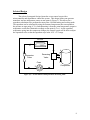
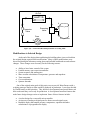
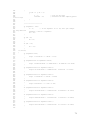
The selected conceptual design chosen has a two-sensor layout with a
microcontroller and algorithm to control the system. This design utilizes one pressure
transducer and one temperature sensor at state point 4 (Figure 1). This allows for a
superheat calculation to be performed at state point 4 in both heating and cooling mode.
The superheat can be calculated by using the saturated temperature that corresponds to
the pressure at state point 4 (Tsat), and subtracting it from the actual temperature (negative
temperature coefficient Thermistor reading) at state point 4 (TNTC). As the superheat
temperature going into the compressor changes, the control system will be able to adjust
the expansion valve so that the superheat stays in the 10°F ± 2°F range.
Air Coil
4
3
Reversing
Valve
Expansion
Valve
Coax
2
1
Compressor
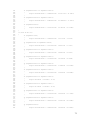
Figure 1(a) – Geothermal Heat Pump Schematic in Heating Mode
8
Air Coil
4
3
Reversing
Valve
Expansion
Valve
Coax
2
1
Compressor
Figure 1(b) – Geothermal Heat Pump Schematic in Cooling Mode
Modifications to Selected Design
At the end of the design phase and during the building phase it was realized that
the original design required some modifications. Many of these modifications were
discovered during the laboratory testing phase and included both hardware and software
changes. These changes were necessary for the following reasons:
Ability to have better control of the system
Limited memory space on microcontroller
System response and settling time
More accurate calculations of temperature, pressure and superheat
Time constraints
Cost considerations
Sponsor demands
One of the original main goals of this project was to provide WaterFurnace with a
working prototype similar to what would be produced in production. It was later decided
by WaterFurnace to shift priorities. They decided a development board would better suit
their needs until they were ready for production. A development board has features that
make future design changes easier to implement. Some of these features include:
A socket design for a removable microcontroller
An increase in analog-to-digital ports for future sensor design layouts
Readable display that outputs pressure, temperature, superheat and other
calculations it is programmed to display
9
The addition of more analog-to-digital ports allows more methods of control in the
future, or to be used to improve the overall performance of the system. The socket for
the microcontroller is useful because it allows the microcontroller to be removed from the
development board, be programmed on the Atmel programming board and then placed
back on the development board quickly. The display offers the user the benefit of
displaying three-digit integer values, such as temperature and pressure that can be used
for debugging purposes. This allows one to see if there are any issues with calculations or
sensors.
Another change was using a curve fit equation to calculate saturation temperature
at the inlet of the compressor. It was originally thought that a look-up table could be used
in the control algorithm to find the saturation temperature of the refrigerant. It was later
discovered that since the pressure range of the transducer was so large (725 psi) that a
very large table was needed to retain an accurate resolution. This table put the software
at 20% over the available memory. A third-order polynomial was fit to the data table in
Excel. The polynomial fit was accurate to better than 1% error between the tabulated
value. This reduced the size of the data partition of the code greatly.
One of the major hardware changes from the original design is the power supply
on the EEV control board. The power input from the main system controller is 24 VAC,
which is too high for the EEV control board. A stable12 VDC needs to be supplied in
order for it to function properly. The original design for the power supply consisted of
two linear voltage regulators, one for the 12VDC for the motor and three-digit display
and one for the 5VDC for the microcontroller, sensors and other peripherals. The power
dissipated in the two voltage regulators was too high and resulted in wasted power. A
more efficient switching power supply was designed to provide the 12 VDC. A
switching power supply is based around an integrated circuit that switches the input
voltage on and off at a high frequency to an output pin where an inductor is connected.
Using the relationship of the voltage across an inductor, (Equation (1)) as the current is
switched on and off the inductor holds the voltage at a constant level.
Vinductor L
dI
dt
(1)
Another major hardware change is the conversion to an Atmel microcontroller.
The original microcontroller chosen was a Silicon Labs 8051-based microcontroller.
However, WaterFurnace expressed a desire to use an Atmel microcontroller. After
investigating several different Atmel microcontrollers, the ATMega16 was chosen. This
microcontroller was chosen due to its peripheral set and flash memory space.
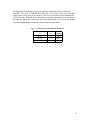
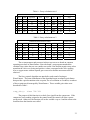
The main software change was the implementation of a variable step gain and a
variable time delay. These parameters work simultaneously to decrease the amount of
time the system takes to get to the design superheat temperature. The number of motor
commutations, or steps, is changed and the time between temperature and pressure
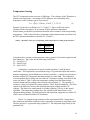
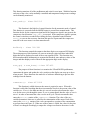
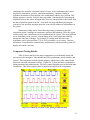
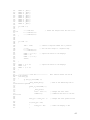
acquisitions is altered depending on the change in superheat. Table 1 highlights the
variable gain and acquisition delay. The value ‘Φ’ signifies the time between
temperature and pressure acquisitions for superheat calculation. The symbol ‘Δ’ signifies
10
the magnitude of the design set point of superheat subtracted from the calculated
superheat. The letter ‘k’ symbolizes the step gain. For example, if the fuzzy algorithm
was to return a step value of 20 and the k value was 2, the motor would commutate 40
(20*2=40) steps. It should also be noted that a manual mode interface was included in
the software, and used to operate the valve using push buttons. This was also a change
from the original design which only called out an automatic mode.
Table 1 – Variable gains and sample time parameters
Δ = |SH - Set Point|
[F]
Δ>5
Δ>2
Δ=0
k
3
2
1
Φ [sec]
30
45
60
11
Section II: Description of
the Build Process
12
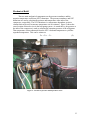
Mechanical Build
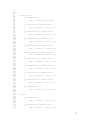
The two main mechanical components are the pressure transducer and the
negative temperature coefficient (NTC) thermistor. The pressure transducer and NTC
thermistor are used to calculate the pressure and temperature at the inlet of the
compressor, respectfully. The NTC thermistor is a temperature dependent, resistive
element that can be used to measure temperature via its resistance. Figure 2 shows the
exact location of these devices in the heat pump system. As stated above, the pressure at
the inlet of the compressor is used to calculate the saturation pressure of the refrigerant.
That temperature is then subtracted from the NTC calculated temperature to yield the
superheat temperature. This can be written as:
(2)
TSH TNTC Tsat
Pressure Sensor
Temperature Sensor
Compressor
Figure 2 – Location of pressure and temperature sensor
13
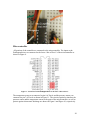
Temperature Sensing
The NTC temperature sensor used was a 10KΩ type. The resistance of the Thermistor is
related to the temperature. According to ILX Lightwave, the relationship of the
temperature to the resistance can be expressed as:
TNTC C1 C 2 ln R C 3 ln R 3
1
273.15
(3)
Equation (3) has three coefficients of C1, C2 and C3. These coefficients can be
calculated if three resistances, R, are known for three different temperatures.
WaterFurnace provided the specification sheet that states resistances with corresponding
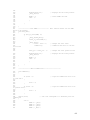
temperatures. Table 2 shows the three temperatures and resistances that were taken from
the NTC thermistor datasheet to calculate C1, C2 and C3.
Table 2 – Resistance values for corresponding TNTC temperature according to the data sheet
T_NTC
Resistance
32°F
77°F
212°F
32650Ω
10000Ω
678 Ω
Using these three resistance and temperature values, equation (3) has three equations and
three unknowns. The results are the following coefficients:
C1 = 8.83065 x 10⁻⁸
C2 = 0.000233949
C3 = 0.001130279
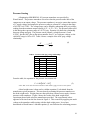
A laboratory experiment was used to validate equation (3) with the above
coefficients. This experiment was performed using a T-type thermocouple and reader to
measure temperature, and an Ohmmeter to measure resistance. A beaker was placed on a
hot plate with the NTC thermistor and thermocouple in a water bath. The temperature
was incremented until a rolling boil was achieved. Resistance readings were taken as the
water was heated. Table 3 shows the temperature readings from the thermocouple
(Actual column) and the readings achieved from using equation (3). The equation (3)
resistance values were obtained by using resistance values from the ohmmeter. The delta
column is the difference between the actual thermocouple readings and the NTC
readings. The deltas were small enough to validate equation (3) for use in the control
algorithm. The temperature readings were also validated with WaterFurnace’s lab
equipment during testing. The data read on the lab acquisition equipment was within 1°F
of the values calculated with the NTC thermistor.
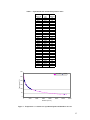
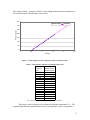
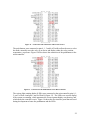
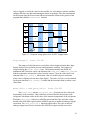
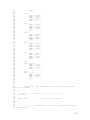
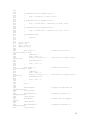
Figure 3 is a graphical representation of the experimental Table 3 temperatures.
The values from the beaker and heated water experiment are plotted as single data points.
The line in Figure 3 is generated using equation (3). The data points align closely to the
generated line.
14
Table 3 – Experimental and calculated temperature values
Actual [°F]
72.4
36.9
84.2
101.2
105.8
109.8
109.0
109.8
112.8
116.8
116.1
122.1
126.5
126.7
129.7
135.2
142.6
150.4
155.0
155.6
159.8
161.8
177.5
185.7
193.8
197.1
203.6
204.5
206.2
208.1
210.7
213.2
Equation (3)
[°F]
Delta [°F]
79.6
7.2
45.3
8.4
91.2
7.0
107.2
6.0
111.7
6.0
114.2
4.4
115.5
6.5
116.3
6.6
118.4
5.6
121.6
4.8
123.1
7.0
126.9
4.8
130.1
3.6
132.1
5.4
134.8
5.1
138.0
2.8
146.7
4.1
153.7
3.3
157.8
2.8
160.0
4.5
162.4
2.6
166.3
4.5
180.4
2.9
189.2
3.5
195.9
2.1
200.2
3.1
205.3
1.6
207.5
3.0
209.0
2.8
211.0
2.8
212.2
1.4
214.0
0.8
300
Calculated
Tested
Temperature [°F]
250
200
150
100
50
0
0
5000
10000
15000
20000
25000
30000
35000
Resistance [ohms]
Figure 3 – Temperature vs. resistance for experimental points and datasheet curve fit
15
Pressure Sensing
A Saginomiya NSK-BE050L-103 pressure transducer was provided by
WaterFurnace. The pressure transducer is used to relate the pressure at the inlet of the
compressor to an output voltage. The pressure transducer is an active sensor that requires
a 5V supply voltage and outputs the pressure reading as a linear DC voltage in the range
of 0.5VDC to 4.5VDC. The voltage range can be found by subtracting the 0 psig voltage
reading from the maximum output voltage (4.5V – 0.5V = 4V). The pressure sensor used
in this design has a pressure range of 0 to 725 psig. Equation (4) shows the relationship
between voltage and psig. The pressure sensor outputs a voltage between 0.5 and
4.5VDC, but the ADC port on the microcontroller uses 5V as a reference voltage, so the
valid ADC range is 102 to 922. Table 4 shows a sample of the ADC-psig-voltage
relationship.
mV
4V
5.5
psig
725 psig
(4)
Table 4 – Pressure ADC-psig-voltage relationship
10-bit ADC
ADC
PSIG
VOLTAGE
102
0.000
0.498
103
0.884
0.503
104
1.768
0.508
…
…
…
919
722.348
4.487
920
723.232
4.492
921
724.116
4.497
922
725.000
4.502
From the table, the equation for the pressure was constructed:
P 0.885 ADC 102
(5)
where ADC is the value the microcontroller reads and P is gage pressure at state point 4
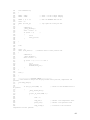
A dead weight tester is then used to validate equation (5) calculated from the
manufactures given parameters. This was done by mounting the pressure transducer to
the dead weight tester. Weight plates are then placed on a known area to apply a known
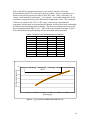
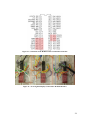
pressure to the transducer. Figure 4 shows the results of the dead weight tester
experiment plotted with values the manufacture provided. The experimental values
appeared to deviate from the line shown in Figure 4. This occurred by applying too much
voltage to the transducer while testing with the dead weight tester. It was later
determined at WaterFurnace’s lab that equation (5) was sufficient for calculating pressure
16
from output voltage. As shown in Table 5, the readings from the pressure transducer in
lab were the same as WaterFurnace’s test results.
350
Dead-weight
Calculated
300
Pressure [psig]
250
200
150
100
50
0
0
0.5
1
1.5
2
2.5
Volts [V]
Figure 4 – Dead weight tester data compared to Table 4 calculated values
Table 5 – WaterFurnace and EEV board displayed Pressure
Display ed
Pres sure
W at erFurnac e
[psi]
Pres sure [ps i]
142
141.69
143
144.01
143
144.05
144
143.72
144
141.2
144
143.96
145
144.2
147
148.23
147
147.02
146
146
145
145.45
146
146.3
134
134
136
136.7
137
137.52
Note: Displayed pressure is rounded on EEV board display
The pressure value is then used to calculate the saturated temperature, Tsat. The
original method that the group decided to use for calculating Tsat was to incorporate a
17
table of the R410A saturated temperature versus pressure into the code for the
microcontroller and find Tsat based on the pressure reading. However, this theory was
based on using an 8-bit pressure reading of only 204 values. Once 10-bit ADC was
chosen, a new method of calculating Tsat was required. A new table designed for 10-bit
resolution was generated for pressure and saturated temperature values. The refrigerant
will never be outside of the 30F to 100F range, so the pressure and saturated
temperature for this range were plotted and an equation was derived from the relationship
by fitting a third order polynomial to the data. The largest percentage error between the
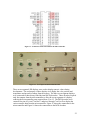
derived equation and the table is 0.8%. Table 6 shows an example of the data. Figure 5
shows the tabulated data plotted along with the fitted third order polynomial.
Table 6 – Pressure to Tsat relationship, table and equation
PRESSURE TSAT(LOOKUP) TSAT (EQN) % ERROR
98.14
29.93
29.97
0.1190%
99.02
30.37
30.39
0.0498%
99.91
30.81
30.80
0.0222%
100.79
31.25
31.22
0.0969%
…
…
…
…
315.64
99.50
99.40
0.0980%
316.52
99.70
99.59
0.1067%
317.41
99.89
99.78
0.1058%
318.29
100.10
99.97
0.1252%
Tsat Temperature [degrees F]
120
Tsat = 2E-06psig3 - 0.0016psig2 + 0.7397psig - 28.998
R2 = 1
100
80
60
40
20
0
0
50
100
150
200
250
300
350
Pressure [psig]
Figure 5 – Tsat by pressure for R410A polynomial curve fit
18
Electrical Hardware
In order to control the system and the various inputs and outputs a microcontroller was
selected. The electrical system consists of the microcontroller, the stepper motor driver
circuit, display circuit, sensor circuits, and the power supply.
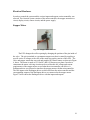
Stepper Motor
Figure 6 – Stepper Motor and Valve
The EEV changes the orifice opening by changing the position of the pin inside of
the valve. The pin is attached to a permanent magnet rotor that is rotated by applying a
specific series of voltages to the coils of the stator ring on the exterior of the valve. The
valve and stepper motor that was used and supplied by WaterFurnace are shown in Figure
6, above. The motor is rated at 12 Volts DC and 0.26 Amperes per phase. In order to
commutate the motor a driving circuit must be used because the voltage and current
requirements of the stepper motor exceed what the microcontroller can deliver. A
Darlington driver was selected to interface the stepper motor with the microcontroller.
The four inputs to the Darlington driver are delivered from the microcontroller and the
corresponding outputs of the Darlington driver are connected to the stepper motor.
Figure 7 below shows the Darlington driver with the inputs and outputs.
19
Figure 7 – Darlington Driver
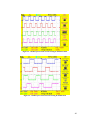
Microcontroller
All portions of the controller are connected to the microcontroller. The inputs to the
Darlington drivers are connected to the lower 4 bits of Port C of the microcontroller as
shown in Figure 8.
Figure 8 – Connection of the Darlington driver to the lower 4 bits of Port C
The temperature sensor was connected to pin 6 of Port A and the pressure sensor was
connected to pin 7 of Port A as shown in Figure 11. The circuits required to interface the
pressure sensor and the temperature sensor to the ports of the microcontroller, as well as
protect against electrostatic discharge are shown in Figure 9 and Figure 10, respectively.
20
Figure 9 – Pressure Sensor Schematic
Figure 10 – Temperature Sensor Schematic
21
Figure 11 – Connection of the Thermistor and Pressure Sensor
The push buttons were connected to pins 0, 1, 3 and 4 of Port B to allow the user to select
the mode, manually move the valve up or down, and display either the valve position,
temperature, or pressure. Figure 12 below shows the connection of the pushbuttons to the
microcontroller.
Figure 12 – Connection of the Push Buttons to the Microcontroller
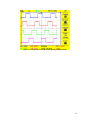
The various light emitting diodes (LEDs) were connected to the microcontroller pins 0, 1,
2, and 3 of Port A and pins 5 and 6 of Port B (Figure 13). The LEDs were used to display
if the system was running, which parameter the seven-segment display was showing, and
which mode the controller was in. Figure 14 shows the user interface panel that was used
during development to house the pushbuttons and the LEDs.
22
Figure 13 – Connection of the State LEDs to the Microcontroller
Figure 14 – User Input and State LEDs Interface
Three seven-segment LED displays were used to display numeric values during
development. The end purpose of these displays is to display the valve position and
temperature and pressure readings from the sensors. The three seven-segment displays
were connected to three binary coded decimal (BCD) decoders. These decoders required
only four outputs from the microcontroller to drive the seven segments of a display,
reducing the microcontroller ports required from 21 to 12. The BCD decoders were
connected to pins 4,5,6,and 7 on Port C and pins 0 through 7 on Port D to display the
various numeric data from the microcontroller. Figure 15 shows the connections to the
microcontroller and Figure 16 shows the connections to the BCD decoders.
23
Figure 15 – Connections to the BCD Decoders from the Microcontroller
Figure 16 – Seven Segment Displays Connected to the BCD Decoders
24
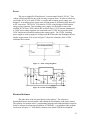
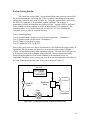
Power
The power supplied by WaterFurnace’s current control board is 24VAC. This
voltage is much too high for any of the circuitry to operate from. In order to effectively
convert the 24VAC to a stable 12VDC, a rectifier and switching power supply was
designed. A switching power supply is an efficient means of performing step-down DCto-DC conversion. The 24VAC is rectified to 34VDC using a bridge rectifier and an
energy storing capacitor. The switching power supply was designed to convert the
rectified 24VAC into 12VDC and be able to deliver up to 1.5A of current continuously.
A 5VDC linear voltage regulator was connected to the 12VDC bus to provide stable
5VDC that the microcontroller and pressure sensor require. The 12VDC switching
power supply is used to supply the voltage to the BCD decoders, the Darlington drivers,
and the stepper motor. The circuit in Figure 17 shows the schematic of the 12VDC
switching power supply.
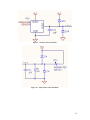
Figure 17 – 5VDC Voltage Regulator
Figure 18 – 12VDC Switching Supply
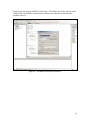
Electrical Software
The other facet of the electrical design is the software. The software is
downloaded into the microcontroller and controls the functionality of the entire control.
The software was written in the C programming language and compiled and developed in
Atmel’s software development environment, AVR Studio. A screenshot of this program
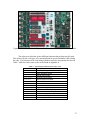
can be seen in Figure 19. AVR Studio connects to the Atmel STK500 development
25
board (Figure 20) through an RS232 serial cable. AVR Studio checks the code for errors,
compiles the code and then communicates with the microcontroller to download the
machine code to it.
Figure 19 – AVR Studio development environment
26
Figure 20 – Atmel STK500 development board used for interfacing with microcontroller
The software was broken up into different functions that perform specific tasks.
This allowed for the code space to be optimized and for greater flexibility while editing
the code. The functions of the code along with their respective descriptions are listed in
Table 7 while the entire source code can be found in Appendix A.
Table 7 – List of major functions in the source code
Function Name
Description
main()
calibrate()
manual_mode()
auto_mode()
dec2bcd()
scan_up()
scan_down()
commutate()
disp_change()
press_a2d()
temp_a2d()
fuzzy()
comp_chk()
night_time()
Main body of program
Motor calibration routine
Manual control mode
Automatic control mode
Decimal to BCD converter
Controls UP button function
Controls DOWN button function
Commutates the valve
Toggles three digit display
Pressure sensor analog to digital function
Temperature sensor analog to digital function
Fuzzy control algorithm
Determines if compressor is on or off
Power saving mode
27
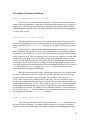
Description of Software Functions
main():
Appendix A lines 155-200
This is the first executed function of the code. Inside this function the internal
timer for the microcontroller is setup and all of the input and output ports are configured
respectively. Once the necessary hardware is configured, this function calls the motor
calibration function and then enters an infinite loop that keeps the control operating until
it is shut down or reset.
calibration():
Lines 520-568
When the system is powered on, reset, or wakes up from the sleep mode it will
perform a calibration of the valve to make sure that it is at the correct position before it
resumes operation. The calibration() function has two parts, calibrate-up and calibratedown.
For the calibrate-up portion of the calibration procedure the inequality i<=cali_up
must be satisfied. The variable i is set to 1 at the initialization portion at the beginning of
the program. The variable cali_up is set to 70 at the initialization portion at the beginning
of the program as well. This loop opens the valve all of the way. Since the valve has 480
positions, by opening the valve by a number of steps greater than 480, in this case 560
(8*70=560), the true position of the valve will be known. This method is used instead of
closing the valve all of the way because doing so could damage the pin inside the valve
over time. In this loop the microcontroller calls the commutation function until the variable
i=71. The variable valve_pos is used by the dec2bcd() function to display the valve
position on the seven-segment LED display.
Once the calibrate-up portion of the calibration procedure has been completed and
the valve is fully opened the valve needs to be closed to a desired position. In this case
the valve needs to be halfway open (240 steps). The variable i is now set to 60
(60*8=480) to represent the current position of the valve. The state variable is set to 8
because the commutation procedure is now reversed. The controller enters the while loop
based on the inequality cali_down<=i. The variable cali_down is set to 31 at the beginning
of the program to represent the valve position of 240. The microcontroller commutates
the motor down to position 240 similarly to the calibrate-up method. Voltage to the motor
is removed by the kill() function and the microcontroller then returns to the portion of
the program that called the calibration() function.
manual_mode(): Lines 203-263
This is the user interactive function and is called from main() immediately after
the motor is done calibrating. The purpose of this function is to give the user manual
control over the system and is mainly included for engineering and debugging purposes.
28
This function monitors all of the pushbuttons and waits for user input. With this function
each step of the valve can be manually controlled and temperature and pressure readings
can be manually monitored.
auto_mode():
Lines 266-315
This function is the high-level control function for the automatic mode of control.
This function is executed when the MODE button is pressed from manual mode. This
function checks for the compressor signal and if the compressor signal is not present, the
compressor check function comp_chk() is executed. If the compressor signal is present,
the control waits three seconds before calling the fuzzy algorithm control function
fuzzy() to execute the necessary functions this process repeats until the compressor
turns off or the user causes it to enter manual mode.
dec2bcd():
Lines 316-399
This function controls the output to the three-digit seven-segment LED display.
The main purpose of this function is to convert an integer value into three individual
digits that can be displayed on each of the seven-segment LEDs. This function uses
division and modulus mathematics to separate the hundreds, tens and ones values of the
integer and then displays each of them on the appropriate digit on the display.
scan_up() & scan_down(): Lines 367-425
The purpose of these functions is to monitor the UP and DOWN pushbuttons,
commutate the motor and update the valve position on the display one step up or down
when pressed. These functions also make use of software debouncing to prevent false
readings from the buttons.
commutate():
Lines 427-509
This function is called whenever the motor is required to move. When this
function is called the first thing that the microcontroller checks is the present value of the
variable state. If state is less than one then it is set to 8 in order to decrement the value
over for the next cycle through the states. If state is greater than 8 then the value of state is
set to 1 in order to increment the value over the next cycle. The microcontroller then
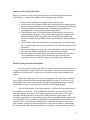
enters the switch() routine of the commutate() function. The value of the state
variable determines what case is called for the commutation of the motor. Each of the
cases in the switch() routine of the code corresponds to a portion of the commutation
waveform shown in Figure 21. When one of these states is called, the values for the pins
of PortC are changed accordingly to output the voltage waveform to the motor. As the
29
valve is opened or closed the value for the variable state will change each time and thus
calling a different case and commutating the motor accordingly. Once the commutation
for the present state has been executed the microcontroller returns to the portion of the
program that called the commutate() function.
1
2
3
4
5
6
7
8
A
1
1
1
0
0
0
0
0
B
0
0
1
1
1
0
0
0
A'
0
0
0
0
1
1
1
0
B'
1
0
0
0
0
0
1
1
Open
Close
Figure 21 – Required voltage pulse series for EEV stepper motor
disp_change():
Lines 570-631
The purpose of this function is to switch the values displayed on the three-digit
display between valve position, pressure and temperature readings. The function is
executed during the manual_mode() loop. The function monitors the DISPLAY
pushbutton and if it detects a press, the function calls temp_a2d() and press_a2d() to
read the temperature and pressure values from the sensors. Once the values have been
returned to the disp_change() function the value of variable displaya determines
which value is displayed on the three-digit display. The value of displaya is incremented
for the next time that disp_change() is called and the function returns to where it was
called from.
press_a2d() & read_press_adc():
Lines 634-655
The press_a2d() and the read_press_adc() functions are also vital to the
functionality of the controller. These functions read and calculate the pressure of the
refrigerant, which then results in the value of the saturated temperature of the refrigerant.
When the press_a2d() function is called the microcontroller first writes the values
needed to the ADCSRA register and the ADMUX register to enable the analog to digital
conversion. The read_press_adc() function is then called. The value to start the
analog to digital conversion is written to the ADCSRA register and the conversion
30
begins. The while(ADCSRA & 0x40) waits for the conversion to complete and then
combines the resulting values from the conversion and returns to the press_a2d()
function. The press_a2d() function then converts the value from the analog to digital
conversion represented by the variable num to a pressure which is represented by the
variable pressint. This value is then later used in the fuzzy control algorithm in the
temp_lookup() function to calculate the temperature of the superheat.
temp_a2d() & read_temp_adc():
Lines 660-693
The temp_a2d() and the read_temp_adc()functions are vital to the operation
of the controller. These two functions read and calculate the temperature of the
refrigerant. When the temp_a2d() function is called the microcontroller first writes the
values needed to the ADCSRA register and the ADMUX register to enable the analog to
digital conversion. The read_temp_adc() function is then called. The value to start the
analog to digital conversion is written to the ADCSRA register and the conversion
begins. The while(ADCSRA & 0x40 ) loop waits for the conversion to complete and
then combines the resulting values from the conversion and returns to the temp_a2d()
function. The temp_a2d() function converts the value from the analog to digital
conversion to the corresponding resistance of the thermistor represented by the variable
Rt. This value of Rt is then passed through a series of calculations that convert the final
temperature to degrees Fahrenheit and store it as variable tempint. The microcontroller
then returns to the portion of the program that called this function with the temperature of
the conversion stored as tempint.
fuzzy(): Lines 783 - 1186
The main objective of the fuzzy code is to calculate the valve steps in such a way
that will allow the valve to open very quickly if the set point is really far from the current
superheat. As the current superheat approaches the set point the fuzzy code will calculate
much smaller steps. By approaching the set point with an overdamped motion the system
will not overshot the set point and will stabilize more quickly. The fuzzy code for the
board was generated by Matlab. The code from Matlab was than edited to specific
superheat ranges to conserve memory space on the board. To validate the fuzzy code,
hand calculations were done to make sure that the board code matched up with the
Matlab fuzzy values. To do this a set of derivative of the superheat values were checked
at every superheat value (superheat was set to integers since the code is based on the
superheat being an integer). An example hand calculation would be to set the superheat to
15°F and the derivative (ds) to 6. The formula used in the hand calculation for this would
be line 1014 of the code in appendix A which can be seen in equation (6) (Note that the
SSet for this calculation is at 10 degrees of superheat).
steps 0.128ds 2 .382ds 15.51
(6)
Computing a solution for equation (6) with a ds of 6 gives the solution in equation (7).
31
steps 0.128(6) 2 .382(6) 15.51 17.82
(7)
The result of equation (7) is 17.82 steps which the board would round to 18 steps. This
result of 17.82 would then be checked with the Matlab fuzzy calculation to verify for
correctness. The Matlab fuzzy calculation is 17.8 steps and can be seen below in Figure
22. Since the code formulas gave approximately the same values as the Matlab fuzzy
values the code was implemented into the board.
Figure 22 – Matlab fuzzy step calculator.
To see if the board would make the correct step adjustments to the valve, two tests
were set up to be run in the IPFW lab. A voltage was supplied to simulate a set
temperature and another voltage was adjusted to simulate different pressures. The two
tests can be seen in Table 8 and 9. The hand calculated values were done in the same
manner as described above, for example, line 1 in Table 8 would fall under line 1039 of
the code in appendix A.
32
Table 8 – Fuzzy calculation test 1
Hand Picked and Calculated Values
T °F
P PSI
Superheat
1
62
102
2
62
117
3
62
4
Board Response
dt*2
steps
Vt
Vp
Steps
30
0
25
0.906
1.062
25
23
-14
9
0.906
1.147
9
131
17
-12
2
0.906
1.226
2
62
144
12
-10
-9
0.906
1.294
-9
5
62
149
10
-4
-6
0.906
1.323
-6
6
62
149
10
0
0
0.906
1.323
0
Table 9: Fuzzy calculation test 2
Hand Picked and Calculated Values
Board Response
T °F
P PSI
Superheat
dt*2
steps
Vt
Vp
Steps
1
70
215
-4
0
-25
1.09
1.689
-25
2
70
202
0
-8
-15
1.09
1.616
-15
3
70
180
7
-7
1
1.09
1.494
1
4
70
162
13
6
11
1.09
1.396
11
5
70
171
10
-3
-5
1.09
1.445
-5
6
70
171
10
0
0
1.09
1.445
0
The set temperatures and pressures in these two tests were based on common
operating tests done at WaterFurnace. Since the board’s step response matched the
calculated step values the test was consider successful. Note that the negative step values
mean that the valve was closing and positives values correspond to the valve opening.
Also, a stepper motor with an exposed gear was used so that the movement could be
observed.
The fuzzy control algorithm was tuned after each round of testing at
WaterFurnace. The latest embodiment of the algorithm boasts an adaptive gain feature
that provides a quick transition to the set point, free of oscillation or overshoot; overshoot
of the set point was discouraged by WaterFurnace. These variable gain values were
described in Table 1.
comp_chk():
Lines 706-764
The purpose of this function is to check for a signal from the compressor. If the
compressor is not sending a signal to the control board, the control will enter a power
saving mode. Otherwise, the function will set the variable comp to 1 and the return to the
location where the function was called.
33
night_time():
Lines 765-782
This function is used in the controller to save power when the compressor has
been off for a period of time and is called from the comp_chk() function. This function
enables power saving mode and enables external interrupts before entering a low power
state. This particular mode shuts down the microcontroller to the minimal power
consumption until the compressor comes back on executing an external interrupt to the
sleep mode. Once this external interrupt has been received, the system enters main()
and resumes operation.
34
Section III: Testing
35
Testing Parameters
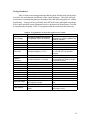
Table 10 depicts the testing parameters that the group defined in the design phase
as a rubric for measuring the performance of the control prototype. This table was used
as a means of evaluating the prototype throughout the build and testing phases to validate
functionality. Testing was first performed in the IPFW lab on the individual components
of the control and then system-integrated tests were performed at WaterFurnace’s test lab
in a geothermal heat pump. Table 10 is populated with the results from the latest tests.
Table 10 –Test parameters for electronic expansion valve control
Parameter/Quantity:
Results/Comments:
Components:
Yes. Power supply topology was
Does power supply convert 24VAC
Power Supply
changed from a linear regulator to a
into regulated 12VDC and 5VDC?
switching regulator.
LEDs
Display all digits correctly?
Interface with push buttons?
Yes
Yes
Thermistor
Accurate readings? (+/- 2°C)
Yes, biasing resistor was changed
to a 1% from a 5% to increase
accuracy
Accurate readings? (+/- 2 psig)
Yes. Analog to digital conversion
was changed from 8-bits to 10-bits
to increase accuracy
Microcontroller
Can it be programmed?
Do all devices interface correctly?
Yes
Yes
Manual Mode
Respond correctly to user input?
Yes
Auto Mode
Calculate Tsat correctly?
Enter into power save mode?
Yes
Yes.
Superheat range
Ultimately control superheat to
within specified range?
Yes. Set point can be changed in
code.
Fuzzy Control
Calculate correct response to
inputs?
Yes, hand calculations were
performed to verify
Pressure
Transducer
Whole System:
36
Summary of the Testing Procedure
Below is a summary of the testing procedure that was followed during the testing at
WaterFurnace. A detailed description of the testing procedure follows.
1) Power on the switching power supply and the control board.
2) Verify that all of the segments of the three-digit display are activating during
the reset process and that the valve is calibrating by checking the oscilloscope.
3) Test the up and down pushbuttons and verify that the push buttons are
commutating the valve by monitoring the oscilloscope.
4) Test the display mode LEDs and the display push button by pressing it to
scroll through the pressure, valve position, and temperature readings on the
three-digit display. While doing this, make sure that the temperature and
pressure values are corresponding to those on the laboratory data acquisition
system.
5) Verify that the mode select pushbutton is operating properly by depressing it
for 3 seconds to place the control in auto mode. Note that the auto mode LED
illuminates.
6) Monitor the display to verify that the control algorithm is indeed functioning
and verify this with the readings from the data acquisition system.
7) Once the system has reached steady state at the desired set point, introduce a
severe disturbance into the system. Monitor the display and the data
acquisition system to verify the control is responding to the disturbance.
Detailed Testing Procedure Description
In order to obtain accurate and valid test results, the heat pump system needs to be
setup by WaterFurnace to their specified test parameters. The room must be allowed to
stabilize for a minimum of 15 minutes prior to testing to obtain initial readings of the
system.
Before the testing begins 24VAC must be applied to the input of the switching
power supply and the development board should then be turned on. The first test is to
download the code to the microcontroller through the programming interface software,
AVR Studio, to make sure that the microcontroller is functioning properly.
Once the functionality of the microcontroller is verified, the other components of
the controller can be tested. At the startup of the controller, all of the LEDs and the
three-digit display are tested to verify proper connectivity in the circuit. The second
procedure that the controller executes is the calibration of the stepper motor. The
controller commands the stepper motor to move past its maximum opening position, 480,
to verify that the valve is completely open before commanding the motor to close to its
mid point, 240. An oscilloscope voltage probe is attached to the input of each motor
inputs and the voltage waveform is monitored to verify that the motor is commutating.
To ensure that the calibration routine behaves as expected, a data acquisition system in
37
the testing lab must display a change in pressure and temperature in the system during the
calibration procedure. Proper functionality of the calibration procedure also requires that
the three-digit display shows the correct valve position at completion of the procedure.
After calibration the control enters manual mode. In manual mode the controller only
responds to user input from four pushbuttons: valve up, valve down, mode switch, and
display switch pushbuttons. To verify that the valve up and valve down pushbuttons
function correctly, each button is individually pressed and held for five seconds. The
voltage waveform at the motor inputs is observed on the oscilloscope. The voltage
waveform must correctly match the voltage waveform of Figure 23, depending on the
direction of rotation and starting position (1-8) of the valve.
1
2
3
4
5
6
7
8
A
1
1
1
0
0
0
0
0
B
0
0
1
1
1
0
0
0
A'
0
0
0
0
1
1
1
0
B'
1
0
0
0
0
0
1
1
Open
Close
Figure 23 – Proper commutation series for opening and closing EEV
To test the sensor readings and their respective conversion algorithms, the threedigit display is used in conjunction with the display select pushbutton and the
temperature, pressure and position LEDs. The display button is pressed so that the
temperature LED is lit and a value is displayed on the three-digit display. The value is
then compared to the reading on the data acquisition system in the lab. The display button
is pressed again so that the pressure LED is lit and a value is displayed on the three-digit
display. This value is compared to the pressure reading on the data acquisition software
as well. The display pushbutton is pressed once more to show the valve position.
After completing the manual mode testing, the next step is to test the auto mode
functionality. To set the system into auto mode the mode select pushbutton is held down
for three seconds. The auto mode LED should be lit and the control algorithm is initiated.
In auto mode, the control reads the temperature and pressure, calculates the saturated
temperature from the pressure, and calculates the current superheat value and the change
in superheat from the previous reading. After performing the appropriate measurements
and calculations, the control enters the data into the fuzzy control algorithm to determine
the appropriate number of steps and the value of the proportional gain. The control then
38
commutates the motor the calculated number of steps. After commutating the control
displays the temperature, pressure, saturation temperature, superheat, change in
superheat, the number of steps that the valve commutated, and the valve position. This
display sequence is used to verify the fuzzy algorithm’s functionality by comparing the
displayed values to the values of temperature, pressure, and superheat of the system from
the data acquisition system in the lab. Auto mode will loop indefinitely keeping the
system to a user specified superheat set point, even with the addition of a disturbance to
the system.
Disturbance testing can be observed during testing by monitoring the data
acquisition system’s readings for temperature, pressure and superheat. Once the system
reaches steady state a disturbance can be introduced into the system. The most rapid and
severe disturbance to the system is a rapid change in the water temperature flowing
through the coax heat exchanger. For example, in cooling mode the inlet water
temperature can be increased from 77°F to 90°F to simulate a very hot day. Once the
disturbance is introduced the control display and laboratory data acquisition system will
display the control’s reaction.
Component Testing Results
Table 10 shows that all of the major components were individually tested and
proven to work as designed. This includes the LEDs, pushbuttons, microcontroller, and
sensors. The components worked together properly, and the logic of the control board
interfaces with each component correctly. Figures 24-27 show the motor commutation
during automatic and manual modes. The fuzzy control algorithm was verified with hand
calculations. This allows proper control of superheat using all of the components.
Figure 24– Oscilloscope waveform of valve opening in calibration mode
39
Figure 25 – Oscilloscope waveform of valve closing in calibration mode
Figure 26 – Oscilloscope waveform of valve closing in manual mode
40
Figure 27 – Oscilloscope waveform of valve opening in manual mode
41
System Testing Results
The control was tested with a 3-ton geothermal heat pump system to ensure all of
the design requirements were being met. This was done by interfacing the temperature
and pressure sensors at state point 4 (Figure 28). Using the control board in auto mode,
the EEV will commutate as an attempt to regulate superheat. The readings of
temperature, pressure and superheat are displayed on the 7 segment LEDs on the board.
These readings are then compared to values on WaterFurnace’s lab equipment. The
superheat values, as well as the time it take to reach 10°F ± 2°F are recorded and
evaluated. This was done for a variety of testing:
Test 1) Normal operation
Test 2) Operation with a change in coax inlet water temperature – Disturbance 1
Test 3) Operation with a mode switch – Disturbance 2
Test 4) Change in superheat set point
Test 5) Comparison of EEV with TXV
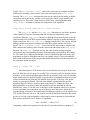
Each of the system tests were done at WaterFurnace’s development lab using a variety of
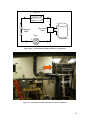
equipment. The temperature and pressure was monitored at state points 1 through 4
(Figure 28) and displayed using data acquisition software. The unit, shown in Figure 29,
was connected to an airflow chamber using ductwork. The development laboratory
allows an implementation of real world conditions to be simulated such as air
temperature, humidity, static pressure, and water flow rate and temperature at the inlet of
the coax. Entering and leaving water to the coax is shown in Figure 30.
Air Coil
4
3
Reversing
Valve
Expansion
Valve
Coax
2
1
Compressor
Figure 28(a) – Geothermal heat pump schematic for heating mode
42
Air Coil
4
3
Reversing
Valve
Expansion
Valve
Coax
1
Compressor
2
Figure 28(b) – Geothermal heat pump schematic for cooling mode
Air
Regulation
Leaving Air
Entering Air
Figure 29 – Connection of system to ductwork for airflow regulation
43
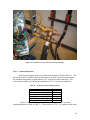
OUT
IN
Figure 30 – Connection of water into the coax heat exchanger
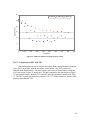
Test 1 – Normal Operation
Normal operation parameters for cooling mode testing are listed in Table 11. The
lab was set to these conditions until steady state was reached. At the listed parameters
the superheat temperature is approximately 25°F at the inlet of the compressor. The
valve must be capable of reducing the superheat to 10°F ± 2°F at these conditions.
Table 11 – Normal operation testing parameters
Parameter
Entering Dry Bulb Temp. [°F]
Entering Wet Bulb Temp. [°F]
Leaving Dry Bulb Temp. [°F]
Leaving Wet Bulb Temp. [°F]
Entering Water Temp. [°F]
Leaving Water Temp. [°F]
Normal Opp.
80
66
66
40
77
90
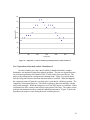
Figure 31 shows the change in superheat with respect to time in normal
operation parameters listed in Table 11. The set point of 10°F ± 2°F superheat at the inlet
44
of the compressor is achieved in about 5 minutes. This confirms that the valve is capable
of operating at normal conditions.
30
Superheat [°F]
25
20
15
10
5
0
100
200
300
400
500
600
700
800
Time [sec]
Figure 31 – Superheat vs. time for normal operation parameters listen in Table 11
Test 2 – Operation with a change in coax inlet water temperature – Disturbance 1
Figure 30 shows the inlet and outlet water lines for the coax heat exchanger.
Water is used in the coax to exchange heat from the refrigerant to the earth loop of a
geothermal system. In the normal condition stated above, the inlet temperature of the
coax water is 77°F. In order to confirm that the control can handle a disturbance, an
increase in the inlet water temperature was created. First the system was taken to steady
state at normal operation as described in Table 11. Next the inlet water temperature was
increased from 77°F to 90°F. This rapid increase in temperature is the worst-case
disturbance that can only be realized in the lab.
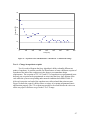
Figure 32 shows that as the water temperature changed, the level of the superheat
changed. When this occurred, the fuzzy control algorithm began to adjust the valve in
order to bring the level of superheat to the desired point. The rate of change in the inlet
water temperature was too great for the control to hold the superheat within the range
initially. Once the water temperature stabilized at 90°F the fuzzy control algorithm was
able to bring the superheat back down to the desired point. It should be noted that the
inlet water temperature is typically 50°F to 77°F, and this test was an exaggerated
disturbance. This proves the control’s functionality during disturbances.
45
20
18
Superheat [°F]
16
14
12
10
8
6
0
100
200
300
400
500
600
Time [sec]
Figure 32 – Superheat vs. time for normal operation parameters listen in Table 11
Test 3 Operation with a mode switch – Disturbance 2
In order to further prove the control’s ability to handle disturbance, another
disturbance was introduced again from normal operation. The unit was again allowed to
run in normal operation as described in Table 11 until steady state was achieved. The
unit was then changed from cooling mode to heating mode. Figure 28 (a and b) shows
how the refrigerant switches directions when the mode is switched. When this happens
the compressor turns off, then the reversing valve is switched to a different position. The
compressor is then turned back on. This mode switching is done automatically with the
unit’s main controller. While the compressor is off, the EEV begins to recalibrate. When
recalibrated, the EEV returns to the mid-way open point of 240 steps. The control is then
put back into automatic mode to control the superheat temperature. Figure 33 shows the
superheat with respect to time during the mode switching process.
46
30
Superheat [°F]
25
20
15
10
5
0
100
200
300
400
500
600
700
800
Time [sec]
Figure 33 – Superheat values with disturbance 2 introduced – a sudden mode change
Test 4 – Change in superheat set point
Test 4 is used to illustrate the fuzzy algorithm’s ability to handle different set
points of superheat. It could be possible for WaterFurnace to want a different set point of
superheat at the inlet of the compressor in the future to accommodate design
requirements. The set points of 5°F, 10°F and 15°F of superheat were programmed (note
that only one set point can be programmed at a time) into the fuzzy logic portion of the
code while the system was operating under normal conditions described in Table 11.
After each set point was loaded, the superheat was collected until that point was met.
Figure 34 shows the control’s ability to have a variety of set points programmed into it
and function properly. The 5°F set point was not able to be reach because the valve was
all the way open. It did however get in the 5°F± 2°F range.
47
30
T_SH = 5
T_SH = 10
T_SH = 15
25
Superheat [°F]
20
15
10
5
0
0
100
200
300
400
500
600
700
800
900
Time [sec]
Figure 34 – Different superheat set points in fuzzy control
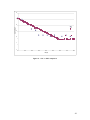
Test 5 - Comparison of EEV with TXV
The final system test was to compare the results from a typical thermal expansion
valve (TXV) to the EEV with the electronic control board. The TXV results were
obtained from WaterFurnace. The data is from a previous test WaterFurnace conducted
of a 3-ton system. Figure 35 shows the TXV data compared to the data shown in Figure
31 from normal testing. Both the TXV and EEV have the parameters described in Table
11. The EEV reaches the desired set point of 10°F ± 2°F within 5 minutes, which is three
minutes faster than the TXV.
48
30
25
20
Superheat(deg F)
EEV
TXV
15
10
5
0
0
100
200
300
400
500
600
700
800
Time(sec)
Figure 35 – TXV vs. EEV comparison
49
Section IV: Evaluation and
Recommendations
50
Evaluation and Recommendations
After completing the testing and reviewing the data from the testing the project
can be considered a success. The Controller was able to bring the superheat to the desired
set point of 10°F ±2°F and maintain it there. A recommendation to further improve the
performance of the controller is to implement another variable gain in the fuzzy control
algorithm to improve the controller when the superheat is at or near the desired set point.
This would lower the settling time of the controller when it is near the set point.
The user input and display interface operated according to the design
specifications allowing the user to select the display mode, move the valve position up or
down in manual mode and switch between manual and automatic mode. The pushbuttons
provided an easy way for the user to control the position of the valve and gather the
temperature, pressure, and position data. A recommendation to provide the user with
more control of the board in manual mode is to implement a method of allowing the user
to calibrate the valve when desired instead of manually having to reset the board.
The temperature and pressure sensor allowed the controller to gather the data
required in order to make the necessary calculations. The motor then commutated the
number of steps required to control the superheat. A recommendation to improve the
cost of the system is to change to a three temperature sensor design. This was a design
ruled out in the previous semester due to temperature to pressure correlations at the exit
of the EEV. If a method could be implemented to calculate pressure at the outlet of the
EEV, the three temperature design could be used to control the system. This would cut
the cost of the system due to the price of the pressure transducer.
51
Conclusion
52
The EEV control valve was developed for the growing industry of energy
conservation. The specific requirements of the board were given to the group by
WaterFurnace, a geothermal heating and cooling system manufacturer. After the
specifications were given, the geothermal system was modeled with a variety of
computer software programs. Several conceptual designs were drafted and evaluated.
The design chosen was a microcontroller based system with a fuzzy control algorithm,
and a temperature and pressure sensor configuration at the inlet of the compressor. A
schematic was designed and analyzed. Then a bread board prototype was constructed
and tested.
The testing done at WaterFurnace proved the functionality of the control board. It
was determined that one temperature sensor and one pressure sensor can be used to
determine the superheat at the inlet of the compressor. It was also determined that fuzzy
control is a valid method for maintaining a superheat in a geothermal system. The design
change to a development board will help WaterFurnace with future endeavors. The EEV
control board is virtually plug-and-play, meaning many different combinations of sensors
can be interface with the microcontroller. The board is stand-alone, meaning it can be
easily added to a current geothermal system to implement an EEV.
Maintaining the design superheat range allows for more efficient compressors to
be used further increasing a geothermal systems payback period. The result to the end
user is lower energy bills and an increase in the amount of comfort. This is the only
know EEV control board in the industry, which could mean a large earning potential for
WaterFurnace. The company would have an edge on the market for higher efficiency
units and could even market and sell the EEV controller to other companies in noncompeting heating and air conditioning areas. Both WaterFurnace and the group were
impressed with the end result of this project.
53
References
54
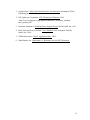
1. Gookin, Dan. C All-In-One Desk Reference For Dummies. Indianapolis: Wiley
Publishing Inc., 2004.
2. ILX Lightwave Corporation. NTC Thermistor Calibration. 2003.
<http://www.ilxlightwave.com/appnotes/thermistor_calibration_steinharthart_equation.pdf>.
3. Pressman, Abraham I. Switching Power Supply Design. McGraw-Hill, Inc., 1991.
4. Prinz, Peter and Tony Crawford. C In a Nutshell. First. Sebayopol: O'Reilly
Media, Inc., 2006.
5. STMicroelectronics. AN937 Application Note. 2005.
6. WaterFurnace Inc. Temperature vs. Resistance for 10Ω NTC thermistor.
55
Appendix
56
Appendix A
Software Source Code
57
LINE #
1
/*
2
Project:
Development Board for Electronic Expansion Valve Control
3
Sponsors:
WaterFurnace, Intl. & IPFW School of Engineering
4
5
6
7
8
9
10
11
Authors:
Contributors:
Release Date:
David Clendenen, Kurt Shively
Mark Adams, Randon Ripley
4/18/2008
Revision
--------
Date
---------
Modifier
----------------------
Description
--------------------
12
13
14
-15
16
17
18
19
20
21
22
23
24
25
26
27
28
29
30
31
32
33
34
35
36
37
38
39
40
41
42
43
44
45
46
47
48
49
50
51
52
53
54
55
56
57
58
59
60
61
62
63
64
65
66
REV 0
4/18/2008
D Clendenen, K Shively
Released
Revision History:
---------------------------------CODE START--------------------------------------PORTA
A0=RUNNING MODE LED: ON means running BROWN
A1=TEMP DISPALY LED: ON means TEMP is being displayed GREY
A2=POSITION DISPLAY LED: ON means valve POSITION being displayed RED
A3=AUTOMATIC MODE LED: ON means in auto mode PURPLE
A4=Future ADC
A5=Future ADC
A6=Temp ADC
A7=Pressure ADC
PORTB
B0=MODE PUSHBUTTON: switches between MANUAL(1) and AUTO(0) mode
B1=DISPLAY MODE PUSHBUTTON: switches DISPLAY mode (ACTIVE LOW)
B2=COMPRESSOR INPUT: ON(1) determines wheter system is active or not (ACTIVE LOW)
B3=POSITION -UP: INCREMENTS the vale position (ACTIVE LOW)
B4=POSITION DOWN: DECREMENTS the vale position (ACTIVE LOW)
B5=MANUAL MODE LED: ON means in manual mode ORANGE
B6=PRESSURE DISPLAY LED: ON means PRESSURE being displayed BLUE
B7=HEATING COOLING MODE select
B7 B6 B5 B4 B3 B2 B1 B0
1 1 1 1 1 1 1 1
PORTC
C0=ORANGE
C1=RED
C2=YELLOW
C3=BLACK
C4=DISP A
C5=DISP B
C6=DISP C
C7=DISP D
PORTD
D0=DISP
D1=DISP
D2=DISP
D3=DISP
D4=DISP
D5=DISP
D6=DISP
D7=DISP
*/
A
B
C
D
A
B
C
D
(ORANGE WIRE)
(GREEN WIRE)
(BLUE WIRE)
(BLACK WIRE)
RED
//ones place
YELLOW
BLACK
BROWN
// Tenths place
// Hundreds place
//--------------------LIBRARY
#include <stdio.h>
#include <avr/io.h>
#include <avr/interrupt.h>
DEFINITIONS---------// standard c io library
// the library for the avr i/o
// interrupt library
58
67
#include <math.h>
// math library
68
#define F_CPU 1000000UL
// 1 MHz
69
#include <util/delay.h>
// delay library
70
#include <avr/sleep.h>
// sleep library
71
72
//--------------GLOBAL VARIABLES------------------73
74
int i = 1;
// calibration variable
75
int delay = 25;
// time delay for stepper motor
76
int flash = 100;
77
int valve_pos;
// valve position
78
int cali_up = 70;
// valve calibration up
79
int cali_down = 31;
// valve calibration down
80
int debounce_time = 200;
// button debounce time
81
int man_delay = 150;
82
int a;
// temporary variable
83
int b;
// temporary variable
84
int c;
// temporary variable
85
int state;
//state of the stepper motor. There are 8 states
during commutation.
86
int displaya = 2;
//
87
int num;
// ADC for pressure sensor
88
int tem;
// ADC for temperature sensor
89
//
90
int read_press_adc ();
// pressure sensor ADC function
91
int pressint;
// integer value of the pressure value
92
int tempint;
// integer value of the temperature value
93
int read_temp_adc();
// temperature sensor ADC function
94
int fuzztime;
// delay between sensor readings in auto mode
95
int comp = 1;
// compressor on or off (0=off 1=on)
96
int sleepy;
//
97
int steps;
//
98
int ds_gain = 1;
// Gain for the derivative term
99
int ADCT;
// ADC variable for temperature
100
int ADCP;
// ADC variable for pressure
101
int ds_old;
// previous value of the derivative of superheat
102
103
104
int SSet = 10;
// Superheat value that the system should run at
105
106
107
int Tsat;
// saturation temp from lookup
108
int time = 0;
// time in seconds
109
int superheat;
// superheat variable
110
int ds;
// change in superheat
111
int sh_new;
// latest superheat value
112
int sh_old = 0;
// previous superheat value (initially set
to 0)
113
int steps_old;
// number
114
double samplerate = 0.50;
115
double k;
// step GAIN
116
double b0 = 11.30279;
// thermistor temperature calculation coefficient
(multiplied by 1000)
117
double b1 = 2.33948;
// thermistor temperature calculation coefficient
(multiplied by 1000)
118
double b2 = 0.000883065;
// thermistor temperature calculation coefficient
(multiplied by 1000)
119
float tem_F;
// variable for temperature calculation
120
float Rt;
// value of the thermistor resistance
121
float pressure;
// calculated value of pressure
122
float temperature;
// calculated value of temperature
123
124
125
void calibration();
// initializes CALIBRATION function
126
void manual_mode();
// initializes MANUAL MODE function
127
void auto_mode();
// initializes AUTO MODE function
128
void dec2bcd(int leds);
// initializes decimal to bcd functtion
129
void scan_up();
// initializes UP BUTTON scan function
130
void scan_down();
// initializes DOWN BUTTON scan function
131
void commutate();
// initializes commutation function
132
void disp_change();
// initializes display functtion
59
133
134
135
136
137
138
139
140
141
142
143
144
145
146
147
148
149
150
151
152
153
154
155
156
157
158
159
160
161
162
void press_a2d();
void temp_a2d();
void temp_lookup();
// initializes pressure a2d functtion
// initializes temp a2d functtion
// initializes temp calculation functtion
void fuzzy();
void kill();
// initializes fuzzy control algorithm
// stops the output voltage to the motor
void comp_chk();
void night_time();
// initializes compressor check functtion
// initializes sleep function
ISR(INT2_vect)
{
// Interrupt service routine for INT2
comp = 1;
calibration();
auto_mode();
}
//---------------MAIN BODY----------------------int main()
{
TCCR1B |= ((1 << CS10) | (1 << CS11)); // Set up timer at Fcpu/1024
//---------------------PORT DEFINITIONS------------------------
163
164
DDRA |= 0x0F;
// sets direction of PORTA pins 1=outputs, 0=input
165
DDRB |= 0xE0;
// sets direction of PORTB pins 1=outputs, 0=input
166
DDRC |= 0xFF;
// sets direction of PORTC pins 1=outputs, 0=input
167
DDRD |= 0xFF;
// sets direction of PORTD pins 1=outputs, 0=input
PORTC = 0x00;
// set the steppers outs low
//PORTB |= _BV(0);
// Enable pull up for pin 0, COMPRESSOR ON
172
PORTB |= _BV(1);
// Enable pull up for pin 1, DISPLAY button
173
PORTB |= _BV(0);
// Enable pull up for pin 2, MODE button
174
PORTB |= _BV(3);
// Enable pull up for pin 3, STEP UP button
175
PORTB |= _BV(4);
// Enable pull up for pin 4, STEP DOWN button
176
177
178
179
180
181
182
183
184
185
186
187
188
189
190
191
192
193
PORTB |= _BV(7);
// Enable pull up for pin 4, STEP DOWN button
168
169
170
171
//---------------------------------------------------------------
PORTA |= 0x01;
// make all pins HIGH (PORTA = 11111111)
// make all pins LOW (PORTA = 00000000)
_delay_ms(flash);
// 1 second delay
calibration();
// calls calibrate function for the EEV
disp_change();
//----------------------------------------------------------------
60
194
while(1)
195
{
196
manual_mode();
// enters MANUAL MODE function
197
auto_mode();
//entera auto mode function
198
}
199
return(0);
200
}
201
202
//----------------MANUAL MODE FUNCTION-----------------203
void manual_mode()
204
{
205
while(1)
// causes the code to remain in Manual mode until
interrupted
206
{
207
comp_chk();
// checks for the compressor signal
208
209
while(comp == 1)
// if the compressor is on, executes the below
210
{
211
time = 0;
212
fuzztime = 0;
213
214
215
//RUNNING LED is still on
216
PORTB |= (1 << 5);
// make the MANUAL MODE LED turn ON
217
//PORTA |= (1 << 2);
// make the VALVE POSITION LED turn
ON
218
PORTA &= ~(1 << 3);
// make the AUTO MODE LED turn OFF
219
PORTA &= ~(1 << 1);
220
221
while(time < 60)
// if no user input is received after 1 minute,
system goes to auto mode
222
{
223
comp_chk();
224
225
if (TCNT1 >= 15625)
// TCNT1 is the timer of the micro. 15625
clock cycles = 1 sec
226
{
227
time = time + 1;
// adds 1 sec to the current counted
time
228
TCNT1 = 0;
// Reset timer value
229
230
231
if (time == 60)
232
{
233
time = 0;
234
TCNT1 = 0;
235
//
auto_mode();
// system will enter auto mode after
1 min of no user input
236
237
}
238
}
239
240
scan_down();
// checks for DOWN button press
241
scan_up();
// checks for UP button press
242
243
disp_change();
// checks for DISPLAY button press
244
245
246
247
//The below checks if MODE button is
pressd for 2 seconds
248
if (bit_is_clear(PINB, 0))
249
{
250
_delay_ms(2000);
251
252
if (bit_is_clear(PINB, 0))
253
{
254
auto_mode();
255
}
256
}
61
257
}
258
}
259
260
261
}
262
}
263
264
265
266
//------------------AUTO MODE--------------------267
void auto_mode()
268
{
269
while(comp == 1)
270
{
271
272
comp_chk();
// checks to see if the
compressor is on
273
time = 0;
274
275
PORTB &= ~(1 << 5);
// Turn off the manual mode
LED
276
PORTB &= ~_BV(6);
277
PORTA &= ~_BV(1);
278
PORTA &= ~_BV(2);
279
PORTA |= (1 << 3);
// make the AUTO MODE LED
turn ON
280
281
while(time < 3 && comp == 1)
// checks if the MODE button
is held for 2 sec
282
{
283
284
if (bit_is_clear(PINB, 0))
285
{
286
_delay_ms(2000);
287
288
if (bit_is_clear(PINB, 0))
289
{
290
disp_change();
291
manual_mode();
292
}
293
}
294
295
if (TCNT1 >= 15625)
// wait for 3 sec before entering the
fuzzy algorithm
296
{
297
time = time + 1;
298
TCNT1 = 0; // Reset timer value
299
300
if (time == 3)
301
{
302
fuzzy();
303
304
TCNT1 = 0;
305
time = 0;
306
comp_chk();
307
308
}
309
}
310
311
}
312
}
313
comp_chk();
314
315
}
316
//-------------------DEC2BCD----------------------------317
318
319
320
321
void dec2bcd(leds)
{
PORTC &= ~_BV(7);
PORTC &= ~_BV(6);
// Clears all of the BCD values
62
322
PORTC &= ~_BV(5);
323
PORTC &= ~_BV(4);
324
PORTD &= ~_BV(7);
325
PORTD &= ~_BV(6);
326
PORTD &= ~_BV(5);
327
PORTD &= ~_BV(4);
328
PORTD &= ~_BV(3);
329
PORTD &= ~_BV(2);
330
PORTD &= ~_BV(1);
331
PORTD &= ~_BV(0);
332
333
if (leds >= 0)
334
{
335
336
a = (leds/100);
// breaks the integer value into 100's 10's
and 1's
337
b = (leds%100)/10;
338
c = (leds%100)%10;
339
}
340
341
342
343
if (leds < 0)
344
{
345
346
leds = -leds;
// converts a negative number into a positive
347
348
a = 14;
// sets the 100's digit to a negative sign
349
b = (leds%100)/10;
350
c = (leds%100)%10;
351
352
PORTD ^= (a << 4);
// outputs the values to the displays
353
PORTD ^= b;
354
PORTC ^= (c << 4);
355
356
return;
357
358
}
359
360
PORTD ^= (a << 4);
// outputs the values to the displays
361
PORTD ^= b;
362
PORTC ^= (c << 4);
363
364
}
365
366
367
//---------------Scan UP----------------This function checks for the UP
button to be pressed
368
void scan_up()
369
{
370
if (bit_is_clear(PINB, 3))
371
{
372
_delay_ms(man_delay);
// This is the debouncing time to
avoid artificial presses
373
374
if(bit_is_clear(PINB, 3))
375
{
376
_delay_ms(15);
377
378
state = state + 1;
// Changes the state value
379
commutate();
// commutates the motor to the new
state value
380
381
382
valve_pos = valve_pos + 1;
// Changes the valve position value
383
384
385
386
387
if (valve_pos > 480)
{
valve_pos = 480;
}
// limits the display to 480
63
388
389
dec2bcd(valve_pos);
390
_delay_ms(15);
391
392
TCNT1 = 0;
393
time = 0;
394
395
}
396
397
}
398
399
}
400
401
//---------------Scan DOWN----------------button to be pressed
402
void scan_down()
403
{
404
if (bit_is_clear(PINB, 4))
405
{
406
_delay_ms(man_delay);
407
408
if(bit_is_clear(PINB, 4))
409
{
410
_delay_ms(15);
411
state = state - 1;
412
commutate();
state value
413
414
415
valve_pos = valve_pos - 1;
416
417
418
419
420
421
422
423
424
425
426
427
dec2bcd(valve_pos);
_delay_ms(15);
// Displays the new valve position
// resets TCNT1 and time
This function checks for the DOWN
// Changes the state value
// commutates the motor to the new
// Changes the valve position value
// Displays the new valve position
TCNT1 = 0;
time = 0;
}
}
}
//----------------Motor Commutation-------------------------
428
void commutate()
429
{
430
431
432
if (state < 1)
// loops the commutation state if it
is less than 1
433
{
434
435
state = 8;
436
}
437
438
if (state > 8)
// loops the commutation state if it
is greater than 8
439
{
440
state = 1;
441
442
}
443
444
switch (state)
// each case corresponds to a different pulse for
commutation
445
{
446
case 1:
447
448
PORTC &= ~_BV(3);
449
PORTC &= ~_BV(2);
450
PORTC &= ~_BV(1);
451
PORTC |= _BV(0) ;
64
452
453
454
455
456
457
458
459
460
461
462
463
464
465
466
467
468
469
470
471
472
473
474
475
476
477
478
479
480
481
482
483
484
485
486
487
488
489
490
491
492
493
494
495
496
497
498
499
500
501
502
503
504
505
506
507
pulses.
508
509
510
511
512
513
514
515
516
517
518
519
520
routine
break;
case 2:
PORTC &=
PORTC &=
PORTC |=
PORTC |=
break;
~_BV(3);
~_BV(2);
_BV(1) ;
_BV(0) ;
PORTC &=
PORTC |=
PORTC &=
PORTC &=
break;
~_BV(3);
_BV(1) ;
~_BV(2);
~_BV(0);
PORTC &=
PORTC |=
PORTC |=
PORTC &=
break;
~_BV(3);
_BV(1) ;
_BV(2) ;
~_BV(0);
PORTC &=
PORTC |=
PORTC &=
PORTC &=
break;
~_BV(3);
_BV(2) ;
~_BV(1);
~_BV(0);
PORTC |=
PORTC |=
PORTC &=
PORTC &=
break;
_BV(3) ;
_BV(2) ;
~_BV(1);
~_BV(0);
case 3:
case 4:
case 5:
case 6:
case 7:
PORTC |= _BV(3)
PORTC &=
PORTC &=
PORTC &=
break;
;
~_BV(2) ;
~_BV(1);
~_BV(0);
case 8:
PORTC |= _BV(3)
PORTC &=
PORTC &=
PORTC |=
break;
;
~_BV(2);
~_BV(1);
_BV(0) ;
}
_delay_ms(15); // This delay MUST be here. It provides the delay between
Can be changed.
}
//-----------------------KILL---------------------------------void kill()
{
PORTC &=0xF0;
// Kills all output to the motor.
}
//-----------------------CALIBRATION------- This function provides the calibration
for the valve
65
521
void calibration()
522
{
523
524
PORTC = 0xE0;
// shows - on the 3-digit display
525
PORTD = 0xEE;
// shows - on the 3-digit display
526
527
PORTA |= (1 << 0);
// make the RUNNING LED turn ON
528
529
state = 0;
530
while (i<=cali_up)
// loop opens the valve past 480
531
{
532
533
commutate();
534
_delay_ms(delay);
535
state = state + 1;
536
537
if (state == 9)
//
538
{
539
i=i+1;
540
valve_pos=i*8;
541
}
542
543
}
544
545
546
i=60;
547
548
549
state = 8;
550
while (cali_down<=i)
//calibrate down to valve position 240
551
{
552
553
commutate();
554
_delay_ms(delay);
555
state = state - 1;
556
557
if (state == 0)//------------was 0
558
{
559
i=i-1;
560
valve_pos=i*8;
561
dec2bcd(valve_pos);
562
}
563
564
}
565
566
kill();
567
568
}
569
570
//----------------DISPLAY CHANGE--------------571
// This function changes the display between valve position, temperature and
pressure
572
void disp_change()
573
{
574
575
if (bit_is_clear(PINB, 1))
// Checks for the DISPLAY button to
be pressed
576
{
577
_delay_ms(man_delay);
578
579
if (bit_is_clear(PINB, 1))
580
{
581
582
time = 0;
583
584
temp_a2d();
// Obtains a new temperature value
585
586
press_a2d();
// Obtains a new pressure value
587
588
temp_lookup();
// Calculates a new saturated
temperature from the pressure
66
589
590
if (displaya == 2)
591
{
592
dec2bcd(valve_pos);
// Displays the valve
position
593
PORTA |= _BV(2);
// Turns on the POSITION LED
594
PORTA &= ~_BV(1);
595
PORTB &= ~_BV(6);
596
597
_delay_ms(200);
598
displaya = 0;
599
return;
600
}
601
602
if (displaya == 1)
603
{
604
dec2bcd(pressint);
// Displays the new integer
pressure value
605
PORTB |= _BV(6);
// Turns on the PRESSURE LED
606
PORTA &= ~_BV(1);
607
PORTA &= ~_BV(2);
608
609
610
_delay_ms(200);
611
displaya = 2;
612
return;
613
}
614
615
if (displaya == 0)
616
{
617
dec2bcd(tempint);
// Displays the new integer
temperature value
618
PORTA |= _BV(1);
// Turns on the TEMPERATURE
LED
619
PORTA &= ~_BV(2);
620
PORTB &= ~_BV(6);
621
622
_delay_ms(200);
623
displaya = 1;
624
return;
625
}
626
627
}
628
}
629
630
631
}
632
633
634
//--------------------PRESS A2D------- Sets up the ADC conversion and converts the
ADC to an integer
635
void press_a2d()
636
{
637
ADCSRA = 0x80;
// Enable ADC, set ADEN high
638
ADMUX = 0x07;
// 10-bit
639
num = read_press_adc();
640
641
pressure = (num - 98) * 0.884146341463415;
// 10-bit pressure
calculation
642
pressint = pressure;
643
}
644
645
//-------------------READ press A2D DATA----------- Reads the sensor output and
returns the value
646
int read_press_adc()
647
{
648
ADCSRA = (ADCSRA | 0x40);
//start conversion, set ADSC high
649
while ( ADCSRA & 0x40 );
//wait for conversion, ADSC to go low
650
67
651
ADCP = ADCL;
652
ADCP = ADCP + (ADCH << 8);
// Combines the ADCL and ADCH registers into
one value
653
654
return ADCP;
//return 10-bit data from ADCH
655
}
656
657
//----------------------------------------------------------658
659
660
//----------TEMP A2D----------------------------------------
661
void temp_a2d()
662
{
663
ADCSRA = 0x80;
// Enable ADC, set ADEN high
664
ADMUX = 0x04;
665
tem = read_temp_adc();
// calls the function to read the
sensor
666
667
Rt = ((1024000 / tem - 1000));
// Calculates the thermistor
resistance in kOhms
668
Rt = Rt * 3.3;
// Calculates the thermistor
resistance in kOhms
669
670
// The below is the conversion of the ADC integer into a temperature value
671
temperature = b1 * log(Rt);
672
temperature = (log(Rt)) * (log(Rt)) * (log(Rt)) * b2 + temperature;
673
temperature = (temperature + b0) / 10000;
674
temperature = 1 / temperature - 273;
675
temperature = 9 * temperature;
676
temperature = temperature / 5;
677
temperature = temperature + 30;
678
tempint = temperature;
679
680
681
682
}
683
//-------------------READ TEMP A2D DATA------- Reads the sensor output and returns
the value to TEMP A2D
684
int read_temp_adc()
685
{
686
ADCSRA = (ADCSRA | 0x40);
//start conversion, set ADSC high
687
while ( ADCSRA & 0x40 );
//wait for conversion, ADSC to go low
688
689
ADCT = ADCL;
690
ADCT = ADCT + (ADCH << 8);
// Combines the ADCL and ADCH
registers into one value
691
692
return ADCT;
//return 10 bit data from ADCH
693
}
694
695
696
//-----------------SAT TEMP LOOK UP------------------ Calculates saturated
temperature from the pressure
697
void temp_lookup()
698
{
699
700
701
Tsat = 0.000001123579*pressure*pressure*pressure 0.001292926247*pressure*pressure;
702
Tsat = Tsat + 0.696670171744*pressure - 27.015;
703
704
}
705
706
//---------------COMPRESSOR ON CHECK------------------ Function checks for
compressor input
707
void comp_chk()
708
{
709
68
710
sleepy = 0;
711
712
if(bit_is_clear(PINB,2))
713
{
714
_delay_ms(20);
715
716
if(bit_is_clear(PINB,2))
717
{
718
comp = 0;
719
PORTA &= ~_BV(0);
720
//
return;
721
722
while(sleepy < 15)
// Delay between compressor off and
sleep mode
723
{
724
725
if (TCNT1 >= 15625)
726
{
727
PORTB &= ~_BV(5);
728
sleepy = sleepy + 1;
729
TCNT1 = 0;
// Reset timer value
730
731
if (sleepy == 15)
732
{
733
PORTB &= ~_BV(5);
734
PORTB |= _BV(6);
735
_delay_ms(2000);
736
night_time(); // Puts the control
into a low power mode
737
}
738
739
if(bit_is_set(PINB,2))
740
{
741
_delay_ms(20);
742
743
if(bit_is_set(PINB,2))
744
{
745
746
PORTA |= _BV(0);
747
comp = 1;
748
return;
749
}
750
}
751
}
752
753
}
754
//
}
755
756
_delay_ms(2000);
757
comp = 1;
758
PORTA |= _BV(0);
759
760
}
761
}
762
763
}
764
765
//----------------------NIGHT TIME-------------------------766
void night_time()
767
{
768
GICR &= ~(1 << INT2);
// disable INT2 to prevent false triggers
(NEEDED!!!)
769
MCUCSR |= (1 << ISC2);
// positive edge INT2
770
GIFR |= (1 << INTF2);
// clear any pending interrupts
771
GICR |= (1 << INT2);
// enable INT2 interrupts
772
773
774
775
PORTB &= ~_BV(6);
776
set_sleep_mode(SLEEP_MODE_PWR_DOWN);
777
sei();
69
778
sleep_mode(); // This is where the microcontroller goes into power
save mode
779
780
781
782
}
783
//----------------------FUZZY------------------------------784
785
void fuzzy()
786
{
787
788
while(fuzztime < 25)
// Delay between sensor sampling
(seconds)
789
{
790
791
if (bit_is_clear(PINB, 0))
// Checks if the MODE button is held
for 1.5s
792
{
793
_delay_ms(1500);
794
795
if (bit_is_clear(PINB, 0))
796
{
797
fuzztime = 0;
798
manual_mode();
799
}
800
}
801
802
if (TCNT1 >= 15625)
803
{
804
fuzztime = fuzztime + 1;
805
TCNT1 = 0; // Reset timer value
806
807
}
808
809
}
810
811
fuzztime = 0;
812
813
814
temp_a2d();
// read temperature sensor
815
816
press_a2d();
// read pressure sensor
817
818
temp_lookup();
// calculate Tsat
819
820
dec2bcd(valve_pos);
821
822
superheat = temperature - Tsat;
// calculate the latest
superheat
823
sh_new = superheat;
824
825
ds = sh_new - sh_old;
// calculate the change in superheat
826
827
828
829
ds = ds * 2;
// scaling factor for DS
// Variable sampling rate --------------------------------------------
830
k = 1;
831
832
if( superheat-SSet > 3)
833
{
834
if (ds > 2 || ds < -2)
835
{
836
k = 2;
837
fuzztime = 8;
if DS is large
838
}
839
}
840
841
if( superheat-SSet >= 5)
// Gain for the steps
// Gain for the steps
// Decreases the next sampling period
70
842
{
843
if (ds > 2 || ds < -2)
844
{
845
k = 3;
// Gain for the steps
846
fuzztime = 12;
// Decreases the next sampling period
if DS is large
847
}
848
}
849
850
//-----------------------851
852
if (superheat < SSet)
853
{
854
k = -1;
// if the superheat is too low, this gain changes
the step direction
855
superheat = SSet+10 - superheat;
856
ds = -ds;
857
}
858
859
if (ds > 20)
860
{
861
ds = 20;
862
}
863
864
if (ds < -20)
865
{
866
ds = -20;
867
}
868
869
if (ds<-10)
870
{
871
if (superheat==SSet)
872
{
873
steps= -0.123*ds*ds - 2.768*ds - 30.62;
874
}
875
876
if (superheat>SSet && superheat<=SSet+1)
877
{
878
steps= 0.02416*ds*ds*ds + 0.95688*ds*ds + 12.69588*ds + 44.31142;
879
}
880
881
if (superheat>SSet+1 && superheat<=SSet+2)
882
{
883
steps=0.01715*ds*ds*ds + 0.64880*ds*ds + 8.39021*ds + 27.61058;
884
}
885
886
if (superheat>SSet+2 && superheat<=SSet+3)
887
{
888
steps= -0.099*ds*ds - 2.002*ds - 16.444;
889
}
890
891
if (superheat>SSet+3 && superheat<=SSet+4)
892
{
893
steps=-0.065*ds*ds - 0.773*ds - 4.451;
894
}
895
896
if (superheat>SSet+4 && superheat<=SSet+5)
897
{
898
steps=0.01315*ds*ds*ds + 0.59145*ds*ds + 10.05298*ds + 54.52301;
899
}
900
901
if (superheat>SSet+5 && superheat<=SSet+6)
902
{
903
steps=0.02485*ds*ds*ds + 1.09724*ds*ds + 17.05530*ds + 89.43916;
904
}
905
906
if (superheat>SSet+6 && superheat<=SSet+7)
907
{
908
steps=0.02257*ds*ds*ds + 0.99967*ds*ds + 15.71735*ds + 86.11652;
909
}
910
71
911
912
913
914
915
916
917
918
919
920
921
922
923
924
925
926
927
928
929
930
931
932
933
934
935
936
937
938
939
940
941
942
943
944
945
946
947
948
949
950
951
952
953
954
955
956
957
958
959
960
961
962
963
964
965
966
967
968
969
970
971
972
973
974
975
976
977
978
979
980
981
if (superheat>SSet+7 && superheat<=SSet+8)
{
steps=0.02199*ds*ds*ds + 0.99841*ds*ds + 16.07877*ds + 91.69972;
}
if (superheat>SSet+8 && superheat<=SSet+9)
{
steps=0.02293*ds*ds*ds + 1.04454*ds*ds + 16.79148*ds + 97.65075;
}
if (superheat>SSet+9)
{
steps=0.01242*ds*ds*ds + 0.55907*ds*ds + 9.57142*ds + 67.21499;
}
}
if (ds<0 && ds>=-10)
{
if (superheat==SSet)
{
steps=0.01259*ds*ds*ds + 0.18896*ds*ds + 2.12770*ds - 0.01350;
}
if (superheat>SSet && superheat<=SSet+1)
{
steps=0.02252*ds*ds*ds + 0.32376*ds*ds + 2.48397*ds + 3.72657;
}
if (superheat>SSet+1 && superheat<=SSet+2)
{
steps=0.02106*ds*ds*ds + 0.30427*ds*ds + 2.44311*ds + 6.31417;
}
if (superheat>SSet+2 && superheat<=SSet+3)
{
steps=0.02106*ds*ds*ds + 0.32749*ds*ds + 2.67528*ds + 8.74842;
}
if (superheat>SSet+3 && superheat<=SSet+4)
{
steps=0.02252*ds*ds*ds + 0.35182*ds*ds + 2.76462*ds + 11.25664;
}
if (superheat>SSet+4 && superheat<=SSet+5)
{
steps=0.01251*ds*ds*ds + 0.18754*ds*ds + 2.12069*ds + 14.98441;
}
if (superheat>SSet+5 && superheat<=SSet+6)
{
steps=0.062*ds*ds + 1.818*ds + 15.22;
}
if (superheat>SSet+6 && superheat<=SSet+7)
{
steps=0.097*ds*ds + 1.941*ds + 16.00;
}
if (superheat>SSet+7 && superheat<=SSet+8)
{
steps=0.01598*ds*ds*ds + 0.35913*ds*ds + 2.90559*ds + 17.70294;
}
if (superheat>SSet+8 && superheat<=SSet+9)
{
steps=0.02358*ds*ds*ds + 0.48252*ds*ds + 3.36313*ds + 20.09441;
}
if (superheat>SSet+9)
{
steps=0.01076*ds*ds*ds + 0.28823*ds*ds + 2.82362*ds + 25.08042;
72
982
983
984
985
986
987
988
989
990
991
992
993
994
995
996
997
998
999
1000
1001
1002
1003
1004
1005
1006
1007
1008
1009
1010
1011
1012
1013
1014
1015
1016
1017
1018
1019
1020
1021
1022
1023
1024
1025
1026
1027
1028
1029
1030
1031
1032
1033
1034
1035
1036
1037
1038
1039
1040
1041
1042
1043
1044
1045
1046
1047
1048
1049
1050
1051
1052
}
}
if (ds>=0 && ds<=10)
{
if (superheat==SSet)
{
steps = -2*.00001*ds*ds + 1.406*ds;
}
if (superheat>SSet && superheat<=SSet+1)
{
steps = 0.062*ds*ds + 0.570*ds + 3.280;
}
if (superheat>SSet+1 && superheat<=SSet+2)
{
steps = 0.099*ds*ds - 0.019*ds + 6.338;
}
if (superheat>SSet+2 && superheat<=SSet+3)
{
steps = 0.121*ds*ds - 0.409*ds + 9.164;
}
if (superheat>SSet+3 && superheat<=SSet+4)
{
steps = 0.128*ds*ds - 0.340*ds + 11.4;
}
if (superheat>SSet+4 && superheat<=SSet+5)
{
steps = 0.128*ds*ds - 0.382*ds + 15.51;
}
if (superheat>SSet+5 && superheat<=SSet+6)
{
steps = 0.128*ds*ds - 0.382*ds + 15.51;
}
if (superheat>SSet+6 && superheat<=SSet+7)
{
steps = 0.137*ds*ds - 0.652*ds + 16.63;
}
if (superheat>SSet+7 && superheat<=SSet+8)
{
steps = 0.142*ds*ds - 0.630*ds + 17.7;
}
if (superheat>SSet+8 && superheat<=SSet+9)
{
steps = 0.126*ds*ds - 0.683*ds + 20.4;
}
if (superheat>SSet+9)
{
steps = 0.027*ds*ds - 0.277*ds + 25.29;
}
}
if (ds>10)
{
if (superheat==SSet)
{
steps = 0.137*ds*ds - 3.245*ds + 34.51;
}
if (superheat>SSet && superheat<=SSet+1)
{
steps = 0.137*ds*ds - 3.245*ds + 34.51;
73
1053
}
1054
1055
if (superheat>SSet+1 && superheat<=SSet+2)
1056
{
1057
steps = 0.158*ds*ds - 4.086*ds + 42.41;
1058
}
1059
1060
if (superheat>SSet+2 && superheat<=SSet+3)
1061
{
1062
steps = 0.027*ds*ds*ds - 1.086*ds*ds + 14.32*ds - 44.48;
1063
}
1064
1065
if (superheat>SSet+3 && superheat<=SSet+4)
1066
{
1067
steps = 0.026*ds*ds*ds - 1.084*ds*ds + 14.27*ds - 40.99;
1068
}
1069
1070
if (superheat>SSet+4)
1071
{
1072
steps=25;
1073
}
1074
}
1075
1076
sh_old = sh_new;
1077
ds_old = ds;
1078
steps = steps * k;
1079
steps_old = steps;
1080
1081
1082
while (steps > 0)
// Commutates the motor the
calculated number of steps
1083
{
1084
commutate();
1085
steps = steps - 1;
1086
valve_pos = valve_pos + 1;
// This needs to be opposite sign as
previous line
1087
dec2bcd(valve_pos);
1088
1089
state = state + 1;
1090
}
1091
1092
while (steps < 0)
// Commutates the motor the
calculated number of steps
1093
{
1094
commutate();
1095
steps = steps + 1;
1096
valve_pos = valve_pos - 1;
// This needs to be opposite sign as
previous line
1097
dec2bcd(valve_pos);
1098
1099
state = state - 1;
1100
}
1101
1102
kill();
1103
1104
1105
dec2bcd(tempint);
// Displays the temperature for
debugging purposes
1106
_delay_ms(5000);
1107
1108
dec2bcd(pressint);
// Displays the pressure for
debugging purposes
1109
_delay_ms(5000);
1110
1111
dec2bcd(Tsat);
// Displays Tsat for debugging
purposes
1112
_delay_ms(5000);
1113
1114
dec2bcd(superheat);
// Displays the superheat for
debugging purposes
1115
_delay_ms(5000);
74
1116
1117
dec2bcd(ds);
1118
_delay_ms(5000);
1119
1120
dec2bcd(steps_old);
debugging purposes
1121
_delay_ms(5000);
1122
1123
dec2bcd(valve_pos);
debugging purposes
1124
1125
1126
}
// Displays DS for debugging purposes
// Displays the number of steps for
// Displays the valve position for
75