1
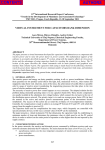
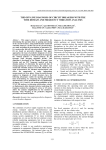
2nd IFAC Workshop on Convergence of Information Technologies
and Control Methods with Power Systems
May 22-24, 2013. Cluj-Napoca, Romania
Web based monitoring of solar power systems
Nicoleta Stroia, Daniel Moga, Zsolt Barabas
Technical University of Cluj-Napoca,
Memorandumului 28, Cluj-Napoca, Romania
(e-mails: [email protected], [email protected], [email protected])
Abstract: A web-based solution is presented for remote monitoring of solar power systems. A webserver
is implemented on an ARM Cortex-M3 microcontroller and accommodates the required functionality for
remote monitoring and control of multipoint networks containing a variety of sensing and control nodes
used in solar power system. Web based monitoring software consisting of an application running on the
embedded platform and a PC application suite that supports configuring, installing and maintaining of all
system components was developed.
Keywords: telematics, embedded systems, real-time communication, monitored control systems,
man/machine interfaces, renewable energy systems
1. INTRODUCTION
-
PC application which collects data and makes them
accessible to other applications via Intranet/Internet;
Remote monitoring is a proven solution in applications like
environmental monitoring (temperature, humidity, light, wind
speed) or monitoring of industrial systems health.
-
embedded web servers.
Low size and low power devices are desirable in such
applications, and in some cases necessary. In many cases
application’s hardware has to be deployed on the field,
running on power from a battery or a solar panel.
The possibility of remote data visualization and on line data
acquisition is an essential requirement in many situations.
Web technology is extremely attractive when it comes to
monitoring and control of a system, allowing remote access
over the Internet. However, some issues have to be
considered in relation with web based implementations
[Warnier et al. (2003)]: the aspect of time delay (which can
lead to irregular data transmission and data loss), and the
problem of security (when malicious hackers can grant access
to a system).
While the setups in the first category (Fig. 1) are coming with
a full range of services, the costs associated with their
installation, licensing, maintenance, and power consumption
have to be carefully considered. For such reasons, these are
rather suitable for big power, concentrated systems or for
large scale, small power installations, distributed across a
considerable territory.
Internet
Real Time
Monitoring
Web Server
Main parameters that are currently considered for monitoring
the operation of solar system are:
-
voltage and current (PV panels);
Client
Client
Database
Server
S
S
S
S
-
angular position (tracking panels);
-
wind speed;
-
panel/collector/pipes temperatures;
-
outdoor temperature;
-
light intensity;
Fig. 1. Architecture for plants in an Internet portal
-
rain/snow level.
The second category of solutions is in fact combining a data
logging functionality with remote transmission services. The
PC is chosen for the ease of remote accessing measurement
data over LAN or WAN networks.
TCP/IP connection
real-time monitoring web server connected to a
database server and accessed through an Internet
portal [Lim et al.(2008)];
978-3-902823-32-8/2013 © IFAC
Plant
Internet/Intranet
Three categories of solutions are predominantly encountered
in the field of remote monitoring:
-
Eth
module
As some experiments indicate, a reliable performance is not
generally obtained with a PC centred setup. Scofield et al.
(2004) compared the operation of a dedicated (embedded)
131
10.3182/20130522-3-RO-4035.00046
IFAC ICPS'13
May 22-24, 2013. Cluj-Napoca, Romania
data logger with that of a PC-based setup and found that only
1 minute of data has been lost by the data logger in the 340
days of operation whereas the PC’s have locked up, and
required rebooting, on several occasions.
A known platform for monitoring solar systems was
developed by SMA Solar Technology AG. This platform
offers an Internet portal (Sunny Portal- for plants equipped
with SMA communication products) for monitoring,
visualisation and presentation of plant data. After the product
is registered in the portal, plant operators, installers and
service technicians have access to key data at any time, from
any location. Pre-configured standard pages are available at
first access which can be customized with individual
information such as tables, plant description, XY diagrams,
graphs, images, texts, plant overview, plant monitoring
[SMA America, LLC (2011)]. The monitoring device Sunny WebBox- is implemented as an energy-efficient data
logger that allows remote monitoring and maintenance of
large solar power plants, offering a wealth of options for
displaying, archiving and processing of data, and error
alarming functions [SMA America, LLC (2011b)].
This paper presents a solution for web-based monitoring on
an ARM Cortex-M3 microcontroller. It accommodates the
required functionality for remote monitoring and control of
multipoint networks containing a variety of sensing and
control nodes. The arguments for the chosen solution include
reliability, low cost and low power. Other results indicate
these as valuable attributes of microcontroller based
implementation for web based interfacing with automation
systems [Rosado-Munoz et al. (2012)].
2. SYSTEM ARCHITECTURE
As indicated in Norman, K. (2007) there is a series of design
consideration that must be carefully analysed if a low cost
solution is envisioned:
-
The main tasks of the NXP LPC1768 board are to run a web
server and to allow monitoring and control of a multidrop
network (RS485) containing nodes (Fig. 2) with the roles of
controllers, smart sensors and smart actuators (based on very
low cost 8 bit microcontrollers).
Internet
Eth
S
usage of a microcontroller with ample on-chip
memory for storing and serving the web content
eliminates the delays caused by the transfer of data
from externally attached memories;
-
usage of a microcontroller with sufficient
performance in order to handle a complex
application besides the network communication. For
this
purpose,
besides
other
performance
considerations such as fast memory and interrupt
processing, choosing a 32-bit microcontroller is
critical;
building the device around a microcontroller whose
vendor offers a complete web server solution allows
embedded engineers to quickly get a final product to
market.
S
S
ARM Cortex-M3
RS485
RS485/UART
S
Fig. 2. Architecture of the web based monitoring system.
3. MONITORING SOFTWARE PLATFORM
The web based monitoring software consists of an application
running on the NXP1768 platform and a PC application suite
that supports configuring, installing and maintaining of all
system components.
These PC applications have to facilitate:
usage of a microcontroller that integrates both MAC
and PHY on-chip is an advantage since it ensures a
reliable Ethernet system and allows savings on the
designer BOM cost through consolidation of
functionality and reduction in footprint;
-
-
The solution presented in what follows is based on the NXP
LPC1768 - a 32 bits ARM Cortex-M3 core, running at
96MHz. This solution includes 512KB FLASH, 64KB RAM
and a series of interfaces including built-in Ethernet, USB
Host and Device, CAN, SPI, I2C, ADC, DAC, PWM and
other I/O interfaces.
-
easy creation and editing of configurations for
multipoint networks;
-
configuration and control of the network elements;
-
downloading and displaying the data logged on the
Ethernet module;
-
visualization of measured data in real-time or
visualization of archived data;
-
automatic generation of the webserver pages from
an HMI visualization layout;
-
monitoring
elements.
the
values/states
of
the
network
The flow indicating the files generated, exchanged and used
by the embedded and PC applications is presented in Fig. 3.
Qt was chosen for development because it is a full
development framework with tools designed to streamline the
creation of applications and user interfaces for desktop,
embedded and mobile platforms, allowing reusing code
efficiently and targeting multiple platforms with one code
base.
132
IFAC ICPS'13
May 22-24, 2013. Cluj-Napoca, Romania
3.1 Embedded application
Since in this approach the on-site equipment has to contain
only embedded hardware, the application running on the
NXP1768 board has to provide a full list of functionalities:
-
a web server for implementing an HMI;
-
functionalities required for monitoring of the
network elements;
-
data logging of the values acquired from the
measurement network;
-
alarming and alarms history;
-
translation and delivering of user commands to the
network elements;
-
At start-up, the embedded application expects a series of files
such as the network description file, the files containing the
patterns of the messages exchanged in the network, the files
with alarm conditions description and the web server pages.
An USB stick and an external SPI flash are used for storage.
After configuration was loaded, the main tasks of the
embedded application are to run the HTTP server, to translate
the commands sent by the client using the command patterns
into messages which can be understood by the recipient
network element, to send and interpret the result, to monitor
the network elements, to check alarm conditions, to alarm
and save alarm history, to periodically log the data, to accept
TCP sockets connections on a predefined port for remote
monitoring and control (Fig. 4).
Sockets for
HTTP Server
FTP Server remote monitoring
(with CGI Scripting)
and control
TCP
FTP server for data logger files transfer;
Ethernet
TCP sockets for remote monitoring and control.
Configuration
Editor
Viewer
SPI
Flash
The module can run either in active mode when used in
passive networks (from the communication point of view all
nodes are slaves), or in gateway mode when used in active
networks (there are controller nodes that initiate dialogues
with other sensor nodes - acting as slaves).
xml installation plan layout
In the active mode, the module periodically asks the
value/state of the network elements, interprets the response
messages and stores the values/states into a RAM table,
whereas in gateway mode, the module listens to the messages
exchanged in the network, interprets these messages and
saves the values/states of the network elements into a RAM
table. When a request about the current value/state of a
network element is received via the Ethernet interface, the
last record stored into the RAM table is returned.
xml network description
data logs
Basic Layout
Editor
The Ethernet module creates a new log file every day. The
file name contains information about the date in which
recording was made. A record contains: network element
address, time stamp (date and hour), network element
value/state. Alarms are logged into xml files. The web server
informs the client browser about the alarm status. At the user
request of viewing the alarms, the xml files with alarm
history are transferred to the client browser using AJAX
technology. The client then translates the received xml files
into an html table and displays it to the user in a new page.
embedded application files
Embedded
application
Remote Transfer
Interface
USB
Device
Monitoring module
User commands handler
Data logger
Alarming and alarm history
Fig.4. Simultaneous tasks running on the embedded platform
xml configuration layout
Monitor
Flash File System
Visualization
Interface
downloaded data logs
Fig. 3. Files exchanged and used by the applications
The environment chosen for embedded application
development was Keil MDK-ARM, with the libraries RLTCPnet and RL-Flash file system. The HTTP server,
supported by the RL-TCPnet library, has a Common
Gateway Interface (CGI) that allows the client to input and
output data to/from the embedded C application. The RLFlash file system allows placement of a PC-compatible file
system in any region of a microcontroller’s memory,
including the on-chip and external RAM and Flash memory,
as well as SPI based Flash memory and SD/MMC memory
cards.
AJAX (Asynchronous JavaScript and XML) is based on
internet standards, and uses a combination of
XMLHttpRequest object (to exchange data asynchronously
with a server), JavaScript/DOM (to display/interact with the
information), CSS (to style the data) and XML (often used as
the format for transferring data). When frequently changing
data are displayed, AJAX technology is preferable since it
can isolate dynamic data within a group of XML tags and
update it at a period defined within the html page. It can
support an efficient way to pass data to/from the web server
and the C application code running on the microcontroller. In
the RL-TCPnet library, this is done through a standard
protocol for interfacing application software to a TCP/IP
server, the Common Gateway Interface (CGI) protocol. The
RL-TCPnet library supports a simple CGI scripting language
133
IFAC ICPS'13
May 22-24, 2013. Cluj-Napoca, Romania
containing four basic commands (Table 1), which must be
placed at the beginning of each HTML line within a page that
uses the CGI gateway.
Table 1. CGI scripting language commands
Cmd
Description
i
Include a HTML file and output it to the browser.
t
The characters following this command are a line of
HTML and should be output to the browser.
c
This line of text is a command line and the CGI
interface will be invoked.
.
A period ( . ) must be placed at the end of a CGI file.
An example of an HTML file that is intended to output to the
web browser a dynamically changing data, a temperature
measurement result, would look like this:
t <HTML> <BODY>
t <H2 ALIGN=CENTER> Network Elements </H2>
c STEMP.Value <p> STEMP %s C</p>
t </BODY>
t </HTML>
.
3.2 Remote transfer and visualization interfaces
3.3 Applications for editing, viewing, monitoring and control
The configuration application, Configurator, was designed to
facilitate creation and editing of configurations for multipoint
networks. In such a configuration different types of nodes can
be added such as gateways, sensors, controllers and actuators.
Two types of layouts can be edited: the configuration
visualization layout and the installation plan visualization
layout. When editing the configuration visualization layout,
the network elements are grouped into processes and the
processes into locations. Properties are assigned to each
network node such as an unique address, gain, minimum and
maximum value, measuring unit, location and process. Icons
can be associated to each network element, to processes and
locations and the possibility of setting a background image or
a background colour to the configuration visualization layout
is also available. When editing the installation plan
visualization layout, the user has the possibility of setting the
background image representing the installation plan (SVG or
other image format), of placing the network elements at the
desired location and associating an icon to each of them. The
application generates a network description file in XML
format, named network.xml, which contains all the network
nodes with the associated properties. The information related
to a temperature sensor from such a network file is presented
in what follows:
<network>
Two PC applications were developed for downloading and
visualizing the data logged on the Ethernet module. The first
application, Remote Transfer Interface, allows the user, (after
an initial configuration of the parameters for communication
with the Ethernet module, path to the directory where the data
will be downloaded, language in which the application
interface is displayed), to remotely connect to the Ethernet
module, download the log files (all of them, or the logs
recorded within a user selectable time period), erase old log
files (this is necessary from time to time since the storage
capacity is limited to the USB flash size), download network
configuration file (needed by the visualization application),
replace network configuration file and replace device
configuration (the files needed by the Ethernet module in
order to function properly).
The second application, Visualisation Interface, allows the
user, based on the network configuration file, to visualize the
data downloaded from the device. The user has the
possibility after selecting one of the network elements and a
date using the calendar form provided by the interface, to
view the data recorded in that day. In the newly displayed
window, the following facilities are available:
-
visualization of the log data for one or multiple
network elements;
-
comparison of the records for multiple network
elements on the same day or on different days;
-
printing of the displayed graph and generation of
reports in PDF format for one or multiple network
elements.
134
<value>12</value>
<element>
</property>
<name>Tsoil</name>
<property>
<type>temperature_sensor</type>
<name>Precision</name>
<address>f</address>
<value>0.5</value>
<nrofprops>12</nrofprops>
</property>
<property>
<property>
<name>Location</name>
<name>MeasuringUnit</name>
<value>M3-SOL</value>
<value>C</value>
</property>
</property>
<property>
<property>
<name>Process</name>
<name>Timeout</name>
<value>TEMP</value>
<value>1500</value>
</property>
</property>
<property>
<property>
<name>SamplingPeriod</name>
<name>Gain</name>
<value>5000</value>
<value>0.1</value>
</property>
</property>
<property>
<property>
<name>MinValue</name>
<name>Offset</name>
<value>-40</value>
<value>0</value>
</property>
</property>
<property>
<property>
<name>MaxValue</name>
<name>Gateway</name>
<value>125</value>
<value>gateway</value>
</property>
</property>
<property>
</element>
<name>Resolution</name>
</network>
IFAC ICPS'13
May 22-24, 2013. Cluj-Napoca, Romania
Besides the network configuration file, the application
generates two XML files in SMIL format, describing the
configuration visualization layout and the installation plan
visualization layout. For layout representation, a hierarchical
structure was chosen. Qt’s GraphicsView framework is used
for the graphical representation of the elements on the screen.
Hence, the geometry of the elements is described using
hierarchical region tags with attributes id, top, left, height,
width and z-index, and the information related to the content
of that region is placed in the SMIL body section and is
described by tags such as brush, img and ref. The top level
region specifies the layout dimension and has the position
and geometry specified in pixels and the smallest z-index
value. All the other regions have the position specified in
percentage related to their parent region. This kind of
representation increases the flexibility of the graphical
representation, since by modifying the top level region’s
geometry, all the child regions are automatically scaled.
The monitoring application, Monitor, is a console application
which allows, based on the network description file,
monitoring and control of the network elements. The
application communicates with the Ethernet module through
a TCP socket on a predefined port, and periodically asks the
value/state of each network element and logs the received
data and the error states into local files. Another task of this
application is to send user commands and to expect
responses. Since this application does not have a user
interface, the commands are written by the viewing
application into a file, commands.txt. The monitoring
application checks for the commands file change, and if so,
reads each of these commands, sends them to the Ethernet
module, waits for the result and updates the command file,
thus informing the viewing application about the result of the
commands.
The viewing application, Viewer, uses the layout files and the
network description file generated by the Configurator, and
the data logs created by the Monitor in order to allow the user
to view the network configuration, the installation plan and
the measurements in graphical form. The current value/state
of each network element can be viewed in real-time. The
main window of the application presents the configuration
layout in graphical form. From here the user can choose to
view the measurements for the network elements in a new
interface, the visualization interface, or can choose to see the
interface presenting the installation plan layout, the
installation plan viewer. From the visualization interface the
user has also the possibility to control the state of the
network’s controllers and actuators. The facilities presented
in section 3.2 when the Visualization Interface was presented
are also available here. In the installation plan viewer, the
installation plan is presented with the current values/states of
the network elements and their associated icons.
can be used in two modes: for creating a layout in tabular
form or for creating a layout based on icons and labels.
When being used for generating a tabular layout, the user has
the possibility to define the number of rows and columns and
to select in each cell a network element and an associated
property. The visualization properties available for a sensor
node are the current value, whereas for a controller or
actuator node, the current state. For a controller node, the
reference and hysteresis values are also available as
properties for selection. When control is desired for certain
properties such as the state property, or the reference and
hysteresis value, a button can be added in the corresponding
cell.
When the editor is used for generating a layout based on
icons and labels, the user has the possibility to select a
background image, to drag icons on the scene from an icon
gallery, to add labels and to drag images from an image
gallery. A preview of the icons and images available for
usage are displayed in the interface. The user has the
possibility to import other icons and images to be available
for later use.
The generated layout file can then be translated into web
pages through a XSLT (XML Stylesheet Language
Transformation) processor using a predefined XSL template.
For this purpose, the Qt’s XSLT processor is used.
XSL patterns were written for the transformation of the SMIL
layout into a HTML page. The mapping is done based on the
following rules: each SMIL region tag is mapped into a
HTML div tag along with its attributes (id, top, left, width,
height, zindex); for each SMIL region tag, the objects
referring to it in the SMIL body are searched and mapped to
HTML as children of the HTML div tag (img tags from
SMIL are mapped into img tags in HTML, the labels which
will display the property of an element are mapped to a
dynamic HTML object along with the user defined properties
in order to be interpreted by the web server’s CGI). An
example of mapping a label displaying the value of an
element named H-SOL element and its corresponding region
from SMIL format into a dynamic html object is presented in
what follows:
<smil xmlns="http://www.w3.org/2005/SMIL21/Language">
<head> <layout> <region id="layout" top="0px" left="0px" width="1280px"
height="600px" z-index="0"> …
<region id="region1" top="80%" left="0%" width="30%" height="9%"
z-index="6"/> …
</region> </layout> </head>
<body> <seq> <par region="layout"> …
<brush title="networkElementLocation"
color="#ff0000">
id="object1"
region="region1"
<param name="alias.property" value="S-HSOL.Value"/>
</brush> … </par> </seq> </body> </smil>
3.4 Basic layout editor
t <html> <body>
Another PC application was developed in order to allow
automatic generation of the web pages. It consists of a basic
layout editor which, based on a network description file,
allows the user to define the layout of the page. The editor
t <div id="layout" style="height:600px;width:1280px;left:0px;top:0px; zindex:0; border: 1pt solid black;"> …
t <div id="region1" class="neregion"
left:0%;top:80%;z-index:6;">
style="height:9%;width:30%;
c S-HSOL.Value <p> S-HSOL %s </p> </div> …
135
IFAC ICPS'13
May 22-24, 2013. Cluj-Napoca, Romania
t </div> </body> </html>
.
The application also generates the configuration files needed
by the embedded application.
4. EXPERIMENTS AND RESULTS
The interface for downloading the data logged on the
embedded web server is presented in Fig. 5. Fig. 6 and 7
present the visualization interface where the values acquired
in one day for three sensor elements measuring illumination,
temperature and wind are graphically represented. Fig. 8
presents the basic layout editor interface where a table with
three rows and one column is inserted and the desired
network elements and properties are selected for each cell.
Fig. 8. Basic Layout Editor Interface (tabular form)
5. CONCLUSIONS AND FURTHER DEVELOPMENTS
Digia Qt team is currently working on including full Qt
support on Android and, in the near future, when this will be
available, some of the PC applications will be ported on
Android.
Although basic alarm conditions are handled by the
embedded application, an alarm editor and handler will be
also developed and included in the PC applications.
REFERENCES
Fig. 5. Remote Transfer Interface
Fig. 6. Visualization Interface
Lim, S., Heo, Y., and Rizos, C. (2008). A web-based realtime monitoring system for gnss data quality and
integrity. In FIG Working Week - Integrating
Generations. Stockholm, Sweden.
Norman, K. (2007). Integrating Web Servers in Embedded
Applications. Luminary Micro. White Paper.
Rosado-Munoz, A., Mjahad, A., Munoz-Mari, J., and TerolTortosa, G. (2012). Web monitoring system and gateway
for serial communication PLC. In Proceedings of the 1st
IFAC Conference on Embedded Systems, Computational
Intelligence and Telematics in Control - CESCIT 2012,
296-301. Wurzburg, Germany.
Scofield, J.H., Cohen, P.S., Tronson, C., and Gould, S.
(2004). Real-time, web based energy monitoring system
for a solar academic building. In Proceedings of Solar
2004 Conference.
Warnier, E., Yliniemi, L., and Joensuu, P. (2003). Web based
monitoring and control of industrial processes.
University of Oulu, Control Engineering Laboratory.
Report A No 22.
SMA America, LLC (2011). Sunny WebBox and Sunny
WebBox with Bluetooth Wireless Technology in SUNNY
PORTAL. User Manual.
URL http://www.smaamerica.com/.
SMA America, LLC (2011). Device for Plant Monitoring
SUNNY WEBBOX. User Manual. URL http://www.smaamerica.com/.
Fig. 7. Visualization Interface
136