1
Operating Instructions
STIP-scan
Analyzer
10008710ED
BA 420C/24/ae/01.07
Panel-PC with STIP-scan
1
Introduction
TABLE OF CONTENT
1-1
1.1
Structure of this manual
1-1
1.2
1.2.1
1.2.2
1.2.3
1.2.4
Design of the STIP-scan analyzer system
Probe
Controller
Connection cable
Function and procedure
1-1
1-2
1-4
1-7
1-8
1.2.4.1
1.2.4.2
1.2.4.3
1.2.5
Measuring Cycle
Measurement process
Calibration
Technical data
1.2.5.1
1.2.5.2
2
STIP-scan types and parameters
Specification of panel-PC
1-8
1-9
1-12
1-13
1-14
1-15
Safety Regulations
2-1
2.1
General Instructions
2-1
2.2
Safety Instructions
2-2
2.3
Safety Equipment
2-2
2.4
Informal safety measures
2-3
2.5
Personnel training
2-3
2.6
Device control
2-3
2.7
Hazards from electric power
2-3
2.8
Particularly dangerous parts
2-3
2.9
Maintenance service and trouble-shooting
2-3
2.10
Changes to device
2-3
2.11
Cleaning the analyzer
2-4
2.12
Disposal of the analyzer
2-4
2.13
Device noise
2-4
2.14
Copyright
2-4
Endress+Hauser
page I
TABLE OF CONTENT
3
Panel-PC with STIP-scan
Commissioning
3-1
3.1
3.1.1
3.1.2
Transport and Storage
Delivery scope and damage in transit
Storage
3-1
3-1
3-1
3.2
3.2.1
3.2.2
3.2.3
3.2.4
Installation
Securing to Stand
Overview
Assembly and installation of the stand and housing
Cable connections
3-1
3-1
3-1
3-2
3-5
3.2.4.1
3.2.4.2
3.3
3.3.1
3.3.2
3.3.2.1
3.3.2.2
3.3.2.3
3.3.3
3.3.3.1
3.3.3.2
3.3.3.3
3.3.3.4
3.3.4
3.3.4.1
3.3.4.2
3.3.4.3
3.3.4.4
3.3.4.5
3.3.4.6
3.3.4.7
3.3.4.8
3.3.5
3.3.5.1
3.3.5.2
3.3.5.3
3.3.5.4
3.3.5.5
3.3.5.6
3.3.5.7
3.3.5.8
3.3.5.9
page II
Control cable connections
Power supply connections
Start-up
Starting the panel-PC and the STIP-scan software
MEASUREMENT menu
START MEASUREMENT submenu
PARAMETERS submenu
MONITORING SITE submenu
TRACES menu
CURRENT TRACE submenu
SINGLE MEASUREMENT (SPECTRUM) submenu
SHOW TRACES submenu
SLUDGE SETTLING CURVE submenu
CALIBRATION menu
Preparing the calibration of NO3-N, CSB, TOC, SV, and TS
TARGET/ACTUAL ADJUSTMENT submenu
ENTER MEASURING FUNCTION submenu
WWTP TYPE submenu
KHP-VALIDATION submenu
NO3-N-VALIDATION submenu
TAKE SAMPLE SPECTRUM submenu
CAL.CONSTANTS submenu
SETTINGS menu
MEASUREMENT PLACE submenu
INLET/OUTLET submenu
AERATION TANK submenu
SMOOTHING submenu
ANALOG OUTPUTS submenu
RELAY CONTACTS submenu
PASSWORD submenu
INTERFACE submenu
ADDITIONAL OUTPUTS submenu
• Optionale Fieldbus connection
• Optional storage of sludge data
• Processing of the sludge data by Microsoft Excel
• Display of the progess bar in main menu
• Storage of the actual spectrum
• Storage of the daily data
3-5
3-5
3-6
3-7
3-9
3-9
3-10
3-11
3-11
3-12
3-14
3-15
3-17
3-18
3-18
3-19
3-21
3-22
3-22
3-23
3-24
3-25
3-26
3-26
3-27
3-28
3-29
3-30
3-31
3-32
3-33
3-34
3-34
3-38
3-38
3-38
3-39
3-39
Endress+Hauser
Panel-PC with STIP-scan
3.3.6
TEST menu
3.3.6.1
3.3.6.2
3.3.6.3
3.3.6.4
3.3.7
4
TABLE OF CONTENT
SPECTROMETER submenu
STEPPER submenu
AIR PRESSURE submenu
TEST PROBE submenu
3-40
3-40
3-41
3-42
3-43
LANGUAGE menu
3-44
Decommissioning
4-1
4.1
Stopping the measurement
4-1
4.2
Cleaning the STIP-scan probe
4-1
4.3
Cleaning the quartz tube
4-2
4.4
Quitting the STIP-scan software
4-2
4.5
Switch-off the panel-PC and disconnection from power supply
4-2
4.6
Disconnection of connection cable
4-2
Maintenance and servicing
5-1
5
5.1
Maintenance plan
5-1
5.2
Periodical performance tests by the user
5-2
5.3
Periodical probe maintenance by Endress+Hauser Conducta GmbH&Co.KG
Division STIP
5-2
6
Troubleshooting
6-1
6.1
Overview
6-1
6.2
Definition and handling
6-1
6.3
6.3.1
6.3.2
Possible warning and error messages
Possible warning messages
Possible error messages
6-2
6-2
6-3
EC-Conformity Declaration
Endress+Hauser
page III
TABLE OF CONTENT
Panel-PC with STIP-scan
(This page intentionally left blank.)
page IV
Endress+Hauser
Panel-PC with STIP-scan
INTRODUCTION
1 Introduction
1.1 Structure of this manual
This manual contains information about the installation, programming, and operation of the STIPscan analyzer system. The manual consists of six chapters:
Chapter 1:
Chapter 2:
Chapter 3:
Chapter 4:
Chapter 5:
Chapter 6:
Introduction, design, and applications of the STIP-scan analyzer system
Safety regulations and an explanation of the safety symbols
Setting up and commissioning
Decommissioning
Maintenance and Servicing
Troubleshooting
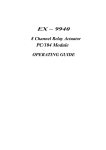
1.2 Design of the STIP-scan analyzer system
The STIP-scan analyzer system consists of a
probe, a connection cable, and a controller. It can
be mounted on a stand or by a wall bracket.
The probe is placed into wastewater and spectroscopic measurements are taken. The data is transferred to the controller and displayed on the
screen.
Data is stored in the controller and can be output
via analog signal.
The probe can be manually controlled and monitored, using the keyboard and display.
Fig. 1.2-1: STIP-scan probe and panelPC in weather protection housing
Endress+Hauser
page 1-1
INTRODUCTION
Panel-PC with STIP-scan
1.2.1 Probe
clamp
carrying pipe
The STIP-scan probe components are enclosed in a stainless steel casing.
probe casing
Fig. 1.2.1-2: Protective flange
Fig. 1.2.1-1: Exterior view of probe
When the stainless steel lower casing is removed, the interior components of the probe are visible:
clamp for circuit
board
spectrometer
motor
guide tube with
settling/measuring
cell
fiber optics cable
power supply
trigger socket
optical base (see
fig. 1.2.1-4)
sample inlet
Fig. 1.2.1-3: Internal design of STIP-scan probe
page 1-2
Endress+Hauser
Panel-PC with STIP-scan
INTRODUCTION
spectrometer
fiber optics cable (shortened for
picture)
guide tube
piston with sealing ring
Xenon lamp
mirror
quartz tube
(settling and measuring cell)
sample inlet
Fig. 1.2.1-4: Detailed view of the optical base and guide tube
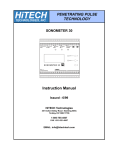
The following table describes the components of the STIP-scan probe:
Tab. 1.2.1-1: Components of the STIP-scan probe
component
circuit board
function
Distributes energy, stores and transmits data, controls all internal probe operations from sample taking to presentation of measured results.
power supply
Supplies energy for the probe.
trigger socket
Controls the Xenon flash lamp.
spectrometer
Separates the transmitted light into discrete wavelengths and generates a signal
proportional to the intensity for each wavelength.
fiber optics cable
motor
guide tube with
piston
quartz tube
Carries the transmitted light to the spectrometer.
Drives the piston that draws the sample.
Fills and empties the measuring cell. The sealing ring on the piston mechanically
cleans the inside surface of the quartz tube.
Settling and measuring cell. Sludge settling and light absorbance take place
inside the quartz tube.
optical base
Holds all optical parts - Xenon lamp, lenses, quartz tube, mirror.
Xenon lamp
Pulses light with wavelengths from 190 nm to 720 nm.
sample inlet
Point of entry to the measuring cell.
Endress+Hauser
page 1-3
INTRODUCTION
Panel-PC with STIP-scan
1.2.2 Controller
The controller serves to regulate and control all
connected STIP-scan probes. In addition to the
controlling and parameter measurement, the controller
handles the operational control of all programming and
test routines. Multitasking capability allows simultaneous handling of special and routine operations (e.g.
view the stored data without interrupting the ongoing
analysis). The measured data are shown, as well as
values over the last 24 hours (or 3 hours), on the
panel-PC display in graphical form.
By touch screen input the analyzer can be adjusted to
the conditions of the monitoring place and all probes
can be controlled.
Fig. 1.2.2-1: Panel-PC with peripheral
units in weather protection housing
The controller of the STIP-scan is a panel-PC with additional peripheral units for the control and
operation of the STIP-scan probes and for data transfer to external control computers. The addition units are, e.g. the power supply of the probe, controller, and modules, as well as the RS232/
RS485 converter module. The panel-PC and the peripheral units are placed in a stainless steel
weather protection housing that protects the controller against wind, rain, cold and heat.
Peripheral units
Standard equipment of the weather protection housing includes the panel-PC, power supplies of
the panel-PC and probe(s), a mains filter, and an RS232/RS485 converter module (one module
per probe).
The standard equipment can be extended by:
• 1 and/or 2 analog output modules for data transfer by two and/or four analog outputs (per
probe)
• 1 digital output module for data transfer by max. seven relay contacts (per probe)
• 1 Fieldbus module.
1
2
3
4
5
6
7
8
optional modules of
probe #1 (not shown)
optional modules of
probe #2 (double-probe
system, not shown)
mains filter
RS232/RS485converter module of
probe #1
RS232/RS485converter module of
probe #2 (double-probe
system, not shown)
power supply of
probe #2 (double-probe
system, not shown)
power supply of
probe #1
power supply of panelPCs and of all modules
1
2
3
4
5
6
7
8
Fig. 1.2.2-2: Peripheral units (on assembly plate) of panel-PC
page 1-4
Endress+Hauser
Panel-PC with STIP-scan
INTRODUCTION
status LED
function keys F1,
F2, F3 or bright
(+) / dark (-) in
service mode
change to service
mode
keyboard software for
entering text and data
link to STIP-scan
program
Fig. 1.2.2-3: Panel-PC front view
The functions of the panel-PC keys are described in the following table:
Tab. 1.2.2-1: Explanations of the front panel, keys, and LEDs of the panel-PC
Power-LED
The power LED is green if the power is on.
If the LED is flashing, you are in the service mode where the backlight brightness
can be set.
Fail-LED
The fail-LED is red if there is an error in the DC/DC-changer.
If the red LED is flashing, then there is no display signal.
F1
In standard mode, this function key sends the key code for “F1“.
F2 / +
In standard mode, the function key sends the key code for “F2“.
In service mode, this function key increases the display brightness.
F3 / -
In standard mode, the function key sends the key code for “F3“.
In service mode, this function key decreases the display brightness.
To get into the service mode you must push the
button until the green powerLED is flashing. While the LED is flashing, you can set the display brightness. To
exit the service mode, push the
button again or wait 30 sec.
The Windows 2000 operating system, the software for controlling the STIP-scan and a keyboardsoftware for entering text and data are factory-installed. Drivers for peripherals (analog outputs,
relay contacts, etc.) are also installed on the hard drive. No other software is required for operating
the STIP-scan.
Use the touch screen of the panel-PC and the keyboard-software (see below) for working with the
STIP-scan program (see fig. 1.2.2-4 on page1-6).
Endress+Hauser
page 1-5
INTRODUCTION
Panel-PC with STIP-scan
screen keyboard
software for
entering text and
data
Fig. 1.2.2-4: Screen keyboard (displayed as a symbol)
The buttons “Max“ and “Move“ show the keyboard software as a symbol. Use the button “Move“
for moving the screen. Push the “Max“ button to activate/open the keyboard software:
Fig. 1.2.2-5: Keyboard-software
Text and data can be entered into the STIP-scan program by pushing the corresponding buttons
of the keyboard.
NOTE
Move the keyboard by pushing the button”Move“, reduce the keyboard by pushing the button “Min“ and
close the keyboard-software with the “Close“ button.
NOTE
An external mouse or keyboard can be connected to the panel-PC. The connections of the panel-PC are
shown in chapter 1.2.5, “Technical data” , fig. 1.2.5.2-2 on page1-15.
During measurement, the screen shows the current measured values as well as values over the
last 24 hours (or 3 hours) in graphical form. The screen also displays any faults, which are
recorded in memory. Any infringements of the set limits are signalled by the respective floating
signal outputs and in the display.
To start the STIP-scan software, proceed as described in chapter 3.3.1, “Starting the panel-PC
and the STIP-scan software” (page 3-7).
page 1-6
Endress+Hauser
Panel-PC with STIP-scan
INTRODUCTION
1.2.3 Connection cable
main control cable
moveable collars
The connection cable consists of a supporting pipe and a
main control cable. The main control cable consists of a
power supply cable and a data transfer cable.
supporting pipe
Main control cable
The main control cable transfers power and data between
the probe and the controller. It is connected via a ten-pin
cable plug inside the supporting pipe. The other end of
the main control cable is connected via a seven-pin cable
plug to the controller.
clamp
carrying pipe
Supporting pipe
probe body
The carrying pipe is anchored to the supporting pipe by a
clamp. With the aid of the supporting pipe, the probe is
attached to the stand and raised and lowered into the
wastewater.
Fig. 1.2.3-1: Probe connected
with connection cable
Endress+Hauser
page 1-7
INTRODUCTION
Panel-PC with STIP-scan
1.2.4 Function and procedure
1.2.4.1 Measuring Cycle
Each measuring cycle consists of the following steps:
Step 1: Sampling
The wastewater sample is drawn into the settling/measuring cell by a piston that is driven up
and down inside the quartz tube.
Step 2: Settling and measurement of sludge parameters
The suspended material starts to settle. The dynamics of the settling process are monitored by
the spectrophotometer by measuring the absorbance of visible light from the Xenon lamp as
settling proceeds.
Step 3: Determination of the concentration of nitrate-nitrogen, SAC, and organic load
a) Sludge parameters
The determination of sludge parameters is based on the observation of the sludge settling. The
first step includes the calculation of the content of total solids. In the second step the analyzer
monitors the settling curve of the sludge and calculates the sludge volume. As a result of both
the TS and SV, the sludge index (SI) is calculated.
NOTE: In some measuring sites, there will be no sludge parameter, due to no sludge being
present, or no sludge settling.
b) Nitrate-N and organic load
Since particulate matter in the waste water sample may reduce the accuracy of the measurement by light scattering, nitrate-N and load parameters are determined after the settling process in the clear water zone. Both the nitrate concentration (NO3-N) and the spectral
absorbance coefficient (SAC) are measured directly by monitoring the absorbance of discrete
UV wavelengths. The chemical oxygen demand (COD) and the total organic carbon (TOC) are
calculated by correlation analysis.
Step 4: Termination
After measurement has been completed, the piston expels the sample from the quartz tube,
and the analyzer is ready to start a new cycle. The entire process takes between one and ten
minutes, depending upon the settling behavior of the sludge.
page 1-8
Endress+Hauser
Panel-PC with STIP-scan
INTRODUCTION
1.2.4.2 Measurement process
Basics of spectrophotometric measurement
Spectrophotometry makes use of the phenomenon whereby light radiated through a solution is
reduced in intensity (transmitted-light measurement). The theory of light absorbance is described
by the Bouguer-Lambert-Beer's Law. The absorbance is substance-specific and depends on the
concentration of the absorbing material as well as on the specific wavelength of the light used. In
addition, absorbance is fundamentally different at different wavelengths, so that every substance
that absorbs has a more or less characteristic absorbance spectrum.
Common photometry relies upon the measurement of absorbance at a single wavelength. Spectrophotometry uses absorbance measurements over the whole absorbance spectrum. It provides
much more spectral information than the common photometric approach.
For spectrophotometric analysis, the phenomenon of the light absorbance is theoretically formulated by the Bouguer-Lambert-Beer's law. According to this law, the molar concentration c of a
substance that absorbs light at a wavelength λ is directly proportional to the absorbance A:
Aλ = k × c
The proportional constant k is the product of the spectral molar absorbance coefficient ε λ (unit:
l * mol-1 * cm-1) of the substance for the wavelength λ and the length of path d of the measuring
cell:
k = ελ x d
Aλ =
Thus:
ελ × c x d
In spectrophotometry, the function A λ corresponds to the absorbance spectrum of the absorbing
substance. For liquid containing several light absorbing substances, each compound provides a
single absorbance spectrum. In this case, A λ is the absorbance trace of the analyzed liquid being
the sum of the single overlapping absorbance spectra. Usually, the measured value is expressed
as the spectral absorbance coefficient having the unit 1/cm:
measured value
Aλ
------ =
d
ελ × c
The advantage of this is that the spectral absorbance coefficient is typical for the absorbing
medium without the concentration and the molar absorbance coefficients of the absorbing
substances being known. As an example, the specific absorbance at 254 nm is equal to the wellestablished sum parameter SAC254.
Endress+Hauser
page 1-9
INTRODUCTION
Panel-PC with STIP-scan
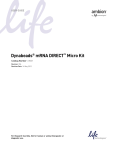
Measuring principle of the STIP-scan
The concentration of the parameters nitrate, SAC254 (spectral absorbance coefficient), COD,
TOC, TS, SV, SI, and ATU (attenuation turbidity units), is based on the spectrophotometric absorbance measurement (transmitted-light measurement) in a wavelength range between 190 nm and
720 nm. The light source is a Xenon flash lamp with an emission spectrum from the UV range,
through the visible, to the infrared range. The light that passes through the wastewater sample is
attenuated in a distinct manner. Finally, the transmitted portion of the light is focused on a mirror
and directed via fiber-optic cable to the entrance slit of a miniaturized photodiode array spectrometer. The spectrometer measures the spectral distribution of the light intensity. The intensities of
selected wavelengths are used to calculate the concentration of the absorbing substances.
spectrometer
fiber optics cable (shortened
for picture)
Xenon lamp
mirror
quartz cell
light path
(settling and measuring cell)
Fig. 1.2.4.2-1: Optical design of the STIP-scan probe
page 1-10
Endress+Hauser
Panel-PC with STIP-scan
INTRODUCTION
Determination of sludge parameters
As soon as the wastewater sample is drawn into the quartz cell, particles and sludge flocs start
to settle. This process is followed by measuring the absorbance of transmitted visible light. The
initial “constant” level is used to derive the total suspended solid (TS) of the sludge.
The shape of the settling curve is used to derive sludge volume (SV). Sludge index (SI) is calculated from SV and TS.
Fig. 1.2.4.2-2: Sludge settling curve
Determination of nitrate
Nitrate determination is based upon the absorbance spectrum between 200 and 230 nm. Mathematical algorithms are used to cancel out absorbance from dissolved organic material that
would otherwise interfere with the nitrate measurement (see fig. 1.2.4.2-2, page 1-11).
Determination of SAC254
SAC254 is a parameter originally developed for drinking water which depends upon the absorbance of dissolved organic compounds. When used with wastewater, it can give an indication
of TOC and COD. As an indicator of organic load, it is limited because it measures absorbance
at just one wavelength.
Determination of COD
The absorbance of the wastewater sample is measured over the range of 200-400 nm. A mathematical algorithm is used to cancel out the absorbance due to nitrates which would otherwise
interfere with the COD measurement.
Determination of TOC
The absorbance of the wastewater sample is measured over the range of 200-400 nm. A mathematical algorithm is used to cancel out the absorbance due to nitrates which would otherwise
interfere with the TOC measurement.
Endress+Hauser
page 1-11
INTRODUCTION
Panel-PC with STIP-scan
Determination of the turbidity (ATU)
The turbidity is determined by detecting the scattered light as a reduction of the transmitted light
at a defined wavelength. The expression of the turbidity value is in ATU (attenuation turbidity
units).
User-Specific Conditions
The “plus” module allows the customer to monitor absorbance changes across the whole spectrum. Installed at the inlet to a plant, STIP-scan will help identify changes occurring in the water
matrix and permit alterations to be made to the treatment process. STIP-scans installed at key
positions throughout the process will aid with optimizing treatment.
Interferences with spectrophotometric measurement
Common interferences in the spectrophotometrical measurement are due to the loss of light intensity of the Xenon lamp, deposits on the inner surface of the quartz cell, and discolorations of the
optical windows. During the filling and emptying of the sample chamber, deposits on the inner
surface of the quartz cell are removed mechanically by the up and down movement of the piston
equipped with special sealing rings.
1.2.4.3 Calibration
The aim of calibration is to create a valid correlation between the actual measured quantity (absorbance of the waste water sample) and the analytical target quantity (concentration of the chosen
parameter) for a given instrumental setup. Basically, the conversion factor is determined by
performing measurements with several standard solutions having known concentrations of the
analytical target quantity. According to the Bouguer-Lambert-Beer's Law (see “Basics of spectrophotometric measurement” on page 3-9) the conversion factor is then used in the operation mode
to calculate the concentration from the measured signal.
The STIP-scan system can be adjusted to the special conditions of a waste water treatment plant.
For this, a two-point calibration is to be made. The user enters a defined number of measuring
data into the STIP-scan software, and the system calculates an optimized linear algorithm for the
quantification of the required parameter.
For special applications a non-linear algorithm may be recommended. In this case, STIP Isco uses
the customer specific data to develop a polynomial algorithm. The customer will be provided with
the non linear mathematical approach that is adjusted individually to the user-oriented requirements of the waste water treatment plant.
NOTE
More information how to calibrate the system is in chapter 3.3.4 on page 3-18.
page 1-12
Endress+Hauser
Panel-PC with STIP-scan
INTRODUCTION
1.2.5 Technical data
Dimensions and weight
dimensions
probe
height:
diameter:
300 mm
120 mm
weight (gross)
(11.81 in.)
(30.48 in.)
7.5 kg
(16.5 lbs)
width x height x depth
protective housing
and panel PC
520 x 260 x 520 mm
390 x 300 x 100.5 mm
(20.5 x 10.2 x 20.5 in.)
(15.4 x 11.8 x 4.0 in.)
25 kg (55.2 lbs)
4.8 kg (10.6 lbs)
(The dimensions are without peripheral units, i.e. modules.)
Data storage and output
hard disk
storage of all measured data, sludge- and calibration data as well as
status and error protocols
optional signal outputs
one OR two analog interfaces (per probe) with two analog outputs
each, 0/4 mA - 20 mA, galvanized separation, max. load 1050 ohms,
power supply 10 - 30 V DC
optional relay outputs
upto seven voltage free contacts (max. 0.5 A at 120 V AC or 1 A at
24 V DC), normally open
(just in combination with one analog output module; max. one relay
output module per probe)
optional Fieldbus connection
transmission of all measuring and status data by Profibus DP-V1 or
DP-V0
Electrical connections
mains power, controller
power supply, probe
power consumption, probe
enclosure, probe
enclosure, weather protection
housing
protection class
EMC
contains resistance interferences in
accordance with:
transmission interference
certification
electrical safety
Endress+Hauser
230 V or 115 V, 50 cps (50 Hz) or 60 cps (60 Hz)
24 V DC (via connection cable)
approx. 2.2 W / 90 mA
approx. 4.3 W / 180 mA
approx. 9.2 W / 380 mA
in idle mode
operation of flash lamp
at operating the motor
IP67
IP65 (panel-PC, front, closed)
IP55 (panel-PC, front, opened)
1
EN 61326
EN 61000-4-2
EN 61000-4-3
EN 61000-4-6
EN 61000-4-8
EN 61000-4-4
EN 61000-4-5
EN 61000-4-11
(electrostatic discharge)
(radiated radio-frequency field on housing)
(radiated radio-frequency field on cables)
(power frequency magnetic field)
(electrical fast transient/burst)
(surge)
(voltage dips, short interruptions, and voltage variation)
EN 55011 class B (interference field, interference voltage)
CE-mark (declaration of conformity)
EN 60335-1 (VDE 0700)
page 1-13
INTRODUCTION
Panel-PC with STIP-scan
1.2.5.1 STIP-scan types and parameters
STIP-scan types
The STIP-scan analyzer measures nitrate (NO3-N), carbon parameters (SAC, COD, TOC), and
sludge parameters (sludge volume SV, total solids TS, sludge index SI), and turbidity (ATU). The
following STIP-scan modules are available:
model
nitrate
carbon parameters
sludge parameters
additional
spectrum
SV, TS, SI
no
STIP-scan N
yes
no
STIP-scan C
no
SAC, COD or TOC
SV, TS, SI
no
STIP-scan NC
yes
SAC, COD or TOC
SV, TS, SI
no
STIP-scan NC plus
yes
SAC, COD or TOC
SV, TS, SI
yes
Parameter specifications
Tab. 1.2.5.1-1: Parameter specifications
nitrate
CODa)
TOCa)
SAC
turbidity
NO3-N
COD
TOC
SAC254
ATU
0.3 - 23 mg/l
10 - 2000 mg/l
4 - 800 mg/l
1 - 250 m-1
1 - 250 m-1
detection limit
0.1 mg/l
2 mg/l
1 mg/l
0.1 m-1
0.1 m-1
reproducibility
3%
3%
3%
3%
3%
measured as
measurement range
a) based on KHP
Tab. 1.2.5.1-2: Specification of sludge data
total solids
measured as
measurement range
sludge volume
sludge index
TS
SV
SI
0.5 - 5.0 g/l
turbidity as ATU
100 - 900 ml/la)
250 ml/g
a) in diluted sample
page 1-14
Endress+Hauser
Panel-PC with STIP-scan
INTRODUCTION
1.2.5.2 Specification of panel-PC
To protect the equipment from adverse weather conditions, the panel-PC and additional peripheral modules are in a weather protection housing.
The panel-PC is located on a assembly plate that can be turned to the right:
Fig. 1.2.5.2-1: Assembly plate of panel-PC turned to right
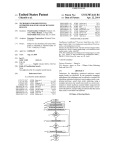
The panel-PC has the following connectors on the rear panel:
11
1
2
3
4
8
7
5
6
99
10
Fig. 1.2.5.2-2: Connectors of the panel-PC
Tab. 1.2.5.2-1: Assignment of panel-PC connectors
pos.
description
pos.
description
1
24 V PE GND, 24 V DC input voltage
7
COM 2 (probe 2)
2
fuse T 5,0 AH
8
LAN
3
earth
9
USB1
4
PS/2-mouse
10
USB0
5
PS/2-keyboard
11
optional Fieldbus card (not shown)
6
COM 1 (probe 1)
Endress+Hauser
page 1-15
INTRODUCTION
Panel-PC with STIP-scan
A second assembly plate is located inside the stainless steel protection housing. All peripheral
modules are located on this assembly plate:
7
1
2
3
4
5
6
8
10
11
9
12
13
14
15
16
17
Fig. 1.2.5.2-3: Peripheral modules inside the protection housing, front view
Tab. 1.2.5.2-2: Legend to fig. 1.2.5.2-3
pos.
description
1
optional analog signal output module #1 of probe 1 (not shown)
2
optional analog signal output module #2 of probe 1 (not shown)
3
optional relay output modul of probe 1 (not shown)
4
optional analog signal output module #1 of probe 2 (not shown)
5
optional analog signal output module #2 of probe 2 (not shown)
6
optional relay output module of probe 2 (not shown)
7
mains switch connector (back of panel-PC)
8
mains filter
9
RS232/RS485 converter module of probe 1
10
RS232/RS485 converter module of probe 2 (not shown)
11
power supply of probe 1
12
power supply of probe 2 (here not shown)
13
power supply of panel-PC, modules of probe 1 and modules of probe 2
14
panel-PC (back side)
15
external power supply of controller
16
connection cable of probe 1
17
connection cable of probe 2 (not shown)
page 1-16
Endress+Hauser
Panel-PC with STIP-scan
INTRODUCTION
to assembly plate of perpheral modules
br
to assembly plate of panel-PC
PE
bl
rd
N
br
bl
L
gn
bl
br
L
gn
RS232 cable probe #1
rd
bl
gn
data +
data -
gn
bl
rd
ye
gn
gn
ye
RS232
Gnd
Vs
Data Data +
Init
rd
bl
RS232
bl
rd
ye
gn
RS232/RS485
converter module,
probe # 2
Gnd
Vs
Data Data +
Init
data +
data -
- +
gn
ye
R7com
R7no
R6com
R6no
RS232/RS485
converter module,
probe # 1
bl
bl
rd
ye
gn
N
gn
+Iout 1
-Iout 1
Gnd
Vs
Data Data +
Init
- +
+Iout 0
-Iout 0
analog module #2
probe #1
+Iout 1
-Iout 1
analog module #1
probe #1
+Iout 0
-Iout 0
relay module
probe #1
rd
+ + - - x
R1no
R1com
R2no
R2com
R3no
R3com
R4no
R4com
R5no
R5com
from housing bottom
P
E
P
E
N
power supply
24V 30W
probe #1
power supply
24V 30W
probe #2
gn
RS232 cable probe #2
L
power supply
24V 72W
panel-PC +
peripheral
modules
+ +
- -
bl
rd
bl
analog module #1
probe #2
gn
+ + - - x
+Iout 1
-Iout 1
gn
Gnd
Vs
Data Data +
Init
gn
br
bl
rd
ye
gn
gn bl
Gnd
Vs
Data Data +
Init
bl
br
br bl
gn
R7com
R7no
R6com
R6no
ye
+Iout 0
-Iout 0
from housing bottom
bl
rd
ye
gn
P
E
Gnd
Vs
Data Data +
Init
rd
+Iout 1
-Iout 1
analog module #2
probe #2
+Iout 0
-Iout 0
relay module
probe #22
bl
R1no
R1com
R2no
R2com
R3no
R3com
R4no
R4com
R5no
R5com
mains filter
Fig. 1.2.5.2-4: Wiring diagram of panel-PC (assembly plate with peripheral modules)
Endress+Hauser
page 1-17
INTRODUCTION
Panel-PC with STIP-scan
to assembly plate of peripheral m
to assembly plate of peripheral modules
br bl gn
+24 V
GND 24V
rd
bl
RS485 B
RS485 A
ye
+24 V
rd
b
PE
protection
ground
gn/ye
GND 24V
gn
shielding of
dtat transfer
bl
RS485 B
RS485 A
ye
protection
ground
gn/ye
gn
PE
connection cable
probe #2
b
power supply
shielding of
data transfer
connection cable
probe #1
Fig. 1.2.5.2-5: Wiring diagram of panel-PC (Connectors on the housing bottom, inside view)
mains switch
bl
br
bl
br
to assembly plate of
peripheral modules
panel-PC
rear view
F1
F2
Feldbus card
(optional)
F3
>
mouse
U
0V
keyb.
COM1
COM2
LAN
USB1
F
USB0
modem (optional)
rd
bl
br
to assembly plate of
peripheral modules
RS232 cable (probe #1)
RS232 cable (probe #2)
Fig. 1.2.5.2-6: Wiring diagram of panel-PC (assembly plate of panel-PC)
page 1-18
Endress+Hauser
Panel-PC with STIP-scan
INTRODUCTION
Panel-PC
Tab. 1.2.5.2-3: Minimum requirements to panel-PC
processor
display
operation/keyboard
main memory
Celeron 300 - 500 MHz
12" color TFT display, 800 x 600 pixel
touchscreen analog resistive;
4 front keys for application: 3 function keys (F1 to F3) and display
brightness; status-LED green (power) and red (fail)
at least 128 MB
hard disk
at least 6 GB
interface
2x USB, 2x COM, 1x LAN network 10/100MBit RJ45, PS2-mouse
and PS2-keyboard connectors, CF-slot, PC 104 slot internal
operating system
Windows 2000, driver for power interfaces, optional digital outputs,
etc.
external power supply
power supply 115V/230V switchable
internal power supply
24 V DC, at least 70 W
power consumption
miscellaneous
approx. 50 W / 24 V
screen keyboard (by software)
RS232/RS485 converter
baud rate
power consumption
voltage supply
galvanized separation
300 - 115200 bps
2.2 watts
10 - 30 V DC
upto 3000 V DC
RS232 connection
Sub-D 9 pins plug
RS485 connection
screw terminal
Fig. 1.2.5.2-7: RS232/
RS485 converter
Endress+Hauser
page 1-19
INTRODUCTION
Panel-PC with STIP-scan
Analog signal outputs (option)
output channel
output type
2, galvanized separation
mA
accuracy
± 0.1 %a)
resolution
± 0.02 %a)
zero drift of current output
current load resistance
insulation
power supply
power consumption
± 0.2 µA/°C
500 ohms
3000 V DC,
each of channel
+10 to +30 V DC
3.0 W
Fig. 1.2.5.2-8:
Analog signal output
module
a) with full reflection
Relay contacts (option)
output channels
7 (normally open)
power supply
+10 to +30 V DC
contact rating
0.5 A at 120 V AC or
1.0 A at 24 V DC
power consumption
min. life
1.5 W
105 operation
Fig. 1.2.5.2-9:
Relay output module
Fieldbus plug-in card (option)
type
protocoll
DP-V0 or DR-V1 (class 1/2)
I/O storage
368 Byte
connection
nine-pin D-SUB socket
interface
page 1-20
Profibus DP Slave
RS485, galvanically isolated
Endress+Hauser
Panel-PC with STIP-scan
SAFETY REGULATIONS
2 Safety Regulations
2.1 General Instructions
Observe the indications in the operating instructions
Conditions for the safe use and trouble-free operation of this instrument require knowledge of
basic safety regulations. These instructions provide information for the safe operation of this
instrument. The safety instructions are to be followed by every user. In addition, attention must be
paid to the local regulations on occupational safety and accident prevention.
User's obligations
The user is obligated to ensure that everyone who operates the instrument:
• is familiar with the regulations for occupational safety and accident prevention and has
been trained on the instrument;
• has read and understood the safety chapter and the warnings in this manual.
Hazards when using the instrument
The STIP-scan analyzer system is built with state-of-the-art technology and in accordance with
known safety rules. The instrument should only be used:
• in the way it was intended
• when the technical safety equipment is in working condition
Improper use can result in hazards to life and limb of the user or third parties. Damage to the
instrument or other property may occur. Safety hazards must be corrected immediately.
Proper use
The STIP-scan analyzer systemis intended to measure nitrate, SAC254, COD, TOC, TS, SV, SI,
and ATU in the field of wastewater treatment and water pollution control. Any other or additional
use is considered improper. STIP Isco is not liable for any damage resulting from improper use.
Proper use also requires:
• the operator to follow all instructions contained in the operating instructions
• observance of the required inspections and maintenance work
Warranty and liability
The “General Terms and Conditions“ of Endress+Hauser Conducta GmbH&Co.KG Division STIP
apply. These will be made available to the operator at the latest when the contract is concluded.
Warranty and liability claims for injuries to persons and property damage are excluded, if they are
the result of the following causes:
• improper use of the analyzer
• unauthorized assembly, installation, operation or maintenance
• operation of the STIP-scan with damaged and/or non-functioning safety and protective
equipment
• failure to observe the instructions on transport, storage, assembly, installation and maintenance
• unauthorized changes
• exceeding the prescribed depth of immersion
• insufficient monitoring of parts subject to wear
• improper repairs
• catastrophes caused by foreign bodies and acts of God.
Endress+Hauser
page 2-1
SAFETY REGULATIONS
Panel-PC with STIP-scan
2.2 Safety Instructions
Explanation of symbols and warnings
The following designations and symbols are used to indicate the hazards in the user manual:
DANGER
This symbol means an immediate threat of danger to life and health.
Failure to comply with these instructions may result in serious damage to health or life-threatening injuries.
WARNING
This symbol means a potential threat of danger to life and health.
Failure to comply with these instructions may result in serious damage to health or life-threatening injuries.
CAUTION
This symbol means a potentially dangerous situation.
Failure to comply with these instructions may result in minor injuries or property damage.
INFORMATION
This symbol gives important instructions on how to operate the instrument properly.
Failure to comply with these instructions may result in malfunctions of the instrument.
NOTE
Under this symbol you are given instructions, tips, and useful information.
2.3 Safety Equipment
All safety equipment must always be properly mounted and operable before installation and operation.
Safety equipment may only be removed:
• during maintenance and repair work and after disconnecting the power supply
• after securing the device against restarting
When component parts are supplied, the safety equipment must be mounted properly by the user.
DANGER
Bolted-on safety screens and barriers must not be removed when the equipment is running.
Passive protection devices:
• Protection cover IP67 (dust tight and water tight) for the probe.
• Protection cover IP65 or IP55 for the weather protection housing of the panel-PC (front,
closed or opened).
page 2-2
Endress+Hauser
Panel-PC with STIP-scan
SAFETY REGULATIONS
2.4 Informal safety measures
The manual should be permanently kept near the operating location of the device.
In addition to the manual, the applicable and the local regulations on accident prevention and environmental protection should be provided and observed.
2.5 Personnel training
Only trained personnel should work with the device.
The responsibilities of the personnel for assembly, commissioning, operation, setup, maintenance, and service must be clearly defined.
Trainees may only work with the device under the supervision of an experienced operator.
2.6 Device control
Only authorized trained staff should be allowed to adjust or change production values using the
device controls.
Changes must not be made to the software by the operator under any circumstances.
2.7 Hazards from electric power
Work on the power supply should only be carried out by a certified electrician. The electrical equipment of the device must be checked regularly. Loose connections must be tightened and defective
parts replaced immediately. Always switch off the main power switch when working on electrical
components.
2.8 Particularly dangerous parts
The STIP-scan analyzer system is designed and manufactured with the greatest possible care
and in accordance with state-of-the-art technology and science. Nevertheless, there are
remaining risks and dangerous parts which cannot be eliminated. Risks and dangerous parts are
described throughout this manual.
2.9 Maintenance service and trouble-shooting
Follow all regulations to prevent accidents.
2.10 Changes to device
No changes, additions, or modifications may be carried out on the device without the manufacturer's approval.
All conversion measures require written confirmation from Endress+Hauser Conducta
GmbH&Co.KG Division STIP.
Any device parts not in proper condition must be replaced immediately.
Use only replacement parts provided by Endress+Hauser Conducta GmbH&Co.KG Division
STIP.
If parts from other manufacturers are used, there is no guarantee that they are designed and
manufactured in conformance with the loading and safety specifications of the original equipment
parts; therefore, the warranty will be void.
Endress+Hauser
page 2-3
SAFETY REGULATIONS
Panel-PC with STIP-scan
2.11 Cleaning the analyzer
The required substances and materials must be used and disposed of properly.
2.12 Disposal of the analyzer
The analyzer contains electronical components. This components must be disposed as electronic
industry waste. Follow in paricular the local disposal regulations of your country.
2.13 Device noise
The continuous sound level emitted by the device is < 70 dB (A).
2.14 Copyright
The copyright for these operating instructions is held by Endress+Hauser Conducta
GmbH&Co.KG Division STIP.
These operating instructions are intended only for the operator and personnel.
They contain specifications and information which may not be reproduced, distributed, or passed
on to third parties in any other manner in full or in part.
Violations may be prosecuted by law.
page 2-4
Endress+Hauser
Panel-PC with STIP-scan
COMMISSIONING
3 Commissioning
3.1 Transport and Storage
3.1.1 Delivery scope and damage in transit
The completeness of the components supplied should be checked against the delivery documentation.
In addition, the equipment should be checked for possible transit damage and loose components.
3.1.2 Storage
When storing the equipment for an extended period, observe the following:
• the storage time should be as short as possible
• equipment should be stored in a dry area
• use suitable packaging (e.g. protective covers)
3.2 Installation
The STIP-scan analyzer system consists of a probe unit, connection cable, and a controller. The
converter and the controller are in weather protection housing that can be located independent of
the probe unit at the waste water treatment plant site. The probe can be mounted on a stand or a
wall bracket (optional).
The following chapters deal exclusively with stand mounting. Should you have any questions
about wall mounting, please contact Endress+Hauser Conducta GmbH&Co.KG Division STIP.
3.2.1 Securing to Stand
The stand must be secured on concrete using four screws with anchors. We recommend anchor
fittings (part-# 91407702). Endress+Hauser Conducta GmbH&Co.KG Division STIP cannot be
held responsible for incorrect set up.
For correct operation:
• The computer must be readily accessible.
• 230 V, 50 cps (50 Hz) (optional 115 V, 60 cps (60 Hz)) must be available.
• Ambient temperature must be between -10°C (-23°F) and +40°C (+5°F) for the panel-PC
(in weather protection housing, closed).
• The probe must be installed so that the inlet is a minimum of 10 cm (4 inches) below the
surface.
3.2.2 Overview
To set up the STIP-scan:
• Assemble and install the stand and protective housing (chapter 3.2.3, page 3-2)
• Connect the cables (chapter 3.2.4, page 3-5)
The setup follows the initial start-up of the analyzer according to chapter 3.3, page 3-6.
Endress+Hauser
page 3-1
COMMISSIONING
Panel-PC with STIP-scan
3.2.3 Assembly and installation of the stand and housing
Assembly and installation requirements:
• concrete drill bit Ø14 mm (0.55 in.)
• drill
• wrenches: 19 mm (0.75 in.), 2x 17 mm (0.67 in.), 2x 13 mm (0.51 in.)
• accessories for the stand
mounting stand welded
1x locking cap 50x50mm
1x holding tube for panel PC
2x locking cap PVC 25x25mm
1x hexagon head screw A2 M10x90
1x U-disc A2 10.5
1x self blocking nut
2x hexagon head screw M8x70
4x U-disc A2 8.4
2x stop nut
1x
1x
1x
1x
4x
welded supporting arm for 1 probe
locking cap PVC 25x25mm
probe holder
dolly
hollow screw A2 M6x40
front - and backside each:
3x clamps PG 13.5
3x cheese-head screw A2 M4x12
3x U-disc A2 4.3
1x cable bed tube 1.10m
Controller should be mounted
on the longer side of the
mounting bracket!
For the attachment of the stand:
4x dowel 14x75mm
4x U-disc A2 10.5
4x key screw galvanized 10x80mm
Fig. 3.2.3-1: Construction of stand
page 3-2
Endress+Hauser
Panel-PC with STIP-scan
COMMISSIONING
210 mm (8.27 in.)
max. 300 mm (11.81 in.)
210 mm (8.27 in.)
stand center
150 mm (5.91 in.)
basin edge
105 mm (4.13 in.)
150 mm (5.91 in.)
14 mm
(0.55 in.)
120 mm (4.72 in.)
Fig. 3.2.3-2: Base plate
• Set the stand (fig. 3.2.3-3) in position.
• Mark and drill the bore holes in accordance with fig. 3.2.3-2.
• Plug in the dowels and screw the stand on tightly. We recommend the composite anchor.
• For earthing connect the socket head screw (of the stand) with the grounding cable ( 4 mm2).
• Screw the supporting arms (fig. 3.2.3-4) to the stand (screws: M8x70). Set
up with the largest possible distance between the two supporting arms.
Fig. 3.2.3-4: Supporting arm
• Screw on each holder (fig. 3.2.3-5, pos. 1) and counterpart (pos. 2) to the
supporting arm.
Fig. 3.2.3-3:
Stand
2
1
Fig. 3.2.3-5: Holder and counterpart
• Assemble the holding pipes for the Panel PC concentric to the second bore
hole from top on the stand (fig. 3.2.3-3) (screws: M10x90).
• Screw the panel-PC to the outer bore holes of the holding bar (screws:
M10x40).
Endress+Hauser
page 3-3
COMMISSIONING
Panel-PC with STIP-scan
panel-PC
1850 mm (72.83 in.)
(B x H x T:
520 x 260 x 520 m m
20.5 x 10.2 x 20.5 in.)
connection cable
with supporting pipe
supporting arm
stand
STIP-scan
probe
min. inlet: 0.10 m (4 in.)
max. inlet: 5.00 m (16.4 ft.)
water level line
Fig. 3.2.3-6: STIP-scan at stand
page 3-4
Endress+Hauser
Panel-PC with STIP-scan
COMMISSIONING
3.2.4 Cable connections
DANGER
Switch on the main switch only after complete installation of all components!
There is a risk of electric shock.
3.2.4.1 Control cable connections
• Connect the seven-pin plug of
the control cable to the black
socket on the bottom of the
protective housing
(fig. 3.2.4.1-1) and tighten.
Use the left plug for the first
probe and the right plug for
the second probe.
• Place the probe on a level
surface with the aid of the carrying pipe.
• Open the clamp and remove
the cap of the carrying pipe.
plug
(probe 1)
plug
(probe 2)
power
supply
Fig. 3.2.4.1-1: Control cable connection to weather protection
housing of the panel-PC
• Lay the sealing ring on the
carrying pipe shaft so that the sealing ring edge is facing the probe.
• Place the carrying pipe on the supporting pipe, and put the ten-pin connection plug of the control cable into the socket on the carrying pipe.
• Secure it with the clamp.
• Place the probe with the supporting pipe in the maintenance position on the post.
CAUTION
Heavy object! A falling probe can cause injuries. Ensure, when placing the probe in and taking it out
of the measuring positions, that it is secure. Make sure that the mounting is correctly secured.
3.2.4.2 Power supply connections
• Connect the power supply cable to the power supply.
Endress+Hauser
page 3-5
COMMISSIONING
Panel-PC with STIP-scan
3.3 Start-up
The start-up consists of the following steps:
1. Starting the controller and the STIP-scan software: chapter 3.3.1, page 3-7
2. Controlling the internal probe pressure: chapter 3.3.6.3, page 3-42
3. Testing the spectrometer with distilled water: chapter 3.3.6.1, page 3-40
4. Entering the measuring parameters: chapter 3.3.2.3, page 3-11
5. Entering the monitoring site: chapter 3.3.2.3, page 3-11
6. Entering the name of the monitoring: chapter 3.3.5.1, page 3-26
7. Configuring analog outputs and relay contacts: chapter 3.3.5.5, page 3-30 und
chapter 3.3.5.6, page 3-31
8. Configuring the COM interfaces: chapter 3.3.5.8, page 3-33
9. Calibrating the analyzer system: chapter 3.3.4, page 3-18
10. Starting the measuring operation with the calibrated analyzer system: chapter 3.3.2.1,
page 3-9
The following chapter contains an explanation of all software functions in the order in which they
appear in the menu.
page 3-6
Endress+Hauser
Panel-PC with STIP-scan
COMMISSIONING
3.3.1 Starting the panel-PC and the STIP-scan software
main switch
• Switch on the main switch.
Fig. 3.3.1-1: Panel-PC in protection housing
The STIP-scan software and the keyboard software are in the autostart folder of the panel-PC.
Switching on the controller automatically starts the STIP-scan software and the keyboard software.
If not located in the autostart folder, the software is started as follows:
• Double click on the "STIP-scan.exe" file symbol located on the
desktop and quick-launch bar of the controller (see figure 3.3.1-2).
Fig. 3.3.1-2: Link of
STIP-scan software
• Double click on the keyboard symbol located on the desktop of the
panel PC (see figure 3.3.1-3).
Fig. 3.3.1-3: Link of
keyboard software
• If you have a double-analyzer system, there are two links for the STIP-scan software on
the desktop of the panel-PC, because each STIP-scan probe has its own software (with
its own subchapters). Start both STIP-scan software programms of the double-probe
system.
NOTE
If the error message “NO COM PORT AVAILABLE“ is displayed on the monitor, follow the instructions of
chapter 6.3, “Possible warning and error messages” on page 6-2.
Endress+Hauser
page 3-7
COMMISSIONING
Panel-PC with STIP-scan
After starting the software, the following menu appears on the controller monitor:
menu bar
probe test
screen
Fig. 3.3.1-4: Start of STIP-scan software
A system test is automatically carried out. More information about this test can be found in
chapter 3.3.6.4, “TEST PROBE submenu” on page 3-43.
The top of the screen contains the menu bar with the software functions.
The program can be terminated by clicking on the QUIT button shown at the bottom left of the
window.
NOTE
Before closing the STIP-scan software stop the measuring by menu STOP MEASURING.
• Close this screen by clicking on the ‘X’ on the right corner of the screen.
The following sections explain the items contained in the menu bar.
page 3-8
Endress+Hauser
Panel-PC with STIP-scan
COMMISSIONING
3.3.2 MEASUREMENT menu
Fig. 3.3.2-1: MEASUREMENT menu
3.3.2.1 START MEASUREMENT submenu
Select START MEASUREMENT from the MEASUREMENT menu. The STIP-scan starts with
measuring, and the message „PROBE IN NORMAL OPERATION“ is displayed on the main
screen.
In addition to the main screen the TRACE and MEASURED VALUES screens also appear:
Fig. 3.3.2.1-1: TRACE screen
Fig. 3.3.2.1-1:
MEASURED VALUES screen
The TRACE screen shows traces of the selected parameters. The MEASURED VALUES screen
displays current measured values.
Endress+Hauser
page 3-9
COMMISSIONING
Panel-PC with STIP-scan
For more detail regarding traces, see chapter 3.3.3, “TRACES menu” (page 3-11).
NOTE
After starting a program, "START MEASUREMENT" automatically changes to "STOP MEASUREMENT". Measuring can be terminated (without closing the program) if this menu item is selected.
NOTE
During the measuring operation, the entire TEST menu as well as the submenus KHP-VALIDATION,
NO3-VALIDATION and TAKE SAMPLE SPECTRUMS are deactivated. These menus can only be activated once the measuring operation has been interrupted.
3.3.2.2 PARAMETERS submenu
In this sub-menu, you specify the parameters you wish to measure.
Fig. 3.3.2.2-1: PARAMETERS menu
• Using the left click button, select the parameters you wish to measure.
NOTE
Not all parameters can be selected at all times. Parameters that cannot be selected will appear
lighter on the display than the others. Selectable parameters are dependent on the STIP-scan
module (see chapter 1.2.5.1, “STIP-scan types and parameters” on page 1-14).
• Save the settings by clicking SAVE.
• By clicking on the REJECT button, your settings are erased and the system returns to
the last saved settings.
page 3-10
Endress+Hauser
Panel-PC with STIP-scan
COMMISSIONING
3.3.2.3 MONITORING SITE submenu
Specify the monitoring site of your STIP-scan probe in this sub-menu.
Fig. 3.3.2.3-1: MONITORING SITE menu
• In this menu, select the monitoring site at which the STIP-scan analyzer is installed.
NOTE
The monitoring site information is used during the plausibility check and may therefore cause
incorrect results if the wrong information is provided.
• Save the settings by clicking on SAVE.
• By clicking on the REJECT button your settings are erased and the system returns to
the last saved settings.
3.3.3 TRACES menu
The TRACES menu displays the measurements in graphical form.
Fig. 3.3.3.3-1: TRACES menu
Endress+Hauser
page 3-11
COMMISSIONING
Panel-PC with STIP-scan
3.3.3.1 CURRENT TRACE submenu
This menu shows the current trace. When you click on the TRACE screen, the values of all activated parameters for a given time will be shown in a separate screen (see 6 ). Move the cursor
horizontally across the screen to view progressive changes over time.
1
2
3
4
5
6
Fig. 3.3.3.1-1: CURRENT TRACES screen
Explanation of the CURRENT TRACES screen
1 COD [mg/l]
The left corner of the menu bar shows the parameter whose y-axis scaling is currently
active. To change the scaling, click on the parameter in the corner. The scale screen will
appear. From this screen, you can select the parameter scaling to adjust in the left column, and set the scaling of the y-axis by entering the maximum values of the y-axis in
the right column:
maximum
values of the
y-axis
parameter
Fig. 3.3.3.1-2: SCALE screen
page 3-12
Endress+Hauser
Panel-PC with STIP-scan
COMMISSIONING
2 PROTOCOL
Selection of PROTOCOL displays the daily report:
activation
time
message
Fig. 3.3.3.1-3: PROTOCOL screen
The daily report contains the status signals of the probe, as well as warning and error
messages. The time of occurrence/activation ("ON") or of the error removal/deactivation
("OFF") is listed at the start of every line.
3 Date & time
The date and time are shown on the right side of the menu bar.
NOTE
If the (internal PC) time does not change, this indicates that the system has crashed!
4 NO3-N
COD
SAC
The top right corner of the graph shows the selected measuring parameters. Each parameter has a different color to match its corresponding trace.
5 Trace
The graph shows the parameter traces according to the y-axis scaling (see 1 ).
6 Measured values
Moving the cursor to the traces, the time and the corresponding measured values are
displayed on a separate screen.
Endress+Hauser
page 3-13
COMMISSIONING
Panel-PC with STIP-scan
3.3.3.2 SINGLE MEASUREMENT (SPECTRUM) submenu
This menu is only active if your system contains the "plus" add-on module. Depending on the
wavelength, the following spectra provide the information below:
Fig. 3.3.3.2-1: SPECTRUM screen
Description of the spectra:
• red line:
reference intensity with distilled water
• blue line:
intensity of current measurement
• green line:
measured absorbance spectrum
• black line:
measured nitrate nitrogen value (NO3-N).
The following settings can be changed in the SPECTRUM screen:
1. Where several measurements are taken successively and these are to be displayed in
a single diagram, the function OVERLAP CURVES must be activated in the bottom left
corner of the SPECTRUM screen. To select this function, click on the box in front of the
option. A check mark indicates activation.
2. The x-axis – i.e. the wavelength range – can be adapted to your requirements. For this
purpose, the function FROM 200 nm TO... is used. From the drop-down menu, select
the maximum wavelengths to be displayed (maximum value of x-axis). The trace is
automatically displayed according to your specifications.
page 3-14
Endress+Hauser
Panel-PC with STIP-scan
COMMISSIONING
3.3.3.3 SHOW TRACES submenu
The SHOW TRACES menu allows paging through historical data:
1
2
7
3
4
7
5
8
6
9
Fig. 3.3.3.3-1: SHOW TRACES screen
1 COD [mg/l]
As with the CURRENT TRACE screen, the left corner of the menu bar shows the parameter whose y-axis scaling is currently active.
Scaling is adjusted in the same manner (see figure 3.3.3.3-2).
maximum
value of the
x-axis
parameter
Fig. 3.3.3.3-2: SCALE screen
Endress+Hauser
page 3-15
COMMISSIONING
Panel-PC with STIP-scan
2 PROTOCOL
Similar again to the CURRENT TRACE screen, the menu bar of the SHOW TRACES
screen contains the function PROTOCOL for viewing daily reports.
In the SHOW TRACES screen, however, you can also view past reports (see date ( 6 ).
time
activation
deactivation
message
Fig. 3.3.3.3-3: PROTOCOL screen
• 3 Selected parameters, with trace-matched colors.
• 4 Traces of selected parameters.
• The arrow keys ( 5 ) can be used to page forward and backward in order to look at earlier data. Using the arrow keys also activates the time window (see 7 below).
• The date display ( 6 ) shows on which day the traces were recorded. To move one day
forward or backward, push on the arrows to the left and right of the date.
• To view the trace(s) in closer detail, the zoom function can be activated. Using the
mouse, move the time window to the desired time. After selecting the time window ( 7 ),
click on the “3 HOURS“ button ( 8 ). This activates the magnifying function and the
graph is displayed in 3-hour segments. To return to the 24-hour view, push on the "24
HOURS“ button in the 3-hour window.
• To save the measured data of a special day, page forward/backward with the aid to the
arrow keys until accessing the desired day. Then press the „SAVE“ button. The measured data of the desired day is stored as a csv-file named YYYYMMDD.csv (YYYY =
year, MM = month, DD = day) in the STIP-scan folder. More details on data saving is
described in section ”Daily data by menu SHOW TRACES” (page 3-39).
page 3-16
Endress+Hauser
Panel-PC with STIP-scan
COMMISSIONING
3.3.3.4 SLUDGE SETTLING CURVE submenu
This menu shows the sludge settling curve:
Fig. 3.3.3.4-1: SLUDGE SETTLING CURVE screen
The following settings can be changed in the SLUDGE SETTLING CURVE screen:
1. Where several measuring operations are carried out successively and the results are to
be displayed in the same diagram, the function OVERLAP CURVES (bottom left corner), must be activated in the SLUDGE SETTLING CURVE screen. To select this function, click on the box in front of the option. A check mark indicates activation.
2. When the function DISPLAY SLOPE is selected, the slope of the settling curve is
shown.
3. When the function DISPLAY SPECTRUM is selected, the absorbance spectrum in the
SLUDGE SETTLING CURVE is also displayed.
NOTE
The functions DISPLAY SLOPE and DISPLAY SPECTRUM are only displayed, if your software includes
the additional “plus“ module.
Endress+Hauser
page 3-17
COMMISSIONING
Panel-PC with STIP-scan
3.3.4 CALIBRATION menu
Fig. 3.3.4-1: CALIBRATION menu
NOTE
All CALIBRATION sub-menus can be protected by a user password (to activate the password, see
section ”PASSWORD submenu” on page 3-32). No further reference to the input of the user password is
made on the following pages.
With the aid of the CALIBRATION menu, the STIP-scan is individually tailored to your monitoring
site conditions. As such, a calibration must be carried out for each individual parameter. The
parameters SAC, SI, and ATU do not need to be calibrated.
The following section describes the calibration of NO3-N, CSB, TOC, SV, and TS. Calibration
requires a suitable daily trace of the selected parameter.
NOTE
Depending on sludge characteristic, the period of observation required for determining the minimum and
maximum for the calibration of the parameters SV and TS may be longer.
3.3.4.1 Preparing the calibration of NO3-N, CSB, TOC, SV, and TS
• Select and save the required parameters in submenu MEASURMENT – PARAMETERS.
• Select and save your monitoring site in submenu MEASURMENT – MONITORING SITE.
• Select and save “INDIVIDUAL“ as WWTP type in submenu CALIBRATION –
WWTP TYPE.
• Using the MEASURMENT – START MEASURMENT menu, start the measuring process
and let the STIP-scan run for a day (or longer - see note above).
page 3-18
Endress+Hauser
Panel-PC with STIP-scan
COMMISSIONING
• After 24 hours, look at the graph. The daily trace shows at what time the minimum and
maximum values occurred. Enter a suitable minimum and maximum for the measured values. It is important that the difference between minimum and maximum (to be entered later
at the calibration screen) is sufficiently large; the difference must be at least 30% of maximum.
• On the next day, take three samples each at the times you have recorded the minimum and
maximum measured values in the daily trace.
CAUTION
To avoid injuries and infections, wear protective clothing, gloves, and goggles when working with
wastewater.
At sampling time, read the values measured by the STIP-scan (STIP-scan value “HIGH“
and “LOW“). Alternately, you can record the time of manual sampling and read the measured value from the trace afterwards.
• The six samples must then undergo a suitable sample preparation. The selection of a
sample preparation for the reference measurement in the laboratory is extremely
important for the individual application. The following table shows what sample preparation has to be carried out for which parameter, and at which measuring point.
Tab. 3.3.4.1-1: Sample preparation for NO3, CSB, and TOC
inlet
aeration tank
settling of suspended mattera)
filtering of suspended matterb)
outlet
untreatedc)
a) according to DIN
b) using paper filter, 45 µm pore size
c) The sample does not have to be pre-treated for laboratory measuring.
• Measure the samples in the laboratory for reference. The results of the reference measurement provide the LABORATORY values for calibration.
• Once all STIP-scan values and LABORATORY values (laboratory-measured values
after sample pre-treatment) have been determined, they can be used to individually
adapt the parameters to the WWTP. For this operation, select CALIBRATION –
TARGET/ACTUAL ADJUSTMENT and enter your values. Details are listed in the following section "TARGET/ACTUAL ADJUSTMENT".
3.3.4.2 TARGET/ACTUAL ADJUSTMENT submenu
In this sub-menu, the STIP-scan is calibrated according to the individual circumstances of your
wastewater treatment plant.
For this purpose, the three measured LABORATORY and STIP-scan values in the lowest and
highest measuring ranges (discussed in the previous section) are required.
Perform calibration in the following manner:
• Select the CALIBRATION – TARGET/ACTUAL ADJUSTMENT submenu and select
the desired parameter (in example: NO3-N).
• Then, enter the value of the parameter measured by the STIP-scan, at the time of sampling, as the STIP-scan value for the low measuring range ("LOW" line): 1 (see
fig. 3.3.4.2-1 on page 3-20).
(unit of measure for nitrate, COD, and TOC: mg/l.; for TS: g/l; for SV: ml/l)
example: see next page
Endress+Hauser
page 3-19
COMMISSIONING
example:
Panel-PC with STIP-scan
The STIP-scan value of NO3-N in the lower measuring range is 1.0 mg/l.l.
1
2
3
4
5
6
7
8
11
9
10
Fig. 3.3.4.2-1: Nitrate-calibration (i.e.)
• Enter the three comparison/calibration values of the laboratory-measured parameter as
the LABORATORY value for the low measuring range ("LOW" line): 2 - 4 .The unit of
measure for nitrate, COD, and TOD is mg/l; g/l for Total Solids; ml/l for sludge volume.
example : The LABORATORY values for NO3-N in the low measuring range were all
1.0 mg/l.
• For STIP-scan value for the high measuring range ("HIGH" line), enter the value of the
parameter measured by the STIP-scan at the time of sampling ( 5 ).
example:
The STIP-scan value of NO3-N in the high measuring range was 9.2 mg/l.
• As LABORATORY values for the high measuring range ("HIGH" line), enter the three
comparison/calibration values of the laboratory measurement: 6 - 8 .
example:
The LABORATORY values for NO3-N in the high measuring range were
9.3 mg/l, 8.9 mg/l and 9.4 mg/l.
• After the STIP-scan and LABORATORY values are entered, they are activated by clicking "SAVE" ( 9 ).
The average is automatically calculated from the entered LABORATORY values. Next, the STIPscan values are used to carry out a calibration for the respective parameters. This is apparent from
the display of the calibration constants a (slope of calibration trace) and b (y-axis section of calibration trace) in the calibration screen:
calibration constants
Fig. 3.3.4.2-2: Display of calibration constants
After implementation of the target/actual adaptation, the STIP-scan analyzer is calibrated.
page 3-20
Endress+Hauser
Panel-PC with STIP-scan
COMMISSIONING
3.3.4.3 ENTER MEASURING FUNCTION submenu
In the submenu ENTER MEASURING FUNCTION, individual measurements, together with
measured STIP-scan values, can be evaluated as a calibration function. An extensive evaluation
of the calibration function is carried out by Endress+Hauser Conducta GmbH&Co.KG Division
STIP. For evaluation, a list of the collated comparison parameters with the respective date and
time, as well as the STIP-scan measuring data saved in the computer, is required. After evaluation
of the data, Endress+Hauser Conducta GmbH&Co.KG Division STIP will provide you with the
determined calibration function, adapted specifically to your installation.
The determined calibration function must be entered into the CALIBRATION – ENTER
MEASURING FUNCTION screen, and the calibration must be activated.
Fig. 3.3.4.3-1: ENTER MEASURING FUNCTION menu (here: TOC)
• To recalibrate a parameter previously calibrated, go first into the SETTINGS –
WWTP TYPE screen (see page 3-22). Select the parameter, type “INDIVIDUAL“, and
save. This deletes the previous calibration values.
NOTE
Failure to delete the previous calibration data by saving the type as “INDIVIDUAL“ in the
WWTP TYPE menu will result in the re-calibration NOT being activated! Although new calibration data are displayed on screen, they are NOT activated in the system.
• Then, select the ENTER MEASURING FUNCTION menu and select the parameter you
wish to enter. The following can be selected: NO3-N, COD, TOC, SV, and TS.
example: A measuring function is to be entered for the parameter TOC. The parameter
"TOC" must thus be selected.
• Enter the measuring function or the constant of the square measuring function:
y = a x2 + b x + c.
example: In this case, a = 0.0618, b = 0.04715 and c = 4.0785.
Please note that any interference with the parameter measurement directly affects the
results. Measurement should therefore only be implemented by specially trained and
instructed personnel.
INFORMATION
The operator shall have the sole responsibility for changing or entering the mathematical function of the
measuring traces. Endress+Hauser Conducta GmbH&Co.KG Division STIP shall not accept any responsibility for incorrect input or its consequences.
NOTE
If you want to make a TARGET/ACTUAL adjustment for the same parameter you calibrated before, go
into the SETTINGS – WWTP TYPE screen (see next page). Select the correct parameter, type “INDIVIDUAL“, and save. This deletes the previous calibration values. Then, you can make the TARGET/
ACTUAL adjustment according to the explanation on page 3-19.
Endress+Hauser
page 3-21
COMMISSIONING
Panel-PC with STIP-scan
3.3.4.4 WWTP TYPE submenu
In this menu, the wastewater treatment plant type (WWTP type) must be specified for each parameter. This setting is used for the calibration of the system and therefore MUST be entered
correctly.
1
2
3
Fig. 3.3.4.4-1: WWTP TYPE menu
Select the WWTP type for each parameter:
1. Selection of parameter ( 1 ): NO3-N, COD, TOC, SV, or TS;
2. Selection of WWTP type ( 2 ): At present, only the setting INDIVIDUAL can be
selected.
3. Save the entered values by clicking on the SAVE ( 3 ) button.
After selecting a WWTP type, continue with TARGET/ACTUAL ADJUSTMENT menu (page 319) or ENTER MEASURING FUNCTION menu (page 3-21).
NOTE
Select the WWTP type “INDIVIDUAL“ and save it before starting a new calibration! This must be done for
each parameter that shall be newly calibrated!
3.3.4.5 KHP-VALIDATION submenu
With the aid of this menu, the STIP-scan analyzer can be checked for carbon parameters, using
a KHP standard solution. A KHP solution with a concentration of 50 mg/l KHP is required.
Proceed as follows:
1. Start validation by selecting CALIBRATION, then activating the KHP-VALIDATION
menu.
The settling/measuring cell is emptied.
2. After the quartz cell has been emptied, you are prompted to place the probe in the KHP
solution.
• Thoroughly clean the outside of the probe.
• Place the STIP-scan probe in the KHP solution.
• Click “OK”.
The settling/measuring cell is rinsed three times in KHP solution before reference
measurement.
page 3-22
Endress+Hauser
Panel-PC with STIP-scan
COMMISSIONING
At the end of the measuring operation, the KHP measuring value determined by the system is
displayed.
NOTE
if your system contains the "plus" add-on module, the KHP validation spectrum is shown in a seperat
screen. The spectrum of the KHP validation measurement is saved in file in the hard disk folder C: \ STIPscan \ AKT_SPEK.KHP.
The measured value of the probe may deviate by up to 10% from the TARGET value of the KHP
solution (50 mg/l).
NOTE
In case of larger deviations, contact the technical service of Endress+Hauser Conducta GmbH&Co.KG
Division STIP.
3.3.4.6 NO3-N-VALIDATION submenu
With the aid of this menu, the total system can be checked for nitrogen parameters, using a NO3
standard solution. A NO3 solution with a concentration of 10 mg/l NO3-N is required.
To perform NO3 validation, proceed as follows:
1. Start validation by activating the NO3-N-VALIDATION menu.
The quartz cell is emptied.
2. After the settling/measuring cell has been emptied, you are requested to place the
probe in the NO3-N solution.
•
•
•
•
Remove the STIP-scan probe from the wastewater.
Thoroughly clean the outside of the probe.
Place the STIP-scan probe in the NO3-N solution.
Confirm that the probe is in NO3-N solution.
The quartz cell is rinsed three times in NO3-N solution before reference measuring
is commenced.
At the end of the measuring operation, the
NO3-N value determined by the system is
displayed: figure 3.3.4.6-1
9.98
Fig. 3.3.4.6-1: NO3-N-VALIDATION VALUE screen
NOTE
if your system contains the "plus" add-on module, the KHP validation spectrum is shown in a seperat
screen. The spectrum of the NO3-N validation measurement is saved in file in the hard disk folder C: \
STIP-scan \ AKT_SPEK.NO3.
The measured value of the probe may deviate by up to 10% from the TARGET value of the NO3N solution (10 mg/l).
NOTE
In case of larger deviations, contact the technical service of Endress+Hauser Conducta GmbH&Co.KG
Division STIP.
Endress+Hauser
page 3-23
COMMISSIONING
Panel-PC with STIP-scan
3.3.4.7 TAKE SAMPLE SPECTRUM submenu
NOTE
The menu TAKE SAMPLE SPECTRUM is only available with the add-on module "plus".
This menu allows absorbance measurement over an entire spectrum within a specified range of
your choice. The data can then be analyzed for the concentration of specific substances.
shows
measured
values
Fig. 3.3.4.7-1: TAKE SAMPLE SPECTRUMS menu
Input the following:
SAMPLE NO.
CONCENTRATION (mg/l)
NUMBER OF FLUSHES
SPECTRUM BETWEEN (nm)
AND (nm)
FILE NAME
Enter the number of your sample.
Enter the concentration in mg/l.
Enter the number of flushes to be carried out prior to measuring.
Enter bottom wavelength limit for absorbance measurement.
Enter top wavelength limit for absorbance measurement.
Specify the file name under which the measured values are saved.
Using the START MEASURING button, start the process by flushing the measuring cell (at
NUMBER OF FLUSHES > 0). The result is displayed in the right window or in the opening trace
screen.
In addition, the measured absorbance and intensity values of the sample are each stored in an
Excel file. The Excel files are located in the same folder as the STIP-scan software. The measured
absorbance values of the sample are stored under the chosen name with the extension "p_a". The
measured intensity value of the sample is saved under the chosen name with the extension "p_i".
For analysis, the data is then sent to Endress+Hauser Conducta GmbH&Co.KG Division STIP,
where algorithms can be adapted for your specific application.
page 3-24
Endress+Hauser
Panel-PC with STIP-scan
COMMISSIONING
3.3.4.8 CAL.CONSTANTS submenu
The submenu CAL.CONSTANTS shows the calibration constants of all parameters that can be
calibrated. The first line of each parameter shows the calibration function of the TARGET/
ACTUAL ADJUSTMENT. The second line of each parameter shows the calibration function of
ENTER MEASUREMENT FUNCTION.
example 1: CAL.CONSTANTS screen, if the analyzer system wasn’t calibrated:
Fig. 3.3.4.8-1: CAL.CONSTANTS submenu (here: without any calibration)
example 2: CAL.CONSTANTS screen, after calibrating the parameter TOC by the ENTER
MEASURMENT FUNCTION menu:
Fig. 3.3.4.8-2: CAL.CONSTANTS submenu (here: with calibration constants)
Endress+Hauser
page 3-25
COMMISSIONING
Panel-PC with STIP-scan
3.3.5 SETTINGS menu
The SETTINGS menu contains the settings of the monitoring site, smoothing, signal outputs,
interfaces, and additional outputs.
Fig. 3.3.5-1: SETTINGS menu
NOTE
With the exception of the PASSWORD menu, all sub-menus of SETTINGS can be protected with a user
password (for activated password function, see section ”PASSWORD submenu” on page 3-32).
3.3.5.1 MEASUREMENT PLACE submenu
The measurement place menu is used for entering a description/name of the monitoring point or
of the probe. A description/name makes it easier to identify a probe of a multiple-probe system
(several probes connected at one controller).
Enter the description/name of the monitoring point or of the probe into the MEASURMENT
PLACE menu. After entering, the name/description is displayed in the title bars and in the main
screen of the software program
description/
name of monitoring point or
of the probe
Fig. 3.3.5.1-1: Screen after entering the description/name of the monitoring point or of the probe
page 3-26
Endress+Hauser
Panel-PC with STIP-scan
COMMISSIONING
3.3.5.2 INLET/OUTLET submenu
NOTE
The settings in this menu should generally only be carried out by a service technician of Endress+Hauser
Conducta GmbH&Co.KG Division STIP. Changes to the settings have a direct effect on the entire system
and thus on the measured values.
The INLET/OUTLET menu can only be used if the STIP-scan is installed in the inlet or outlet of
your wastewater treatment plant. If the aeration tank is your measuring point, you have to open
the submenu ”AERATION TANK submenu” on page 3-28.
In the INLET/OUTLET menu, the program settings are entered:
30
Fig. 3.3.5.2-1: INLET/OUTLET menu
Tab. 3.3.5.2-1: Parameter of INLET/OUTLET menu
parameter
description
REPEATS PER MEASURE
number of repeat measurements used to obtain an average, which
becomes the measured value
SETTLING TIME (SEC)
(just for inlet
time in seconds in which the suspended matter can settle; measurement only begins after expiration of the settling time.
recommendation for inlet: 30 seconds
MEASUREMENTS PER
HOUR
(measurement all x min.)
number of measuring cycles per hour;
is automatically converted into number of measuring cycles per
minute.
• Implement your settings.
• Save your entries.
• Use the REJECT button to delete the entries and return to the last saved settings.
Endress+Hauser
page 3-27
COMMISSIONING
Panel-PC with STIP-scan
3.3.5.3 AERATION TANK submenu
NOTE
The settings in this menu should generally only be carried out by a service technician of Endress+Hauser
Conducta GmbH&Co.KG Division STIP. Changes to the settings have a direct effect on the entire system
and thus on the measured values.
The AERATION TANK menu can only be used if the STIP-scan is installed in the aeration tank of
your wastewater treatment plant. If the monitoring site is located in the inlet or outlet of the wastewater treatment plant, you have to open the sub-menu ”INLET/OUTLET submenu” on page 3-27.
In the AERATION TANK menu, the program settings are entered:
Fig. 3.3.5.3-1: AERATION TANK menu
Tab. 3.3.5.3-1: Parameter of AERATION TANK menu
parameter
description
MAX. SETTLING TIME (SEC)
max. time for settling the sludge;
if the time is exceeded, the warning "NO SLUDGE SETTLING“ is
triggered.
DELAY MEASUREMENT
time in seconds before measurement starts; measurement only
begins after expiration of the delay time.
THRESHOLD SLOPE (PPM)
threshold of sludge settling curve slope;
Attaining this threshold finishes the reading of the sludge settling
curve and starts the reading of the other measuring parameter
after the settling time (standard: 30 sec.; otherwise according to
parameter SETTLING TIME of menu INLET/OUTLET).
ABORT FROM (% FIRST VALUE)
value in percent of the first value at which the observation of
sludge settling is interrupted and the inquiry of THRESHOLD
SLOPE (see above) is started.
• Implement your settings.
• Save your entries.
• Use the REJECT button to delete the entries and return to the last saved settings.
page 3-28
Endress+Hauser
Panel-PC with STIP-scan
COMMISSIONING
3.3.5.4 SMOOTHING submenu
In this menu, the smoothing of the traces can be set:
Fig. 3.3.5.4-1: SMOOTHING screen
Every trace can be individually smoothed. Consequently, all parameters are listed on the left side.
Please note that only the selected parameters are active. The abbreviation "SPPA" stands for
"special parameter".
The following smoothing settings can be used:
THRESHOLD SMOOTHING (%)
THRESHOLD STEP (%)
states at what % of change in the measured value a smoothing of
the trace is to be activated
states at what % of change in the measured value, for three measurements running, a jump/step in the trace is displayed
Example: For parameter NO3-N, the following smoothing function applies – according to the
above figure:
• As soon as a change of 5% can be observed between two NO3-N measured
values, the trace is smoothed (threshold smoothing (%) 5.0)
• As soon as a change of 10% can be observed for three NO3-N consecutive
readings, a jump/step appears in the trace.
After the settings have been selected, they can be saved. By clicking on the REJECT button, all
settings are deleted and the last saved settings are activated.
Endress+Hauser
page 3-29
COMMISSIONING
Panel-PC with STIP-scan
3.3.5.5 ANALOG OUTPUTS submenu
Depending on the application, your STIP-scan contains one or two analog output modules, i.e. two
to four current interfaces. These can be configured in the ANALOG OUTPUT menu.
1
2
3
6
5
4
Fig. 3.3.5.5-1: ANALOG OUTPUT menu
Fig. 3.3.5.5-1: Choice list
Tab. 3.3.5.5-1: Parameter of ANALOG OUTPUTS menu
parameter
description
OP.MODE ( 1 )
determination of the operating mode of the output module
options: 0 - 20 mA and 4 - 20 mA
SIGNAL 1 (2...4) ( 2 )
determination of which signal output should be selected at which
parameter
options: see figure 3.3.5.5-1
Only select the "TEST" parameter, if you want to carry out a functional test of the module. The "TEST" parameter may only be
selected for a signal output ("SIGNAL").
• Enter the settings.
If you have one analog module, only two signal outputs ("SIGNAL 1" and "SIGNAL 2")
will be displayed.
• Save your entries with the SAVE key ( 3 ).
• Use REJECT to delete the settings and return to the last saved settings.
• Close the menu/window by clicking on the INPUT COMPLETE button ( 4 ).
Functional test of output modules
For this operation, an ammeter is required. We recommend stopping the measuring mode for
testing the output modules.
The function of the analog output modules can be checked by selecting the "TEST" parameter
for the signal output to be tested and entering a current under the TEST item ( 5 ). The signal
output (test function) should then be activated by clicking on the OUTPUT ( 6 ) button. Using
the ammeter, check whether the entered test current is applied during activation of the test
function.
page 3-30
Endress+Hauser
Panel-PC with STIP-scan
COMMISSIONING
3.3.5.6 RELAY CONTACTS submenu
Seven relay contacts are available. These can be configured in the RELAY CONTACTS menu.
1
2
4
5
3
Fig. 3.3.5.6-1: RELAY CONTACTS menu
Fig. 3.3.5.6-1: Choice list
• Specify which signals/data you wish to output to which RELAY: 1 .
The following should be observed:
• The output of RELAY 1 will always be OPERATION.
• The output of RELAY 2 will always be LEAKAGE.
• The output for RELAY 3 will always be LAMP/SPECTROMETER FAILURE")
• RELAY 4 to RELAY 7 can be individually assigned. The following selection options are
available (figure 3.3.5.6-1):
GENERIC ALARM 1
The relay opens if one of the following errors occures:
LEAKAGE, NO LIGHT SIGNAL, NETWORK ERROR,
OUTPUTS FAILURE (warning & error), STEPPER
FAILURE, AIR IN MEASURING CELL (just error),
DROP IN PRESSURE, NO VALID REFERENCE;
for more details see chapter 6, “Troubleshooting”
GENERIC ALARM 2
The relay opens if one of the following warnings
occures:
NO SLUDGE SETTLING, ABSORPTION TOO HIGH,
NITRATE VALUE TOO HIGH, AIR IN MEASURING
CELL;
for more details see chapter 6, “Troubleshooting”
NETWORK FAILURE
The relay opens if the communication between the
panel-PC and the probe is interrupted.
OUTPUTS FAILURE
The relay opens if the data output via the analog outputs or the signal output via the relay contacts does not
function correctly.
STEPPER FAILURE
The relay opens in case of a functional stepper failure.
AIR IN MEAS.CHAMBER
The relay opens if air is detected in the measuring cell.
DROP IN PRESSURE
The relay opens if the pressure drop inside the probe is
too high.
NITRATE VALUE TOO HIGH
The relay opens if the measuring range for nitrate is
exceeded during operation.
Endress+Hauser
page 3-31
COMMISSIONING
COD/TOC/SAC VALUE TOO HIGH
Panel-PC with STIP-scan
The relay opens if the measuring range for COD, TOC,
or SAC is exceeded during operation.
• Save your entries by clicking on SAVE ( 2 ).
• Use REJECT to delete the settings and return to the last saved settings.
• Close the menu/window by clicking on the INPUT COMPLETE button ( 4 ).
Functional test of relays
A continuity tester is required for testing the function of the relays.
To check the function of the relays, select the relay contact to be checked from the TEST menu
( 4 ). Next, open or close the relay by clicking on OPEN or CLOSE ( 6 ). Using the continuity
tester, the opening and closing of the relay can be checked.
3.3.5.7 PASSWORD submenu
In order to prevent unauthorized access, the software program contains a password function. This
function prevents unauthorized access to the analyzer by requesting an additional password
before allowing access to the CALIBRATION and SETTINGS menus. In order to select the CALIBRATION and SETTINGS menus, a password is required after activating the password function.
INFORMATION
Once activated (see below), the password function cannot be deactivated again! The password function
can only be deactivated by a service technician of Endress+Hauser Conducta GmbH&Co.KG Division
STIP. This is done to prevent unauthorized deactivation of the password function.
Only persons that know the user password can select the CALIBRATION and SETTINGS menus
if the password function has been activated.
Activating the password function
If you decide to use the password-protection function, this can be activated as follows:
• Select the PASSWORD menu:
• To activate the password function, the manufacturer's password must first be entered.
This password is enclosed in the packaging of the equipment. Confirm the password by
clicking ENTER.
• Now enter the new password and confirm the password by pressing ENTER.
• Enter the new password a second time and confirm it by clicking ENTER.
NOTE
Pass on the user password to all persons who should have access to the CALIBRATION and
SETTINGS menus.
The password function has now been activated, a red dot appears in the left top corner
of the main screen:
page 3-32
Endress+Hauser
Panel-PC with STIP-scan
COMMISSIONING
dot
Fig. 3.3.5.7-1: Activated password function
Once the correct password has been entered, the dot will disappear.
De-activating the user password
Only the service technician of Endress+Hauser Conducta GmbH&Co.KG Division STIP can
disable the password function.
3.3.5.8 INTERFACE submenu
From the INTERFACE menu, the panel-PC interface is selected, that should be used for the
communication with the STIP-scan probe.
• Select the interface COM1 for the first STIP-scan probe and activate your selection by
clicking on OK.
• Select the interface COM2 for the second STIP-scan probe and activate your selection
by clicking on OK.
Activating a new COM interface, the message “new COM“ is displayed on the menu bar.
In normal operation mode, the communication between converter module and panel-PC is continually checked. If a free COM interface isn’t found for 5 times (per day) during a measuring, the
error message “NETWORK FAILURE“ is activated at the 6th time (per day). if the communication
between probe and panel-PC is interrupted/deactivated while activating a manual function (e.g.
starting the STIP-scan software, calibration etc.), the error message “NO COM PORT AVAILABLE“ is activated. Further details on error messages and their remedial action are in chapter 6,
“Troubleshooting” .
NOTE
if the error message „“NO COM PORT AVAILABLE“ is displayed during the STIP-scan software start,
check, if you chose the correct COM interface in menu INTERFACE. The COM interface selected in menu
INTERFACE must be identical with the panel-PC interface at which the RS232-cable of the corresponding
probe is connected with the panel-PC.
Endress+Hauser
page 3-33
COMMISSIONING
Panel-PC with STIP-scan
3.3.5.9 ADDITIONAL OUTPUTS submenu
In this menu, the following additional features can be activated:
Fig. 3.3.5.9-1: ADDTIONAL OUTPUTS memu
Tab. 3.3.5.9-1: Parameter of ADDITIONAL OUTPUTS menu
parameter
description
FIELDBUS
activates or deactivates the Fieldbus connection;
Details on the Field connection are on page 3-35.
FB Adr
Fieldbus address;
Details on the Field connection are on page 3-35.
SAVE SLUDGE SETTLING CURVE
activates/deactivates the saving of the sludge data into a
csv-file; More details on sludge data storage are on
page 3-38.
SHOW PROGRESS BAR
activates/deactivates the process bars „NEXT MEASURENT“, „SLUDGE SETTLING TIME“ and „SETTLING
TIME“ in the main screen; More details on page 3-38.
SAVE ACTUELL SPECTRA
activates/deactivates the saving of the spectra into a csvfile; More details on page 3-39.
SAVE DAILY DATA
activates/deactivates the saving of the measured data
(without sludge data) of a whole day into a csv-file. More
details on page 3-39.
Optionale Fieldbus connection
The Fieldbus connects the STIP-scan analyzer with other external measuring and controlling
instruments. Each component is placed in the field as wanted and is controlled by one point.
The STIP-scan analyzer system needs an additional plug-in Fieldbus card and must be connected
to a Fieldbus system. A Profibus (process Fieldbus) with the protocols DPV1 or DPV0 is used for
the Fieldbus communication with the STIP-scan.
Minimum requirements on Profibus connection to STIP-scan analyzer system
• The panel-PC must equipped with the additional plug-in Fieldbus card. Technical data of
the plug-in card are listed on page 1-20. The Fieldbus plug-in card is installed into the
panel-PC exclusively by Endress+Hauser Conducta GmbH&Co.KG Division STIP!
• Every Profibus DRV1 or DPV0 compartible instrument (e.g. Siemens S5 or S7 programmable logic controller) can be used as a master.
page 3-34
Endress+Hauser
Panel-PC with STIP-scan
COMMISSIONING
slave 01
master 00
Fieldbus cable
Out 1
Out 2
inputs
Out 3
01
Out 1
01
Out 2
01
Out 3
02
Out 1
02
Out 2
02
Out 3
02
Out 4
Out 1
02
Out 5
Out 2
03
NO3
Out 3
03
CSB
Out 4
03
TOC
03
SAK
03
SV
03
TS
In 1
*
In 2
In 3
slave 02
*
Out 5
*
In 1
slave 03
Fieldbus cable
STIPscan
*
NO3
*
CSB
03
SI
03
ATU
04
Out 1
04
Out 2
05
Out 1
05
Out 2
Fieldbus cable
TOC
SAK
SV
outputs
TS
*
SI
ATU
*
slave 04
*
*
Fieldbus cable
01
In 1
01
In 2
01
In 3
02
In 1
04
In 1
04
In 2
05
In 1
05
In 2
Out 1
Out 2
slave 05
In 1
In 2
Out 1
* assigned by GSD- or GID-file
Out 2
In 1
In 2
Fig. 3.3.5.9-2: Fieldbus connection diagramm
Installation of the Profibus connection
• ”Step 1: Installation of Profibus connection with the PLC” on page 3-35
• ”Step 2: Installation of Fieldbus in the STIP-scan software” on page 3-37
• ”Step 3: Check the Fieldbus installation” on page 3-37
Step 1: Installation of Profibus connection with the PLC
• Define the Fieldbus address
For installation of a Fieldbus connection with a PLC (programmable logic controller), the address must be defined under which the Fieldbus card (slave) can be controlled by the PLC
(master). The standard setting of the Fieldbus address for the STIP-scan is „6“.
• Define the transmitted data format
The master (PLC) must be informed which kind of information can be understand by the
Fieldbus card. Thereby you must take into account which kind of information the master
(PLC) can be handle. Because the „simple“ PLC like Siemens S5 can’t handle the same information like an „advanced“ PLC (e.g. Siemens S7), the data transfer of the „simple“ and
the „advanced“ PLC must be differed:
Endress+Hauser
page 3-35
COMMISSIONING
Panel-PC with STIP-scan
"Advanced" PLC (e.g. Siemens S7)
An „advanced“ PLC can handle floating points numbers. So the type of the measured STIPscan data can be transferred directly to the „advanced“ PLC.
"Simple" PLC (e.g. Siemens S5)
A „simple“ PLC can’t undterstand floating points numbers. The „simple“ PLC needs integer
numbers. (The values range of this data format is from -32768 up to 32767 for numbers with
algebraic sign or from 0 up to 65535 without algebraic sign.)
Because the measured data of the STIP-scan are floating points numbers, the measured
data must be multiplied with suitable factors to get integer numbers for the processing by a
„simple“ PLC. The factors for the multiplication are:
Tab. 3.3.5.9-2: Multiplication factors
parameter
factor
NO3-N
100
COD
10
TOC
10
SAC
100
SV
100
TS
10
SI
100
ATU
100
SP1
10
1st example: Nitrate
The nitrate value measured by the STIP-can is multiplicated with the factor 100 and then
transferred to the PLC (S5). So, the measured value of 12.34 mg/l is transferred as the number „1234“ to the PLC (S5).
2nd example: COD
Because the COD measured value can be very high and the second decimal place is uninteresting, the COD measured value is multiplicated with the factor 10 and then transferred
to the PLC (S5). So, the measured value of 736.48 mg/l is transferred as the number „7364“
to the PLC (S5).
NOTE
If you change from the „simple“ PLC to a „advanced“ PLC, special settings of the STIP-scan software must be changed! Contact a service technician of Endress+Hauser Conducta GmbH&Co.KG
Divison STIP before changing!
• Define the format of the data to be transferred
The PLC must be informed how the data of the Fieldbus card (slave) are saved so that the
I/O memory of the slave (Fieldbus card) is correctly copied into the PLC. The schematic in
fig. 3.3.5.9-2, page 3-35 shows the Fieldbus connection of the STIP-scan analyzer system.
"Advanced" PLC (e.g. Siemens S7)
At an „advanced“ PLC, a correct copy of the I/O memory of the slave (Fieldbus card) is
saved into the GSD-file (historical data of the device).
"Simple" PLC (e.g. Siemens S5)
At a „simple“ PLC a correct copy of the I/O memory of the slave (Fieldbus card) is saved into
GID files which must be implemented into a „simple“ PLC and compiled before. (The GID
files are usually burned on an EPROM and plugged in the PLC.)
page 3-36
Endress+Hauser
Panel-PC with STIP-scan
COMMISSIONING
Step 2: Installation of Fieldbus in the STIP-scan software
• Switch on the panel-PC by the main switch (see chapter 3.3.1, page 3-7).
• If the STIP-scan software automatically starts, quit the STIP-scan software by the button
QUIT in the main screen.
• Open the file „Daten.stp“ by the editor. The file „Daten.stp“ is located in the same folder
like the STIP-scan software on the hard disk of the panel-PC.
At the end of the list the section "[FELDBUS]" is listed. Enter the number „1“ into the line
„FBTyp = ...“ for the Fieldbus type S7 or the number „2“ for Fieldbus type S5. Pay attention to the blanks in front of and following the „=“ sign! Save your entry and lose the file
„Daten.stp“.
• Start the STIP-scan and the keyboard software (see chapter 3.3.1, page 3-7).
• Switch into menu SETTINGS – ADDITIONAL OUTPUTS und activate the FIELDBUS
function. Enter the desired Fieldbus address into the field FB Adr (default setting :
FB Adr „6“, chapter 3.3.5.9, page 3-34).
• Save all entries by pressing the button SAVE.
Step 3: Check the Fieldbus installation
After successful installation of the Fieldbus, the main menu of the STIP-scan program
shows a green dot with a „F" inside the dot (see figure 3.3.5.9-3).
If there is a red dot instead of a green one, the Fieldbus card can’t be initialized or there’s
no communication to the PLC (master) possible.
If there is no dot shown on the main menu, the panel-PC probably does not have any Fieldbus card.
Fieldbus
connection
(successful)
Fig. 3.3.5.9-3: Successful Fieldbus installation
Endress+Hauser
page 3-37
COMMISSIONING
Panel-PC with STIP-scan
Optional storage of sludge data
If the option SAVE SLUDGE SETTLING CURVE is activated in menu SETTINGS – ADDITIONAL
OUTPUTS, the data of the sludge settling curve (SDA) are saved as a csv-file on the hard disk of
the panel-PC:
• file of absorbance values of sludge measurement at time hh-mm
The files SDA-hh-mm.csv are saved with each sludge measurement at the corresponding
current time hh-mm in the hard disk folder C: \ STIP-scan \ SDAYYYY \ SDAYYYYMM \ SDAYYYY-MM-DD .
• file of absorbance values of sludge measurement at the day YYYY-MM-DD
All sludge absorbance data of one day are saved in the file SDA_YYYY-MM-DD.csv in hard
disk folder C: \ STIP-scan \ SDAYYYY \ SDAYYYY-MM \ SDAYYYY-MM-DD.
abbreviation legend
SDA - abbreviation for sludge data
YYYY - indication of the year, four-digit number
MM - indication of the month, two-digit number
DD
- indication of the date, two-digit number
hh
- indication of the time; „hh“ is abbreviation of the hour, two-digit number
mm - indication of the time; „mm“ fis abbreviation of the minute, two-digit number
Processing of the sludge data by Microsoft Excel
Csv-files can be converted into an Excel sheet and then be processed. To do this, the csv-files
must be download from the hard disk of the panel-PC (via USB port of the panel-PC) and uploaded onto a PC at which the Microsoft program Excel is installed. After uploading, start the
Excel program an open the csv-file via the menu File – Open. Thereby you must take into account that the files are lists seperated by semicolons and comma as decimal seperated.
Display of the progess bar in main menu
If the option SHOW PROGRESS BAR is activated in menu SETTINGS – ADDITIONAL
OUTPUTS, the progress bar is displayed on the main menu.
There are thre kinds of the progress bar:
• The progress bar „NEXT MEASUREMENT“ shows the time until the next measurement
starts (see fig. 3.3.5.9-4);
• The progress bar „SLUDGE SETTLING TIME“ showns the time for the measurement in
the aeration tank until the sludge settling is completed. This process bar is only shown
with activated sludge settling.
• The progress bar „SETTLING TIME“ (see fig. 3.3.5.9-4) shows the time for settling suspended substances in the inlet as well as the time for settling suspended solids after the
sludge settling in the aeration tank:
page 3-38
Endress+Hauser
Panel-PC with STIP-scan
COMMISSIONING
Fieldbus connection
progress bar „SLUDGE
SETTLING TIME “
progress bar „NEXT
MEASUREMENT“
Fig. 3.3.5.9-4: Main menu with progress bar „NEXT MEASUREMENT“, progress bar „SLUDGE
SETTLING TIME“ and activated Fieldbus connection
Storage of the actual spectrum
If the option SAVE ACTUAL SPECTRA is activated in menu SETTINGS – ADDITIONAL
OUTPUTS, the spectrum of the current measurement is saved in the csv-file AKT_SPEK.MES in
the hard disk C: \ STIP-scan \ *.* of the panel-PC.
Storage of the daily data
If the option SAVE ACTUAL SPECTRA is activated in menu SETTINGS – ADDITIONAL
OUTPUTS, the daily data of all parameters are saved in one csv-file on a hard disk folder of the
panel-PC. To do this, scroll in menu SHOW TRACES to the desired day and then press the button
„SAVE“. The next batch will overwrite the existing fill.
Contiuously saved daily data
The measured values of all parameters are saved in one daily data file named „DAYYYYMMDD.csv“. All dairly data files are in the month folder named MDAYYYYMM in the STIP-scan
folder, hard disk drive C: \ STIP-scan \ MDAYYYYMM \ DAYYYYYMMDD.csv.
Daily data by menu SHOW TRACES
If the option SAVE ACTUAL SPECTRA isn’t activated, you can make a daily data file with the
aid of the menu SHOW TRACES: Switch to menu TRACES – SHOW TRACES and scroll to
the desired day. Then press the button „SAVE“.
The measured values of all parameters are saved in one daily data file named „DAYYYYMMDD.csv“. All dairly data files are in the month folder named MDAYYYYMM in STIP-scan folder
hard disk drive C: \ STIP-scan \ MDAYYYYMM \ DAYYYYYMMDD.csv.
abbreviation legend
MDA - abbreviation for monthly data
YYYY - indication of the year, four-digit number
MM - indication of the month, two-digit number
DD
- indication of the date, two-digit number
Endress+Hauser
page 3-39
COMMISSIONING
Panel-PC with STIP-scan
3.3.6 TEST menu
In the TEST menu, the function of the spectrometer, stepper for the piston, air pressure inside the
probe, and of the entire system can be checked:
Fig. 3.3.6-1: TEST menu
3.3.6.1 SPECTROMETER submenu
With this menu, the function of the spectrometer can be checked.
Fig. 3.3.6.1-1: Spectrometer test screen
• Clean the outside of the probe, if necessary, and put it in distilled water to check the
function of the spectrometer (at initial start-up).
• Flush the quartz cell a minimum of three times by driving the stepper up and down (see
next section on page 3-41).
• Go to the TEST menu, (sub-chapter SPECTROMETER) and select the
SINGLE MEASUREMENT button to see the spectrum of the sample (distilled water). If
your system contains the „plus“ add-on module, it automatically opens a SPECTRUM
screen containing the traces.
• If you wish to view a continuous measurement, select the CONTINUOUS MEASUREMENT button. If your system contains the „plus“ add-on module, the SPECTRUM
screen then automatically opens (see fig. 3.3.6.1-2 on page 3-41). If you activate the
function OVERLAP TRACES in the SPECTRUM window, the progressive traces of
each measurement are shown.
• While continuous measurement is active, the CONTINUOUS MEASUREMENT key
appears in red (see fig. 3.3.6.1-2). Measurement will continue until the CONTINUOUS
MEASUREMENT key is selected again.
page 3-40
Endress+Hauser
Panel-PC with STIP-scan
COMMISSIONING
Fig. 3.3.6.1-2: Continuous measurement
3.3.6.2 STEPPER submenu
With this menu, the function of the stepper is tested.
Fig. 3.3.6.2-1: STEPPER test menu
After activating one of the above buttons, listen for the upward or downward movement of the
piston.
button
function
n STEPS UPWARDS
The piston moves completely upwards so that the quartz
tube is completely filled with medium.
n STEPS DOWNWARDS
The piston moves completely downwards so that the
quartz tube is completely emptied.
FLUSH 5 TIMES
The piston moves completely upwards and downwards.
Use this function for cleaning and flushing the quartz tube
with distilled water or other solutions.
CONTINUOUS FLUSH
The piston continuously moves upwards and downwards.
The flush will continue until the button CONTINUOUS
FLUSH is pressed again. The activation of the continuous
flush is shown by a red background color.
Endress+Hauser
page 3-41
COMMISSIONING
Panel-PC with STIP-scan
3.3.6.3 AIR PRESSURE submenu
An additional pressure test of the STIP-scan probe must be done upon first start-up. The probe
body of the STIP-scan analyzer is slightly pressurized with the air pump supplied in the accessory
kit.
Pressurize the system as follows:
1. Select AIR PRESSURE from the TEST menu. The following screen appears:
Fig. 3.3.6.3-1: Air pressure screen
2. Depressurize the STIP-scan probe and save the pressure shown in the “CURRENT“
field by pressing the “SAVE“ button. The current pressure is shown then in the “MEMO“
field.
3. Close the probe and connect the connection line to the probe. Make sure that the probe
is sealed.
4. Pump air into the probe to pressurize the probe the air pump supplied in the accessory
kit. You can follow the increasing pressure in the "CURRENT" field. Keep pumping until
the difference between the pressure inside the probe ("MEMO") and the ambient pressure ("CURRENT") is approx. 300 mbar.
5. Save the shown pressure (“CURRENT“ field) so that the value is shown in the “MEMO“
field.
6. Wait for 30 minutes. Then check if the pressure inside the probe is still constant. A maximum pressure droop of 20 mbar within 30 minutes is allowed.
7. If the proof pressure test can be performed successfully, depressurize the STIP-scan
probe, save the shown pressure (“CURRENT“ field) and restart the measurement
(menu START MEASUREMENT).
A pressure drop > 20 mbar may indicate a leak. Please contact your service technician
of Endress+Hauser Conducta GmbH&Co.KG Division STIP.
NOTE
At each start-up of the STIP-scan software, a systems test is performed and displayed (see fig. 3.3.3.13, page 3-13 and fig. 3.3.6.4-1, page 3-43).
page 3-42
Endress+Hauser
Panel-PC with STIP-scan
COMMISSIONING
3.3.6.4 TEST PROBE submenu
At each start-up of the STIP-scan software, a system test is performed. This test checks the functionality of the entire system.
With the aid of the TEST PROBE menu, a system test can be manually triggered.
Fig. 3.3.6.4-1: TEST PROBE menu
The following information is displayed:
• serial number of STIP-scan and respective module type
• temperature inside the probe
• air pressure of open probe (probe is not pressurized)
• current air pressure inside the probe (after pressurization)
• signal of leakage sensor (here: NO LEAKAGE)
• serial number and test status of spectrometer
• test status of reference values
• function of stepper
• check of analog signal outputs (display of module series)
• check of relay contacts (display of module series)
• end of system test.
Endress+Hauser
page 3-43
COMMISSIONING
Panel-PC with STIP-scan
3.3.7 LANGUAGE menu
With the aid of the LANGUAGE menu, the language of the STIP-scan software can be changed:
Fig. 3.3.7-1: LANGUAGE menu
When selecting a language that is not active (here: Deutsch/German) the software language is
automatically changed to the desired language.
Example: Upon activating the Deutsch/German language, the language of the software program
changes:
Fig. 3.3.7-2: Software in German
page 3-44
Endress+Hauser
Panel-PC with STIP-scan
DECOMMISSIONING
4 Decommissioning
In order to decommission the STIP-scan, the probe must be cleaned and the connection cable
must be disconnected.
Required equipment:
• protective clothing (goggles, gloves, lab coat);
• cleaning solution, if necessary
• distilled water
• bucket with water, scouring cloth, cloth.
Six steps are required for taking the analyzer out of service:
1. Stopping the measurement (chapter 4.1)
2. Cleaning the STIP-scan probe (chapter 4.2)
3. Cleaning the quartz tube (chapter 4.3)
4. Quitting the STIP-scan software (chapter 4.4)
5. Switch-off the panel-PC and disconnection from power supply (chapter 4.5)
6. Disconnection of connection cable (chapter 4.6)
4.1 Stopping the measurement
• Go into menu MEASURING – STOP MEASURING and stop the measurement.
• Go into menu TEST – STEPPER and press the button “n STEPS DOWNWARDS“ to
completely empty the quartz tube.
NOTE
If you have a double-analyzer system (two STIP-scan probes connected at one panel-PC), you must
also stop the measurement of the second STIP-scan probe: Go into menu MEASURING – STOP MEAURING of the second analyzer.
If you want to decommission the second STIP-scan probe, too, empty its quartz tube by pressing the
button „n STEPS DOWNWARDS“ of menu TEST - STEPPER of the second probe.
4.2 Cleaning the STIP-scan probe
CAUTION
Always wear protective gloves, goggles, and lab coat to prevent injuries to the skin and infections from
coming into contact with waste water.
• Take the probe out of the waste water and clean dirt from the probe housing.
NOTE
For decommissioning the second STIP-scan probe, take also the second probe out of the waste water
and clean the dirt from the probe housing.
Endress+Hauser
page 4-1
DECOMMISSIONING
Panel-PC with STIP-scan
4.3 Cleaning the quartz tube
• Place the probe into a bucket of distilled water.
• Go into menu TEST – STEPPER and press the button “FLUSH 5 TIMES“ to flush the
quartz tube with distilled water.
INFORMATION
Under special circumstances it may be necessary to flush the tube with a cleaning solution to
remove adherent deposits from the quartz tube. In this case the quartz tube must be flushed
with distilled water at least five times after using the cleaning solution!
For flushing go into menu TEST – STEPPER and press buttom “FLUSH 5 TIMES“.
• After flushing press the button “n STEPS DOWNWARDS“ to move the piston completely to the bottom.
• Remove the probe from bucket of distilled water.
NOTE
For decommissioning the second STIP-scan probe, clean the quartz tube of the second probe according
to the instructions described above.
4.4 Quitting the STIP-scan software
• Quit the STIP-scan software by pressing the button “QUIT“ of the STIP-scan software
main window.
The STIP-scan program will be automatically closed.
NOTE
If you have a double-analyzer system, you must also quit the STIP-scan software of the second probe
regardless whether the second probe should be decommissioned or not.
4.5 Switch-off the panel-PC and disconnection from power supply
• From the start menu on the desktop, select „Shut Down“.
• After the software has completed the shut-down process, switch off the mains switch of
the panel-PC.
• Disconnect the panel-PC from power supply.
4.6 Disconnection of connection cable
• Open the clamp of the supporting pipe of the probe.
• Loosen the ten-pin plug connection between connection cable and probe and disconnect the connection cable form the probe.
• Disconnect the connection cable also from the seven-pin, black socket on the bottom of
the protective housing.
page 4-2
Endress+Hauser
Panel-PC with STIP-scan
DECOMMISSIONING
NOTE
For decommissioning the second STIP-scan probe, disconnect also the connection cable of the second
probe according to the instructions described above.
After disconneting the connection cable the probe is ready for storage or transport. Store the
panel-PC at autorized ambient storage temperatures.
NOTE
If you have a double-analyzer system and you want to decommission only one STIP-scan probe, you
switch-on the panel-PC after decommissioning the first STIP-scan probe. Re-start the STIP-scan software of the second probe according to chapter 3.3.1, page 3-7. Re-start the measurement of the second
probe according chapter 3.3.2.1, page 3-9.
Endress+Hauser
page 4-3
DECOMMISSIONING
page 4-4
Panel-PC with STIP-scan
Endress+Hauser
Panel-PC with STIP-scan
MAINTENANCE AND SERVICING
5 Maintenance and servicing
The STIP-scan analyzer is a low-maintenance and user-friendly analyzer. Performance checks
and simple maintenance can be carried out on-site.
An overview about necessary periodic maintenance is shown in the following chapter.
5.1 Maintenance plan
The maintenance intervals listed in the following table are minimum intervals that
Endress+Hauser Conducta GmbH&Co.KG Division STIP is recommending for standard applications. Herein a standard application is regarded as a measurement of waste water with predominant municipal parts or as installations in aeration tanks or outlet monitoring. For other
applications, especially industrial waste water, shorter maintenance intervals may be required.
Tabelle 5.1-1: Maintenance plan of STIP-scan for standard applications
maintenance task
interval of maintenance
by the user
interval of maintenance by
factory Endress+Hauser
Conducta GmbH&Co.KG
Division STIP
cleaning the quartz tube with cleaning
solution
–a)
yearly
visual check of the probe housing
monthly
yearly
visual check of the sample inlet
(cleaning if necessary)
monthly
yearly
proof pressure test of the probe
monthly
yearly
exchange of seals
(seals for piston, housing etc.)
–
yearly
replacement of exchange components
(e.g. desiccant cartridge)
–
yearly
maintenance of optical components
(repairs or exchange, if necessary)
–
yearly
check of stepper motor and guide tube
–
yearly
performance check
–
yearly
a) if necessary or recommended by Endress+Hauser Conducta GmbH&Co.KG Division STIP
Endress+Hauser
page 5-1
MAINTENANCE AND SERVICING
Panel-PC with STIP-scan
5.2 Periodical performance tests by the user
The performance of the STIP-scan probe should be checked periodically1). Endress+Hauser
Conducta GmbH&Co.KG Division STIP recommends the following on-site activities:
• Check the probe housing (e.g for corrosion) visually; clean, if necessary (chapter 4.2,
page 3-1).
• Check the sample inlet of the probe (e.g. for blockage)
visually. Remove the protective flange (fig. 5.2-1) and
check the sample inlet and clean, if necessary.
• Check the probe for leakage (menu TEST – AIR PRESSURE, see chapter 3.3.6.3, page 3-42).
• Check for warnings or error messages in the “PROTOCOL“ window (menu SHOW TRACES).
If error messages or warnings occurred, follow the
instructions described in chapter 6.3, page 6-2.
Fig. 5.2-1: Protective flange
5.3 Periodical probe maintenance by Endress+Hauser Conducta GmbH&Co.KG
Division STIP
For preventive purposes the STIP-scan probe should be yearly maintained at Endress+Hauser
Conducta GmbH&Co.KG Division STIP. With this maintenance, the STIP-scan probe is checked
for function and leaks. Additionally, seals and the desiccant cartridge are exchanged and the
quartz tube, and the optical components of the probe are serviced. Finally, a full performance test
is performed. The activities of the annual maintenance work at Endress+Hauser Conducta
GmbH&Co.KG Division STIP are listed in table 5.1-1 (“Maintenance plan of STIP-scan for standard applications)” on page 5-1.
1) A monthly check is recommended at standard application. A standard application is regarded as a
measurement of waste water with predominant municipal parts or as installations in aeration tanks
or outlet monitoring. For other applications, especially industrial waste water shorter maintenance
intervals may be required.
page 5-2
Endress+Hauser
Panel-PC with STIP-scan
TROUBLESHOOTING
6 Troubleshooting
6.1 Overview
This chapter describes the potential error and warning messages, their possible causes, and
appropriate remedial action.
For STIP-scan analyzers, there is a difference between error and warning messages.
A warning appears on a yellow background, and an error appears on a red background. Also, the
word ERROR or WARNING will appear in the title bar of the message.
title bar
Fig. 6.1-1: Warning
All error and warning signals are activated via the relay contacts. The assignment of the outputs
can be set in the SETTINGS menu (chapter 3.3.5.6, “RELAY CONTACTS submenu” (page 331)).
6.2 Definition and handling
WARNING
If certain user-specified upper or lower limits are exceeded during operation, a warning message
is issued. As the system is not significantly affected by a value being outside the limits, the
analyzer does not enter the standby mode, and operation is not interrupted in the event of a
warning.
ERROR
An error refers to malfunctions that have a significant adverse effect on the system, particularly on
the measurement. The measuring operation (operation mode) is therefore interrupted upon the
occurrence of an error. Two or more errors can never occur at the same time, as every individual
error stops operation. Consequently, only one error message will appear on the display at any
time.
An error message signifies a technical failure. The cause of the error must be removed and the
operation of the analyzer must then be restarted manually. Operation is activated through the
service menu “START MEASUREMENT submenu” on page 3-9.
Endress+Hauser
page 6-1
TROUBLESHOOTING
Panel-PC with STIP-scan
6.3 Possible warning and error messages
6.3.1 Possible warning messages
The STIP-scan can issue the following warning messages without interrupting the program:
Tab. 6.3.1-1: Possible warnings
warning message
possible causes
ABSORPTION TOO HIGH
Absorbance (average value within the
wavelength range of the evaluation) after
the settling process is > 250 m-1
NA
AIR IN MEASURING CELL
Air has entered the measuring chamber
due, for instance, to a lowering of the
water level. If the air in the measuring
chamber cannot be removed within four
filling attempts, the warning is replaced
by an error message, and operation is
interrupted.
Position the probe slightly
lower in the water so that
no air can enter the measuring cell.
(If an error is triggered,
see table 6.3.2-1 AIR IN
MEASURING CELL
NITRATE VALUE TOO HIGH
The nitrate measuring value lies at
> 23 mg/l. Above this value, the values
provided by the polynomial are not accurate enough.
NA
Sludge does not settle. No further sludge
parameters can consequently be determined.
Increase the settling time
(SETTING menu).
NO SLUDGE SETTLING
page 6-2
remedial action
Endress+Hauser
Panel-PC with STIP-scan
TROUBLESHOOTING
6.3.2 Possible error messages
The following error messages will cause the operation of the STIP-scan Analyzer to be interrupted:
Tab. 6.3.2-1: Possible error messages
display
possible causes
remedial action
AIR IN MEASURING CELL
Air has entered the measuring cell
due, for instance, to a lowering of
the water level. If the air in the
measuring cell cannot be removed
after four filling attempts, this fault
message is triggered.
Position the probe slightly lower in
the water so that no air can enter
the measuring cell.
Contact your service technician of
Endress+Hauser Conducta
GmbH&Co.KG Division STIP, if
necessary.
LEAKAGE
The leakage sensor has detected
water inside the probe.
Remove the probe from the wastewater. Check for any leakage and
remove. If necessary, contact your
service technician of
Endress+Hauser Conducta
GmbH&Co.KG Division STIP.
NETWORK FAILURE
The computer cannot communicate with the probe. The control
cable is not correctly connected to
the probe or the computer.
Check the communication interface, the RS232/RS485 converter
and the connection of the control
cable. If necessary, contact your
service technician of
Endress+Hauser Conducta
GmbH&Co.KG Division STIP.
NO COM PORT AVAILABLE
No COM interface was identified
while starting the STIP-scan software.
Check which RS232 cable is connected with the corresponding
STIP-scan probe. Then go into
menu SETTINGS – INTERFACE
and check, if the correct COM interface is chosen. Contact your service technician of Endress+Hauser
Conducta GmbH&Co.KG Division
STIP, if necessary.
NO LIGHT SIGNAL
In case of a defective lamp, highvoltage generator, or spectrometer, no measured signal may be
generated.
Contact your service technician of
Endress+Hauser Conducta
GmbH&Co.KG Division STIP.
NO VALID REFERENCE
Reference measurement with distilled water was incorrect.
Contact your service technician of
Endress+Hauser Conducta
GmbH&Co.KG Division STIP.
OUTPUTS FAILURE
The analog outputs or relay contacts are faulty.
Contact your service technician of
Endress+Hauser Conducta
GmbH&Co.KG Division STIP.
STEPPER FAILURE
The stepper motor moving the piston is defective, or faulty piston
rings.
Start the program again and contact your service technician of
Endress+Hauser Conducta
GmbH&Co.KG Division STIP.
Endress+Hauser
page 6-3
TROUBLESHOOTING
Panel-PC with STIP-scan
(This page intentionally left blank.)
page 6-4
Endress+Hauser
EC-Conformity Declaration
In sense of the Council Directive 89/336/EEC
and the Council Directive 73/23/EEC with
Council Directive 93/68/EEC
Name and address of the manufacturer:
Endress+Hauser Conducta GmbH&Co.KG
Division STIP
Online-Analyzers
Siemensstrasse 2
64823 Groß-Umstadt
Germany
Product name:
STIP-scan Analyzer
The product is conform with the council directives of
Council directive 89/336 EEC
on the harmonization of the laws of the Member States
elating to electromagnetic compatibility
The compatibility with the directive is proved that the described product comply the following
standards:
DIN EN 61326 (DIN EN 55011, class B)
DIN EN 61000-4-2, -3, -4, -5, -6, -8, -11
This explanation is NOT an assurance of characteristics as defined by the product liability rule.
The safety regulations are to be followed.
07/04/03
date
technical director
USA
Canada
Mexico
Endress+Hauser, Inc.
2350 Endress Place
Greenwood, IN 46143
Tel. 317-535-7138
Sales 888-ENDRESS
Service 800-642-8737
Fax 317-535-8498
[email protected]
www.us.endress.com
Endress+Hauser, Canada
1075 Sutton Drive
Burlington, ON L7L 5Z8
Tel. 905-681-9292
800-668-3199
Fax 905-681-9444
www.ca.endress.com
Endress+Hauser México, S.A. de C.V.
Av. Gustavo Baz No. 43
Fracc. Bosques de Echegaray
Naucalpan de Juárez, C.P. 53310, Estado
De México
Tel. (52) 55-5371-1110
Fax (52) 55-5371-1128
[email protected]
BA 420C/24/ae/01.07
© 2007 Endress+Hauser