1
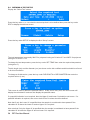
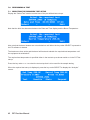
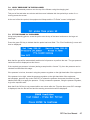
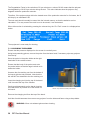
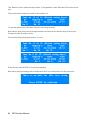
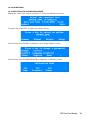
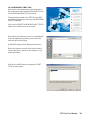
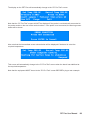
The statistics can be viewed by clicking on the STATISTICS Tab at the bottom of the screen.
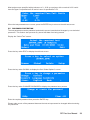
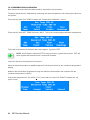
The XBAR/RANGE and/or HISTOGRAM charts can also be viewed. Note, however, that 10 or more
rows are normally required to view the XBAR/RANGE chart because this normally groups the test
results into groups of 5 rows.
Note that the XBAR/RANGE and HISTOGRAM charts can ONLY be displayed if PASS/FAIL parameters
have been defined for one or more test results.
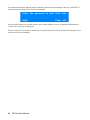
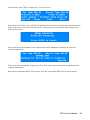
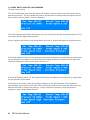
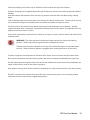
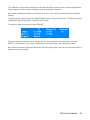
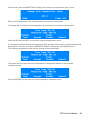
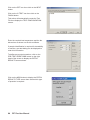
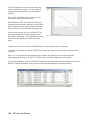
A histogram chart is shown.
This chart shows the LSL and USL values along the top of the chart and the grey blocks indicate the
data distribution. The “Bell Curve” is also displayed for information.
The Cp and Cpk values are calculated and are displayed at the left hand side of the chart.
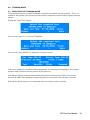
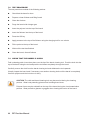
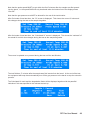
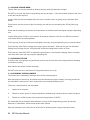
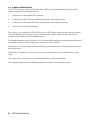
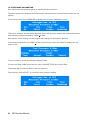
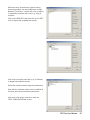
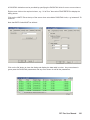
The “Default” Sub-Group size is 5 but this can be changed by selecting the Main Menu item of EDIT,
SPC SETTINGS as shown.
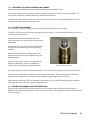
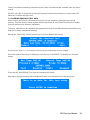
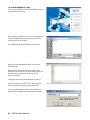
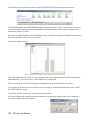
To save the test file, select FILE, SAVE from the Main Menu.
For further information regarding the many features of the program, please refer to the comprehensive on-line HELP within the software.
102 PET Plus User Manual