1
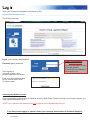
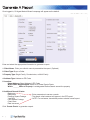
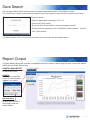
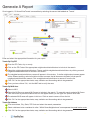
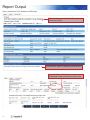
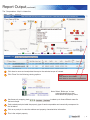
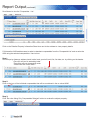
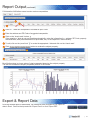
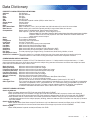
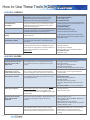
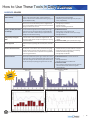
Real Estate Products USER MANUAL Get Started Log in ................................................................................................................... 1 CA Agent Market Wizard Introduction ......................................................................................................... Generate A Report .............................................................................................. Save Search ........................................................................................................ Report Output ..................................................................................................... Export Report & Data .......................................................................................... 2 3 4 4 5 CA HomePriceTrends Introduction ......................................................................................................... Generate A Report .............................................................................................. Report Output ..................................................................................................... Report Options .................................................................................................... Export Report & Data .......................................................................................... 6 7 8 8 9 CA Interactive AVM Introduction ......................................................................................................... Generate A Report .............................................................................................. Report Output ..................................................................................................... Export Report & Data .......................................................................................... 11 12 13 16 References Accessibility ......................................................................................................... 17 Data Dictionary .................................................................................................... 18 How to Use These Tools In Daily Business ......................................................... 19 V10 9.19.15 Log in Open your browser and navigate to the following URL: amw.collateralanalytics.com/____________________________________________________________________________ This is the home page: Login: your company email address Password: [temp password] Upon signing in, a prompt to enter a new, personal password will appear. Forgot Your Password Click ‘Forgot Password?’ You will be prompted to enter your email address. An email with your password will be sent to you. Enter your new password twice to confirm and write it down for future access. Intercompany Website Access: If your brokerage provides access to Collateral Analytic’s Real Estate Products through your company website, you must use the link there to log in. *NOTE: Your username and password will not function at amw.collateralanalytics.com If you have issues logging in, please contact: your company administrator for Collateral Analytics. 1 | GET STARTED Agent Market Wizard TM The CA Agent Market Wizard is a “wizard-based” tool that empowers real estate professionals to quickly and easily produce a comprehensive set of market analytic reports for buyer and seller presentations. CA Agent Market Wizard delivers: Access to MLS and Public Record based data for the most accurate surrounding market and/or neighborhood trends Charts showing historical and current market trends supported by detailed chart descriptions Ability to export, save, and print both data and reports Agent branded PDF reports for buyer and seller presentations | 2 Generate A Report Once logged in, CA Agent Market Wizard homepage will appear as the default. Enter and select the appropriate information to generate a report: 1. Client Name: Enter your client’s name to personalize the report. (Optional) 2. Client Type: Buyer or Seller 3. Property Type: Single Family, Condominium, or Multi-Family 4. Address Type: Address or ZIP Code 5. Location: Street Address: Street Address & ZIP Code Within Same Neighborhood: refers to US Postal Carrier Route Within _______ Miles of Property: is a designated Radius Search around the property 6. Additional Search Criteria: Bedrooms Bathrooms Dwelling Square Footage Year Built Land Square Footage Chart Years Data Increment - Enter parameters to narrow a search. - The search criteria entered will appear in the PDF report. - NOTE: For rural areas, less details produce a better overall report. Click ‘Create Charts’ to generate a report. 3 | Save Search The CA Agent Market Wizard will keep track of property searches through it’s ‘Save Search’ feature. This ‘Save Search’ allows a user to save a number of your client’s search criteria for quick reference in the future. To save a search > - Enter the appropriate information in No. 1-6. - Click on the ‘Save Search.’ - A pop-up ‘Save Wizard Search’ window will appear (see left). - Enter a name (for reference) in the ‘Type/Select a Saved Search...’ text box. - Click “Save Search.” To retrieve a saved search, click on the drop down menu and select the appropriate search. Report Output CA Agent Market Wizard will generate a comparable map and a series of charts using the most current local market (MLS) data and Public Record data. CREATE A NEW REPORT Click this button to start a new report. CHARTS Click on the appropriate arrows to view the charts created in the report. Revise Criteria Click on this button to return the user to the home page to edit the search criteria. | 4 Report Output (continued) Below is a sample chart of a CA Agent Market Wizard report. Hovering over the respective arrows will display details of an Up, Flat and Down Markets. These details will be available on the exported PDF report. 1 CBSA (Core Based Statistical Area) Number is the CBSA Area Identifier; it is not the ZIP Code. A CBSA is a U.S. geographic area defined by the Office of Management and Budget (OMB) based around an urban center of at least 10,000 people and adjacent areas that are socioeconomically tied to the urban center by commuting. 2 Below each CA Agent Market Wizard chart in the report is a brief description of the information provided. Export & Report Data CA Agent Market Wizard allows users to access the information through a PDF report. To download the complete report, click “Download PDF.” 5 | HomePriceTrends TM CA HomePriceTrends is a cutting edge market condition charting application that generates market reports designed to meet your valuation needs. With more than 10 years of U.S. historical property data and transaction information, CA HomePriceTrends can generate online reports in real time and provide residential property changes and analysis on several geographic levels. CA HomePriceTrends delivers: Deeper, more detailed analytics by address radius search, neighborhood, ZIP Code, city, or county Searches by transaction type: Regular, REO, Foreclosure, or a combination of types Market performance statistics summarizing local market and public record indicators Targeted information for relocation buyers, investors, and buyer-seller seminars Mapping Ability feature to visualize recent sales and listings to export, save to your computer, and print the data and report Generate A Report Once logged in, CA HomePriceTrends is accessible by selecting the second tab labeled as ‘Trends.’ 6 2 3 4 1 5 2 3 1 4 2 1 3 Enter and select the appropriate information for your report: Trends By City/ZIP 1 Enter the ZIP Code, city or county. 2 Click on the ZIP Code of the appropriate neighborhoods/subdivisions to include in the search. 3 Select the neighborhoods/subdivisions. Choose multiple neighborhoods/subdivisions by clicking on each neighborhoods/subdivisions to include in the search. 4 The neighborhoods/subdivisions names will appear in this window. If similar neighborhood names appear with a different spelling, select all similar choices to ensure that all homes are included in that specific neighborhood/subdivision search. Click a neighborhood/subdivision to remove it from the list. 5 Click ‘Go’ for the appropriate charts, map, statistics and forecasting data to be generated. 6.6 Once you have clicked ‘Go,’ visit the MAP tab to verify the area. Trends By MLS Area 1.1 Select a MLS. 2 Select the MLS area or several MLS areas to include in the search. To manually search, select a MLS area from the list and a yellow area above the box will appear where you can type in a specific MLS area. 3 The selected MLS areas will appear in this box. Click an area to remove it from the list. 4 Click ‘Go’ for the appropriate charts, map, statistics and forecasting data to be generated. Trends By Address 1.1 Enter an address, City, State, ZIP Code and select the search parameters. 2.2 Select a distance to be considered in miles. ‘Within Same Neighborhood’ encompasses the postal carrier route. 2.3 Click ‘Go’ for the appropriate charts, map, statistics and forecasting data to be generated. 3 7 | Report Output CA HomePriceTrends will generate a series of charts using the most current local market (MLS) data, Public Record, and/or Core Base Statistical Area (CBSA) level data. CHARTS Data Source Choose from: -MLS -Public Records -CBSA Level Data -Rental Data (where available) 2012 2014 Depending on which ‘Data Source’ is selected, the various chart options will populate. Choose the appropriate chart option for your desired report under: -Select Chart Group -Select Chart Type 3806 NE 14th Ave Portland OR 97212, Within the same neighborhood Report Options CA HomePriceTrends allows users to refine a search by entering specific parameters under Report Options (located on the right of the screen). Entering additional criteria is optional. The entered search criteria will appear in the PDF report. Click ‘Re-Produce Chart’ to have CA HomePriceTrends consider any additional or revised criteria and generate new report output. Click ‘Clear Criteria’ to clear any previously entered criteria. 2012 2014 | 8 Export Report & Data Once the desired report/chart is determined, CA HomePriceTrends allows users to access the information through a PDF report and data export to Excel. To download the data and charts generated in CA HomePriceTrends click ‘Export Excel’ or click ‘Export PDF.’ To download a subset of the most recent comparables click ‘Export Comps.’ Report Output (continued) CA HomePriceTrends will also generate the following: The Map tab displays the corresponding area with comparables. This is an interactive map that allows users to zoom and select the desired map type. Click on a push pin to view the comparable’s address and property characteristics information. The Statistics tab provides a report that offers a predefined set of market statistics for the selected area. GENERATE A REPORT A ‘Market Statistics’ report will generate from the initial entered city or ZIP Code. This may be changed by selecting different ‘Data Increment’ and ‘Property Type’ options within ‘Market Statistics Criteria’ and clicking ‘submit.’ EXPORT DATA This information can be exported by clicking ‘Export Excel’ or ‘Export PDF.’ 9 | Report Output (continued) The Reports tab allows users to quickly generate a custom report for selected charts using Public Record and/or MLS data. GENERATE A REPORT Select the desired report(s) under ‘Public Record Report’ and/or ‘MLS Data Report.’ Select the Property Type: -Single-Family -Condominium -Multi-Family Click ‘Produce Chart’ and CA HomePriceTrends will generate the charts below. View all the charts by scrolling down on the navigation bar. EXPORT DATA The charts can be exported by clicking ‘Export PDF.’ The Forecast tab allows the user to generate CBSA or ZIP Code level forecasts. GENERATE A REPORT The initial entered city or ZIP Code will populate the ‘Forecast Area’ but may be changed by entering city, ZIP Code, or CBSA area from the list. Select the Property Type: -Single-Family -Condominium -Multi-Family Click ‘Submit’ and CA HomePriceTrends will generate a forecast report. | 10 Interactive AVM TM The CA Interactive Automated Valuation Module (AVM) is designed for the real estate professional to take advantage of AVM technology and apply their professional knowledge of the subject property and surrounding neighborhood comparables. CA Interactive AVM delivers: 11 | Detailed subject property search and information Ability to generate current and retroactive valuations Targeted information for relocation buyers, investors, and buyer-seller seminars Customizable report output based on local market knowledge Ability to export, save to computer, and print the data and report Generate a Report Once logged in, CA Interactive AVM is accessible by selecting the the third tab labled as ‘Interactive AVM.’ MLS / Public Record PROPERTY CHARACTERISTICS Enter an address and ZIP Code then click ‘Find’ to get the subject property characteristics. The property characteristics may be removed or changed before clicking ‘Submit’ (i.e., Owner Name, Beds, Baths, Living Square Feet, Year Built, List Date, List Price, Sold Date, Sold Price). Enter the appropriate information in any of the fields above. Below are tips on a number of fields to refine the search: Data Source: Refine the search using either MLS, Public Data or both. Comparables: Select ‘Distance’ Max Distance: Select between ‘.5 - 1 mile’ (or more) depending on the location of the subject property. Use Type: Always select the appropriate ‘Use Type’ from the drop down menu. Retro Valuation Date: Enter Retro Valuation Date format MM/DD/YYYY. For current valuation, leave this field blank. Comparable: Select comparable boundary: -Neighborhood (This is the carrier route.) -Sub ZIP -Distance (Linear) -Distance with ZIP -Max Dist: Select from the available options for the desired radius search Use Subject’s List or Sold price in valuation: Checking this option allows the user to create a valuation report without using prior transactional history for the subject property. Months: The default comparable look back period is set to 12 months. To overwrite select one of the other available options. #Comps: This feature allows the user to select the desired minimum number of comparables. Select 6 months and 25 comps to get fewer and more current comparables. Type Filter: By default all sale types are used to select comparables. To create a distressed valuation check only REO, Short (Sale) and FC (Foreclosure) sale types. To create a “Regular” valuation click only the “Regular” box. Click ‘Submit’ and the CA Interactive AVM will generate a report based on the entered property characteristics. | 12 Report Output Here is a sample of a CA Interactive AVM report. Click on this icon for a Detailed Property Information Sheet. This property could be valued up to 5k higher if the kitchen was updated. Customize the report by adding comments here. Select ‘MLS’ in the Data Source box to view all Detailed Property information sheet icons. MLS 13 | Report Output (continued) The ‘Comparables - Map’ is interactive. 3 1 2 3 4 4 5 6 1 Click here to move and manipulate the map to the selected scope of interest. 2 Click ‘Road’ for the following viewing options: NOTE: Scroll here to view charts. Scroll here to view more comparables. Note: Select ‘Bird’s eye’ to view potential obstructions that could affect the property value. 3 Use these poly mapping tools the best comps. to select up to three different areas for 4 Color coded push pins label the property type of each comparable and numerically correspond to the list below. 5 Click on a push pin to view the address and property characteristics information. 6 This is the subject property. | 14 Report Output (continued) Scroll down to view the ‘Comparbles - List.’ Click on the Detailed Property Information Sheet icon next to the address to view property details. CA Interactive AVM enables users to select or deselect comparables from the ‘Comparable List’ and re-value the AVM using the selected comparables. Here is how: Step1: Sort comps by distance, address, beds, baths, land, year built, sold, list, list date, etc. by clicking on the header. -One click will sort in ascending order -Two clicks will sort descending order -Three clicks will unsort order Step 2: Click on the box of the individual comparables that will be considered in the re-valued AVM. Step 3: Click ‘Re-value Using Only Comparables Selected’ button to revalue the subject property. 15 | Report Output (continued) CA Interactive AVM allows users to enter custom comparables. 1 2 3 1 Click on ‘ + Add new comparable’ to enable all input fields. 2 Enter the address and ZIP Code of suggested comparable. 3 Click on the ‘check mark’ button If the remaining fields do not pre-populate automatically, enter the information (i.e., address, ZIP Code, property characteristics, sold price/date and/or list price/date, etc.) in the respective fields manually. 4 To edit, click on the ‘pencil tool’ to revise the appropriate fields and click on the ‘check mark.’ 5 Click button to revalue the subject property. 5 4 Scroll further down to view a series of charts generated based on the subject property. The red bar indicates the subject properties position in the market. Export & Report Data Once the desired report is determined, CA Interactive AVM will export a PDF report or data in Excel. Scroll to the top and click ‘Export Excel’ or click ‘Export PDF.’ | 16 Accessibility Below are some tips that will enable you to thoroughly access and use the Collateral Analytics Real Estate Products. Prior to logging in, please consider the following suggestions to ensure complete accessibility. CLEAR YOUR BROWSER’S CACHE Your internet browser’s cache stores certain information (snapshots) of webpages you visit on your computer or mobile device so that they’ll load more quickly upon future visits and while navigating through websites that use the same images on multiple pages so that you do not download the same image multiple times. Occasionally, however your cache can prevent you from seeing updated content, or cause functional problems when stored content conflicts with live content. You can fix many browser problems simply by clearing your cache. This link contains instructions with screenshots on how to clear the cache for all major browsers. Open your browser and navigate to the following URL: http://www.wikihow.com/Clear-Your-Browser’s-Cache Microsoft Internet Explorer Users In addition to clearing your cache often, it is suggested that you also set up the following for better accessibility: Internet Options > General > Browsing History > Settings > Temporary Internet Files> Select “Every time I visit the webpage” then click OK. MOBILE HOT SPOT USAGE Due to excessive data being generated, CA HomePriceTrends may not populate while using a mobile hotspot. DISABLE POPUP BLOCKER Popup blockers can help you keep annoying or dangerous popups from invading your computer system. However, they also block popups that you may want or need to use. In this case, it is necessary to know how to disable popup blockers. Most popup blockers are built into the browser you’re using. Each browser setting is different from one another. This link contains instructions with screenshots on how to disable popup blockers for all major browsers. Open your browser and navigate to the following URL: http://www.wikihow.com/Disable-Popup-Blockers UPDATE BROWSER Keeping your internet browser updated will allow you to take advantage of the newest browser features and also help protect your system from any recent security breaches. By default, your Internet browser will update automatically; however, you can also check for and install browser updates manually. Open your browser and navigate to the following URL: http://www.wikihow.com/Update-Your-Browser MULTIPLE SESSIONS Do not run multiple sessions of AMW with the same browser. We discovered that there is a multiple sessions issue across all internet browsing platforms (i.e., Microsoft Internet Explorer, Mozilla Firefox or Google Chrome or Apple Safari). If you access the AMW site on the same computer on two seperate windows but the same internet browser, and log in as two different users, any changes you make in one window will concurrently affect the other user. For example, if you use Firefox to log in to the AMW site, and then you open up another Firefox browser and log into AMW using a client’s credentials, whatever changes you make on either of those browsers will simultaneously affect the other. 17 | ACCESSIBILITY Data Dictionary PROPERTY CHARACTERISTICS DEFINITIONS: Address: Site Address Unit: Site Unit Number City: Site City State: Site State ZIP: Site ZIP Code APN: The assessor’s parcel number (APN) or other identifier Owner Name: Owner’s Name Loan #: Loan Number Ref#: Reference Number Retro Value Date: Date of Valuation; if this field is left blank the AVM valuation will be as of the current date Data Source: Default setting is to use Public Record and MLS comps data. Select one source Comparables: Default setting: ‘Neighborhood’ Same Postal Carrier Route Other options: ‘Sub ZIP’ ZIP Code and first two digits of Zip+4 ‘Distance Within ZIP’ Use ‘Max. Distance’ field to select linear miles radius search around subject ‘Distance’ Best to use for rural properties. Use ‘Max. Distance’ to select linear miles radius search around subject Beds: The number of bedrooms Baths: The number of bathrooms Living Area: Total living area in square feet Land Area: Lot size in square feet Year Built: The year in which the property was constructed List Date: Most recent list date as recorded in MLS List Price: Most recent list price as recorded in MLS Sold Date: Most recent sold date as recorded in Public Record or MLS Sold Price: Most recent sold price as recorded in Public Record or MLS Use Type: The site property type: Single Family, Condominium, Multi Family, Mobile, or Land Use Subject’s List or Sold Price in valuation: This option allows for a valuation without the use of the most recent list price and/or sold price Uncheck this box to value without using time adjust model within composite valuation COMPARABLES SEARCH CRITERIA: Preset default criteria based on results of ‘Find’: This feature/box is set to +/-1 bed around the subject bed room, +/-1 bath around the subject bath room, 20% above and below the subject living area and 30% above and below the subject land area Leave this box unchecked to input custom filters. Beds (min/max): Minimum and maximum bedroom range Baths (min/max): Minimum and maximum bathroom range Living Area (min/max): Minimum and maximum living area (square foot) range Land Area (min/max): Minimum and maximum land area (square foot) range List Price (min/max): Minimum and maximum list price range Sold Price (min/max): Minimum and maximum sold price range Age (yrs. min/max): Minimum and maximum age (years) range Months: Look back period in months, from the valuation date (Retro Value Date) Options are 6, 9, 12, 18, and 24 (default) months # Comps: Use this field to force a minimum number of comparables; Options are 25, 50, and 75 Sales Type Filter: This filter allows the user to select comparables by transaction type. Options are ‘Regular’ comparables ‘Short Sale’ comparables, ‘REO’ comparables and ‘FC’ Foreclosure listing comparables. By default all comparable sale types are used. To create a regular valuation select only ‘Regular’ comparables. To create a distressed valuation select ‘Short’ and/or ‘REO’ and/or ‘FC’ comparables. PROPERTY SEARCH OPTIONS: Search by Address: • Enter complete address and ZIP Code and select FIND and/or SUBMIT • Enter street name only into ‘Address’ field and ZIP Code field and select FIND; a pop-up window will display all available matches on the street name and ZIP Code; select an address from the pop-up window and click SUBMIT • Enter address and ZIP Code without unit number (Condominium & Multi-Family); a pop-up window will display all available matches/units for the subject property building; select the address and unit number from the pop-up window and click SUBMIT Search by Owner Name: • Enter Owner Name (Last Name comma First Name or only Last Name and comma) and State; click on FIND; if there are multiple matches on the same Owner Name select from the pop-up window and click SUBMIT Search by APN: • Enter APN (assessor’s parcel number) and State; click FIND DATA DICTIONARY | 18 How to Use These Tools In Daily Business REAL ESTATE PRODUCT REFERENCE GUIDE AUDIENCE: GENERAL SITUATION Get a competitive edge Increase professionalism and demonstrate knowledge Earn more Reach out to expired listings Present fast and reliable information to clients Establish credibility AUDIENCE: BUYERS SITUATION KEY MESSAGE CA tools set you apart from other agents by providing BANK GRADE, quality market analytics. CA charts demonstrate the current housing market from a different perspective than your competition. CA tools offer customized marketing statistics and analytics that establishes your trust with your clients and demonstrates your knowledge of their specific market and housing needs. CA tools empower you with real-time, real estate knowledge. Studies prove, the more knowledgeable a real estate professional, the more they earn. Use CA tools to quickly identify and export comps of a variety of statuses. CA tools quickly capture today’s market conditions and presents this information in informative charts and reports. Use CA tools to support your pricing recommendations. Show your knowledge of current overall market and “big picture” housing conditions as well as market activity for a specific area or neighborhood. KEY MESSAGE Assist buyers facing multiple offers and educate why they need to offer a higher price Low inventory drives higher prices in key markets. CA tools demonstrate current marketplace trends and show proof that homes are selling closer to or over list price. Acquire supporting information so you can write an offer on the spot Reassure home buyers on their purchase decision Use CA tools on your laptop or tablet to verify comps. Write a strong, supported offer that demonstrates the active listing prices and recent sales in their area. Use CA tools to demonstrate the current activity in the marketplace and reassure your buyers that they made the right decision. Present a strong offer below the listing price Support your buyer’s offer by educating the sellers and the sellers’ agent with a CA report that validates your price. Submit a CA Interactive AVM report showing recent sold comps and suggested price range with your offer. Use CA tools to show current market trends in the REO and Short Sale marketplace. REO properties may or may not be closing at as big of a discount as expected. Working with investment buyers who are wanting REO’s and Short Sale properties Relocation buyers Early in-depth education helps the decision process once the buyer selects an area of choice. Use CA charts to help relocation buyers choose an area that best meets their needs according their search criteria. PRODUCT/CHART NAME For all these situations, use ALL CA TOOLS: CA Agent Market Wizard Print a PDF report CA HomePriceTrends Select charts from MLS or Public Record Data Select desired charts under the “Reports” tab Run a statistics report CA Interactive AVM Review property data View automated value range Compare specific selected comps Use appropriate charts to best fit your clients needs. Share the charts on your tablet, email or printed PDF report. ALL CA TOOLS: Average Sold Price Average days on Market Charts relative to your individual situation CA HomePriceTrends Statistics report PRODUCT/CHART NAME ALL CA TOOLS: Average List Price versus Sale Price Average Sale Price Average List to Sale Price Ratio Average Days on Market Number of New Listings (which affect prices) CA Interactive AVM Look at comps, value range and historical property data CA Agent Market Wizard: Print PDF report CA HomePriceTrends New Home Average Sale Price Number of Sales Average Sold to List Price Ratio Core Base Statistical Data Forecast for their area CA Interactive AVM: Print out the PDF Report CA Interactive AVM: Print PDF report Average Sale Price Recent similar comps CA HomePriceTrends REO Average Sold price REO vs Regular Sold Price REO % Discount to Average Sold Price REO vs Regular Number of Sales REO Sales as a % Number of Sales (important if REO inventory is low) CA HomePriceTrends CBSA Household Income in areas of interest CBSA Charts for Unemployment Rates Pull reports from various areas to compare pricing page 1 of 2 19 | How to Use These Tools In Daily Business REAL ESTATE PRODUCT REFERENCE GUIDE AUDIENCE: SELLERS SITUATION Assist sellers in pricing their home correctly “Angry” sellers House is not getting any activity; no offers, low offers, no showings Sellers already determined their price by surfing the Web Support the contract price for the appraisal Let sellers know that NOW is the time to list their home Reassure sellers of their past purchase decision KEY MESSAGE Present a “macro” look at their market and then a “micro” look of the best comps, trends and days on market. Use CA tools to demonstrate what is going on in the marketplace today. Present your research by sharing CA charts to inform them on current market activity in their neighborhood. Run a current AVM to show clients what price points are selling and which ones are not. Recommend a price reduction by sharing the number of current active listings within their specific price range. Show the current pending properties in Agent Market Wizard. Use charts to discuss the price points that are selling and ones that are sitting. Help sellers set realistic expectations by showing them real-time data in their market and neighborhood. Use CA tools to pick precise comps and support your pricing recommendation. Give a CA Interactive AVM report to the appraiser with detailed comps supporting the contract price; close the sale. Use CA tools to demonstrate what is going on in the marketplace. Show sellers when prices are selling high as well as when inventory and average days on market are low. Use all CA tools to prepare for and supplement your listing presentation. In a down market, homes may be selling for less than what buyers paid several years ago. Use CA retro value tools to show an overall snapshot of what homes in their area were selling for at the time they purchased. Share market trends by comparing pricing from then to now. PRODUCT/CHART NAME ALL CA TOOLS: Average Sold to List Price Ratio New Listing and Sold Average Price per Square Foot (if applicable) ALL CA TOOLS: Average days on Market Number of Sales Regular and Average Sold Price CA Agent Market Wizard: Print PDF report CA HomePriceTrends: Select charts under ‘Reports’ tab Average Days on Market in their price range Average Sale Price CA Agent Market Wizard: Print PDF report Charts offer real-time snapshot of their current market CA Interactive AVM : give a specific value range CA Interactive AVM: Print PDF Report ALL CA TOOLS: Number of Sales per Recent Month or Quarter Seasonality Charts (reflecting low inventory) Number of New Listings (if low) Average Days on Market CA Agent Market Wizard: Set purchase dates CA HomePriceTrends: Set dates at time of purchase Average Sales Price Average List Price versus Sale Price CA Interactive AVM Fill in the Retro Value Report field to show the home values and sold homes during their purchased time All information provided by the listing agent/broker, is presumed reliable but is not guaranteed, and should be independently verified. The information provided in this report is provided for personal use only and may not be copied or distributed. page 2 of 2 | 20