1
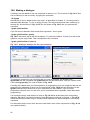
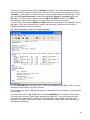
see Chapter 11, was one potential failing. This was resolved by an ado file provided by two
users, who also responded immediately to queries about possible further features.
20.2 Improvements in versions 8 and 9
Two main developments from Version 7 to Versions 8 and 9 were the new graphics, and the
system of using menus and dialogues. The graphics are very impressive; see Chapters 6 and 8.
The production of the graphs lacks the interactivity that other software provides. But for the
graphs from large surveys this is outweighed by the value of having the command files
associated with the finished graphs. Hence they can be reproduced or the scheme changed
with ease.
Many graphics packages provide a very wide range of pseudo-three dimensional graphs and
this is thankfully absent from the Stata system. Instead there is a comprehensive guide and
system for the types of graphs that are needed. The facilities include combining multiple graphs
on a single frame.
Our views on the menus and dialogues are more mixed. Initially they are not as intuitive as
some other packages. Each menu corresponds to a Stata command, so when there is a mix of
overlapping commands for a given task, then there is now a similar mix of overlapping menus
and dialogues. The help on the menus is comprehensive, but also rudimentary. It merely
provides the help on the associated command.
The limitations of the current menus were not a particularly serious problem for us. The analysis
of large surveys requires users to understand something about the commands, for the reasons
given in Chapters 2 and 5. If the menus are viewed as a simple way that users can start their
analyses, then they do provide this gentle route. They also generate usable commands and so
help in the production of the do files described in Chapter 5 etc.
Once we became more used to Stata’s menu system the consistency of the structure of the
dialogues is excellent. Then the ease with which users can add their own dialogues and menus,
as described in Chapters 17 and 18, is particularly impressive.
Version 8 also added ODBC as a way of importing data. Stata is limited in reading directly from
other software, and is the only standard statistics package that we use, that cannot read
spreadsheet files directly. Getting the Stat-transfer program can solve this, as described in
Chapter 3. However, a powerful ODBC facility is useful for survey data processing. The lack of
a menu system for the ODBC is a disappointment. However, Version 9 added XML menus for
data import and export, which may solve the data transfer problems.
20.3 General points
If you use a spreadsheet for data processing, then you keep everything in a single workbook.
With Stata you will have many files, each with a simple structure. Even just the data will be in a
range of different files, see for example Chapter 12, where each use of the contract, or
collapse commands produces another file, with summary values. Graphs are in individual files,
as are the do files. So you probably need to use a different directory for each survey. Some
statistical software allows all files associated with a project to be collected together, but this
feature is absent in Stata.
Windows users will initially find that some standard features are absent from Stata. For example
there is no button or option to undo the past few commands, at least not on the main menu.
Set against this is a considerable “comfort factor” for those organisations who wonder if they
might later move from Windows to Unix, or perhaps be provided with some Macintosh
computers. Stata is used in the same way on these systems.
98