1
REFRACTIVE POWER/CORNEAL ANALYZER
Model
ARK-10000
OPERATOR’S MANUAL
US Edition
NIDEK CO., LTD.
(Manufacturer)
: 34-14, Maehama, Hiroishi-cho, Gamagori, Aichi 443-0038, Japan
Telephone: 81-533-67-6611
Facsimile: 81-533-67-6610
NIDEK CO., LTD
: 3F Sumitomo Fudosan Hongo Bldg., 3-22-5, Hongo,
(Tokyo Office)
Bunkyo-Ku, Tokyo 113-0033, Japan
Telephone: 81-3-5844-2641
Facsimile: 81-3-5844-2642
NIDEK INCORPORATED
: 47651 Westinghouse Drive, Fremont, California 94539, U. S. A.
(United States Agent)
Telephone: 1-510-226-5700
Facsimile: 1-510-226-5750
NIDEK SOCIETE ANONYME
: Europarc 13, rue Auguste Perret, 94042 CRETEIL, France
(EU Authorized Representative) Telephone: 33-1-49 80 97 97
Facsimile: 33-1-49 80 32 08
March 2009
32164-P912J
Printed in JAPAN
BEFORE USE OR MAINTENANCE, READ THIS MANUAL.
This Operator’s Manual contains information necessary for operating the NIDEK
Refractive Power/Corneal Analyzer ARK-10000 (Pet name: OPD-Scan).
This manual includes operating procedures, safety precautions, and specifications.
The device complies with ISO 10342 (Ophthalmic instruments-Eye Refractometers).
IEC 60601-1 is applied in this manual. The dioptric powers are indicated with reference
wavelength λd = 587.56 nm.
For correct use, this manual is needed. Especially, cautions for safety and operating
procedures must be thoroughly understood before using the instrument.
Keep this manual handy to verify use whenever necessary.
If you encounter any problems or have questions about the instrument during use, please
contact your authorized distributor.
Table of Contents
§1 INTRODUCTION .......................................................................................................Page
1-1
1.1 Outline of the Instrument ............................................................................................. 1-1
1.2 Indications for Use ..................................................................................................... 1-1
1.3 Classifications ............................................................................................................. 1-2
1.4 Symbol Information .................................................................................................... 1-3
§2 SAFETY ........................................................................................................................ 2-1
2.1 Storage, Transportation and Installation ................................................................... 2-1
2.2 Plugging the Instrument In and Handling the Power Cord ............................................. 2-3
2.3 In Use ........................................................................................................................ 2-3
2.4 Maintenance ............................................................................................................... 2-8
2.5 Disposal ..................................................................................................................... 2-9
2.6 Labels ...................................................................................................................... 2-10
§3 CONFIGURATION ..................................................................................................... 3-1
§4 BASIC USAGE ............................................................................................................. 4-1
4.1 Operation Flow ......................................................................................................... 4-1
4.2 Power-ON and Power-OFF ...................................................................................... 4-3
4.2.1 Power-ON ....................................................................................................... 4-3
4.2.2 Reactivating the instrument from the power saving mode .............................. 4-4
4.2.3 Power-OFF ...................................................................................................... 4-5
4.3 Selecting the Measurement Mode ............................................................................ 4-6
4.4 Measuring in the ARK Mode ................................................................................... 4-7
4.4.1 AR and KM measurements ............................................................................. 4-7
4.4.2 AR measurement ........................................................................................... 4-13
4.4.3 KM measurement .......................................................................................... 4-16
4.5 Measuring in the ARK/CT Mode ........................................................................... 4-18
4.5.1 REF and CT measurements ........................................................................... 4-18
4.5.2 REF measurement ........................................................................................... 4-28
4.5.3 CT measurement ............................................................................................. 4-31
4.5.4 Measurement using mydriatic agent
(during REF and CT measurements or REF measurement) ............................... 4-34
4.6 Viewing Maps (Map View)....................................................................................... 4-35
4.6.1 Displaying a map via the measurement screen ................................................... 4-35
4.6.2 Retrieving an exam from the database and displaying it in a map ....................... 4-36
4.6.3 Displaying a map on another map set ............................................................... 4-38
4.6.4 Switching between the right eye and left eye ..................................................... 4-39
Page
4.7 Printing ..................................................................................................................... 4-40
4.7.1 Printing measured data .................................................................................... 4-40
4.7.2 Printing color maps .......................................................................................... 4-42
4.8 Saving Measured Data ............................................................................................. 4-43
§5 HANDLING ADVANCED FUNCTIONS MORE EFFICIENTLY ......................... 5-1
5.1 Color Maps ............................................................................................................... 5-2
5.1.1 Axial map ........................................................................................................ 5-2
5.1.2 Instantaneous map ........................................................................................... 5-3
5.1.3 “Refractive” map ............................................................................................. 5-4
5.1.4 Elevation map ................................................................................................. 5-5
5.1.5 Eye image ........................................................................................................ 5-9
5.1.6 OPD map ....................................................................................................... 5-10
5.1.7 Target “Refractive” map ................................................................................ 5-11
5.1.8 Internal OPD map ......................................................................................... 5-12
5.1.9 Wavefront High Order map ........................................................................... 5-14
5.1.10 Wavefront Total map ................................................................................... 5-15
5.1.11 Wavefront Group map ................................................................................. 5-16
5.1.12 Zernike graph .............................................................................................. 5-19
5.1.12.1 RMS graph ...................................................................................... 5-19
5.1.12.2 Coefficient graph ............................................................................. 5-22
5.1.13 Difference map ............................................................................................ 5-24
5.1.14 Table at the bottom of the Map View screen ............................................... 5-24
5.2 Specifying Maps in Advance (Map View settings) ................................................ 5-25
5.2.1 Setting “View 1”, “View 2” and “View 3” .................................................... 5-25
5.2.1.1 Assigning an entered map set to “View1”, “View2” and “View3” ... 5-26
5.2.1.2 Entering a new map set ..................................................................... 5-28
5.2.1.3 Modifying an already-entered map set .............................................. 5-31
5.2.1.4 Entering modifications made on the Map View Settings screen
to a map set ........................................................................................ 5-32
5.2.1.5 When selecting the Wavefront Group map ....................................... 5-33
5.2.1.6 When selecting the Zernike graph and displaying the RMS graph ... 5-37
5.2.1.7 When selecting the Zernike graph and displaying
the Coefficient graph ......................................................................... 5-41
5.2.1.8 When selecting the Difference map .................................................. 5-47
5.2.1.9 Deleting a map set ............................................................................. 5-48
5.2.2 Setting a color scale ...................................................................................... 5-49
5.2.3 Displaying PSF .............................................................................................. 5-52
5.2.4 Other settings related to maps ....................................................................... 5-53
Page
5.3 Changing Displayed Maps (Map View) ..................................................................... 5-56
5.3.1 Changing map types and overlay options ................................................. 5-57
5.3.2 Changing the color scale (Select Color Scale) ......................................... 5-61
5.3.3 Changing an exam displayed on a map to another exam No. .................... 5-63
5.3.4 Zooming in on a map .............................................................................. 5-64
5.3.5 Checking the distance between two points .............................................. 5-64
5.4 Displaying the Difference Map .................................................................................. 5-65
5.5 Manual Pupillary Distance (PD) Measurement ........................................................... 5-66
5.6 Database .................................................................................................................. 5-67
5.6.1 Importing external data into the database (Import) ............................................ 5-67
5.6.2 Outputting an exam from the database (Export) ................................................ 5-70
5.6.3 Editing data ..................................................................................................... 5-75
5.6.3.1 Editing patient data (Edit Patient Information) ....................................... 5-75
5.6.3.2 Editing exam data (Edit Exam Information) ........................................... 5-76
5.6.3.3 Deleting data (Delete) .......................................................................... 5-76
5.6.4 Backing up or rebuilding the database .............................................................. 5-78
5.6.4.1 Backing up the database (Database Backup) ...................................... 5-78
5.6.4.2 Rebuilding the database (Rebuild Database) ......................................... 5-80
5.6.4.3 Setting a target location for backup data, imported data or
exported data (Select Database Directory) ....................................... 5-82
5.6.4.4 Setting data deletion criteria (Backup Settings) ................................ 5-84
5.7 Outputting Map Data .............................................................................................. 5-85
5.7.1 Outputting numerical data from a map (Save Map Information) ................. 5-85
5.7.2 Outputting map images (Save Map Image) ................................................... 5-87
5.8 Editing Detected Edges (Tools) .............................................................................. 5-88
5.8.1 Entering edge edit mode ................................................................................ 5-88
5.8.2 Adjusting a curved edge (Move) ................................................................... 5-89
5.8.3 Moving an end point (Extend) ...................................................................... 5-90
5.8.4 Closing a gap (Close) .................................................................................... 5-91
5.8.5 Erasing edges (Erase) .................................................................................... 5-92
5.9 Settings ................................................................................................................... 5-93
5.9.1 Setting parameters (Settings) ........................................................................ 5-93
5.9.2 Setting date and time ..................................................................................... 5-100
5.9.3 Selecting whether or not to assign a patient ID automatically ........................... 5-101
5.10 Formatting a Floppy Disk ..................................................................................... 5-103
5.11 Transmitting ZS, ZC and ZA Data to an Auto Optometry System ........................... 5-105
§6 TROUBLESHOOTING GUIDE ................................................................................ 6-1
§7 MAINTENANCE ..........................................................................................................Page
7-1
7.1 Replacing the Roll of Printer Paper .............................................................................. 7-1
7.2 Attaching a Stack of Chin Rest Paper .......................................................................... 7-3
7.3 Replacing Fuses ......................................................................................................... 7-4
7.4 Checking Measurement Accuracy ............................................................................... 7-5
7.5 CT Measurement Calibration ...................................................................................... 7-6
7.6 Cleaning Exterior ........................................................................................................ 7-7
7.7 Cleaning the Measurement Window ............................................................................ 7-8
7.8 List of Parts for Replacement ...................................................................................... 7-8
§8 DISINFECTING PROCEDURES .............................................................................. 8-1
§9 SPECIFICATIONS ...................................................................................................... 9-1
§10 ACCESSORIES.......................................................................................................... 10-1
10.1 Standard Accessories ............................................................................................ 10-1
10.2 Optional Accessories ............................................................................................ 10-1
APPENDIX. A GLOSSARY ................................................................................................ A-1
APPENDIX. B INSTALLATION ........................................................................................ B-1
APPENDIX. C OBTAINING RELIABLE EXAM DATA ................................................ C-1
APPENDIX. D BEFORE FIRST BACKUP PROCEDURES ............................................. D-1
APPENDIX. E POINTS TO NOTE WHEN UTILIZING INTERNAL OPD MAP .......... E-1
APPENDIX. F EMC (ELECTROMAGNETIC COMPATIBILITY) .................................. F-1
§1
INTRODUCTION
1.1 Outline of the Instrument
The ARK-10000 measures the refractive condition and analyzes corneal shape of the patient’s eye.
The refractive condition is measured by weak infrared rays, and corneal shape is analyzed based on
projected placido rings onto the cornea.
The ARK-10000 has two measurement modes: ARK mode and ARK/CT mode.
In the ARK mode, AR- and KM-measured data are obtained and printed out.
AR-measured data: Refractive power in the central area of the eye that is equal to the data
obtained by an auto refractometer.
KM-measured data: Keratometry data simulated by the analyzed result of a captured placido
ring image.
In the ARK/CT mode, the curvature radius and refractive power of the whole eyeball are measured
and the measured data is displayed in color maps. The obtained examination data is stored in the
built-in database for future display of it in color maps.
The ARK-10000 has a main body and a measuring unit integrated on one base. On the base is a
chin rest on the patient’s side and a floppy disk drive on the operator’s side which is used to store
measured results and the maps of corneal shape. On the main body is a joystick and a printer*1
which prints measured results. On the patient’s side of the measuring unit are placido rings, and
a display on the operator’s side. The touch-screen panel not only displays a patient’s eye and
measured data, but allows the operator to control the instrument through the panel.
1.2 Indications for Use
The OPD-Scan™ is a diagnostic instrument that is indicated for use:
• In the automated measurement and analysis of refractive errors of the eye including hyperopia and
myopia from –20.0 to +22.0 diopters spherical, and astigmatism from 0.0 to ±12.0 diopters cylindrical.
• In the measurement and evaluation of the corneal curvature of the eye.
WARNING:The safety and effectiveness of using the data from the OPD-Scan (Model Number
ARK-10000) has not been established for determining treatments involving higher
order aberrations of the eye such as coma and spherical aberrations.
CAUTION: Federal law restricts this device to sale by or on the order of a licensed practitioner.
*1 The built-in printer prints out AR-measured data etc. To print a map of corneal shape, an
optional color printer is needed.
1-2
1.3 Classifications
[Classification under the provision of 93/42/EEC (MDD)] Class
The ARK-10000 is classified as a Class a instrument.
a
[Form of protection against electrical shock] Class
The ARK-10000 is classified as a Class instrument. A Class instrument is an instrument
in which protection against electric shock does not rely solely on basic insulation. The Class
instrument includes additional safety precautions that provide for the connection of accessible
conductive parts to a protective (earth) grounding conductor in the fixed wiring of the
installation.
Use a power outlet which is equipped with a ground terminal.
[Degree of protection against electrical shock] Type B
The ARK-10000 is classified as a Type B instrument.
A Type B instrument provides an adequate degree of protection against electrical shock,
particularly regarding the following:
- allowable leakage currents
- reliability of the protective earth ground connection (if applicable)
[Degree of protection provided by enclosures] IP20*2
The ARK-10000 is classified as an IP20 instrument*2 , as such does not provide protection
with respect to harmful effects due to the ingress of water although it is protected against
access to hazardous parts with a solid matter such as a finger of 12.5mm in diameter. Avoid
immersion of any type.
[Degree of protection against flammability]
The ARK-10000 is classified as an instrument not suitable to be used in a potentially flammable
environment.
Do not operate the instrument near flammable type materials.
[Method(s) of sterilization or disinfection recommended by the manufacturer]
The forehead rest and chin rest can be cleaned with a cloth dampened with disinfecting alcohol
as necessary.
[Mode of operation]
Continuous operation
*2 In accordance with IEC 60529
1-3
1.4 Symbol Information
This symbol on the instrument indicates that caution must be taken, and it is necessary
to refer to a related description in the Operator’s Manual before operating parts with
this symbol.
This indicates that the instrument is classified as a type B instrument.
This symbol indicates the state of the power switch. If the symbol side of the switch is
flipped down, power is supplied to the instrument.
This symbol indicates the state of the power switch. If the symbol side of the switch is
pressed down, power is not supplied to the instrument.
This symbol indicates the fuse rating.
This symbol indicates that the instrument must be supplied only with alternating current.
This symbol indicates that printer paper can be torn by pulling it toward the arrow.
This symbol indicates the keyboard connector.
This symbol indicates the mouse connector.
This symbol indicates the network connector.
This symbol indicates the connector for data communication.
This symbol indicates the printer (option) connector.
This symbol indicates the connector for an external monitor etc.
This symbol indicates the connector for a USB device.
§2
SAFETY
In this manual, the signal, CAUTION is used to designate and indicate a degree or level
of safety hazards or damages. The definition is as follows.
CAUTION:
Indicates a potentially hazardous situation which, if not avoided,
may result in minor or moderate injury or a property damage
accident.
Even cases when
CAUTION is given may result in serious injury under certain
conditions. Be sure to observe the instructions for
CAUTION.
2.1 Storage, Transportation and Installation
CAUTION
• Never store the instrument in a place where water may splash or poisonous gas or liquid is
present.
• Never store the instrument in a place exposed to dust, direct sunlight, or hot and humid
surroundings.
• Never pull the power cord to move the instrument.
An injury or a failure of the instrument may result.
• To carry the instrument to another location, its base should be held from both sides by two
persons. (Never hold the forehead rest, main body, or measuring unit.)
If the instrument is carried only by one person, or a part other than the base is held, an
injury or a failure of the instrument may result.
• To transport the instrument, store it in the attached shipping carton without locking the
measuring unit to the base.
A breakdown of the instrument may result.
• Store the instrument in a place where it can not be splashed with water.
Exposure to water may result in an electric shock or a failure of the instrument.
• Install the instrument on a stable and level place which is not subjected to vibration or
shock.
Incorrect measurement or a failure of the instrument may result. An injury from the
instrument being knocked over by a shock may also result.
• Keep the touch-screen panel away from direct sunlight or excessive ultraviolet rays.
They will damage the touch-screen panel.
2-2
CAUTION
• Install the instrument under the following conditions:
Dust-free environment
Disturbance-light-free environment
Vibration-free and shock-free environment
• Install and use the instrument in a place where the temperature and humidity are maintained
to the following:
Use conditions:
Temperature:
10 to 35 ºC
Humidity:
30 to 75% (Non-condensing)
• The instrument has been tested and found to comply with the limits for medical devices
to the IEC 60601-1-2: 2001 and Medical Device Directive 93/42/EEC. These limits are
designed to provide reasonable protection against harmful interference in a typical medical
installation. This instrument generates, uses and can radiate radio frequency energy and,
if not installed and used in accordance with the instructions, may cause harmful interference
to other devices in the vicinity. However, there is no guarantee that interference will not
occur in a particular installation. If this instrument does cause harmful interference to
other devices, which can be determined by turning the instrument off and on, the user is
encouraged to try to correct the interference by one or more of the following measures:
- Reorient or relocate the receiving device.
- Increase the separation between the instruments.
- Connect the instrument to an outlet on a circuit different from that to which the other
device(s) are connected.
- Consult the manufacturer or field service technician for help.
• During installation and operation of the device, observe the following instructions about EMC
(electromagneticcompatibility):
- Do not use the device simultaneously with other electronic equipment to avoid electromagnetic
interference with the operation of the device.
- Do not use the device near, on, or under other electronic equipment to avoid electromagnetic
interference with the operation of the device.
- Do not use the device in the same room as other equipment such as life-support equipment,
equipment that has major effects on the life of the patient and results of treatment, or
measurement or treatment equipment that involves small electric current.
- Do not use the device simultaneously with portable and mobile radio frequency communication
systems because it may have an adverse effect on operation of the device.
• The International Electrotechnical Commission sets the essential requirements for electrical and
electronic equipment that may disturb, or be disturbed by, other equipment. TheARK-10000 complies
with these requirements as tabled in F. EMC(Electromagnetic Compatibility) (page F-1). Follow the
guidance in the tablesfor use of the device in an electromagnetic environment.
2-3
2.2 Plugging the Instrument In and Handling the Power
Cord
CAUTION
• Use outlets which meet the specified power requirements.
If voltage is too high or low, the instrument may not deliver full performance, or a failure or a
fire may result.
• Do not overload one electrical outlet.
A fire may result.
• Be sure to use a (HOSPITAL GRADE) wall outlet equipped with a grounding terminal in order
to avoid an electric shock or a fire in the event of a power leak.• Insert the mains plug into an
outlet as far as the pins of the plug go.
Imperfect connection may result in a fire.
• If the instrument will not be used for a long period, disconnect the mains plug from the outlet.
A fire may result.
• Be sure to hold a plug instead of holding its cord when disconnecting the plug from an outlet.
A break in the metal core inside the cord may cause a short circuit or an electric shock.
• Do not crush with heavy objects nor squeeze the power cord.
The damaged power cord may cause an electric shock or a fire.
• If the internal wires of the power cord are exposed, power to the instrument is turned ON
or OFF when the power cord is moved, or the cord or the plug gets extremely hot, the
power cord itself is damaged. Immediately discontinue use of the power cord, and replace
it with a new one.
Otherwise, the power cord may cause an electric shock, or a fire.
• Clean between the prongs of the mains plug using a dry cloth every once in a while.
If dust settles thickly on them, it is likely to attract moisture, and may cause a short
circuit, or a fire.
2.3 In Use
CAUTION
• Do not allow the patient to touch the placido ring unit on the patient’s side inadvertently.
Because the placido ring unit moves up, down, to the left, or to right during automatic alignment,
do not insert fingers under the unit. Fingers may be pinched in a space between the bottom of
the placido ring unit and rear panel of the main body and injured.
2-4
CAUTION
• Wipe the forehead rest and chin rest before every measurement with a cloth dampened with disinfecting
alcohol. Remove a sheet of chin rest paper if a pad of the paper is mounted on the chin rest.
• Never smear the measuring window with fingerprints, dust, etc.
The smeared window will result in extremely lower measurement accuracy.
• Never use the instrument for other than its intended use.
NIDEK assumes no responsible for any accidents or failures caused by the neglect of
this instruction.
• The measured values of objective refractive power obtained by the ARK-10000 are intended
to be used as a reference of lens prescription for the correction of visual acuity with
spectacle or contact lenses. Manifest refraction must be used as the basis for spectacle or
contact lens prescription.
• Never eject a floppy disk while the lamp of the floppy disk drive is being illuminated.
Damage to the floppy disk or disk drive may result.
• When turning OFF the instrument, be sure to follow the instructions in “4.2.3 PowerOFF” instead of turning OFF the power switch.
Turning OFF the power switch before Windows is shut down may result in a loss of
data or a malfunction.
• While the pointer ( ) is changed into the hourglass ( ), do not perform any operation
through the touch-screen panel.
A malfunction may result or the system may lock up.
• Since the ARK-10000 runs on Windows OS of Microsoft Corporation, follow general
precautions in using Windows.
For example, before shutting the computer OFF, make sure that Windows is shut down.
• Operators are responsible for managing their data.
NIDEK assumes no responsibility for a loss of data.
• Be sure to back up measured data on storage disks such as a ZIP disk or DVD-RAM.
In case of the corruption of the built-in hard disk, saved data will never be usable again.
In addition, storage disks such as CD-R, CD-RW, DVD-R which need writing software
are improper for data backup.
• Do not touch the touch-screen panel with anything other than fingers or the tip of a touchscreen pen.
Contact of a hard or sharp object such as a ball point pen with the panel may scratch the
panel. In addition, although the tip of a touch-screen pen is covered with resin which is
unlikely to scratch the panel, the panel may be scratched by strongly pressing the pen
against the panel.
2-5
CAUTION
• Never press two or more points on the touch-screen panel at the same time.
A malfunction may result.
• In case of an instrument failure, disconnect the power cord from the outlet, and contact your
authorized distributor without touching the internal structure of the instrument.
• Do not install Windows application software other than the ARK-10000 software.
The installation of any other Windows application software may lead to abnormal operation
of the ARK-10000 and loss of stored data. In addition, the warranty may not cover your
ARK-10000 if Windows application software other than the ARK-10000 software is installed.
• Turn off the power and put a dust cover over the instrument while it is not in use.
Accumulated dust, dirt, etc. may adversely affect measurement accuracy.
• Never disassemble nor touch the internal structure of the instrument.
An electric shock, or a failure of the instrument may result.
• Information on the avoidance of overexposure to potentially hazardous optical radiation
(ISO 15004: 1997)
Spectrally weighted photochemical radiances LB and LA give a measure of the potential
that exists for a beam of light to cause photochemical hazard to the retina. LB gives the
measure for eyes in which the crystalline lens is in place. LA gives this measure either
for eyes in which the crystalline lens has been removed (aphakes) and has not been
replaced by a UV-blocking lens or for the eyes of very young children.
The value stated for this ophthalmic instrument gives a measure of hazard potential
when the instrument is operated at maximum intensity and maximum aperture. The
values of LA or LB for the ARK-10000 are sufficiently low as shown on the following
page.
The retinal exposure dose for a photochemical hazard is a product of the radiance and
the exposure time. For instance, at a radiance level of 8 mW/(cm2•sr), 30 min irradiation
of the dilated (8 mm diameter) pupil would cause the retinal exposure dose level to
attain the recommended exposure limit. If the value of radiance were reduced to 0.8
mW/(cm 2•sr), ten times that time (i.e. 300 min) would be needed to reach the
recommended limit. The recommended exposure dose is based on calculations arising
from the American Conference of Governmental Industrial Hygienists (ACGIH) Threshold Limit Values for Chemical Substances and Physical Agents (1995 - 1996
edition).
The following page shows the graph of spectrum output for the ARK-10000. Patients
will be at low risk of acute optical radiation with the ARK-10000. However, it is
recommended that the intensity of light directed into the patient’s eye be limited to the
minimum level which is necessary for diagnosis. The total of the retinal exposure dose
must be carefully watched for infants, aphakes and persons with diseased eyes who are at
greater risk when other ophthalmic instruments with a high level of radiance are used in
conjunction.
2-6
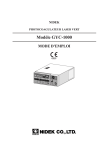
CAUTION
Spectrum output of all light source during AR measurement (maximum light intensity)
RK-3の光放射エネルギー/AR測定時
装置:S/N 258
ARK-10000:
10
放射照度:(μW/c㎡/nm)
Irradiance:
9
8
7
6
5
4
3
2
1
0
300
400
500
600
700
波長:(nm)
Wavelength:
800
900
1000
Spectrum irradiance
*3 LA (µW/cm2/sr) 305 - 700 nm
*4 LB (µW/cm2/sr) 380 - 700 nm
8.017
0.459
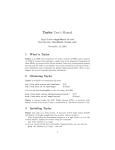
Spectrum output of all light source during CT measurement (maximum light intensity)
RK-3の光放射エネルギー/Placido測定時
装置:S/N 258
ARK-10000:
10
放射照度:(μW/c㎡/nm)
Irradiance:
9
8
7
6
5
4
3
2
1
0
300
400
500
600
700
800
900
波長:(nm)
Wavelength:
Spectrum irradiance
*3 LA (µW/cm2/sr) 305 - 700 nm
*4 LB (µW/cm2/sr) 380 - 700 nm
*3
*4
0.012
0.002
LA: Spectrally weighted photochemical aphakic source radiance
LB: Spectrally weighted photochemical phakic source radiance
1000
2-7
{ Patient environment
The patient environment represents a space where there is a possibility of direct contact between
the patient or the operator and third person.
When another type of device is used in the patient environment, use a device that complies
with IEC 60601-1. If the devices that do not comply with IEC 60601-1 are used, it is necessary
to use an isolating transformer to power the device or to connect the devices to additional
protective grounding.
Radius of 1.5 m
2.5 m
1.5 m
1.5 m
2-8
2.4 Maintenance
CAUTION
• Before the replacement of fuses, turn OFF the power and disconnect the power cord from
the outlet.
An electric shock may result.
• Use only the specified fuses for replacement.
Fuses other than the specified ones may cause a fire.
• Pay attention not to change the numbers in the voltage indication window while replacing
fuses.
Accidental changing of improper voltage may result in a failure or a fire.
• Repair or disassembling outside NIDEK or your authorized distributor is forbidden.
• Never use organic solvents such as a thinner, or detergents with abrasives to clean the
covers, touch-screen panel, and placido rings.
The covers or touch-screen panel may be corroded or scratched. Especially, cleaning
of the placido rings with organic solvents or detergents with abrasives will disturb
concentric ring shapes, which may lower measurement accuracy.
• If the touch-screen panel is getting dirty, immerse a soft cloth or gauze in water, wring it
well, and wipe the panel.
• Blow the dust off the placido rings with a blower.
Careless wiping may disturb concentric ring shapes, and may lower measurement
accuracy.
NOTE
• There may be a few “missing” or “dead” pixels in your touch-screen panel, which appear
as black dots on an all-white background or there may be “lit” pixels, which appear as
ones or several randomly-placed red, blue and/or green pixel elements on an all-black
background.
This does not represent a failure of the touch-screen panel; This is due to the structure
of the liquid crystal display.
2-9
2.5 Disposal
NOTE
• Follow local governing ordinances and recycling plans regarding disposal or recycling of
device components.
The instrument uses a lithium battery mounted on a board inside. Follow your local
governing ordinances in disposing of the lithium battery since the disposal method
differs according to the local government.
• When disposing of packing materials, sort them by material and follow local governing
ordinances and recycling plans.
2 - 10
2.6 Labels
[Right side view]
2 - 11
[Patient’s side view]
[Left side view]
§3
CONFIGURATION
Touch-screen panel
Start button
Joystick
Locking knob
Floppy disk drive
Operator’s side
Touch-screen panel
Displays various kinds of operation screens,
exam data, and maps.
Touching the displayed buttons allows
operation of the instrument.
Floppy disk drive
Used to store map images or numerical data
obtained from measurements on a floppy disk.
Use a MS-DOS-formatted 2HD 3.5-inch
floppy disk.
Start button
Used to start the measurement.
Printer
The built-in printer is used to print out the
AR- and KM-measured data (equivalent to
the measured values by Auto Ref/Keratometer).
Joystick
Used to move the main body to the right, left,
back and forth. By turning the top of this lever, the main body can be moved up and
down.
Locking knob
Used to fix the main body to the base unit.
To lock the main body, bring the main body
to the center of the base unit, and turn the
knob counterclockwise while holding it
down. To temporarily lock the body at any
position, turn the knob clockwise.
Do not lock the main body with this locking knob during transport because a breakdown of the instrument may result.
VGA connector
Used to connect an external monitor or video
printer.
USB connector
This connector is for connecting an USB device. Used to connect an external storage
device.
Printer connector
Used to connect an optional color printer.
3-2
Printer
PD window
VGA connector
Power switch
USB connector
Fuse
USB connector
Printer connector
COM connector
AC inlet
Ethernet connector
Right side view
Mouse connector
Keyboard connector
COM connector
Used to connect an interface cable when transmitting data to the refractor, NIDEK RT-2100,
or an external computer.
Ethernet connector
Used to connect the instrument to Ethernet.
To do this, it is necessary to set Windows.
Mouse connector
Used to connect a mouse.
Connectable mouse type: PS/2 mouse
Keyboard connector
Used to connect the keyboard.
Power switch
Flip the power switch to the “ | ” side to turn
the instrument ON.
When turning it OFF, be sure to press
on the touch-screen panel instead of pressing
this switch. After Windows has stopped all
its operations, the instrument automatically
shuts off.
CAUTION
• Accessory equipment connected to the analog and digital interfaces must be certified
according to the representative appropriate national standards (for example, UL 1950
for Data Processing Equipment UL 2601-1 for Medical Equipment, and CSA C22.2
No. 601-1, EN 60601-1 and IEC 60601-1.) Furthermore all configurations shall comply
with the system standard IEC 60601-1. Anybody who connects additional equipment
to the signal input or signal output part configures a medical system, and is therefore
responsible that the system complies with the requirements of the system standard IEC
60601-1. If in doubt, consult the technical service department or your local
representative.
3-3
Forehead rest
Placido rings
Eye level marker
Measuring window
Chin rest
Chin rest knob
Patient’s side
Eye level marker
A guide for the patient’s eye level during measurement. The height of the chin rest should
be adjusted so that the center level of the
patient’s eye roughly aligns with this line.
Chin rest knob
Turning this knob moves the chin rest up and
down. You may use the eye level marker as a
guide to adjust the patient’s eye level to a comfortable height for measurement.
3-4
[Measurement screen (ARK mode)]
The screen is displayed when the refractive power and curvature radius of the eye are measured.
Target
Focusing indicator
Alignment light
Measurement select button
Measurement mode button
Tracking button
Auto-shot button
Measurement select button
Every time the button is pressed, the measurement is selected in the order of
(AR and
KM measurements) =>
(AR measurement) =>
(KM measurement) =>
(Manual PD measurement*5).
: Both AR and KM measurements take
place.
: Only AR measurement takes place.
: Only KM measurement takes place.
: Manual pupillary distance measurement can be performed.
Measurement mode button
Used to switch between the
(ARK mode)
and
(ARK/CT mode).
Auto-shot button
Used to turn ON or OFF the auto-shot function.
: The auto-shot function is turned OFF.
: The auto-shot function is turned ON
(active).
The button cannot be changed into
if
the tracking button is
.
The auto-shot function is disabled during
KM measurement.
Tracking button
Used to turn ON or OFF the auto-tracking
function.
: The instrument automatically aligns
the measuring unit with a patient’s
eye.
: The auto-tracking function is not active.
* Auto-tracking function: When roughly
aligned to the corneal vertex point, the
ARK-10000 automatically detects the
corneal vertex point, and it performs a
fine alignment and focusing.
*5 The
button is selectable only when the “Auto PD” check box is unchecked on the Settings
screen.
3-5
Used to print out measured exam data with
the built-in printer.
While the data is temporarily saved in the
memory, the button is marked by a small
circle in the upper right corner like
.
When starting a measurement after pressing the button, the instrument clears the
saved data in the memory, and starts measurement.
Used to delete the exam data which is being
displayed on the screen.
Used to switch the screen to the Settings
screen where various settings can be specified.
Used to exit the ARK-10000 software and turn
the instrument OFF.
Be sure to use this button when turning
the instrument OFF. Never turn the instrument OFF by pressing the power switch
as it may result in a malfunction.
Used to display on-screen help related to the
screen.
3-6
[Measurement screen (ARK/CT mode)]
The screen is displayed when the refractive power and curvature radius of the eye are measured.
Target
Focusing indicator
Alignment light
Measurement select button
Measurement mode button
Auto-shot button
Measurement select button
Every time the button is pressed, the measurement is selected in the order of
(REF
and CT measurements) =>
(REF measurement) =>
(CT measurement) =>
(Manual PD measurement*6).
: Both REF and CT (Corneal Topography) measurements take place.
: Only REF measurement takes place.
: Only CT (Corneal Topography) measurement takes place.
: Manual pupillary distance measurement can be performed.
Measurement mode button
Used to switch between the
(ARK mode)
and
(ARK/CT mode).
Auto-shot button
Used to turn ON or OFF the auto-shot function.
Tracking button
: The auto-shot function is turned OFF.
: The auto-shot function is turned ON
(active).
The button cannot be changed into
if
the tracking button is
.
The auto-shot function is disabled during
CT measurement.
Tracking button
Used to turn ON or OFF the auto-tracking
function.
: The instrument automatically aligns
the measuring unit with a patient’s
eye.
: The auto-tracking function is not active.
* Auto-tracking function: When roughly
aligned to the corneal vertex point, the
ARK-10000 automatically detects the
corneal vertex point, and it performs a
fine alignment and focusing.
*6 The
button is selectable only when the “Auto PD” check box is unchecked on the Settings
screen.
3-7
Used to print out exam data such as AR data
and corneal curvature radius with the built-in
printer, and to save the data into the database.
While the data is temporarily saved in the
memory, the button is marked by a small
circle in the upper right corner like
.
When starting a measurement after pressing the button, the instrument clears the
saved data in the memory, and starts measurement.
When exam data has been saved in the
database after printout, the button changes
.
into
Used to switch the screen to the Map View
screen.
The latest exam data will be displayed in the
map layout of “View 1”.
Used to delete the exam data which is being
displayed on the screen.
Used to switch the screen to the Patient Selection screen.
Used to switch the screen to the Settings
screen where various settings can be specified.
Used to exit the ARK-10000 software and turn
the instrument OFF.
Be sure to use this button when turning
the instrument OFF. Never turn the instrument OFF by pressing the power switch
as it may result in a malfunction.
Used to display on-screen help related to the
screen.
ID: and Patient buttons
Used to open the “Select Patient” dialog for
patient data entry (such as a patient name) or
patient data selection.
After entering patient data, the ID No. and
patient name are displayed on the buttons.
3-8
[Map View screen]
The Map View screen can include 6 maps at the maximum. Because 6 maps cannot be fit into
the screen at a time, scroll through all the maps using the scroll bar on the right side to view
the six maps.
In addition, pressing
below the color scale of each map enlarges that map only.
The available map types are: Axial map, Instantaneous map, “Refractive” map, Elevation
map, OPD map, Target “Refractive” map, Internal OPD map, Wavefront High Order map,
Wavefront Total map, Wavefront Group map, Zernike graph and Difference map. On the
screen, the Eye Image can also be displayed in stead of a map. (Selectable on the Map View
Settings screen.)
Scroll bar
Used to print out a map image with an optional color printer.
When exam data is stored in a database
after printout, the button changes into
.
Used to switch between eye maps (Left/
Right).
The button is operative only when data of both
eyes is obtained with the same Exam No.
Used to output a map image into a file in the
JPEG format or the BMP format.
Used to go to the screen where a map set (already entered map layout) of both left and
right eyes is selected.
Used to output numerical data of measured
results into a text file in the CSV format.
Used to go to the screen where a map set (already entered map layout) is selected.
3-9
Used to go to the Map View Settings screen
where map types, layouts, color scales and so
on are specified.
Used to exit from the Map View screen to the
measurement screen, or to the Patient Selection screen.
Used to display on-screen help related to the
screen.
3 - 10
[Patient selection screen]
The screen is for selecting exam data to be displayed on maps from the database. The screen
is also used for editing data.
By pressing an item on the top (ID, Name, Sex, Group, Last Exam Date) once, data can be
sorted in ascending order within the item field. Pressing the item once again sorts the data in
descending order.
(ascending order) or
(descending order) on an item indicates the
item on which the sort order is based.
Press any item on a desired patient line to select exam data.
Map Selection area
Number of
listed data item
Used to go to the Map View screen of the selected data.
Used to go to the Map View Settings screen
where map types and a layout etc. are specified.
Used to display the “Search Patient Data” dialog.
Used to display the Edit Patient Information
screen where patient data is modified or the
Edit Exam Information screen where exam
data is modified.
Used to display the Import (Outside to Inside)
screen through which data is imported.
The button is for importing exam data obtained by another ARK-10000 into the database of your ARK-10000.
Used to display the Export (Inside to Outside)
screen through which data is output to storage disks such as a floppy disk etc.
Used to display the Delete screen through
which data can be deleted.
3 - 11
Used to display the “Database Backup” dialog through which data is backed up.
Number of listed data item
Shows the total number of data items (A) and
the number of data items listed (B).
Patient Data 20 of 20 displayed
Number of data items listed (B)
Total number of data items (A)
Used to open the “Database Settings” dialog.
When data is not retrieved by the “Search Patient Data” dialog below, (A) equals (B).
Used to re-detect the edges of CT-measured
data saved in the database.
Used to return to the measurement screen.
Map Selection area
Used to set a layout of the maps to be displayed on the Map View screen. See explanation below for details.
[“Map Selection” area]
Four operations available in the “Map Selection” area on the Patient Selection screen:
NOTE
• Specifications on the Patient Selection screen are temporarily applicable to a map.
The map set will be reset back to the one specified on the Map View Settings screen
once you select another patient. Specify a permanent map set that is applied to all the
patients on the Map View Settings screen.
.Selecting a map layout from among the three map
sets (“View 1” to “View 3”) to be applied to the maps
displayed on the Map View screen
Select desired map set to be used from among “View 1”,
“View 2” and “View 3” by pressing a radio button ( ).
The map button will represent the selected layout.
Radio button
Layout of “View 1”
Layout of “View 2”
Layout of “View3”
Map button
Whether or not a map is to be printed in the
layout is shown. In this case, the map is
printed in the “View 1” layout and “View 2”
layout.
3 - 12
.Changing a layout assigned to a map set (“View 1” to
“View 3”)
1) Select the button which is immediately
under the selected radio button of a map
set (“View 1” to “View 3”).
In the case of the figure on the right,
press AxOPD2 button.
The screen where a map layout can be
selected is displayed.
2) Press a desired layout to designate.
This is a temporary designation. The
designated layout will be reset back to
that of the “View” specified on the Map
View Settings screen when selecting
other patient data.
. For a patient with multiple items of exam data, designating where to locate individual
maps
1) Designate exam data to be displayed.
Press a desired exam data line.
Map button
2) Designate a map position on which the
exam data will be displayed.
Press a map button to designate.
The designated map button No. will be
entered in the “Map No.” box in a
list.
3) Repeat Steps 1) to 2) to designate data
to be displayed and its map position.
This is a temporary designation. The
designated layout will be reset back to
that of the “View” specified on the Map
View Settings screen when selecting
other patient data.
. Selecting a map layout from “View 1” to “View 3” in which maps are printed by
pressing
on the Map View screen
of “View 1” to “View 3”. Multiple selections of the buttons are allowed.
Select
⇒ Maps are printed in the layout.
⇒ Maps are not printed in the layout.
This is a temporary designation. The designated layout will be reset back to that of
“View” specified on the Map View Settings screen when selecting another patient’s data.
Designate a map layout that is permanently applied in printing on the Map View Settings
screen.
3 - 13
[“Search Patient Data” dialog]
By using the “Search Patient Data” dialog, the
operator can easily search for patient data which
meet all the entered specifications only and select
desired patient’s data.
1) Click
to display the “Search Patient
Data” dialog.
2) Enter desired specifications in the
corresponding fields and click
.
ID, Name, Group ⇒ Only the data whose items contain the entered characters is searched.
Last Exam Date ⇒ Checking searches only for the data from the designated period back
from the last measurement date.
Today: Today’s data only
Week prior: Data obtained for the last 7 days
One Month prior: Data obtained for the last 30 days
Three Month prior: Data obtained for the last 90 days
Period: Data obtained during the date range designated in the “From” and “To” fields
Sex ⇒ Select “Male” (Male patients only are searched), “Female” (Female patients only
are searched), or “Both” (Both male and female patients are searched).
Patient data which meet all the entered specifications only is searched.
button: Used to exit to the Patient Selection screen without searching.
button: Used to return the specifications to the initial ones. (“ID”, “Name” and “Group”
fields will be blanked, “Both” of “Sex” will be selected, and “ Last Exam
Date” will be unchecked: The 1st day of the last month will be entered in the
“From” fields, and the current date will be entered in the “To” fields.)
Save search specifications even after shutdown
If the check box is checked, the data searched with the dialog will be saved even after
shutdown. To return the searched patient data to the previous status before searching, click
on the Search Patient Data dialog to return the specifications to the initial ones, and then
click
. If the check box is unchecked, the searched patient data is returned to the
previous state before searching when the Patient Selection screen is closed. Be aware
that this check box is not displayed and the searched data is not maintained when the
Search Patient Data dialog is displayed by way of the Select Patient dialog or Import
(Outside to Inside) screen.
On the condition that patient data is searched using the Search Patient Data dialog, the
background color of the patient list is changed from white to yellow.
NOTE
• The Patient Selection screen cannot list more than 5,000 items of patient data. If the
patient number exceeds 5,000, enter a specification to narrow the scope of a search.
3 - 14
[Settings screen]
This screen is used to make settings related to measurements, the built-in printer, communication and others. The screen is also used for exiting the ARK-10000, and for returning to the
Windows screen.
Used to exiting the ARK-10000 software and
to return to the Windows screen.
Used to display on-screen help related to the
screen.
Used to cancel modifications and to return to
the measurement screen.
Used to fix modifications and to return to the
measurement screen.
Used to display the version of the ARK-10000
software.
Used to go to the Calibration selection screen.
Try not to press this button except when performing calibration for the CT measurement
because changing the setting improperly results in a malfunction of the instrument.
§4
BASIC USAGE
This section explains basic usages as:
Measuring the eye in the ARK mode. → Printing out measured data.
Measuring the eye in the ARK/CT mode → Viewing measured data displayed in a map. →
Saving the measured data in the database.
Recalling the measured data from the database and displaying it in the map.
Mode
Purpose
Refractive power and corneal curvature
radius in the central area of the eye are
measured.
This mode is not for saving the measured
data in the database but for printing KMand/or AR-measured data.
Corneal curvature radius and the
distribution of the refractive power are
measured. This mode is for checking
the distribution of the refractive power of
the whole eyeball, saving it into the
database and displaying it in maps in the
future.
ARK
ARK/
CT
Measurement
type
AR measurement
KM measurement
REF measurement
CT measurement
Measure
ment type
Printout
of
measured
data
Display of
maps
Saving of
data in
database
AR
measurement,
KM
measurement
Print
Not
display
Not save
REF
measurement,
CT
measurement
Print
Display
Save
Details of measurement
Measures the refractive power of the central area of the eye in the same
manner that the auto refractometer does.
The placido ring image projected over the cornea is captured. From the
analysis result of the projected image, corneal curvature radius in the
approximately 3 mm area, the direction of the steepest meridian and the
amount of corneal astigmatism are obtained.
The fundus is scanned by slit-shaped ray bundles and data for displaying
the OPD map is obtained.
The placido ring image projected over the cornea is captured. From the
analysis result of the projected image, a map illustrating the distribution
of the corneal curvature radius or the refractive power is obtained.
4.1 Operation Flow
[
Measuring the eye in the ARK mode. → Printing out measured data.]
4.2.1 Power-ON
Measuring
4.4.1 AR and KM measurements
4.4.2 AR measurement
4.4.3 KM measurement
4.7.1 Printing measured data
4.2.3 Power-OFF
4-2
[ Measuring the eye in the ARK/CT mode → Viewing measured data displayed in a map.
→ Saving the measured data in the database.]
4.2.1 Power-ON
Entering a patient name (Step 4, p4-19)
Measuring
4.5.1 REF and CT measurements
4.5.2 REF measurement
4.5.3 CT measurement
4.6.1 Displaying a map via the measurement screen
4.7.1 Printing measured data
(The measured data is saved in the database simultaneously with the printout of the
measured data.)
4.2.3 Power-OFF
[
Recalling the measured data from the database and displaying it in the map.]
4.2.1 Power-ON
4.6.2 Retrieving an exam from the database and displaying it in a map
4.2.3 Power-OFF
4-3
4.2 Power-ON and Power-OFF
4.2.1 Power-ON
1. Make sure that no floppy disk is inserted in
the disk drive.
2. When using an optional color printer, turn
it ON.
3. Turn ON the power switch of the ARK-10000.
Windows starts up and then the ARK-10000
also starts up. *7
NOTE
Power switch
• Because the ARK-10000 has Microsoft Windows installed, the instrument may be
started in “Safe Mode”, or “Scandisk” may be accidentally initiated on startup. In
such cases, follow the instructions below.
If the instrument starts in “Safe Mode” ⇒
Turn OFF the instrument after startup and restart
it. See [Restarting the instrument in Safe Mode]
(p.4-4). If the instrument still starts in “Safe
Mode”, contact NIDEK or your authorized
distributor.
If “Scandisk” is initiated ⇒
Allow “Scandisk” startup. If the ARK-10000
does not start up properly after “Scandisk” has
ended, contact NIDEK or your authorized
distributor.
• If the built-in hard disk space is not enough at startup, a message appears during the
program startup to encourage the operator to back up data and to free up disk space by
deleting unwanted data. In this case, make more disk space as instructed:
Erase unwanted data.
Back up data on a storage disk as a ZIP disk or DVD-RAM and delete the backed
up data from the hard disk. See “5.6.4.1 Backing up the database”.
• When backing up or rebuilding the database, connect an external storage device first,
turn it ON, and then turn the ARK-10000 ON (When designating an external storage
device as a target location for backup.).
If the external storage device has not been connected when turning the ARK-10000
ON, the storage device may not be function properly.
*7 Windows is the registered trademark of Microsoft Corporation, U.S.A.
4-4
[Restarting the instrument in Safe Mode]
When starting the instrument in Safe Mode, shut the instrument down once after startup and
restart it.
Be aware that the touch-screen panel does not function in the Safe Mode. Use the keyboard to
shut down the instrument as instructed below.
1) Press F4 key while pressing Alt key.
The “Shut Down Windows” dialog opens.
2) Make sure that the “Shut down” option is
selected.
If not, select the “Shut down” option with
↑ key or ↓ key.
3) Press Enter key.
A few seconds later, the message “It’s now safe to turn off your computer” appears.
4) Turn the ARK-10000 OFF.
Be sure to turn the power switch OFF after the message “It’s now safe to turn off your
computer.” appears.
4.2.2 Reactivating the instrument from the power saving mode
The instrument will automatically be shut off for
power conservation after a set period of time of
non-operation. In the power saving mode, the
title screen will dim.
To reactivate the instrument from the power
saving mode, do one of the following:
• Touch the touch-screen panel.
• Press any key of the keyboard.
• Press the start button.
• Manipulate the joystick to move the
measuring unit to place it in front of the left
eye or right eye.
* According to the status of the screen, the instrument may not be put into the power saving
mode.
* The preset time of no operation can be set with the Settings screen. See “5.9.1 Setting
parameters”.
4-5
4.2.3 Power-OFF
CAUTION
•When turning OFF the instrument, be sure to follow Steps 1 to 4 as below instead of
turning OFF the power switch.
Turning OFF the power switch of the instrument before Windows is shut down may
cause a loss of data, or a failure of the instrument. *6
If the instrument cannot be operated through the touch-screen panel or keyboard,
and therefore Windows cannot be shut down, turn OFF the power switch once, and
turn it ON again and confirm that the instrument operates properly.
1. Press
on the measurement screen.
The “Shutdown” dialog opens.
2. Press OK .
The software, ARK-10000 and Windows are
shut down, the measuring unit is moved to its
lowest position, and the power to the instrument
is automatically shut off after approx. 30 sec.*8
3. If an optional color printer is connected, turn the printer OFF.
4. Put the dust cover on the instrument.
[To exit the ARK-10000 software and return to the Windows screen]
1. Press
on the measurement screen.
The Settings screen opens.
.
2. Press
The “Exit” dialog opens.
3. Press OK .
The ARK-10000 software is exited, and the
Windows screen opens.*8
*8 Windows is the registered trademark of Microsoft Corporation, U.S.A.
4-6
4.3 Selecting the Measurement Mode
The ARK-10000 has two measurement modes: ARK mode and ARK/CT mode.
Pressing the measurement mode button on the measurement screen switches the measurement
mode between the two modes.
ARK mode
Measurement mode button
ARK/CT mode
Measurement mode button
Switching the measurement mode will clear the measured data saved in the memory.
If the measurement mode button is pressed on
condition that the measured data is saved in the
memory (on condition that
or
button is
displayed), the dialog is displayed, asking the
operator if he/she is sure that he/she wants to
switch the measurement mode after erasing the
measured data in the memory.
Yes button ⇒ The measurement mode will be switched.
No button ⇒ The measurement mode will not be switched.
4-7
4.4 Measuring in the ARK Mode
In the ARK mode, refractive errors of the central part of the eye and corneal curvature radius are
measured. The mode should be used for printing the AR- and KM-measured data without saving
them in the database. In the ARK mode, two types of measurement are available. The
measurement select button allows you to select both AR measurement and KM measurement,
AR measurement only, or KM measurement only.
Measurement
select button
Measurement
mode button
Measurement type
See …
AR
measurement
and
KM 4.4.1 AR and KM measurements
measurement
AR measurement
4.4.2 AR measurement
KM measurement
4.4.3 KM measurement
Manual
PD
measurement
(Only
when
the 5.5 Manual Pupillary Distance
(PD) Measurement
“Auto PD” box is
checked
on
the
Settings screen.)
AR measurement: In the same manner as an auto refractometer, the refractive power of the
central eye is measured.
KM measurement: The placido ring image projected onto the cornea is captured. Then the
corneal curvature radius, the direction of the steepest meridian and corneal
astigmatism in about 3 mm-dia zone in the center of the cornea are obtained
from the analyzed image.
4.4.1 AR and KM measurements
Both AR measurement (Objective measurement of refractive power) and KM measurement
(Measurement of corneal curvature radius) are performed.
NOTE
• To obtain reliable measured results, be sure to read “APPENDIX C. OBTAINING
RELIABLE EXAM DATA” (at the end of this book) before measuring a patient’s eye
for the first time.
1. Turn the instrument ON.
The ARK-10000 starts up, and the measurement screen is displayed.
2. Prepare the patient.
1) Clean the forehead rest and chin rest with a clean cloth such as gauze or cotton dampened
with disinfecting alcohol. When a stack of chin rest paper is mounted on the chin rest,
remove one sheet of the paper.
4-8
2) Instruct the patient to remove glasses or contact lenses if wearing, and to sit in the chair.
NOTE
• It is recommended to have patients who always wear contact lenses in daily life, wear
glasses for about one week before measurement in order to obtain accurate results.
This is to measure a cornea restored to its original shape after being slightly deformed
by the wearing of contact lenses.
[Overrefraction]
In the case of overrefraction (when measuring the patient’s eye with spectacle glasses), the
focusing indicator may not appear. (See p.4-10.)
During AR measurement, bring the patient’s eye in focus by minimizing the alignment
light as much as possible. Be aware that the reliability of the AR-measured data may be
lowered according to the degree of the deflection of the measuring beam caused by the
lens of eyeglasses (refractive index of eyeglasses).
During KM measurement, the reflected frame image of spectacles will obstruct the placido
ring image (a placido ring image will have breaks), or lenses will cause image magnification
to vary. As a result, the reliability of the KM-measured data will be lowered.
3) Instruct the patient to place his/her chin on the chin rest and gently place his/her forehead
against the forehead rest.
4) Adjust the height of the chin rest with the chin rest knob, and roughly align the center of the
patient’s eye with the eye level marker.
NOTE
• To relax the patient, explain the following before measurement:
“This instrument measures your eye to find which kind of lens fits you, and your
corneal shape. The weak infrared ray and red light used in the measurement do not
harm your eyes.”
3. Set the measurement mode to the ARK (
) mode.
Every time the measurement mode button (the second button from the left in the bottom) is
pressed, the measurement mode is alternately switched.
See “4.3 Selecting the Measurement Mode”.
4. Set the measurement type to the “AR/KM” (
).
Every time the measurement select button (in the lower left corner) is pressed, the selected
measurement will be switched alternately. The symbol in the measurement select button
represents the currently-selected measurement.
4-9
5. Perform focusing.
1) Instruct the patient to; “Look through the measuring window. As you will see a picture of a
balloon, watch the center of it without straining. Try to open your eye as wide as possible.”
2) Manipulate the joystick to display the
patient’s eye on the screen.
By moving the joystick to the right or left,
pulling it forward or pushing it back, the main
body is moved to the right, left, backward and
forward. By turning the top of the joystick,
the measuring unit is moved up and down.
Align the eye position to the measuring point
with right, left, up and down movements.
Adjust the focus with back and forth
movements.
Focusing indicator Target
[When using the auto-tracking function (
Alignment light
)]
3) Manipulate the joystick to move the alignment light closer to the target
. As the alignment
light comes closer to the target
, the activated auto-tracking function will move the
main body so that the eye to be measured is in alignment with the main body and in focus.
NOTE
• The auto-tracking function does not work unless the alignment light is at around the
center of the measuring field. If the alignment light is off the center, manipulate the
joystick to move the alignment light to the center.
When the position of the alignment light goes outside the working range of the autotracking, the limit mark (the letters “LIMIT” and arrow) appears on the touch-screen
panel. In such cases, either move the joystick slightly in the direction of the arrow,
or pull the main body forward once again to make the instrument focuses on the eye
again.
LIMIT mark LIMIT : Tilt the joystick to the left.
LIMIT : Tilt the joystick to the right.
LIMIT : Slightly move the chin rest up.
LIMIT : Slightly move the chin rest down.
LIMIT F: Tilt the joystick backward (toward the patient).
LIMIT B: Tilt the joystick forward (toward the operator).
• The two dotted line circles on the measurement screen represent the 2-mm and 6-mm
dia. zones to be measured.
If the patient’s eyelashes interfere with the inner circle, the reliability of the measured
data will be lowered. In such cases, instruct the patient to open his/her eyes wide.
4 - 10
[When not using the auto-tracking function (
)]
3) After moving the alignment light inside the target
, bring the patient’s eye into focus so
that the focusing indicator shows the most ideal state “ ” by manipulating the joystick.
[Focusing indicator]
Too close to the patient’s eye
Pull the joystick forward to move the main body away from the patient’s eye.
Ideal state
Push the joystick to move the main body closer to the patient’s eye.
Too far from the patient's eye
6. Perform measurement.
When both left and right eyes are “AR-measured” and “KM-measured”, the measurement order
is selectable between (A) and (B):
(A) The ARK-10000 “AR-measures” and then “KM-measures” one eye and then it measures
the other eye in the same order:
Example) AR measurement (Right eye) → KM measurement (Right eye) → AR
measurement (Left eye) → KM measurement (Left eye)
(B) The ARK-10000 “AR-measures” both eyes and then “KM-measures” both eyes.
Example) AR measurement (Right eye) → AR measurement (Left eye) → KM
measurement (Left eye) → KM measurement (Right eye)
The explanation in this manual is based on measurement order (A).
In measurement order (A), the reliability of the PD measured during AR measurement may be
lower than the PD value obtained in measurement order (B). This is because the patient’s head may
shift slightly during the longer interval between the right-eye AR measurement and left-eye AR
measurement.
* The switching between the right and left eyes is automatically performed when the main body
is moved with the joystick and the eye to be measured is displayed on the screen.
[When using the auto-shot function (
)]
AR measurement takes place automatically when the instrument is best aligned and focuses on
the eye.
↓
After repeated AR measurements until AR median values (S, C, A) are obtained by taking the
median of the first 3 usable values, the letters “AR” in the upper right of the screen will change to
the blinking letters “KM”. Instruct the patient to slowly blink once or twice to make his/her
corneal surface smooth and optically clear.
↓
After confirming that the instrument is best aligned and focuses on the eye, press the start
button to start KM measurement. KM measurement takes place 3 times.
4 - 11
[When not using the auto-shot function (
)]
AR measurement takes place when the start button on the joystick is pressed.
Repeat the measurement until AR median values (S, C, A) are obtained by taking the median
of the first 3 usable values.
↓
After repeated AR measurements until AR median values (S, C, A) are obtained by taking the
median of the first 3 usable values, the letters “AR” in the upper right of the screen change to the
blinking letters “KM”.
Instruct the patient to slowly blink once or twice to make his/her corneal surface smooth and
optically clear.
↓
After confirming that the instrument is best aligned and focuses on the eye, press the start
button to start KM measurement. KM measurement takes place three times.
The latest AR-measured and KM-measured median values are displayed:
Right/Left
The measured eye indication blinks.
AR measurement count
Latest AR values
(Right eye/Left eye)
KM median values
(Simulated KM-measured values)
(Right eye/Left eye)
Pressing the
KM measurement
count
AR:3 Right
S
C
-1.25 -0.75
R1 R2
7.94 7.59
Latest AR values and
KM median values
(An error No. will be displayed if an error occurs during the measurement.)
KM:3
A
178
A
170
S
-1.25
R1
7.94
C
-0.75
R2
7.59
A
178
A
170
button clears all the displayed data on the screen.
NOTE
• The sign “E” may be shown next to the latest AR-measured values displayed in the
lower portion of the measurement screen. This sign represents a lower reliability of
the AR data.
This sign will be frequently shown in the case of keratoconus or a highly-irregular
cornea after a corneal transplantation.
AR:3
S
-1.25
R1
7.94
Right
C
-0.75
R2
7.59
KM:3
A
178E
A
170
S
-1.25
R1
7.94
C
-0.75
R2
7.59
A
178E
A
170
However, if the Print High RMS Data check box is unchecked on the Settings screen,
low-confidence measured data with the E sign is not displayed.
4 - 12
[AR measurement count]
When the auto-shot function is turned ON ⇒ AR measurement takes place repeatedly when
the main body is best-aligned and focuses on the eye until AR median values (S, C, A) are
automatically obtained by taking the median of the first 3 usable values.
When the auto-shot function is turned OFF:
• When the “AI Mode” box is checked ( ) on the Settings screen:
⇒Pressing the start button once triggers the instrument to perform AR measurement a
single time.
Holding down the start button makes the instrument perform AR measurement
repeatedly until AR median values (S, C, A) are automatically obtained by taking the
median of the first 3 usable values.
• When the “AI Mode” box is not checked ( ) on the Settings screen:
⇒Pressing the start button once triggers the instrument to perform AR measurement a
single time.
While the start button is held down, the instrument keeps performing AR measurement.
If the “Single Fogging” box is checked throughout the repeated AR measurements, fogging is
maintained throughout measurement.
7. Measure the other eye in the same manner.
8. After completion of the measurement, press
.
The measured results are printed. See “4.7.1 Printing measured data”.
4 - 13
4.4.2 AR measurement
Only AR measurement (objective measurement of the refractive power) is performed.
NOTE
• To obtain reliable measured values, be sure to read “APPENDIX C. OBTAINING
RELIABLE EXAM DATA” before measuring a patient’s eye for the first time.
1. Turn ON the power.
The ARK-10000 starts up, and the measurement screen is displayed
2. Preparing the patient.
See Step 2 of “4.4.1 AR and KM measurements”.
NOTE
• To relax the patient, explain the following before measurement: “This instrument
measures your eye to find which kind of lens fits you. The weak infrared ray used in
the measurement does not harm your eyes.”
3. Set the measurement mode to the ARK (
) mode.
Every time the measurement mode button (the second button from the left in the bottom) is
pressed, the measurement mode is alternately switched.
See “4.3 Selecting the Measurement Mode”.
4. Set the measurement type to the “AR” (
).
Every time the measurement select button (in the lower left corner) is pressed, the selected
measurement will be switched alternately. The symbol in the measurement select button
represents the currently-selected measurement.
5. Perform alignment and focusing.
See Step 5 of “4.4.1 AR and KM measurements”.
NOTE
• The two dotted circles on the measurement screen represent the 2-mm diameter and 6mm dia. zones on the cornea to be “AR-measured”.
If eyelashes are on the innermost circle, the reliability of the measured data will be
lower. In such cases, instruct the patient to open his or her eye wider.
4 - 14
6. Performing measurement.
[When using the auto-shot function (
)]
AR measurement takes place automatically when the instrument is best aligned and focuses
on the eye.
[When not using the auto-shot function (
Press the start button on the joystick.
)]
AR measurement takes place.
On the touch-screen panel, the latest AR values are displayed.
Right/Left
The measured eye indication blinks.
AR measurement count
Latest AR values (Right eye/Left eye)
Pressing the
AR:3 Right
S
C
-1.25 -0.75
R1 R2
0.00 0.00
Latest AR values (An error No. will
be displayed if an error occurs during AR measurement.)
KM:0
A
178
A
0
S
-1.25
R1
0.00
C
A
-0.75 178
R2
A
0.00 0
button clears all the displayed values on the screen.
NOTE
• The sign “E” may be shown next to the latest AR-measured values displayed in the
lower portion of the measurement screen. This sign represents a lower reliability of
the AR values.
This sign will be frequently shown in the case of keratoconus or a highly-irregular
cornea after a corneal transplantation.
AR:3 Right KM:0
S
C
A
-1.25 -0.75 178E
R1 R2
A
0.00 0.00 0
S
C
A
-1.25 -0.75 178E
R1 R2
A
0.00 0.00 0
However, if the Print High RMS Data check box is unchecked on the Settings screen,
low-confidence measured data with the E sign is not displayed.
4 - 15
[AR measurement count]
When the auto-shot function is turned ON ⇒ AR measurement automatically takes place in
succession on the condition that the instrument is best aligned and focuses on the eye until
AR median values are automatically obtained (S, C, A) by taking the median of the first 3
usable values.
When the auto-shot function is turned OFF:
• When the “AI Mode” box is checked ( ) on the Settings screen
⇒ Pressing the start button once triggers the instrument to perform AR measurement a
single time.
Holding down the start button makes the instrument perform AR measurement
repeatedly until AR median values are obtained (S, C, A) by taking the median of the
first 3 usable values.
• When the “AI Mode” box is not checked ( ) on the Settings screen
⇒ Pressing the start button once triggers the instrument to perform AR measurement a
single time.
While the start button is held down, the instrument keeps performing AR measurement.
If the “
Single Fogging” box is not checked on the Settings screen, fogging is maintained
throughout the repeated AR measurements.
7. Measure the other eye in the same manner.
8. After completion of measurement, press
.
The measured results are printed. See “4.7.1 Printing measured data”.
4 - 16
4.4.3 KM measurement
Only KM measurement (measurement of the corneal curvature radius) is performed.
NOTE
• To obtain reliable measured results, be sure to read “APPENDIX C. OBTAINING
RELIABLE EXAM DATA” before measuring a patient’s eye for the first time.
1. Turn ON the power.
The ARK-10000 starts up, and the measurement screen opens.
2. Prepare the patient.
See Step 2 of “4.4.1 AR and KM measurements”.
NOTE
• To relax the patient, explain the following before measurement: “This instrument
measures corneal shape. The red light used in the measurement does not harm your
eyes.”
3. Set the measurement mode to the ARK (
) mode.
Every time the measurement mode button (the second button from the left in the bottom) is
pressed, the measurement mode is alternately switched.
See “4.3 Selecting the Measurement Mode”.
4. Set the measurement type to the “KM” (
).
Every time the measurement select button (in the lower left corner) is pressed, the selected
measurement will be switched alternately. The symbol in the measurement select button
represents a currently-selected measurement.
5. Perform focusing.
See Step 5 of “4.4.1 AR and KM measurements”.
4 - 17
6. Perform measurement.
[When using the auto-shot function (
)]
Press the start button on the joystick. KM measurement takes place three times.
(During KM measurement, the auto-shot function is disabled.)
[When not using the auto-shot function (
)]
Press the start button on the joystick. KM measurement takes place three times.
The KM-measured median values are
displayed.
Right/Left
The measured eye indication blinks.
KM median values
(Simulated KM-measured values)
(Right eye/Left eye)
Pressing the
KM measurement
count
AR:0 Right
S
C
0.00 0.00
R1 R2
7.94 7.59
KM median values
(An error No. will be displayed
if an error occurs during the measurement.)
KM:3
A
0
A
170
button clears all the displayed values on the screen.
7. Measure the other eye in the same manner.
8. After completion of KM measurement, press
.
The measured results are printed. See “4.7.1 Printing measured data”.
S
C
A
0.00 0.00 0
R1 R2
A
7.94 7.59 170
4 - 18
4.5 Measuring in the ARK/CT Mode
In the ARK/CT mode, the corneal curvature radius and the distribution of the refractive power
are measured. The mode should be used for viewing the distribution of the refractive power of
an entire eye or for saving measured data in the database and for viewing a map of the data at a
later date. In the AR/CT mode, two types of measurement are available: REF measurement and
CT measurement. The measurement select button allows you to select both REF measurement
and CT measurement, REF measurement only, or CT measurement only.
Measurement
select button
Measurement
mode button
Measurement
See…
REF measurement
and
CT measurement
4.5.1 REF and CT measurements
REF measurement
4.5.2 REF measurement
CT measurement
4.5.3 CT measurement
Manual
PD
measurement
(Only
when
the
5.5 Manual PD Measurement
“Auto PD” box is
checked on
the
Settings screen.)
REF measurement:
For obtaining AR-measured data (in the
corneal center as measured by an auto
refractometer) by scanning the fundus with
slit-shaped ray bundles and measuring it
in increments of 1º in the 2 mm to 6 mm
zone that is divided into 4 and for obtaining
the OPD map.
φ2
φ6
CT measurement:
The projected placido rings on the cornea are captured, the ring images are analyzed, and
then a map illustrating the distribution of corneal curvature radiuses or that of the refractive
power and KM-measured data (simulated keratometry values) are obtained.
4.5.1 REF and CT measurements
Both REF measurement and CT measurement are performed.
NOTE
• To obtain reliable measured results, be sure to read “APPENDIX C. OBTAINING
RELIABLE EXAM DATA” (at the end of this book) before examining a patient’s eye
for the first time.
4 - 19
1. Turn the instrument ON.
The ARK-10000 starts up, and the measurement screen opens.
2. Set the measurement mode to the ARK/CT (
) mode.
Every time the measurement mode button (the second button from the left in the bottom) is
pressed, the measurement mode is alternately switched.
See “4.3 Selecting the Measurement Mode”.
3. Set the measurement type to the REF/CT (
).
Every time the measurement select button (in the lower left corner) is pressed, the selected
measurement will be switched alternately. The symbol in the measurement select button
represents the currently-selected measurement.
4. Type in a patient’s ID and name.
Press the ID: or Patient button on the top of the measurement screen.
The “Select Patient” dialog is displayed.
If a patient has already been entered:
⇒ Press the patient line and then press
.
Pressing an item name on the upper part
of the screen (ID, Name, Sex, Group, Last
Exam Date) once sorts the data in
ascending order within the item field.
Pressing the item name once again sorts
the data in descending order. The
(ascending order) or (descending order)
next to an item name indicates the item on
which the sort order is based. To search
for data, use the “Search Patient Data”
dialog. See “[“Search Patient Data”
dialog]” (p.3-13).
If a patient has not been entered yet:
⇒ Enter the patient as new data.
Press
.
The “Input Patient” dialog opens. Enter
“Patient ID” and “Name” using the keyboard.
Select between “Male” and “Female” for
“Sex” with the radio button. Enter “Birthday”
using the keyboard. The system ID No. is
initially entered in the “Patient ID” box.*9
*9 It is possible to disable the automatic patient ID assignment function. See “5.9.3 Selecting
whether or not to assign a patient ID automatically”.
4 - 20
NOTE
• Use an unique ID such as a carte number.
If an already assigned Patient ID is entered, the message, “The input Patient ID
already exists.” is displayed, and the entered Patient ID will be rejected.
To enter more detailed patient information:
1) Press
to open the Edit Patient
Information screen.
2) Pressing a desired item twice opens an entry
box. Input characters using the keyboard.
The item with a “ ” on its left will not
accept any entry.
3) Press
.
The “Input Patient” dialog is displayed.
4) Press
.
[Overrefraction]
The measurement data can be registered with the desired patient selected from the existing patient
list displayed on the Select Patient screen.
If the patient has not been registered, register the measurement data by entering “Patient ID”, “Last
Name”, “First Name”, “Sex”, and “Birthday” in the Input Patient dialog as in the case of saving the
measurement data in the ARK-10000.
NOTE
• If the OPD-Station software is V1.02 or earlier, update the software.
With the software V1.02 or earlier, “Last Name”, “First Name”, “Sex”, and “Birthday”
entered in the Input Patient dialog are not registered to the OPD-Station.
• Characters other than alphanumerics in the registered patient information in the OPD-Station
are displayed as “?” on the Select Patient screen of the ARK-10000.
• The registered patient information in the OPD-Station cannot be edited with the ARK-10000.
• See “1.6.6 Modifying the settings of the ARK-10000” in the OPD-Station operator’s manual
for the setting of the ARK-10000 when connecting it to the OPD-Station.)
• If the ARK-10000 software is upgraded to this version, check the setting of “Server name”
of “Link OPD-Station”. (See “1.6.6 Modifying the settings of the ARK-10000” in the OPDStation operator’s manual.)
If the setting of “Server name” is incorrect, pressing the Print or ID buttons of the ARK10000 connected via a LAN does not display the Select Patient screen. If this condition
appears, see “5.1 Installation Failures” in the OPD-Station operator’s manual.
4 - 21
5. Prepare the patient.
1) Clean the forehead rest and chin rest with a clean cloth such as gauze or cotton dampened with
disinfecting agent. When a stack of chin rest paper is mounted on the chin rest, remove one sheet
of the paper.
2) Instruct the patient to remove the glasses or contact lenses if wearing, and to sit in the chair.
NOTE
• It is recommended to have a patient who always wear contact lenses, wear glasses for about
one week before measurement in order to obtain accurate results if he or she wears contact
lenses in daily life.
This is to measure a restored corneal shape from a deformed one which was fit under
contact lenses.
[Overrefraction]
In the case of overrefraction (when measuring the patient’s eye with spectacle glasses), the focusing
indicator may not appear (See p.4-10.)
During REF measurement, bring the patient’s eye in focus by minimizing the alignment light as
much as possible. Be aware that the reliability of the REF-measured data may be lowered
according to the degree of the deflection of the measurement beam caused by the lens of eyeglasses
(refractive index of eyeglasses).
During CT measurement, the reflected frame image of spectacles will obstruct the placido ring
image (a placido ring image will have breaks), or lenses will cause image magnification to vary.
As a result, the reliability of the CT-measured data will be lowered.
3) Instruct the patient to place his/her chin on the chin rest and gently place his/her forehead against
the forehead rest.
4) Adjust the height of the chin rest with the chin rest knob, and roughly align the center of the
patient’s eye with the eye level marker.
NOTE
• To relax the patient, explain the following before measurement:
“This instrument measures your eye to find which kind of lens fits you, and your corneal
shape. The weak infrared ray and red lights used in the measurements do not harm your
eyes.”
4 - 22
6. Perform alignment, and focusing.
1) Instruct the patient to; “Look through the measuring window. As you will see a picture of a
balloon, watch the center of it without straining. Try to open your eyes as wide as possible.”
2) Manipulate the joystick to display the
patient’s eye on the touch-screen panel.
By moving the joystick to the right or left,
pulling it forward or pushing it back, the main
body is moved to the right, left, backward and
forward. By turning the top of the joystick,
the measuring unit is moved up and down.
Align the eye position to a measuring point
with right, left, up and down movements.
Adjust the focus with back and forth
movements.
Focusing indicator
[When using the auto-tracking function (
Target
Alignment light
)]
3) Manipulate the joystick to move the alignment light closer to the target
. As the alignment light
comes closer to the target
, the measuring unit will automatically be aligned to the measuring
point (alignment), and focuses on the eye (focusing) by the auto-tracking function.
NOTE
• The auto-tracking function does not work unless the alignment light is at around the center of
the measuring field. If the alignment light is off the center, manipulate the joystick to move the
alignment light to the center.
When the position of the alignment light goes outside the working range of the auto-tracking,
a limit mark (the letters “LIMIT” and arrow) appears on the touch-screen panel. In such
a case, either move the joystick slightly in the direction of the arrow, or pull the main body
forward once again to align the main body.
LIMIT mark
LIMIT : Tilt the joystick to the left.
LIMIT : Tilt the joystick to the right.
LIMIT : Slightly move the chin rest up.
LIMIT : Slightly move the chin rest down.
LIMIT F: Tilt the joystick backward (toward the patient).
LIMIT B: Tilt the joystick forward (toward the operator).
• The two dotted line circles on the measurement screen represent the innermost and outermost
(2-mm dia. and 6-mm dia.) zones to be “REF-measured” .
If the patient’s pupil is smaller than the outer circle, only data obtained within the pupil is
accurate. To obtain an OPD map of the entire 6-mm diameter, use a mydriatic agent
without cycloplegic effects under instruction of a physician.
4 - 23
[When not using the auto-tracking function (
)]
3) After moving the alignment light inside the target
, bring the patient’s eye into focus so
that the focusing indicator shows the most ideal state “ ” by manipulating the joystick.
[Focusing indicator]
Too close to the patient’s eye
Pull the joystick forward to move the main body away from
the patient’s eye.
Ideal state
Push the joystick to move the main body closer to the
patient’s eye.
Too far from the patient's eye
NOTE
• The dotted double circle on the measurement screen represents the innermost and outermost
(2-mm dia. and 6-mm dia.) zones to be “REF-measured”.
If the patient’s pupil is smaller than the outer circle, only the obtained data within the pupil
is accurate. To obtain the OPD map of an entire 6-mm diameter, use a mydriatic agent
without cycloplegic effect under an instruction of a physician.
4 - 24
7. Perform measurement.
When both left and right eyes are “REF-measured” and “CT-measured”, the measurement order
is selectable between (A) and (B):
(A) The ARK-10000 “REF-measures” and then “CT-measures” one eye and then it measures
the other eye in the same order:
Example) REF measurement (Right eye) → CT measurement (Right eye) → REF
measurement (Left eye) → CT measurement (Left eye)
(B) The ARK-10000 “REF-measures” both eyes and then “CT-measures” both eyes
Example) REF measurement (Right eye) → REF measurement (Left eye) → CT
measurement (Left eye) → CT measurement (Right eye)
This manual is based on the measurement order (A).
In measurement order (A), reliability of the PD measured during REF measurement may be
lower than the PD value obtained in measurement order (B). This is because the patient’s head
may shift slightly during the longer interval between the right-eye and left-eye REF
measurements.
* The switching between the right and left eyes is automatically performed when the main body
is moved with the joystick and the eye to be measured is displayed on the screen.
)]
[When using the auto-shot function (
REF measurement takes place automatically when the instrument is best aligned and focuses on
the eye.
↓
After repeated REF measurements until median values (S, C, A) are obtained by taking the median
of the first 3 usable values, the letters “REF” in the upper right of the screen change to the
blinking letters “CT”.
Instruct the patient to slowly blink once or twice to make his/her corneal surface smooth and
optically clear.
↓
After confirming that the instrument is best aligned and in focuses on the eye, press the start
button to start CT measurement.
4 - 25
[When not using the auto-shot function (
)]
REF measurement takes place when the start button on the joystick is pressed.
Repeat the measurement until median values (S, C, A) are obtained by taking the median of
the first 3 usable values.
↓
After repeated REF measurements until median values (S, C, A) are obtained by taking the
median of the first 3 usable values, the letters “REF” in the upper right of the screen change to the
blinking letters “CT”. Instruct the patient to slowly blink once or twice to make his/her corneal
surface smooth and optically clear.
↓
After confirming that the instrument is best aligned and focuses on the eye, press the start
button to start CT measurement.
The captured image during CT measurement and
the “Edge Detection” dialog are displayed. Make
sure that a concentric ring image has no distortion
or irregular breaks.
If image-capturing failed, press the Retake
button to cancel analysis.
After the completion of the CT-captured image
analysis, the confirmation screen displays analysis
results.
In the lower left and right of the screen, the
thumbnails (reduced samples) of the iris
images obtained during REF measurement
(OPD Pupil) and CT measurement (CT Pupil)
are displayed. Pressing a thumbnail switches
the displayed image in the center of the screen
to the one of the selected thumbnail; this allows
the operator to view the iris at a higher scale.
To use the Torsion Error Detection (TED) function when performing refractive surgery with
the EC-5000, check if the iris image is usable enough to be subjected to the TED function.
(p.4-26).
8. Judging a captured image and detected ring edges.
Make a judgment based on the following conditions:
• No influence from patient’s blinking nor eyelashes
• Was the patient’s eye wide open?
• Did the eye shift and go out of focus?
• Were the ring-edges detected properly? (The detected edges are shown in red and yellow.)
If the captured image and detected edges are satisfactory ⇒ Press
.
If it is necessary to edit edges ⇒ Press
. See “5.8 Editing Detected Edges”.
The captured image and detected edges are not satisfactory ⇒ Press
.
4 - 26
Pressing
displays the “Placido Intensity”
dialog. Press
to return to the measurement
screen and perform measurement again.
If an iris of a blue eye etc. appears too bright on
a captured image, adjust the illumination
brightness for capturing with the dialog.
The adjusted brightness takes effect only for a single measurement just after the brightness
adjustment.
The placido ring will be illuminated for about 15 secs. before the second measurement to
prevent the patient who are surprised with the suddenly-illuminated placido ring from blinking
accidentally. It is possible to perform the measurement even while the placido ring is illuminated
or after the placido ring has shut off after approx.15 secs.
On the touch-screen panel, the latest AR values, and simulated KM values are shown.
Right/Left
The measuring eye is blinking.
REF measurement count
Latest AR values
(Right eye/Left eye)
Simulated KM values
Pressing
AR:3 Right
S
C
-1.25 -0.75
R1 R2
7.94 7.59
Latest values (The “Error No.” sign
may be shown if an error occurs during REF measurement)
KM:1
A
178
A
170
S
-1.25
R1
7.94
C
-0.75
R2
7.59
A
178
A
170
clears the displayed data.
NOTE
• The sign “E” may be shown next to the latest AR-measured values obtained in REF
measurement and displayed in the lower portion of the measurement screen. This sign
represents a lower reliability of the measured data.
This sign will be frequently shown in the case of keratoconus or a corneal transplant
due to a highly-irregular cornea.
AR:3
S
-1.25
R1
7.94
Right
C
-0.75
R2
7.59
KM:1
A
178E
A
170
S
-1.25
R1
7.94
C
-0.75
R2
7.59
A
178E
A
170
However, if the Print High RMS Data check box is unchecked on the Settings screen,
low-confidence measured data with the E sign is not displayed.
4 - 27
[REF measurement count]
When the auto-shot function is turned ON ⇒ On the condition that the instrument is bestaligned and focuses on the eye, REF measurement takes place repeatedly until median values
(S, C, A) are automatically obtained by taking the median of the first 3 usable values.
When the auto-shot function is turned OFF:
• When the “AI Mode” box is checked ( ) on the Settings screen:
⇒Pressing the start button once triggers the instrument to perform REF measurement a
single time.
Holding down the start button makes the instrument perform REF measurement
repeatedly until median values (S, C, A) are automatically obtained by taking the median
of the first 3 usable values.
• When the “AI Mode” box is not checked ( ) on the Settings screen:
⇒Pressing the start button once triggers the instrument to perform REF measurement a
single time.
While the start button is held down, the instrument keeps performing REF measurement.
If the “Single Fogging” box is checked throughout REF measurement, fogging is maintained
throughout repeated REF measurements.
9. Measure the other eye in the same manner.
10. After completion of measurement, press
or
.
Measured results are saved in the database simultaneously with printout. See “4.7.1 Printing
measured data” and see “4.8 Saving Measured Data”.
[When using the TED (Torsion Error Detection) function when performing refractive surgery
using the EC-5000]
To apply the data measured by the ARK-10000 to the TED (Torsion Error Detection) function
with the EC-5000, a proper iris image should be obtained in CT measurement. Check if the iris
image obtained in CT measurement is usable and applicable to the TED function on the
confirmation screen (Step 8) as instructed below.
1) Check the “TED Check” check box in
advance on the Settings screen.
See “5.9.1 Setting parameters”.
2) Perform CT measurement and check the
background color.
Green background ⇒ Applicable to the TED function.
Red background ⇒ Not applicable to the TED function.
Press
and perform CT
measurement again.
Check the color.
Green background ⇒ Usable
Red background ⇒ Not usable
White background ⇒ The “TED Check”
check box is not checked.
NOTE
• The confirmation result of whether the data is applicable to the TED function or not is
not saved in the database.
4 - 28
4.5.2 REF measurement
Only REF measurement (objective measurement of refractive error) takes place.
NOTE
• To obtain reliable measured values, be sure to read “APPENDIX C. OBTAINING
RELIABLE EXAM DATA” before examining a patient’s eye for the first time.
1. Turn ON the power.
The ARK-10000 starts up, and the measurement screen opens.
2. Set the measurement mode to the ARK/CT (
) mode.
Every time the measurement mode button (the second button from the left in the bottom) is
pressed, the measurement mode is alternately switched. See “4.3 Selecting the Measurement
Mode”.
3. Set the measurement type to REF (
).
Every time the measurement select button (in the lower left corner) is pressed, the selected
measurement type will be switched alternately. The symbol in the measurement select button
represents the currently-selected measurement.
4. Type in a patient’s ID and patient’s name.
See Step 4 of “4.5.1 REF and CT measurements”.
5. Prepare the patient.
See Step 5 of “4.5.1 REF and CT measurements”.
NOTE
• To relax the patient, explain the following before measurement: “This instrument
measures your eye to find which kind of lens fits you. The weak infrared ray used in
the measurements does not harm your eyes.”
6. Perform alignment and focusing.
See Step 6 of “4.5.1 REF and CT measurements”.
4 - 29
NOTE
• The dotted two-line circles on the measurement screen represent the innermost and outermost
(2-mm dia. and 6-mm dia.) zones to be “REF-measured”.
If a patient’s pupil is smaller than the outer circle, only data obtained within the
pupil is accurate. To obtain an OPD map of the entire 6-mm diameter, use a mydriatic
agent without cycloplegic effects under instruction of a physician.
In addition, if the eyelashes are on the innermost circle, the instrument may not
perform an accurate measurement. In such cases, instruct the patient to open his or
her eye wider.
7. Perform REF measurement.
[When using the auto-shot function (
)]
The measurement takes place automatically when the instrument is best aligned and focuses
on the eye.
[When not using the auto-shot function (
Press the start button on the joystick.
)]
REF measurement takes place.
On the touch-screen panel, the latest AR values are shown.
Right/Left
The measuring eye is blinking
REF measurement count
Latest AR values
(Right eye/Left eye)
Pressing
AR:3 Right KM:0
A
S
C
-1.25 -0.75 178
R1 R2
A
0.00 0.00 0
Latest values (The “Error No.” sign
may be shown if an error occurs
during the measurement)
S
-1.25
R1
0.00
C
A
-0.75 178
R2
A
0.00 0
clears the displayed data.
NOTE
• The sign “E” may be shown next to the latest AR-measured values in the lower portion
of the measurement screen. This sign represents lower reliability of the measured
data. This sign will be frequently shown in the case of keratoconus or a corneal transplant
due to a highly-irregular cornea.
AR:3 Right KM:0
A
S
C
-1.25 -0.75 178E
R1 R2
A
0.00 0.00 0
S
C
A
-1.25 -0.75 178E
R1 R2
A
0.00 0.00 0
However, if the Print High RMS Data check box is unchecked on the Settings screen,
low-confidence measured data with the E sign is not displayed.
4 - 30
[REF measurement count]
When the auto-shot function is turned ON ⇒ REF measurement automatically takes place in
succession on the condition that the instrument is best aligned and focuses on the eye until
median values (S, C, A) are automatically obtained by taking the median of the first 3 usable
values.
When the auto-shot function is turned OFF:
• When the “AI Mode” box is checked ( ) on the Settings screen
⇒ Pressing the start button once triggers the instrument to perform REF measurement a
single time.
Holding down the start button makes the instrument perform REF measurement
repeatedly until median values (S, C, A) are obtained by taking the median of the first
3 usable values.
• When the “AI Mode” box is not checked ( ) on the Settings screen
⇒ Pressing the start button once triggers the instrument to perform REF measurement a
single time. While the start button is held down, the instrument keeps performing REF
measurement.
If the “Single Fogging” box is checked, fogging is maintained throughout repeated REF
measurements.
8. Measure the other eye in the same manner.
9. After the completion of measurement, press
or
.
Measured values are saved in the database simultaneously with printout. See “4.7.1 Printing
measured data” and see “4.8 Saving Measured Data”.
4 - 31
4.5.3 CT measurement
Only CT measurement (Corneal Topography measurement) is performed.
NOTE
• To obtain reliable measured results, be sure to read “APPENDIX C. OBTAINING
RELIABLE EXAM DATA” (at the end of this book) before examining a patient’s eye
for the first time.
1. Turn ON the power.
The ARK-10000 starts up, and the measurement screen opens.
2. Set the measurement mode to the ARK/CT (
) mode.
Every time the measurement mode button (the second button from the left in the bottom) is
pressed, the measurement mode is alternately switched. See “4.3 Selecting the Measurement
Mode”.
3. Set the measurement type to CT (
).
Every time the measurement select button (in the lower left corner) is pressed, the selected
measurement type will be switched alternately. The symbol in the measurement select button
represents the currently-selected measurement.
4. Type in a patient’s ID and patient’s name.
See Step 4 of “4.5.1 REF and CT measurements”.
5. Set up the patient for measurements.
See Step 5 of “4.5.1 REF and CT measurements”.
NOTE
• To relax the patient, explain the following before measurement: “This instrument
measures the corneal shape. The red light used in the measurements does not harm
your eyes.”
6. Perform alignment and focusing.
See Step 6 of “4.5.1 REF and CT measurements”.
4 - 32
7. Perform measurements.
[When using the auto-shot function (
)]
Press the start button of the joystick (During CT measurement, the auto-shot function is
disabled.)
[When not using the auto-shot function (
)]
Press the start button on the joystick.
CT measurement takes place.
The captured image during CT measurement and
the “Edge Detection” dialog are displayed. Make
sure that the concentric ring image has no
distortion or irregular breaks.
If image capturing failed, press the Retake
button to cancel the analysis.
After the completion of CT-captured image
analysis, the confirmation screen displays
analysis results.
In the lower right of the screen, the thumbnail
(reduced samples) of the iris image obtained
during CT measurement (CT Pupil) is
displayed. Pressing the thumbnail switches the
displayed image in the center of the screen to
the one of the thumbnail; this allows the
operator to view the iris at a higher scale.
To use the Torsion Error Detection (TED) function before performing refractive surgery with
the EC-5000, check if the iris image is usable enough to be applied to the TED function. (p.426).
4 - 33
8. Judge the captured image, and ring edge
detection result.
Make a judgment based on the following
conditions:
• No influence from patient’s blinking nor
eyelashes
• Was the patient’s eye wide open?
• Do ring-edges appear distorted by excess tears?
• Did the eye shift from the measuring position (misalignment)?
• Were the ring-edges detected properly? (The detected edges are shown in red and yellow.)
If the captured image and detected edges are satisfactory ⇒ Press
.
If it is necessary to edit edges ⇒ Press
. See “5.8 Editing Detected Edges”.
If the captured image and detected edges are
not satisfactory ⇒ Press
.
Pressing
displays the “Placido Intensity”
dialog. Press
to return to the
measurement screen and perform the
measurement again.
If an iris of a blue eye etc. appears too bright on the captured image, adjust the illumination
brightness for capturing with the dialog. The adjusted brightness takes effect only for a single
measurement just after the brightness adjustment.
The placido ring will be illuminated for about 15 secs. before the second measurement to
prevent the patient who are surprised with the suddenly-illuminated placido ring from blinking
accidentally. It is possible to perform the measurement even while the placido ring is
illuminated or after the placido ring has shut off after approx.15 secs.
On the touch-screen panel, the simulated KM values are shown.
Simulated KM values
Pressing
AR:0 Right
S
C
0.00 0.00
R1 R2
7.94 7.59
KM:1
A
0
A
170
S
0.00
R1
7.94
C
A
0.00 0
R2
A
7.59 170
clears the displayed data.
9. Measure the other eye in the same manner.
10. After the completion of measurement, press
or
.
Measured results are stored in the database simultaneously with printout. See “4.7.1 Printing
measured data” and see “4.8 Saving Measured Data”.
4 - 34
4.5.4 Measurement using mydriatic agent (during REF and CT
measurements or REF measurement)
If a pupil is smaller than the outer circle, only the obtained data within the pupil is accurate. The
automatic fogging applied to the scenery chart during automatic refraction is for releasing the
straining eye. This fogging, however, may temporarily cause the patient’s pupil to reduce. For
the reason, during the initial shot of the automatic refraction, patient’s pupil may not fully be
enlarged.
In such cases, take three or four shots of REF measurements in succession by holding down the
start button. If the patient’s pupil is still smaller than the outer circle after several shots of REF
measurements, use a mydriatic agent under an instruction of the physician.
4 - 35
4.6 Viewing Maps (Map View)
There are two methods to display measured results in color maps.
. Displaying measured data in color maps just after measurement
See “4.6.1 Displaying a map via the measurement screen”.
. Retrieving measured data from the database and displaying it in color maps
See “4.6.2 Retrieving an exam from the database and displaying it in a map”.
* The “Difference” map that displays the difference in measured data between two different
Exam Nos. can be displayed only in the case of . See “5.4 Displaying the Difference Map”.
* Color maps are displayed in a map layout (number of map, placement, map types and so on)
specified in advance.
In the case of .… Maps are displayed in the map layout of “View 1”
In the case of .…Maps are displayed in a selected map layout from among “View 1”,
“View 2” and “View 3”
The “Map View” screen can include six maps
at the maximum. However, because six maps
do not fit inside the window at a time, view
all six maps in a window by scrolling through
them vertically.
Map set name
Scroll arrow
(Used to move upward one map)
Scroll bar
Scroll arrow
(Used to move downward one map)
4.6.1 Displaying a map via the measurement screen
Press
on the measurement screen.
The screen switches to the “Map View” screen
and the latest measured data is displayed in
color maps with the map layout of “View 1”.
Used to return to the measurement screen
4 - 36
4.6.2 Retrieving an exam from the database and displaying it in
a map
An exam which is saved in the database can be called up and displayed on a map on the screen.
This allows you to view maps obtained on different dates at the same time, and to make a
comparison between them.
1. Open the Patient Selection screen.
Press
on the measurement screen in the
ARK/CT mode.
2. Press a desired patient’s data line to display
it on the maps.
Pressing an item name on the upper part of the
screen (ID, Name, Sex, Group, Last Exam Date)
sorts the data in ascending order within the item
field. Pressing the item name once again sorts
(ascending
the data in descending order.
order) or (descending order) on an item name
indicates the item on which the sort order is
based.
To retrieve desired data, use the “Search Patient
Data” dialog. See “[“Search Patient Data”
dialog]” for details (p.3-13).
1) Press
to open the “Search Patient Data”
dialog.
2) Enter a desired specification in a
corresponding field and press
.
To return the screen to its original status (before searching), press
on the “Search Patient
Data” dialog to return the specifications to the initial ones, and then press
.
NOTE
• If “Save search specifications even after shutdown” check box is checked, the data
searched with the dialog will be saved even after shutdown.
• The Patient Selection screen cannot list more than 5,000 items of patient data. If the
patient number exceeds 5,000, enter a specification to narrow the scope of a search.
4 - 37
3. Confirm the “Map Selection” field on the right side of the screen.
Select “View 1”, “View 2” or “View 3” whose map types and layout suit your preference.
It is possible to change a map set assigned to “View 1”, “View 2” or “View 3” seeing “
[“Map Selection” area]” (p.3-11).
of
4. If the patient has multiple items of measured
data (exam), select an exam to be displayed
on the maps.
1) Multiple exams of the patient’s data are
listed in the bottom area of the screen. Press
a desired exam line.
When displaying multiple exams at a time,
go to Steps 2) and 3). In the other cases, go
to Step 5.
2) Press a map position on which the selected
exam is displayed.
Designate a map button in the “Map
Selection” area on the right. The designated
map button No. will be entered in the “Map
No.” box.
3) Repeat Steps 1) and 2) to select exams to be
displayed, and each map position.
Map button
5. Press
.
The screen is switched to the Map View screen
and the maps are displayed in the selected
manner.
Used to return to the
Patient Selection screen
4 - 38
4.6.3 Displaying a map on another map set
Select a map set from the entered map sets to choose the number of maps to be displayed and
where to locate individual maps.
As for the method of entering a map set, see “5.2.1.2 Entering a new map set”.
1. Press
or
on the Map View screen.
The map set selection screen opens.
⇒ For selecting a map set from the entered
sets with both eyes displayed
⇒ For selecting a map set from all the
entered map sets
Pressing the map set name shown in the upper
part of the Map View screen corresponds to the
pressing of
.
Map set name
2. Select a desired map set.
The screen returns to the Map View screen
where maps are displayed in the selected map
set.
NOTE
• A selected map set displayed on the Map View screen by the above steps is temporarily
applied. The above operation does not change the specifications for “View1”, “View2”,
or “View3”. The selected map set will be reset back to the specified map on the Map
View Settings screen once you select another patient or turn OFF the instrument.
4 - 39
4.6.4 Switching between the right eye and left eye
A displayed color map can be switched between the right and left eyes.
Two switching methods are available: Switching the eyes of all displayed maps, and switching
the eyes for each individual map.
* The switching of eyes is available only when exams of both eyes are saved with the same
Exam No.
[Switching the eyes of all the displayed maps]
Press
on the Map View screen.
Eyes are switched throughout all the displayed maps.
However, when both left and right maps are simultaneously displayed, either the right-eye or
left-eye map only will be displayed.
[Switching eyes for each individual map]
Measuring eye indication
Press the measuring eye indication (“Right”
or “Left”) on a desired map in the Map View
screen.
The eye is switched in the map.
NOTE
• Switching of eyes on the Map View screen is temporary. The eye will be reset back to
the preset ones once you select another patient or turn OFF the instrument.
4 - 40
4.7 Printing
4.7.1 Printing measured data
After the completion of measurement, the printout of the measured values is started by the
built-in printer by pressing
or
on the measurement screen.
The converted values from CT-measured results into keratometry values, and Auto Refraction
measured values are printed out.
also saves measured results into the database automatically.
In the ARK/CT mode, pressing
When the measured results have been saved, the button changes into
. (If a patient is not
selected or the patient’s name has not been entered prior to measurement, the “Select Patient”
dialog opens. To print the measured results and save them in the database, select a patient or
enter data of the patient and press
. To print the measured results without saving them in
the database, press
.)
NOTE
• After measurement,
is marked by a small circle in its upper right (
). This
shows that the measured results have already been saved in the memory temporarily.
Printout of the measured results is possible when the button is shown as
or
.
• After printing, former data in the memory will automatically be cleared when the next
measurement has begun.
• Do not touch the printer paper while the printer is working.
Inconsistencies in density of the printout may result.
• If the measured data of only one eye has been measured, or if the performed measurement
type is different between the right and left eyes, the warning dialog is displayed after
or
is pressed.
To finish measurement and print out the measured data ⇒ Press the OK button.
To continue measurement without printing out the measured data ⇒ Press the Cancel
button.
• In the sample printout on the next page, AR-measured data and KM-measured
(keratometry) data for the right eye and then AR-measured data and KM-measured
data for the left eye are printed in order. It is also possible to change the order of the
printed data (In the order of AR-measured data for the right eye, AR-measured data for
the left eye, KM-measured data for the right eye and KM measured data for the left
eye) by changing the corresponding parameter setting. See “5.9.1 Setting parameters”.
• The sign “E” may be printed next to AR-measured data. This sign represents lower
reliability of the measured data. (If the Print High RMS Data check box is unchecked
on the Settings screen, low-confidence measured data with the E sign is not printed
out.)
4 - 41
[Sample printout (ARK mode)]
Patient No.
Patient name, Sex (M/F)
Date and time of measurement
Vertex distance
Auto Refraction (AR) values
AR median values
Simulated keratometry values
R1: Flattest meridian, R2: Steepest meridian
AVE: Average of R1 and R2
CYL: Corneal astigmatism and cylinder axis
angle
[Sample printout (ARK/CT mode)]
PD value
(Right-eye monocular PD, Left-eye monocular PD)
(The monocular PDs are measured only
when the start button is pressed when the
main body is aligned with the middle of the
nose bridge.)
Patient ID
Patient name, Sex (M/F)
Date and time of measurement
Vertex distance
Auto Refraction (AR) values
AR median values
Simulated keratometry values
R1: Flattest meridian, R2: Steepest meridian
AVE: Average of R1 and R2
CYL: Corneal astigmatism and cylinder axis
angle
PD value
(Right-eye monocular PD, Left-eye monocular PD)
(The monocular PDs are measured only when the
start button is pressed when the main body is
aligned with the middle of the nose bridge.)
4 - 42
4.7.2 Printing color maps
The use of an optional color printer permits a color map to be printed out.
1. Press
on the Map view screen.
The “Select Printer Device” dialog opens.
If a measured result is not saved in the database,
the button is symbolized as
. Pressing the
button starts printout and simultaneously, saves
a measured result in the database.
(If the patient has not been selected yet or the
patient’s data has not been entered prior to
measurement, the “Select Patient” dialog
opens. Select a patient or enter data of the
patient and press
. The data (patient’s data
and exam) will be saved in the database.
.
2. Press
A color map printed in the preset layouts of “View”; The map will not always be printed in the
displayed layout.
[Checking a layout to be applied to a printed color map]
Layouts to be applied to printed maps can be
checked in the “Map Selection” area of the
Patient Selection screen.
button on the
right side of each “View” radio button shows
whether the “View” will be applied to printed
maps or not.
⇒ The layout will be applied to
printed maps.
⇒ The layout will not be applied to
printed maps.
Shows a layout to be applied
to a color map on the Map
View screen
Layout of “View 1”
Layout of “View 2”
Layout of “View 3”
Whether or not a map is to be printed in the layout is shown. In this case, the map is printed in
the “View 1” layout and “View 2” layout.
[Designating a layout to be applied to a printed color map]
Designate a layout to be applied to a printed map from among “View 1”, “View 2” and “View
3” as instructed below. A designation of multiple items of “View” is allowed.
in the “Map Selection” area of the Patient Selection
Temporary designation: Press
screen to designate. The designation will be cleared once you select another patient’s data.
See (p. 3-12).
Permanent designation: Check “ Print Out” on a desired “View” page of the Map View
Settings screen to apply the “View” to a printed map. See “5.2.1.1 Assigning an entered
map set to “View1”, “View2” or “View3” ”.
4 - 43
4.8 Saving Measured Data
After the completion of the measurement in the ARK/CT mode, a measured result is saved
in the database by pressing
on the measurement screen simultaneously with a printout
of the measured result.
See “4.7 Printing”.
Only the latest data when
is pressed is saved in the database.
When the patient has not been selected or the patient’s data (parameters) was not entered
before measurement, the “Select Patient” dialog opens. Select a patient, or enter data of the
patient. See Step 4 on p.4-19.
Likewise, printing a color map after measurement (pressing
on the Map View screen)
saves the measured result in the database.
NOTE
• If the measured data of only one eye has been measured, or if the performed measurement
type is different between the right and left eyes, the warning dialog is displayed after
is pressed.
To finish measurement and saving the measured data ⇒ Press the OK button.
To continue measurement without saving the measured data ⇒ Press the Cancel
button.
• If the amount of misalignment during measurements is 0.3 mm or more, pressing the
button displays the following warning dialog against the misalignment.
It is recommended to press the Cancel button and re-measure the eye.
To finish measurements and save the measured data, press the OK button.
§5
HANDLING ADVANCED FUNCTIONS MORE EFFICIENTLY
This section explains more advanced functions to allow you to use the ARK-10000 more
efficiently:
Displayable maps ⇒ 5.1 Color Maps
Specifying usually-applied map sets
⇒ 5.2.1 Setting “View 1”, “View 2” and “View 3”
Setting an usually-applied color scale ⇒ 5.2.2 Setting a color scale
Displaying PSF ⇒ 5.2.3 Displaying PSF
Changing a currently-displayed map on the Map View screen
⇒ 5.3 Changing Displayed Maps
Zooming in on a map ⇒ 5.3.4 Zooming in on a map
Checking the distance between two points on a map
⇒ 5.3.5 Checking the distance between two points
Displaying the Difference map ⇒ 5.4 Displaying the Difference Map
Manually measuring the PD ⇒ 5.5 Manual Pupillary Distance (PD) Measurement
Importing external data obtained by another ARK-10000 unit
⇒ 5.6.1 Importing external data into the database
Outputting measured data to an external device
⇒ 5.6.2 Outputting an exam from the database
Editing and deleting an exam in the database ⇒ 5.6.3 Editing data
Backing up the database ⇒ 5.6.4.1 Backing up the database
APPENDIX. D BEFORE FIRST BACKUP PROCEDURES
Outputting a map’s numerical data ⇒ 5.7.1 Outputting numerical data from a map
Outputting a map’s image data ⇒ 5.7.2 Outputting map images
Editing detected edges of a CT-captured image
Setting the parameters
⇒ 5.8 Editing Detected Edges
⇒ 5.9.1 Setting parameters
Setting date and time ⇒ 5.9.2 Setting date and time
5-2
5.1 Color Maps
11 types of maps and eye image captured during CT measurement are available:
5.1.1 Axial map
This map shows by the equation below converted refractive powers
(of the analyzed image captured during CT measurement) from
the corneal curvature radiuses which were obtained with respect
to an optical axis of the cornea (CT axis) in the same manner as a
general keratometer.
337.5
P (Corneal refractive power) =
Map title
Measuring eye
This mark moves in accordance with
the value of the cursor position.
Represents a specified color
scale.
Norm : Normalize
Indv : Individual
Com : Common
Number : Increment
Adj: Adjustable
Com : Common
Number: Increment
Abs.: Absolute
S-K 1.5: Smolek- Klyce [1.5D]
26: Absolute [26]
r [Corneal curvature]
Measurement date and time , Exam No.
Cross cursor
Can be moved to a desired position. Values at the cursor position
are shown in the lower right corner
of this map.
Indicates values at the cursor position.
Corneal refractive power of Axial
(Curvature radius),
Distance from the center to the cross
cursor@Angle
Amount of misalignment
Distance to the corneal vertex
from the measurement light @Angle
(See the footnote on p.5-3.)
Amount of misalignment
Comment (Enter on the Edit Exam
Information screen.)
0 < Amt. of misalignment < 0.3
0.3 < Amt. of misalignment < 0.4
0.4 < Amt. of misalignment
Color of
letters
Green
Yellow
Red
SIM K’s data: From the upper item,
Refractive power of the steepest meridian (Curvature radius)@Angle,
Refractive power of the flattest meridian (Curvature radius)@Angle,
dk: Difference in refractive powers between the flattest meridian and
the steepest meridian (Curvature radius mm)
About SIM K’s
A general keratometer measures the central cornea. (3 mm dia. zone) It also calculates curvature
radiuses of each steepest meridian and flattest meridian which cross each other at right angles
and corneal refractive powers. With a closer method, SIM K’s values are curvature radiuses
and refractive powers along the meridians which cross each other at right angles calculated
based on the data in a 3mm dia. zone of the Axial map.
About color scale
The Axial map color-codes corneal refractive powers or curvature radiuses. The higher the
refractive powers become (smaller curvature radiuses), the warmer the colors on the map
become; The lower the refractive powers become (larger curvature radiuses), the cooler the
colors on the map become.
5-3
5.1.2 Instantaneous map
The Instantaneous map shows corneal curvature radiuses calculated from shapes between infinitesimal
intervals along meridians whereas the Axial map shows corneal curvature radiuses calculated with
respect to a measuring light axis. For this reason, the Instantaneous map reflects more partial corneal
curvatures (shapes) than the Axial map.
This Instantaneous map is also called a Tangential map.
The conversion equation into corneal refractive powers is the same as that for the Axial map.
Ra: Axial radius (mm)
Ri: Instantaneous radius (mm)
Da: Axial power
Da = 1000 × (n-1)/Ra
Di: Instantaneous power
Di = 1000 × (n-1)/Ri
n: Corneal refractive index (1.3375)
Refractive index of the entire cornea
(Cornea Index A)
The Instantaneous map that presents subtle changes in corneal surface is suitable for checking
patients’ eyes for early-stage keratoconus etc.
This mark moves in accordance with
the value of the cursor position.
Represents a specified color
scale.
Norm : Normalize
Indv : Individual
Com : Common
Number : Increment
Adj: Adjustable
Com : Common
Number: Increment
Abs.: Absolute
S-K 1.5: Smolek- Klyce [1.5D]
26: Absolute [26]
Map title
Measuring eye
Measurement date and time , Exam No.
Cross cursor
Can be moved to a desired position. Values at the cursor position are shown in the lower
right corner of this map.
Indicates values at the cursor
position:
Corneal refractive power of Instantaneous (Curvature radius),
Distance from the center to the
cross cursor@Angle
Amount of misalignment
Distance to the corneal vertex
from the measurement light @Angle*10
Color of
Amount of misalignment
letters
Values calculated from the data over 3 mm dia. circle: From the upper item, Comment (Input on the
0 < Amt. of misalignment < 0.3 Green
Refractive power of the steepest meridian (Curvature radius)@Angle,
Edit Exam Information 0.3 < Amt. of misalignment < 0.4 Yellow
0.4 < Amt. of misalignment
Red
Refractive power of the flattest meridian (Curvature radius)@Angle,
screen.)
dk: Difference in refractive power between the flattest meridian and the
steepest meridian (curvature radius mm),
About color scale
The Instantaneous map color-codes corneal refractive powers or curvature radiuses. The
higher the refractive powers become (smaller curvature radiuses), the warmer the colors on the map
become; The lower the refractive powers become (larger curvature radiuses), the cooler the colors
on the map become.
*10 If the amount of misalignment could not be detected, the following characters are shown in
red:
“Offsets:---@---” ⇒ The amount of misalignment could not be detected during the measurement.
“Offsets: No data” ⇒ The data had been obtained with the program V1.11 or earlier and it has
no information of the amount of misalignment.
5-4
5.1.3 “Refractive” map
This map shows the distribution of corneal
refractive powers calculated by Snell’s law. The
calculated refractive powers with 1.3760 of the
corneal refractive index is closer to the real
refractive power. This map is displayed based
on the refractive powers converted into Dc (in
the air). The distribution of corneal refractive
powers tells the degree of spherical aberration.
This map helps the operator know the degree that
errors in corneal shape adversely affect refractive
powers.
De (in the eye)=1000/L
Dc (in the air)= n × De
n: Corneal refractive index (1.376)
Refractive index of the real
cornea (Cornea Index B)
The “Refractive” map allows the operator to check the amount of correction by comparing
preoperative and postoperative “Refractive” maps. (Although this comparison involves some
errors because the measuring light axis may vary among measurements.)
Map title
Measuring eye
This mark moves in accordance with the value of the
cursor position.
Represents a specified color
scale.
Norm: Normalize
Indv: Individual
Com: Common
Number: Increment
Adj: Adjustable
Com: Common
Number: Increment
Abs.: Absolute
S-K 1.5: Smolek- Klyce [1.5D]
26: Absolute [26]
Comment (Input on the Edit Exam
Information screen.)
Measurement date and time, Exam No.
Cross cursor
Can be moved to a desired
position. Values at the cursor position are shown in the
lower right corner of this map.
Indicates values at the cursor
position:
Corneal refractive power,
Distance from the center to the
cross cursor@Angle
Amount of misalignment
Distance to the corneal vertex
from the measurement light @Angle
(See the footnote on p.5-3.)
Amount of misalignment
0 < Amt. of misalignment < 0.3
0.3 < Amt. of misalignment < 0.4
0.4 < Amt. of misalignment
Color of
letters
Green
Yellow
Red
Values calculated from the data over 3 mm dia. circle: From the upper item,
Refractive power of the steepest meridian@Angle,
Refractive power of the flattest meridian@Angle,
dk: Difference in refractive power between the flattest meridian and the
steepest meridian
About color scale
The “Refractive” map color-codes corneal refractive powers. The higher refractive powers
become, the warmer the colors on the map become; The lower refractive powers become, the
cooler the colors on the map become.
5-5
5.1.4 Elevation map
This map shows the differences in elevation between a reference sphere and the cornea that
intersect with each other. Generally, Best Fit Sphere*11 is applied as the reference sphere. The
reference sphere value is changeable. (See p.5-8.)
This map, showing the differences in elevation from the reference sphere allows the operator to
check astigmatic components in shape. This map also indicates the progress of keratoconus
with protrusions from the reference sphere.
In the case of keratoconus, protrusions from the reference sphere are shown in red. Upward
protrusions from the reference sphere are warm-colored, and downward protrusions from the
reference sphere are cold-colored.
The scroll bar permits the user to view the map
from different directions. Adjusting the
“Elevation Scale” in the bottom of the display is Sliding the slider rightward enlarges an image in the
direction of elevation.
used to change the magnification in elevation.
The Elevation map is displayed in either of three display modes: Wire Frame, color 2D, color
3D. The display mode can be selected for each individual map.
Wire Frame
Map title
Measured eye
Measurement date and time,
Exam No.
Magnification elevation
Color scale
Also functions as a vertical scroll
bar. Press or move a finger or a
pen along the scale to use the
scroll bar.
Represents a specified
scale.
Norm : Normalize
Indv : Individual
Com : Common
Number : Increment
Adj: Adjustable
Com : Common
Number: Increment
color
Pressing here permits you
to change a reference
sphere.
BFS: Radius of Best Fit Sphere as the reference sphere (mm)
φ: Area to which Best Fit Sphere is applied
If the “Hidden Line” option is checked, the
reverse side of the wire frame is invisible.
When “Hidden Line” is checked
5-6
Color 2D
Represents height distribution in colors. The right side of the map corresponds to the 0º
direction and the upper side of the map corresponds to the 90º direction.
Measurement date and time,
Exam No.
Map title
Measured eye
Applicable area of Best Fit
Sphere
This mark moves in accordance
with a value of the cursor position.
Represents a specified
scale.
Norm : Normalize
Indv : Individual
Com : Common
Number : Increment
Adj: Adjustable
Com: Common
Number: Increment
color
Pressing here permits you
to change the reference
sphere.
Vertex of Best Fit Sphere
(Small white cross)
Indicates values at the cursor
position.
Difference in height between
the reference sphere and cornea
Distance from the center to
the cross cursor@ Angle
BFS: Radius of Best Fit Sphere as the reference sphere (mm)
φ: Area to which Best Fit Sphere is applied
Color 3D
Map title
Measured eye
Measurement date and time,
Exam No.
Magnification in elevation
Color scale
Also functions as a vertical scroll
bar. Press or move a finger or
a pen along the scale to use the
scroll bar.
Represents a specified
scale.
Norm : Normalize
Indv : Individual
Com : Common
Number : Increment
Adj: Adjustable
Com : Common
Number: Increment
color
Pressing here permits you
to change the reference
sphere.
BFS: Radius of Best Fit Sphere as the reference sphere (mm)
φ: Area to which Best Fit Sphere is applied
*11 The Best Fit Sphere is a sphere that best fits on an applicable corneal area.
A default value is automatically entered; With the default, the largest possible circle is set
whose 60% or more area is effective (not obstructed by eyelash etc.) for data acquisition and
whose center is the measuring light axis.
5-7
The scroll bar permits you to view the map
from a different direction. The vertical scroll
bar also functions as the color scale. Press or
move a finger or a pen along the scroll bar to
use the scroll bar.
Scroll bar
Selecting a display mode and options for the Elevation map
Select a display mode and options by opening the “Select Map Type/Pattern” dialog via the
Map View screen, or select on the Map View Settings screen.
[Selecting in the “Select Map Type/Pattern” dialog]
See “5.3.1 Changing map types and
overlay options.
Select the radio button of a desired display mode.
Select an option as necessary.
[Selecting in the Map View Settings screen]
See “5.2.1 Setting “View 1”, “View 2”
and “View 3””.
Select the radio button of a
desired display mode.
Select options as necessary.
[Options]
Hidden Line: Makes the reverse side of the wire frame invisible. (Only in the case of “Wire
Frame”)
Cross Cursor: Dragging the cross cursor displays refractive power (Pwr), corneal curvature
radius (Rad), distance from the center (Dist), and Axes at the cursor position.
(Only for color 2D)
Border Line: This is for setting whether or not to draw boundaries in black. (Only for color
2D and color 3D)
Grid:
Sections (1-millimeter squares), the corneal vertex point, and the point of
measuring light axis (only for the color 2D)
5-8
NOTE
• Changes to the display mode or options for the Elevation map in the “Select Map
Type/ Pattern” dialog via the Map View screen are temporarily applied. The changed
displayed mode or options will be reset back to as before the changes once you select
another patient or you turn OFF the instrument.
[Changing the reference sphere]
The Elevation map is displayed with respect to the Best Fit Sphere, the reference sphere. The
reference sphere may be changed by changing the area to which the Best Fit Sphere is applied or
by specifying the radius of the reference sphere:
Changing the area to which the Best Fit Sphere is applied:
1) Click
in the Elevation map.
The “Best Fit Sphere” dialog is displayed.
Diameter of target area
(mm)
2) Enter a desired diameter (mm) of the target
.
area in the “Zone” field and press
The Elevation map is displayed with respect to the Best Fit Sphere, the reference sphere,
with the entered diameter.
To return the entered values in the “Zone” and “BFS” fields back to the defaults, press
on the right.
Specifying the radius of the reference sphere:
1) Click
in the Elevation map.
The “Best Fit Sphere” dialog is displayed.
When a value is entered, the title will
change from “BFS” to “RefSphere”.
Radius of reference sphere
(mm)
2) Enter a desired radius (mm) of the reference
sphere in the “BFS” field and press
.
The Elevation map is displayed with respect to the reference sphere with the entered radius.
To return the entered value back to the default of the Best Fit Sphere, press
on the
right of the “RefSphere” field.
5-9
5.1.5 Eye image
Captured image during CT measurement with an eye image overlaid.
Allows the operator to check the state of alignment and focusing.
Map title
Measuring eye
Date and time of measurement, Exam No.
Cross cursor
Can be moved to a desired position. Values at
the cursor position are shown in the lower right
corner of this map.
Indicates values at the cursor position.
Distance from the center to the cross cursor@
Angle
Amount of misalignment
Distance to the corneal vertex
from the measurement light @Angle
(See the footnote on p.5-3.)
Amount of misalignment
Comment (Input on the Edit Exam Information screen.)
0 < Amt. of misalignment < 0.3
0.3 < Amt. of misalignment < 0.4
0.4 < Amt. of misalignment
Color of
letters
Green
Yellow
Red
When the “Pupil Contour” overlay option is selected, the map displays a pupil image instead of
a captured placido image. (See p. 5-60.)
The “Photopic” option is selected ⇒ Photopic pupil image (Pupil
image captured during CT measurement)
The “Mesopic” option is selected ⇒ Mesopic pupil image (Pupil image
captured during REF measurement
Pupil outline
Violet outline:
Photopic pupil outline
Cyan outline:
Mesopic pupil outline
Photopic: Photopic pupil size
(during CT measurement)
Mesopic: Mesopic pupil size
(during REF measurement)
MPDist: Distance between
the photopic pupil center
and mesopic pupil
center@angle
Pupil center
Violet cross: Photopic pupil center
Cyan cross: Mesopic pupil center
PDst: Distance between the corneal reflex
spot and the photopic pupil center@Angle
MDist: Distance between the corneal reflex
spot and the mesopic pupil center@Angle
When the “Pupil Contour” and “Photopic” overlay options are selected:
5 - 10
5.1.6 OPD map
This map represents the distribution of refractive errors obtained by REF measurement, showing
the amount to be corrected at respective points in a 6mm-dia. zone on the cornea. (In detail, this
map shows the distribution of refractive errors of an eyeball including the corneal crystalline
lens and vitreous body to be corrected when you correct the eye into emmetropia.)
A conventional auto refractometer measures refractive powers of the central eye only, whereas
the ARK-10000 measures refractive powers of peripheral areas of an eye, which allows the
operator to view refractive power distribution.
The OPD map also shows optical aberrations etc.
The data on the map is calculated when the VD (Vertex Distance) is zero (fixed).
“S” (SPH), “C” (CYL) and “A” (AXIS) values shown in the lower left corner of this map are
calculated when the VD is the set value on the “Settings” screen.
Map title
Date and time of measurement, Exam No.
This mark moves in accor- Measured eye
dance with the value at the
cursor position.
Cross cursor
Can be moved to a desired position. Values at the cursor position are shown in the lower right
corner of this map.
Shows the measured data of
the refractive powers of the
central eye (AR-measured
data). If RMS is 1 or higher,
the characters are shown in
yellow with the “High RMS”
indication.
Indicates values at the cursor
position:
Refractive power of OPD
(VD=0: Fixed),
Distance from the center to the
cross cursor@Angle
Amount of misalignment
Represents a specified color
Distance to the corneal vertex
scale.
from the measurement light @Angle
Norm : Normalize
(See the footnote on p.5-3.)
Indv : Individual
Color of
Amount of misalignment
letters
Com : Common
0 < Amt. of misalignment < 0.3 Green
Number : Increment
0.3 < Amt. of misalignment < 0.4 Yellow
0.4 < Amt. of misalignment
Red
Adj: Adjustable
Comment (Enter on the
Com : Common
Edit Exam Information Sphero-cylindrical parameters (S, C, and A) calculated from the data over
Number: Increment screen.)
3mm dia. and 5mm dia. circles are obtained by the fitting of each circle
(least squares method). (Data is shown in yellow if no pupil outline is obtained.)
These approximate S, C and A values alone do not tell the actual refractive error distribution. The reliability of these values is expressed by RMS
(Root Mean Square fit error). The reliability decreases with the increasing
value of RMS, and the RMS of 0 means that the refractive error distribution is expressed perfectly by the sphero-cylindrical parameters. The RMS
of a regular astigmatic eye is less than about 0.5. An eye whose RMS is
higher than 0.5 is regarded as an eye with an irregular astigmatism.
360
RMS =
{D (θ ) − D (θ )}
∑
θ
=1
2
real
SCA
[ Dptr ]
360
About the color scale
The OPD map color-codes the distribution of total refractive powers of the eye corrected into
emmetropia. The higher refractive errors of the myopic eye become, the warmer the map
colors become; The higher refractive errors of the hyperopic eye become, the cooler the map
colors become.
5 - 11
5.1.7 Target “Refractive” map
The sum of the data on the “Refractive” map and that on the OPD map. This map shows the
distribution of corneal refractive powers of an eye corrected into emmetropia.
This mark moves in accordance with
the value of the cursor position.
Map title
Measured eye
Date and time of measurement, Exam No.
Cross cursor
Can be moved to a desired
position. Values at the cursor position are shown in the
lower right corner of this map.
Represents a specified color scale.
Norm : Normalize
Indv : Individual
Com : Common
Number : Increment
Adj: Adjustable
Com : Common
Number: Increment
Abs.: Absolute
S-K 1.5: Smolek- Klyce [1.5D]
26: Absolute [26]
Comment (Enter on the Edit
Exam Information screen.)
Indicates values at the cursor
position:
Corneal refractive power
Distance from the center to the
cross cursor@Angle
Values calculated from the data over 3mm dia.
circle: From the upper item,
Refractive power of the steepest meridian @Angle
Refractive power of the flattest meridian @Angle
dk: Difference in refractive power between the flattest meridian and the steepest meridian
(Data is shown in yellow if no pupil outline is obtained.)
Amount of misalignment
Distance between the corneal vertex
during CT measurement and that during REF measurement@Angle
(See the footnote on p.5-3.)
Amount of misalignment
0 < Amt. of misalignment < 0.3
0.3 < Amt. of misalignment < 0.4
0.4 < Amt. of misalignment
Color of
letters
Green
Yellow
Red
About color scale
The Target “Refractive” map color-codes the distribution of corneal refractive powers of an
eye corrected into emmetropia. The higher refractive powers become, the warmer the map
colors become; The lower refractive powers become, the cooler the map colors become.
NOTE
• If the map has areas with missing data, interpolation or extrapolation is carried out
within these areas to obtain expected data as much as possible; in this way, the map of
6 mm pupil is displayed.
Only the data within the pupil where rings have been traced is reliable. Select the
Pupil Contour and Rings overlay items to check the reliably measured area on the
map.
5 - 12
5.1.8 Internal OPD map
This map illustrates the distribution of internal astigmatism from the posterior surface of the
cornea to the retina.
It is assumed that of the total refractive power of the eye, the cornea is responsible for 75% and
the crystalline lens is responsible for the remaining 25%.
With the ARK-10000, the distribution of the corneal refractive power obtained by corneal
topography and the distribution of total refractive power of the eye obtained by REF measurement
and illustrated on the OPD map are available. This Internal OPD map illustrates the distribution
of astigmatism of the internal eye calculated from the data. This map shows if internal astigmatism
(especially, lenticular astigmatism) is involved. Mostly, total astigmatism results from corneal
shape (corneal astigmatism). However, in some patients, lenticular astigmatism counteracts the
corneal astigmatism. (About 20% of astigmatic eyes involve internal astigmatism).
When prescribing contact lenses or performing corneal refractive surgery, it is important to
consider both corneal astigmatism and internal astigmatism.
Map title
Measured eye
Date and time of measurement,
Exam No.
This mark moves in accordance with
the value at the cursor position.
Shows values at the cursor position:
Power, Distance from the center to the cross cursor@Angle
Represents the specified color
scale mode.
Norm: Normalize
Indv: Individual
Com: Common
Number: Increment
Adj: Adjustable
Com: Common
Number: Increment
Amount of misalignment
between the corneal vertex
during CT measurement and
that
during
REF
measurement@Angle
(See the footnote on p.5-3.)
Comment
(Enter on the Edit Exam Information screen.)
Amount of misalignment
0 < Amt. of misalignment < 0.3
0.3 < Amt. of misalignment < 0.4
0.4 < Amt. of misalignment
Sign of
CYL data
Values calculated from the data over 3 mm dia. and 5 mm dia. circles:
From the top item,
Internal astigmatism in the direction of the steepest meridian @Angle
Internal astigmatism in the direction of the flattest meridian @Angle
CYL: Difference between the internal astigmatism between the steepest and
flattest meridians
(Data is shown in yellow if no pupil outline is obtained.)
The sign of the Cyl of the Internal OPD map is determined by the formula:
Cc + Ci = Co (A calculation may contain an error.)
(Cc; CYL of the “Refractive” map, Ci; CYL of the Internal OPD map, Co; CYL
of the OPD map, C represents a vector.)
This sign of the CYL shows whether the internal astigmatism increases or
counteracts total astigmatism. (See the table.)
Cross cursor
Can be moved to a desired position. Values at the cursor position are shown in the lower
right corner of this map.
+
(Not displayed)
—
Color of
letters
Green
Yellow
Red
Reading setting of CYL mode
on the Settings screen
+
—
Internal
Internal
astigmatism
astigmatism
increases total counteracts
astigmatism.
total
astigmatism.
Internal
Intraocular
astigmatism
astigmatism
counteracts
increases total
total
astigmatism.
astigmatism.
About color scale
The Internal OPD map color-codes the distribution of astigmatism of the internal eye. When
the average power is regarded as 0 D (green), the higher the power becomes in the negative
direction, the warmer the map colors become; The higher the power becomes in the positive
direction, the cooler the map colors become.
5 - 13
NOTE
• If the map has areas with missing data, interpolation or extrapolation is carried out
within these areas to obtain expected data as much as possible; in this way, the map of
6 mm pupil is displayed.
Only the data within the pupil where rings have been traced is reliable. Select the
Pupil Contour and Rings overlay items to check the reliably measured area on the
map.
The “Standard2” map set is factory-set that displays various numerical data with the Internal
OPD map at the center and allows efficient checking of the measured data. “Standard2”
includes the maps and measured data of one eye of the patient.
Refraction:
Spherical power, cylindrical power and cylinder axis obtained from the OPD map. These items of data represents
an error to be corrected to correct the eye into emmetropia. (when VD = 0)
: Values calculated from the data over 3 mm dia. circle
: Values calculated from the data over 5 mm dia. circle
(Data is shown in yellow if no pupil outline is obtained.)
Residual Astig:
Amount of internal astigmatism obtained from the Internal OPD map.
(Data is shown in yellow if no pupil outline is obtained.)
Cornea Refractive:
The corneal refractive powers in the direction of the
steepest and flattest meridians obtained from the “Refractive” map @angle
Keratometry:
The SimK value obtained from the Axial map.
Asphericity 6.0 mm:
Value representing asphericity within the 6 mm zone
on the cornea. (See p.5-24.)
e: eccentricity
S: Shape factor
Pupillometry
Pupil information during REF and CT measurements.
Photopic: Photopic pupil size (during CT measurement)
Mesopic: Mesopic pupil size (during REF measurement)
MPdist: Distance between the photopic pupil center
and mesopic pupil center@Angle
Pdist:Distance between the corneal reflex spot and
the photopic pupil center@Angle
Mdist:Distance between the corneal reflex spot and
the mesopic pupil center@Angle
5 - 14
5.1.9 Wavefront High Order map
This map shows specified high-order components (from the third order to a specified order up to
the 8th order in the Zernike pyramid) that are extracted only from the Wavefront Total map in
wavefront aberration analysis using Zernike polynomials.
This map shows aberrations which cannot be corrected by spectacles.
This mark moves in accordance with
a value at the cursor position.
Map title
Measured eye
Measurement date and time, Exam No.
Cross cursor
Can be moved to a desired position.
Values at the cursor position is shown
in the lower right corner of this map.
Represents a specified color
scale.
Norm : Normalize
Indv : Individual
Com : Common
Number : Increment
Adj: Adjustable
Com : Common
Number: Increment
Comment (Input on the Edit
Exam Information screen.)
Indicates values at the cursor position:
Wavefront elevation,
Distance from the center to the cross
cursor@Angle
Amount of misalignment,
Distance between the measurement axis
and corneal vertex@Angle
(See the footnote on p.5-3.)
RMS wavefront error
Zone: Analysis area Diameter (mm)
Order: Highest analysis order of Zernike pyramid
Color
of
letters
0 = Amt. of misalignment < 0.3 Green
0.3 = Amt. of misalignment < 0.4 Yellow
0.4 = Amt. of misalignment
Red
Amount of misalignment
About color scale
The Wavefront High Order map allows the
operator to check wavefront shapes of the
third or higher order by color distribution.
As wavefront aberrations are positioned
forward away from reference wavefronts
of a lower order (1st to 2nd), the map colors
become warmer; As wavefront aberrations
are positioned backward away from the
reference wavefront, the map colors
become cooler.
Map type change button
To change an analysis zone and order
Open the “Select Map Type/Pattern” dialog
and change an analysis area (Zone) and
order (Dim) in the “Zernike Analysis” area
in the lower left of the dialog.
The “Zernike Analysis” area is displayed
only when Wavefront HO map, Wavefront
Total map, Wavefront Group or Zernike
Graph is assigned to the map type change
button.
5 - 15
5.1.10 Wavefront Total map
This map shows differences in wavefront aberration (a total wavefront aberration from the 0th
order to a specified order in the Zernike pyramid) between a reference wavefront as the wavefront
of an emmetropic eye and the wavefront of patient’s eye.
This map is calculated from the OPD map.
Map title
Measured eye side
This mark moves in accordance
with a value at the cursor position.
Represents a specified color
scale.
Norm : Normalize
Indv : Individual
Com : Common
Number : Increment
Adj: Adjustable
Com : Common
Number: Increment
Date and time of measurement, Exam No.
Cross cursor
Can be moved to a desired
position. Values at the cursor
position are shown in the
lower right corner of this map.
Indicates values at the cursor position:
Wavefront elevation,
Distance from the center to the cross
cursor@Angle
Amount of misalignment,
Distance between the measurement axis
and corneal vertex@Angle
(See the footnote on p.5-3.)
Color
of
letters
0 = Amt. of misalignment < 0.3 Green
0.3 = Amt. of misalignment < 0.4 Yellow
0.4 = Amt. of misalignment
Red
Amount of misalignment
Comment (Input on the Edit Exam
ZS: SPH within analysis zone calculated using Zernike polynomials
Information screen.)
ZC: CYL within analysis zone calculated using Zernike polynomials
ZA: AXIS within analysis zone calculated using Zernike polynomials
VD: Corneal vertex distance
RMS wavefront error (excluding error of zeroth-order components)
Zone: Analysis zone Diameter (mm)
Order: Highest analysis order of Zernike pyramid
Color scale
The Wavefront Total map color-codes shapes of a total wavefront aberration of the 0th to
a specified order (up to 8th order). As wavefront of the eye is positioned forward away
from a reference wavefront (in the case of a myopic eye), the map colors become warmer;
As the wavefront of the eye is positioned backward away from a reference wavefront (in
the case of a hyperopic eye), the map colors become cooler.
5 - 16
5.1.11 Wavefront Group map
This map shows the wavefront aberration components extracted from a designated group only
by wavefront aberration analysis using Zernike polynomials.
Map title
Measured eye
Date and time of measurement, Exam No.
This mark moves in accordance
with a value at the cursor position.
Represents a specified color
scale.
Norm : Normalize
Indv : Individual
Com : Common
Number : Increment
Adj: Adjustable
Com : Common
Number: Increment
Comment (Input on the Edit Exam
Information screen.)
RMS wavefront error (excluding zeroth-order values)
Zone: Analysis zone Diameter mm
Order: Highest analysis order of Zernike pyramid
Group name
Cross cursor
Can be moved to a desired position.
Values at the cursor position are
shown in the lower right corner of this
map.
Indicates values at the cursor position:
Wavefront elevation,
Distance from the center to the cross
cursor@Angle
Amount of misalignment,
Distance between the measurement axis
and corneal vertex@Angle
(See the footnote on p.5-3.)
Color
of
letters
0 = Amt. of misalignment < 0.3 Green
0.3 = Amt. of misalignment < 0.4 Yellow
0.4 = Amt. of misalignment
Red
Amount of misalignment
Color scale
As a wavefront of the eye is positioned forward away from reference wavefront (in the
case of a myopic eye), the map colors become warmer; As a wavefront of the eye is
positioned backward away from a reference wavefront (in the case of a hyperopic eye), the
map colors becomes cooler.
A. Selecting a combination of aberration components (group) to be displayed on the map
1) Press a group name in the upper right corner
of the map.
The “Zernike Coefficient Selection” dialog
is displayed.
2) Press
of the “Coefficient Group Name”
field.
The entered groups (combination of
aberration components) are listed.
3) Press a desired group name to select.
Aberration components that are included in
the selected group will be checked in the
Zernike pyramid.
4) Press
screen.
to go back to the Map View
5 - 17
* Factory-entered combinations of aberration components (groups) entered in the “Coefficient
Group Name” field:
“Total”: Coefficient term = 0th to 44th terms, The displayed map will be the same as the
Wavefront Total map.
“Tilt (S1)”: Coefficient term = 1st and 2nd terms (Tip, Tilt)
“High”: Coefficient term = 6th to 44th terms, The displayed map will be the same as the
Wavefront High Order map.
A coefficient term of an aberration
“Coma”: Coefficient term = 7th and 8th terms (Coma)
component: {th term represents
“Trefoil”: Coefficient term = 6th and 9th terms (Trefoil)
the number above each term in
“T. Sph”: Coefficient term = 12th, 24th and 40th terms
the Zernike pyramid.
E.g.: Coefficient term = 3th term
“T. Coma”: Coefficient term = 7th, 8th, 17th, 18th, 31th
and 32th terms
“T. Trefoil”: Coefficient term = 6th, 9th, 16th, 19th, 30th
and 33th terms
“T. Astig”: Coefficient term = 11th, 13th, 23th, 25th, 39th
and 41th terms
“T. 4Foil”: Coefficient term = 10th, 14th, 22th, 26th, 38th
and 42th terms
“T. 5Foil”: Coefficient term = 15th, 20th, 29th and 34th
terms
“Low (S1 + S2)”: Coefficient term = 1st to 5th terms
“S2”: Coefficient term = 3rd to 5th terms (Astigmatism,
Defocus)
“S3”: Coefficient term = 6th to 9th terms (Coma, Trefoil)
“S4”: Coefficient term = 10th to 14th terms (Spherical)
“S5”: Coefficient term = 15th to 20th terms (Secondary coma)
“S6”: Coefficient term = 21th to 27th terms (Secondary spherical)
“S7”: Coefficient term = 28th to 35th terms
“S8”: Coefficient term = 36th to 44th terms
“S3 + S5 + S7”: Coefficient term = 6th to 9th terms, 15th to 20th terms, 28th to 35th terms
“S4 + S6 + S8”: Coefficient term = 10th to 14th terms, 21th to 27th terms, 36th to 44th terms
“HiAstig”: Coefficient term = 11th, 13th, 23th, 25th, 39th and 41th terms (2ndAstig, 3rdAstig,
4th Astig)
The factory-entered groups are shown in blue and user-entered groups are shown in black.
NOTE
• A group selected or entered in the “Zernike Coefficient Selection” dialog by opening it
on the Map View screen is temporarily applicable. The selected or entered group will
be reset back to the previous one once you select another patient or turn the instrument
OFF. For setting a permanent group on the Map View Settings screen, see “5.2.1.5
When selecting the Wavefront Group map”.
5 - 18
B. Setting a combination of aberration components (group) to be displayed on the map
1) Press a group name in the upper right corner
of the map.
The “Zernike Coefficient Selection” dialog
is displayed.
2) Press
.
The “Coefficient Group Name” field will be
cleared and aberration components in the
Zernike pyramid will be unchecked.
3) Enter a group name in the “Coefficient
Group Name” field.
4) Only select aberration components in the
Zernike pyramid to be displayed on a color
map by checking them.
All_ON ⇒
Checks all the aberration
component boxes.
All_OFF ⇒ Deselects all the aberration
component boxes.
5) Press
again.
The “Message” dialog box opens.
6) Press Yes .
The screen returns to the Map View screen.
The displayed Wavefront Group map will
show aberration components of a selected
group.
NOTE
• A group selected or entered in the “Zernike Coefficient Selection” dialog by opening it
on the Map View screen is temporarily applicable. The selected or entered group will
be reset back to the previous one once you select another patient or turn OFF the
instrument. For setting a permanent group on the Map View Settings screen, see
“5.2.1.5 When selecting the Wavefront Group map”.
5 - 19
5.1.12 Zernike graph
This graph shows coefficients of aberration components in the Zernike polynomials in wavefront
aberration analysis.
The Zernike graph has 2 graph modes: RMS graph and Coefficient graph
The RMS graph demonstrates root-sum-square values of components entered by each group for
comparison among several groups. The Coefficient graph shows individual coefficients for a
group (a combination of aberration components).
toggles between the RMS graph and Coefficient graph.
5.1.12.1 RMS graph
The graph represents grouped results of aberration components. The root-sum-square values of
the components entered by each group are displayed. This map is especially useful for confirming
aberration components such as coma aberration or defocus.
Map title, Measured eye, Exam No.
Region ,Order number
Group set name
The RMS values of 0th components
are not contained.
Group name
Used to enter a new group set.
Used to zoom in on the graph.
Used to open the “Select
Color Scale” dialog.
Used to switch the graph
to the Coefficient graph.
Used to display values or to clear values
Used to display the “Zernike
Coefficient Selection” dialog.
A. Selecting a group combination (group set) to be displayed on the graph
1) Press the group set name field in the upper
left of the graph.
Entered group set names are listed.
2) Press a desired group set name to select.
The RMS graph of the selected group set
will be displayed.
* Factory-entered group sets
“V. Sets”: Total, Tilt (S1), High, T. Coma, T. Trefoil, T. 4Foil, T. Sph, HiAstig
“H. Sets”: Total, Tilt (S1), High, S3 + S5 + S7, S4 + S6 + S8
The factory-entered groups are shown in blue and user-entered groups are shown in black.
5 - 20
B. Confirming aberration components in each group
1) Press a group name to select it.
2) Press
.
The “Zernike Coefficient Selection” dialog
is displayed. The checked aberration
components are included in the group.
3) Press
or
.
The screen returns to the Map View screen.
C. Setting a new group set
1) Press
.
The “RMS Graph Name” dialog is displayed.
2) Enter a new group set name.
3) Press
.
The group set will be entered with the
entered name and with a set of groups that
are displayed.
4) Add or delete groups to a desired
combination of groups.
See “D. Changing a group set (adding a
group)” and “E. Changing a group set
(deleting a group)” (p.5-21).
5 - 21
D. Changing a group set (Adding a group)
Add a group to a group set.
Only user-entered group sets (shown in black) can be changed.
1) Press a group name to select it.
(A new group name is inserted in the line
immediately above the selected group name
here.)
List of entered group names
2) Press
.
A line is inserted above the selected group
name in Step 1).
3) Press
of the inserted line.
Entered groups are listed.
4) Press
or
to move a desired group
name into view.
5) Press a desired group to select.
The selected group will be inserted.
E. Changing a group set (Deleting a group)
Delete an unwanted group from a group set.
Only user-entered group sets (shown in black) can be changed.
1) Select a group name to be deleted.
2) Press
.
The selected group name in Step 1) will be deleted.
NOTE
• Changes to the RMS graph made on the Map View screen are temporary. The changes
to the graph will be reset back to those before the changes once you exit from the Map
View screen.
5 - 22
5.1.12.2 Coefficient graph
The graph shows coefficients of individual aberration components included in a group
(combination of aberration components). A side-by-side display of the preoperative and
postoperative Coefficient graphs tells differences in each aberration component.
Map title, Measured eye, Exam No.
Region ,Order number
Group name
Each aberration component
Number: Assigned ordinal
number in the Zernike pyramid
Used to zoom in on the graph.
Used to open the “Select
Color Scale” dialog.
Used to switch the graph to
the RMS graph
Used to display or clear
values.
A. Selecting a combination of the aberration components to be displayed
1) Press a group name in the upper left corner
of the graph.
The “Zernike Coefficient Selection” dialog
is displayed. The checked aberration
components are included in the displayed
group.
2) Select a combination of aberration
components (group) from
in the
“Coefficient Group Name” field.
3) Press a desired group name to select.
Aberration components that are included in
the selected group will be checked in the
Zernike pyramid.
4) Press
to go back to the Map View
screen.
The Coefficient graph of the selected group
will be displayed.
5 - 23
* Factory-entered combinations of aberration components (groups) entered in the “Coefficient
Group Name” field:
Aberration components included in each group in the case of 8th-order: Only the aberration
components of up to the designated order are included.
“Total”: Coefficient term = 0th to 44th terms
“Tilt (S1)”: Coefficient term = 1st and 2nd terms (Tip, Tilt)
“High”: Coefficient term = 6th to 44th terms
A coefficient term of an aberration component:
“Coma”: Coefficient term = 7th and 8th terms (Coma)
{th term represents a number above each term
“Trefoil”: Coefficient term = 6th and 9th terms (Trefoil) in the Zernike pyramid.
E.g.: Coefficient term = 3th term
“T. Sph”: Coefficient term = 12th, 24th and 40th terms
“T. Coma”: Coefficient term = 7th, 8th, 17th, 18th, 31th
and 32th terms
“T. Trefoil”: Coefficient term = 6th, 9th, 16th, 19th, 30th
and 33th terms
“T. Astig”: Coefficient term = 11th, 13th, 23th, 25th, 39th
and 41th terms
“T. 4Foil”: Coefficient term = 10th, 14th, 22th, 26th, 38th and 42th terms
“T. 5Foil”: Coefficient term = 15th, 20th, 29th and 34th terms
“Low (S1 + S2)”: Coefficient term = 1st to 5th terms
“S2”: Coefficient term = 3rd to 5th terms (Astigmatism,
Defocus)
“S3”: Coefficient term = 6th to 9th terms (Coma, Trefoil)
A root-some-square value of
“S4”: Coefficient term = 10th to 14th terms (Spherical)
the checked aberration components is displayed by bar
“S5”: Coefficient term = 15th to 20th terms (Secondary coma)
“S6”: Coefficient term = 21th to 27th terms (Secondary spherical) graph.
“S7”: Coefficient term = 28th to 35th terms
“S8”: Coefficient term = 36th to 44th terms
“S3 + S5 + S7”: Coefficient term = 6th to 9th terms, 15th to 20th terms, 28th to 35th terms
“S4 + S6 + S8”: Coefficient term = 10th to 14th terms, 21th to 27th terms, 36th to 44th terms
“HiAstig”: Coefficient term = 11th, 13th, 23th, 25th, 39th and 41th terms (2ndAstig, 3rdAstig, 4th Astig)
The factory-entered groups are shown in blue and user-entered groups are shown in black.
B. Setting a new group
1) Press a group name in the upper left corner of the graph.
The “Zernike Coefficient Selection” dialog is displayed.
2) Set a group in the same manner as “B. Setting a combination of aberration components
(group) to be displayed on the map” (p.5-18).
NOTE
• A group entered in the “Zernike Coefficient Selection” dialog by opening it on the
Map View screen is temporarily applicable. The selected or entered group will be
reset back to the previous one once you select another patient or turn the instrument
OFF. For specifying a permanent group on the Map View Settings screen, see “5.2.1.7
When selecting the Zernike graph and displaying the Coefficient graph”.
5 - 24
5.1.13 Difference map
This map shows differences between two selected exams obtained at different dates that are
retrieved from the database. See “5.4 Displaying the Difference Map”. Note that you should
select two exams of the same map type and of the same eye (left or right) of a patient. Otherwise,
a Difference map cannot be generated.
The Difference map cannot be selected from the Map View screen. Assign the Difference map
to View 1, View 2 or View 3 on the Map View Settings screen.
Map title
This mark moves in accordance with the value of the
cursor position.
Nos. of maps to obtain a difference
Represents the display mode of
the scale.
Norm : Normalize
Indv : Individual
Com : Common
Number : Increment
Adj: Adjustable
Com : Common
Number: Increment
Abs.: Absolute
S-K 1.5 : Smolek- Klyce [1.5D]
26: Absolute [26]
Cross cursor
Can be moved to a desired
position. Values at the cursor position are shown in the
lower right corner of this
map.
Map data at the cursor position,
Distance from the center to the
cross cursor@Angle
5.1.14 Table at the bottom of the Map View screen
In the bottom of the Map View screen, AR median values, data that is equal to data measured by
a general keratometer, eccentricity and pupil diameter are displayed in tabular form.
AR median values
SPH [D]
CYL [D]
AXIS [º]
Photopic pupil diameter [mm]
Simulated keratometry values
Mesopic pupil diameter [mm]
Max. refractive power [D]([mm])@ Direction [º] Dist. between the photopic and mesopic
Min. refractive power [D]([mm])@ Direction [º] pupil centers@Dist.[mm]@Direction[º]
Difference [D] ([mm])
Eccentricity (Q value*12) analysis diameter
Corneal refractive index and range
where the Q value is obtained
*12 Q value represents asphericity of the cornea.
Q < –1: Hyperbola
Q = –1: Parabola
–1 < Q < 0: A part of prolate ellipse
Q = 0 : A part of circle
0 < Q: Oblate ellipse
Parabola
Hyperbola
Prolate ellipse
Circle
Oblate ellipse
5 - 25
5.2 Specifying Maps in Advance (Map View settings)
Specifications for maps on the Map View Settings screen are explained.
NOTE
• The specifications made on the Map View Settings will be maintained even though the
instrument is turned OFF.
5.2.1 Setting “View 1”, “View 2” and “View 3”
The most frequently-used three map sets are assigned as “View 1”, “View 2”, and “View 3”.
When opening the Map View screen from the measurement screen: ⇒ A map is displayed
with the layout of “View 1”.
When opening the Map View screen from the Patient Selection screen:
⇒ A map is displayed with the designated layout of “View1”, “View 2” or “View 3”.
When pressing
or
on the Map View screen:
⇒ Printout is made of the checked layout of “View1”, “View2” or “View 3” at “ Print Out”.
AxOPD2 AxOPD4B
CTOPD6 CTOPD6B
Standard map
WF6 WF6B
Map layout, map type, eye, and overlay options can be entered in the setting called
“map set”. Multiple map sets can be entered. Enter or modify a map set as necessary.
See “5.2.1.2 Entering a new map set”, “5.2.1.3 Modifying an already-entered map
set”, “5.2.1.4 Entering modifications made on the Map View screen to a map set”.
Map set in blue: Factory-entered map sets (Unchangeable)
Map set in black: User-entered map sets (changeable)
Assigning a map set applied to displayed maps or printed maps.
See “5.2.1.1 Assigning an entered map set to “View1”, “View2” or “View3””.
On the Patient Selection screen, select a radio button
of a map set to be applied to displayed maps.
Note that a displayed map via the measurement screen
is shown with “View 1”.
Select a map set to be
applied to a map to be
printed from among
“View1”, “View2” and
“View3”. (Multiple designations are allowed.)
E.g.: A map that has just been obtained after measurement will be displayed and printed smoothly by performing the
following:
Assign such maps as the Axial map and OPD map to View1 that allow the operator to quickly check placido-ring
images for obstruction of tears, eyelid and eyelashes.
Select “View2” or “View3” to be applied to printed maps and check “ Print Out”.
5 - 26
5.2.1.1 Assigning an entered map set to “View1”, “View2” and “View3”
1. Open the Map View Settings screen.
Press
on the Patient Selection screen or
Map View screen.
2. Press the “View 1” tab.
Tab
3. Select a map set with a desired layout and
map types from the entered map sets.
1) Press
of the “Map Set” field.
The entered map sets are listed.
2) Press a desired map set to select.
To create a new map set, see “5.2.1.2
Entering a new map set”.
To modify an entered map set, see “5.2.1.3
Modifying an already-entered map set”.
Map set in blue: Factory-entered map set (Not
changeable)
Map set in black: User-entered map set (changeable)
4. Choose overlay options for each individual
map.
1) Press an overlay option field next to a map button.
The overlay options are listed.
2) Check desired overlay options.
5 - 27
See [Overlay options] (p.5-59).
Angle Scale: Protractor-like angle scale
Cross Cursor: Dragging the cross cursor displays
refractive power (Pwr), corneal
curvature radius (Rad), distance from
the center (Dist), and Axis at the
location.
Grid : Sections (1-millimeter squares), vertex point and a point of the measuring light axis
Eye Image: Patient’s captured eye image
Pupil Image: Pupil image during REF measurement (Available on the OPD map only)
Keratometric: Individual maximum and minimum diopters and the their directions over
3mm-dia., 5mm-dia., and 7mm-dia. circumferences.
Pupil Contour: Pupil edge
For the Eye Image, select “Photopic” (photopic pupil image) or “Mesopic”
(mesopic pupil image). In the case of the OPD map, Target “Refractive”
map, Internal OPD map, Wavefront High Order map, Wavefront Total map
and Wavefront Group map, the area outside the pupil outline is shaded.
Rings: Detected placido-ring edges (shown in red and yellow lines)
Border Line: This is for setting whether or not to draw boundaries in black. Use this option
when the areas of adjacent steps are shown in closer colors.
3) Press
.
5. If necessary, check “ Print Out”.
To print maps with the map set when
Print Out”.
or
is pressed on the Map View screen, check “
6. Press
.
The “Message” dialog is displayed.
7. Press Yes .
The selected map set will be entered together with designated overlay options and “
Out” specifications as “View 1” .
8. In the same manner as Steps 2 to 7, set “View 2” and “View 3”.
9. Press
.
The screen returns to the Patient Selection screen or to the Map View screen.
Print
5 - 28
5.2.1.2 Entering a new map set
Frequently-used map layouts, map types, eyes (left or right), overlay options and printout
specifications can be entered as a new map set.
1. Open the Map View Settings screen.
Press
on the Patient Selection screen or
Map View screen.
Tab
2. Press a tab of “View 1”, “View 2” or “View
3” whose specifications are to be changed.
3. Press
.
4. Enter a map set name in the “Map Set” field.
5. In the “Layout” field, select the number of a
map and a layout.
Using the scroll bar, press the button with the
desired map number and layout.
Scroll bar
6. For each individual map, select the left or
right eye.
Use the R or L button.
To display maps of both eyes, designate the
right-eye (R) for the maps on the left side and
the left eye (L) for the maps on the right side.
To display maps of either left eye or right eye
only, designate either the right eye (R) or the
left eye (L) for all the maps.
Pressing
in the Map View screen switches
between the right-eye map and left-eye map.
5 - 29
7. For each individual map, select a map type.
1) Press a map button.
Map types are listed.
2) Press a desired map type.
See “5.1 Color Maps”.
Map button
When selecting “Wavefront Group”:
⇒ The “Zernike Coefficient Selection” dialog is
displayed.
See “5.2.1.5 When selecting the
Wavefront Group map”.
When selecting “Zernike Graph”:
⇒ The “Zernike Coefficient Graph Settings” dialog is
displayed.
See “5.2.1.6 When selecting the Zernike graph and displaying the RMS graph”.
See “5.2.1.7 When selecting the Zernike graph and displaying the Coefficient graph”.
When selecting “Difference”:
⇒ The “Difference Map Settings” dialog is displayed.
See “5.2.1.8 When selecting the Difference map”.
8. For each individual map, select overlay options.
1) Press the overlay option field next to a map button.
Overlay options are listed.
2) Check desired overlay options.
See [Overlay options] (p. 5-59).
Angle Scale: Protractor-like angle scale
Cross Cursor: Dragging the cross cursor displays
refractive power (Pwr), corneal
curvature radius (Rad), distance from
the center (Dist), and Axis at the
location.
Grid: Sections (1-millimeter squares), vertex point and a point of the measuring light axis
Eye Image: Patient’s captured eye image
Pupil Image: Pupil image during REF measurement (Available on the OPD map only)
Keratometric: Respective maximum and minimum diopters and their directions over 3mmdia., 5mm-dia., and 7mm-dia. circumferences.
Pupil Contour: Pupil outline. For the Eye Image, select “Photopic” (photopic pupil image)
or “Mesopic” (mesopic pupil image). In the case of the OPD map, Target
“Refractive” map, Internal OPD map, Wavefront High Order map,
Wavefront Total map and Wavefront Group map, the area outside the pupil
outline is shaded.
Rings: Detected placido-ring edges (displayed in red and yellow lines)
Border Line: This is for setting whether or not to draw boundaries in black. Use this option
when the areas of adjacent steps are shown in closer colors.
5 - 30
3) Press
.
9. If necessary, check “ Print Out”.
To print maps of the map set when
or
Print Out”.
10. Press
.
The “Message” dialog is displayed.
11. Press Yes .
The map set is entered as “View 1”, “View 2”
or “View 3” as selected in Step 2.
12. Press
.
The screen returns to the Patient Selection
screen or Map View screen.
is pressed on the Map View screen, check “
5 - 31
5.2.1.3 Modifying an already-entered map set
An entered map set (map layout, map types, left-eye or right-eye, overlay options and printout
specifications) is modified.
NOTE
• Factory-entered map sets (shown in blue) may not be modified except for their overlay
options and printout specifications.
1. Open the Map View Settings screen.
Press
on the Patient Selection screen or
Map View screen.
Tab
2. Select the tab of “View 1”, “View 2” or “View
3” to which a modified map set is to be
assigned.
3. Select a desired map set to be modified from
entered map sets.
1) Press
of the “Map Set” field.
The entered map sets are listed.
2) Press a map set to be modified to select.
4. As necessary, modify the number of maps,
eye (left or right), map types, overlay options
and printout specifications and enter the
map set.
See Steps 5 to 12 of “5.2.1.2 Entering a new
map set”.
Map set in blue: Factory-entered map set (Not
changeable)
Map set in black: User-entered map set (changeable)
5 - 32
5.2.1.4 Entering modifications made on the Map View Settings screen to a
map set
Change map layout, map types, overlay options, or the eye applied to a displayed color map in
the Map View screen and enter the changes to a map set.
NOTE
• Only user-entered map sets (shown in black on the Map View Settings screen) may be
modified.
1. Change map layout, map types, overlay options or the eye of a displayed map on the Map
View screen.
See “4.6.3 Displaying a map on another map set”, “4.6.4 Switching between the right eye and
left eye”, “5.3.1 Changing map types and overlay options”.
2. Display the Map View Settings screen.
Press
.
The map set of the selected tab from among
“View1”, “View2” and “View3” will be
modified.
3. If necessary, check “ Print Out”.
To print maps of the map set when
or
is pressed on the Map View screen, check “
Print Out”.
4. As necessary, change the map set name in the “Map Set” field.
When not changing the map set name ⇒ Modify the map set.
When changing the map set name ⇒ Enter the map set as a new one.
5. Press
.
The “Message” dialog is displayed.
6. Press Yes .
The map set will be entered.
7. Press
.
The screen returns to the Map View screen.
5 - 33
5.2.1.5 When selecting the Wavefront Group map
When “Wavefront Group” is selected in Step 7
of “5.2.1.2 Entering a new map set”, the “Zernike
Coefficient Selection” dialog is displayed. Select
a combination of aberration components (group).
[Designating a combination of aberration
components (group) to be displayed]
1. Press
in the “Coefficient Group Name”
field and select a combination of aberration
components (group).
The checked aberration components in the
Zernike pyramid will be displayed in the
Wavefront Group map.
2. Press
.
The screen returns to the Map View Settings
screen.
The selected group name is shown in yellow
on a map button.
* Factory-entered combinations of aberration components (groups) in the “Coefficient Group
Name” field:
Aberration components included in each group in the case of 8th-order: Only the aberration
components of up to the designated order are included.
“Total”: Coefficient term = 0th to 44th terms, The displayed map will be the same as the
Wavefront Total map.
“Tilt (S1)”: Coefficient term = 1st and 2nd terms (Tip, Tilt)
“High”: Coefficient term = 6th to 44th terms, The displayed map will be the same as the
Wavefront High Order map.
“Coma”: Coefficient term = 7th and 8th terms (Coma)
“Trefoil”: Coefficient term = 6th and 9th terms (Trefoil)
“T. Sph”: Coefficient term = 12th, 24th and 40th terms
“T. Coma”: Coefficient term = 7th, 8th, 17th, 18th, 31th and 32th terms
“T. Trefoil”: Coefficient term = 6th, 9th, 16th, 19th, 30th and 33th terms
5 - 34
“T. Trefoil”: Coefficient term = 6th, 9th, 16th, 19th, 30th and 33th terms
“T. Astig”: Coefficient term = 11th, 13th, 23th, 25th, 39th
and 41th terms
A coefficient term of aberration
component: {th term represents
“T. 4Foil”: Coefficient term = 10th, 14th, 22th, 26th, 38th
the number above each term in
and 42th terms
the Zernike pyramid.
“T. 5Foil”: Coefficient term = 15th, 20th, 29th and 34th
E.g.: Coefficient term = 3th term
terms
“Low (S1 + S2)”: Coefficient term = 1st to 5th terms
“S2”: Coefficient term = 3rd to 5th terms (Astigmatism, Defocus)
“S3”: Coefficient term = 6th to 9th terms (Coma, Trefoil)
“S4”: Coefficient term = 10th to 14th terms (Spherical)
“S5”: Coefficient term = 15th to 20th terms (Secondary coma)
“S6”: Coefficient term = 21th to 27th terms (Secondary spherical)
“S7”: Coefficient term = 28th to 35th terms
“S8”: Coefficient term = 36th to 44th terms
“S3 + S5 + S7”: Coefficient term = 6th to 9th terms, 15th
to 20th terms, 28th to 35th terms
“S4 + S6 + S8”: Coefficient term = 10th to 14th terms, 21th
to 27th terms, 36th to 44th terms
“HiAstig”: Coefficient term = 11th, 13th, 23th, 25th, 39th
and 41th terms (2ndAstig, 3rdAstig, 4thAstig)
The factory-entered groups are shown in blue and user-entered groups are shown in black.
[Entering a combination of aberration components (group) to be displayed on the map]
Enter a new group.
1. Press
.
The “Coefficient Group Name” field will be
cleared and all the aberration components in
the Zernike pyramid will be unchecked.
2. Enter a group name in the “Coefficient
Group Name” field.
3. In the Zernike pyramid, only check
aberration components to be displayed on a
color map.
All_ON ⇒ Checks all the aberration
component boxes.
All_OFF ⇒ Deselects all the aberration
component boxes.
4. Press
again.
The “Message” dialog is displayed.
Enter a group name.
Check aberration components
to be displayed.
5 - 35
5. Press Yes .
The “Zernike Coefficient Selection” dialog is displayed again. The set group will be entered.
6. Press
.
The set group will be entered, and the screen returns to the Map View Settings screen. An
entered group name will be shown in yellow on a map button.
Pressing
returns to the Map View Settings screen without the set group being entered.
[Modifying an already-entered group]
Aberration components included in an user-entered group (shown in black) may be changed.
However, factory-entered groups (shown in blue) may not be modified.
1. Press
of the “Coefficient Group Name” field.
Entered groups are listed.
2. Press a group to be modified to select it.
3. In the Zernike pyramid, only check
aberration components to be displayed on a
color map.
4. Press
.
The screen returns to the Map View Settings
screen.
The selected group name will be shown in
yellow on a map button.
5 - 36
[Deleting an already-entered group]
User-entered groups (shown in black) may be deleted. Factory-entered groups (shown in
blue) may not be deleted.
1. Press
of the “Coefficient Group Name”
field.
The entered groups will be listed.
2. Press a group to be deleted and select it.
3. Press
.
The “Message” dialog is displayed.
4. Press OK .
5. Press
.
The selected groups will be deleted and the screen will return to the Map View Settings screen.
Pressing
will return the screen to the Map View Settings screen without the group being
deleted.
NOTE
• Only user-entered groups may be deleted or modified.
Factory-entered groups may not be deleted or modified.
5 - 37
5.2.1.6 When selecting the Zernike graph and displaying the RMS graph
When “Zernike Graph” is selected in Step 7 of
“5.2.1.2 Entering a new map set”, the “Zernike
Coefficient Graph Settings” dialog is displayed.
The Zernike graph has 2 graph modes: RMS and
Coefficient.
The following explains the settings to be made
for RMS graph display.
The graph represents grouped results of aberration components. The root-sum-square values of
the components entered for each group are displayed. This map is especially useful for confirming
aberration components such as coma aberration or defocus.
1. Select the “RMS Graph” radio button of the
“Graph Mode” field.
2. Press
.
The entered group set names are listed.
3. Press a desired group set name to select.
The group names included in the selected group
set will be listed on the right.
* Factory-entered group sets
“V. Sets”: Total, Tilt (S1), High, T. Coma, T. Trefoil, T. 4Foil, T. Sph, HiAstig
“H. Sets”: Total, Tilt (S1), High, S3 + S5 + S7, S4 + S6 + S8
Factory-entered group sets are shown in blue, whereas user-entered group sets are shown
in black.
4. Press
.
The screen returns to the Map View Settings
screen. The entered group set name is shown
in yellow on the map button.
5 - 38
[Entering a new group set]
1. Confirm that the “RMS Graph” radio
button is selected in the “Zernike Coefficient
Graph Settings” dialog.
2. Press
.
The field for a group set name will be cleared.
3. Enter a group set name.
becomes active.
Enter a group set name.
4. Insert required group names.
1) Press a group name in the list on the right to
select it.
2) Press
.
A line is inserted immediately over the
selected group name in Step 1).
5 - 39
3) Press
of the inserted line.
The entered groups are listed.
4) Press a desired group name to select it.
The selected group name will be inserted.
5. Delete unwanted group names.
1) Press a group name to be deleted.
2) Press
.
The selected group name in Step 1) will be deleted.
6. In the same manner as Steps 4 and 5, insert or delete group names and arrange selected
groups in a desired order.
7. Press
.
The “Message” dialog is displayed.
8. Press Yes .
9. Press
.
The group set will be entered.
The screen will return to the Map View Settings screen. The entered group set name will be
shown in yellow on the map button.
Pressing
returns to the Map View Settings screen without the group set entered.
5 - 40
[Modifying an entered group set]
The included groups in a user-entered group set (shown in black) may be changed, whereas a
factory-entered group set (shown in blue) may not be modified.
1. Confirm that the “RMS Graph” radio button is selected in the “Zernike Coefficient Graph
Settings” dialog.
2. Select a group set to be changed using
of the field for group set.
3. Change the groups included in the group set in the same manner as Steps 4 and 6 of
[Entering a new group set] (p. 5-38).
4. Press
.
The screen returns to the Map View Settings screen.
Pressing
returns the display to the Map View Settings screen without changing the group.
[Deleting an entered group set]
User- entered group sets (shown in black) may be deleted, whereas factory-entered group sets
(shown in blue) may not be deleted.
1. Confirm that the “RMS Graph” radio button is selected in the “Zernike Coefficient Graph
Settings” dialog.
2. Select a group set to be deleted using
of the field for group set.
3. Press
.
The “Message” dialog is displayed.
4. Press OK .
5. Press
.
The selected group set in Step 2 will be deleted, and the screen returns to the Map View Settings
screen.
Pressing
returns the display to the Map View Settings screen without deleting the group
set.
5 - 41
NOTE
• Only user-entered group sets may be deleted or modified.
Factory-entered group sets may not be deleted or modified.
5.2.1.7 When selecting the Zernike graph and displaying the Coefficient graph
When “Zernike Graph” is selected in Step 7 of
“5.2.1.2 Entering a new map set”, the “Zernike
Coefficient Graph Settings” dialog is displayed.
The Zernike graph has 2 graph modes: RMS and
Coefficient.
The following explains the settings to be made
for Coefficient graph display.
The Coefficient graph represents the coefficients of the aberration components included in a
group (a combination of aberration components). A side-by-side comparison of preoperative
and postoperative Coefficient graphs tells the changes in individual aberration components.
1. Select the “Coefficient Graph” radio button
of the “Graph Mode” field.
2. Press .
The entered group names are listed.
3. Press a desired group name to select.
The aberration components included in the
selected group are listed on the right.
5 - 42
* Factory-entered group and aberration components included in each individual group.
Aberration components included in each group in the case of 8th-order: Only the aberration
components of up to the designated order are included.
“Total”: Coefficient term = 0th to 44th terms
“Tilt (S1)”: Coefficient term = 1st and 2nd terms (Tip, Tilt)
“High”: Coefficient term = 6th to 44th terms
“Coma”: Coefficient term = 7th and 8th terms (Coma)
“Trefoil”: Coefficient term = 6th and 9th terms (Trefoil)
“T. Sph”: Coefficient term = 12th, 24th and 40th terms
“T. Coma”: Coefficient term = 7th, 8th, 17th, 18th, 31th and 32th terms
“T. Trefoil”: Coefficient term = 6th, 9th, 16th, 19th, 30th and 33th terms
“T. Astig”: Coefficient term = 11th, 13th, 23th, 25th, 39th and 41th terms
“T. 4Foil”: Coefficient term = 10th, 14th, 22th, 26th, 38th and 42th terms
“T. 5Foil”: Coefficient term = 15th, 20th, 29th and 34th terms
“Low (S1 + S2)”: Coefficient term = 1st to 5th terms
“S2”: Coefficient term = 3th to 5th terms (Astigmatism, Defocus)
“S3”: Coefficient term = 6th to 9th terms (Coma, Trefoil)
“S4”: Coefficient term = 10th to 14th terms (Spherical)
“S5”: Coefficient term = 15th to 20th terms (Secondary coma)
“S6”: Coefficient term = 21th to 27th terms (Secondary spherical)
“S7”: Coefficient term = 28th to 35th terms
“S8”: Coefficient term = 36th to 44th terms
“S3 + S5 + S7”: Coefficient term = 6th to 9th terms, 15th to 20th terms, 28th to 35th terms
“S4 + S6 + S8”: Coefficient term = 10th to 14th terms, 21th to 27th terms, 36th to 44th terms
“HiAstig”: Coefficient term = 11th, 13th, 23th and 25th, 39th, and 41th (2ndAstig, 3rdAstig,
4thAstig)
The factory-entered groups are shown in blue and user-entered groups are shown in black.
4. Press
.
The screen returns to the Map View Settings
screen.
The selected group name is shown in yellow
on the map button.
5 - 43
[Entering a new group]
1. Confirm that the “Coefficient Graph” radio
button is selected in the Zernike Coefficient
Graph Settings dialog.
2. Press
.
The “Zernike Coefficient Selection” dialog is
displayed.
3. Enter a group name in the “Coefficient
Group Name” field.
Check aberration components
becomes active.
to be displayed on a graph
4. Check only the aberration components to be
displayed in the Coefficient graph.
All_ON ⇒ Checks all the aberration
component boxes.
All_OFF ⇒ Deselects all the aberration
component boxes.
5. Press
.
The “Message” dialog is displayed.
Enter a group name.
5 - 44
6. Press Yes .
The screen returns to the “Zernike Coefficient
Graph Settings” dialog.
7. Press
.
A group will be entered.
The screen returns to the Map View Settings
screen. The entered group name will be shown
in yellow on a map button.
Pressing
returns the display to the Map
View Settings screen without entering a group.
5 - 45
[Modifying an entered group]
The included groups in a user-entered group (shown in black) may be modified, whereas a
factory-entered group (shown in blue) may not be modified.
1. Confirm that the “Coefficient Graph” radio button is selected in the “Zernike Coefficient
Graph Settings” dialog.
2. Press
.
Entered groups are listed.
3. Press a group to be modified and select it.
The included aberration components into the
selected group will be listed.
4. Press
.
The “Zernike Coefficient Selection” dialog is
displayed.
Check only the aberration components
to be displayed.
5. Press only the aberration components to be
displayed on the Coefficient graph.
All_ON ⇒ Checks all the aberration
component boxes.
All_OFF ⇒ Deselects all the aberration
component boxes.
6. Press
.
The “Zernike Coefficient Graph Settings”
dialog re-opens.
7. Press
.
The screen returns to the Map View Settings
screen.
5 - 46
[Deleting an entered group set]
User- entered group sets (shown in black) may be deleted, whereas factory-entered group sets
(shown in blue) may not be deleted.
1. Confirm that the “RMS Graph” radio button is selected in the “Zernike Coefficient Graph
Settings” dialog.
2. Press
.
Entered groups are listed.
3. Press a group to be deleted and select it.
The aberration components included in the
selected group are listed on the right.
4. Press
.
5. Press OK .
The “Zernike Coefficient Graph Settings”
dialog is displayed again.
6. Press
.
The selected group set in Step 3 will be deleted,
and the screen returns to the Map View Settings
screen.
NOTE
• Only user-entered groups may be deleted or modified.
Factory-entered groups may not be deleted or modified.
5 - 47
5.2.1.8 When selecting the Difference map
When “Difference” is selected in Step 7 of
“5.2.1.2 Entering a new map set”, the “Difference
Map Settings” dialog is displayed.
The Difference map shows differences between
two maps which are currently displayed. Note
that the two maps should be the same type of map.
(A combination of a “Refractive” map and a
Target “Refractive” map is allowed.)
The following explains one example of showing
differences between map (1) and map (2) on map
(3).
1. Select target maps.
[Example: Displaying the Difference map of “Map (1) – Map (2)”]
1) Press the Map (1) button.
2) Press the Map (2) button.
“1-2” is shown in the lower field.
The map selected in Step 2) should be the
same map type as Map (1) selected in Step
1). Otherwise, selected maps will not be
shown in the lower field.
To re-select a map type, press Cancel to
go back to the Map View Settings screen
and change the map type.
2. Press OK .
The screen returns to the Map View Settings
screen.
3. Press
.
The “Message” dialog is displayed.
4. Press Yes .
5 - 48
5.2.1.9 Deleting a map set
User-entered map sets may be deleted, whereas factory-entered map sets (the map sets shown in
blue and “Standard map”) may not be deleted.
1. Open the Map View Settings screen.
Press
on the Patient Selection screen or
Map View screen.
2. Select a map set to be deleted from the “Map
Set” field of “View 1”.
A map set of “View 2” and that of “View 3”
may be selected in the same manner.
3. Press
.
The “Message” dialog is displayed.
4. Press OK .
The selected map set is deleted and “Standard
map” will automatically be selected in the “Map
Set” field.
5. Re-assign a map set to “View 1”.
See Steps 3 to 7 of “5.2.1.1 Assigning an entered
map set to “View1”, “View2” or “View3”.
6. Press
.
The screen returns to the Patient Selection screen or Map View screen.
5 - 49
5.2.2 Setting a color scale
A color scale can be specified for each individual map type.
1. Display the Map View Settings screen.
Press
on the Patient Selection screen or
Map View screen.
Scale tab
2. Press the “Scale” tab.
Map type tab
3. Select a map type whose color scale is to be
set using the map type tab on the left side of
the screen.
CT-A: Axial, Instantaneous
CT-R: “Refractive”, Target “Refractive”
OPD: OPD
WF: Wavefront Total, Wavefront High Order,
Wavefront Group
Elev: Elevation
Zgrph: Zernike Graph
Int. OPD: Internal OPD
4. Set the color scale.
1) Select a color scale with a radio button (
Relative color scale with which an increment and intermediate value are calculated for each individual map.
Minimum step value
An increment and intermediate
value can be specified. Maps
of the same type are displayed
by the same scale.
Absolute color scale with which the 30D to 67.5D
range is shown in 26 colors.
For resetting displayed specifications
to the default ones
For saving displayed specifications
to
) and enter values as necessary.
Relative color scale with which an increment and intermediate value are calculated for each individual map type. Maps
of the same type are displayed by the same scale.
Minimum increment value for
the Difference map
Intermediate value, Increment, and Increment specification for the Difference map
An appropriate increment for
a specified intermediate value
is automatically selected.
Absolute color scale with which the 9D to 101.5D
range is shown in 26 colors.
5 - 50
Available color scales on the ARK-10000 can be broadly divided into 2 types: Relative color
scale and Absolute color scale.
Relative color scale (Normalize): A histogram of a map is calculated and then an appropriate
increment (Step) and intermediate value (Middle) are automatically set for the best possible
use of the color scale. The set increment and intermediate value cannot be changed. Select
the number of color and color scheme from the “Color” area.
Individual ⇒ For each individual map, the increment and intermediate value are calculated
from the maximum and minimum values of a map to make the best possible
use of the color scale.
Common ⇒ For each individual map type, the Maps displayed based on the
same color scale as “Common”
increment and intermediate value are Axial map and Instantaneous map
calculated from the maximum and “Refractive” map and Target “Refractive”
map
minimum values.
Wavefront High Order map, Wavefront
Total map and Wavefront Group map
However, respective map pairs shown
in the right table will be displayed with the same color scale.
Min Step ⇒ This is for designating the minimum increment value. The calculated
increment in the case of the “Individual” or “Common” of the
“Normalize” does not become smaller than the designated value.
Diff Min Step ⇒ This is for specifying the minimum increment for the Difference map.
Common of Adjustable: This is also a relative scale. Unlike the “Common” of the
“Normalize”, an intermediate value (Middle) and step (Step) can be specified.
Checking ( ) “ Auto Step” will automatically select an appropriate step for a specified
intermediate value.
Absolute color scale (Absolute): With this scale, an increment and range are constant.
Regardless of the patient’s refractive conditions, the areas of a same diopter are always shown
in the same color on a map. This color scale is useful for comparisons among multiple maps.
Select from two types of absolute color scales.
Smolek_Klyce [1.5D]: The Smolek Klyce scale is a fixed color scale. An area in the
30D to 67.5D range is shown in 26 colors in increments of 1.5D with
the fixed color scale.
Absolute [26]: The Absolute scale has the same color scheme as the Smolek Klyce
scale and the same 26 colors. Peripheral diopters in the 9D to 101.5D
range are shown in wider increments.
* The absolute color scale is selectable only for the Axial, Instantaneous, “Refractive” and
Target “Refractive” maps.
2) As necessary, enter color schemes and number of the colors available
with the color scale in the “Color” area. (only for the relative color scale)
ISO ⇒ The color schemes are in conformity with the ISO-recommended ones. Designate
a color number in the entry field to the right of the “ISO” radio button. (15 to
25 color schemes: Red > Green > Blue)
NIDEK ⇒ Designate a color number in the entry field to the right of the “NIDEK” radio
button.
White > Red > Yellow > Green > Blue > Violet (9 to 51 colors)
Smolek_Klyce ⇒Provides the same color scheme as that of the Absolute color scale
(Pink > Red > Yellow > Green > Blue > Navy blue) with a fixed
color number of 26.
5 - 51
3) As necessary, set the unit of a color scale in the “Scale” area (only for the
Axial map and Instantaneous map)
mm (Curvature radius)/ Diopter (Refractive power)
* For maps other than the Axial and Instantaneous maps, they are displayed in fixed units of
measured data.
Map name
“Refractive” map
Target “Refractive” map
Internal OPD map
OPD map
Elevation map
Wavefront High Order map
Wavefront Total map
Wavefront Grop map
Zernike graph
Unit
Diopter (Refractive power)
Diopter (Refractive power)
Diopter (Refractive power)
Diopter (Refractive power)
µm
µm
µm
µm
µm
5. Press
.
The “Message” dialog is displayed.
6. Press Yes .
The specifications for the scale are saved.
7. Press
.
The screen returns to the Patient Selection
screen or the Map View screen.
5 - 52
5.2.3 Displaying PSF
The Point Spread Function (PSF) simulates how a point source of light like a star appears to the
patient when he or she looks at it.
This function calculates how a point at far appears to the patient based on the amount of optical
aberrations of the eye obtained in the REF measurement. Be aware that in this calculation, the
processing by the optic nerve system of how the brain recognizes the point formed on the retina
is not taken into account. For this reason, the simulation result may be different from what the
patient actually sees.
1. Check the “ Show” check box in the PSF
box on the “Other” tab of the Map View
Settings screen.
See “5.2.4 Other settings related to maps”.
If the “ Show” check box is checked, the
thumbnail of PSF (reduced sample image) is
displayed in the lower right of the wavefront
HO, Wavefront Total and Wavefront Group
maps.
2. Display the Wavefront HO, Wavefront Total
or Wavefront Group map and press the
thumbnail in the lower right of the map.
Thumbnail
The displayed map is switched to the PSF
display. To return to the original map display,
click the button in the lower right.
5 - 53
5.2.4 Other settings related to maps
The specifications related to map calculation, map display and printout are set.
1. Open the Map View Settings screen.
Press
on the Patient Selection screen or on
the Map View screen.
Others tab
2. Press the “Others” tab.
For displaying various settings
of the instrument
For displaying the software
version information
For saving the displayed
specifications
3. Change the displayed parameters.
[Default Printer]
This is for setting a color printer. The settings will be applied to the “Select Printer Device”
dialog as default ones when printing a map.
Driver
Used to specify a color printer.
Form
Used to set a printer paper size.
[AR Measurement]
This is for setting an indication increment for AR-measured values.
Step: 0.25, 0.125, 0.01
Factory setting: 0.25 [D]
This is for setting indication increments for SPH and CYL values.
The increment is also applicable to keratometry data at the time of printout.
5 - 54
VD: 0.0, 10.5, 12.0, 13.75, 15.0, 16.5
Factory setting: 13.75 [D]
Corneal vertex distance (Distance from the corneal vertex point to the posterior surface of a
lens)
Axis: 1, 5
Factory setting: 1º
Indication increment for Axis measurements.
CYL Mode: –, MIX, +
Factory setting: –
This field is for setting a reading mode for CYL values.
However, for keratometry data, the data is shown in “+” mode when the “+” radio button is
selected. When the “–” or “MIX” radio button is selected, the data is shown in “–” mode.
[Cornea Index]
This field is for setting the corneal refractive index to be used in calculation.
NA: Corneal refractive index to be used for calculation of the Axial map and Instantaneous
map displays.
Factory setting: 1.3375
NR: Corneal refractive index to be used for calculation of the “Refractive” map and Target
“Refractive map displays
Factory setting: 1.3760
Press an entry field to select and enter an index with a keyboard.
[Zernike Analysis]
This field is for setting an area to be analyzed and the highest order analysis used in calculations
for the Wavefront High Order map, Wavefront Total map, Wavefront Group map and Zernike
graph.
Zone
This is for setting an analysis area.
Radial order
This is for setting the highest order analysis.
[Map Color]
This area is for setting color-related specifications for a map displayed on the Map View
screen.
Background
Factory setting: Black
This is the background color of a map.
Text
Factory setting: White
This is for setting the text color on a map. However, the texts of items changeable by
pressing are shown in green.
Press the color area on the right to open the “Color” dialog and select a desired color.
5 - 55
[Background Image]
This is for setting the background of maps when outputting map image data.
File
Image data as the background of a map is designated.
Pressing
displays the “Select Background Image File Name” dialog. Selecting
background data makes it possible to save map image data with its background changed.
[e/Q/S]
This is for setting the value representing asphericity of the cornea to be displayed in the table
at the lower part of the Map View screen. (See *7 on p. 5-24.)
Factory setting: e (Q)
e (Q): Eccentricity and Q value
e (S) : Eccentricity and Shape factor
[PSF]
Show
Factory setting: Not checked
This is for setting whether or not to display the PSF thumbnail on the Wavefront HO,
Wavefront Total and Wavefront Group maps.
[Q Value Analysis]
This is for setting the area where a Q value is obtained. Press an entry field to select and enter
a value with a keyboard.
4. Press
.
The “Message” dialog is displayed.
5. Press Yes .
The settings will be saved.
6. Press
.
The screen returns to the Patient Selection
screen or Map View screen.
5 - 56
5.3 Changing Displayed Maps (Map View)
The items shown in green on the Map View screen are changeable.
A displayed map may be modified by pressing these items although the modifications are
temporarily applied to the map. The modifications will be canceled when you select another
patient’s data or turn off the instrument.
Changing to another exam
Changing the layout.
Changing the map type
and overlay options
Switching between the
left-eye and right-eye
Changing the color
scale
Enlarging
Selecting a map type ⇒ “5.3.1 Changing map types and overlay options”
Changing overlay options ⇒ “5.3.1 Changing map types and overlay options”
Changing a color scale ⇒ “5.3.2 Changing the color scale”
Changing to another exam ⇒ “5.3.3 Changing an exam displayed on a map to another exam
No.”
Changing a layout ⇒ “4.6.3 Displaying a map on another map set”
Switching between a left-eye and right-eye ⇒ “4.6.4 Switching between the right eye and left
eye”
Enlarging a map ⇒ “5.3.4 Zooming in on a map”
5 - 57
5.3.1 Changing map types and overlay options
For each individual map that is displayed, a map type and overlay options can be changed.
* The “Difference” map cannot be selected from the “Map View” screen. Select the “Difference”
map from the Map View Settings screen.
Map title
1. On the Map View screen, press the title of a
map to be changed.
The “Select Map Type/ Pattern” dialog opens.
2. Press a map type change button in the “Map
Type” area.
Map types are listed.
3. Press a desired map type to select.
See “5.1 Color Maps”.
Map type change button
5 - 58
4. Select overlay options.
From the “Option” area, check overlay options
to be laid over the map.
See [Overlay options] (p. 5-59).
Angle Scale: Protractor-like angle scale
Cross Cursor: Dragging the cross cursor displays refractive power (Pwr), corneal curvature
radius (Rad), distance from the center (Dist), and Axis at the cursor position.
Grid: Sections (1-millimeter squares), vertex point and point of measuring light axis
Eye Image: Captured patient’s eye image
Pupil Image: Pupil image during REF measurement (Selectable for the OPD map only)
Keratometric: Respective maximum and minimum diopters and their directions over 3mmdia., 5mm-dia., and 7mm-dia. circumferences.
Pupil Contour: Pupil edge
For the Eye Image, select “Photopic” (photopic pupil image) or “Mesopic”
(mesopic pupil image).
In the case of the OPD map, Target “Refractive” map, Internal OPD map,
Wavefront High Order map, Wavefront Total map and Wavefront Group map,
the area outside the pupil outline is shaded.
Rings:Detected placido-ring edges (shown in red and yellow lines)
Border Line: This is for setting whether or not to draw boundaries in black. Use this option
when the areas of adjacent steps are shown in closer colors with an absolute
color scale etc.
5. Press
.
The screen returns to the Map View screen and the displayed maps will be updated as specified.
NOTE
• Changes to map types and overlay options in the “Select Map Type/ Pattern” dialog are
temporary ones. The changed will be cleared once you select another patient or turn
OFF the instrument. For setting permanent map types and overlay options on the Map
View Settings screen, see “5.2.1 Setting “View 1”, “View 2” and “View 3””.
5 - 59
[Overlay options]
Angle Scale
Cross Cursor
Angle Scale, Cross Cursor,
Captured eye image
(Eye Image)
Eye Image
Sections
Vertex point (Red cross)*13
Point of measuring light (Black cross)*14
Grid
Maximum and minimum refractive
powers and their directions
Keratometric
*13 Checking the “Grid” overlay option displays a vertex point (small red cross) and point of the
measuring light (small black cross) as well as sections. Because these 2 points are located
close to each other, the small red cross may overlap with the small black cross and the small
red one may not be able to be seen.
*14 Checking the “Grid” overlay option displays a vertex point (small red cross) and point of the
measuring light (small black cross) as well as sections. The small black cross represents a
point of the CT-measuring light axis (measuring center) in the case of the following maps:
Axial map, Instantaneous map, “Refractive” map, Target “Refractive” map, Elevation map
(Color 2D), Eye Image or Internal OPD map.
The small red cross represents the point of the REF measurement axis (measurement center) in
the case of the following maps: OPD map, Wavefront High Order map, Wavefront Total map,
an Wavefront Group map.
5 - 60
Pupil contour
Captured image
(Pupil Image)
Pupil center
(White cross) Pupil contour
Pupil center
(White cross)
Pupil Contour
Pupil image during
CT measurement
Pupil center
(Mesopic: Cyan, Photopic: Violet)
Pupil Image, Pupil Contour
Mesopic pupil outline
(Cyan outline)
Rings (Detected placido ring edges)
Photopic pupil outline
(Violet outline)
Rings
Photopic pupil contour (In the case of “Eye Image”)
Border Line
5 - 61
5.3.2 Changing the color scale (Select Color Scale)
The color scale for the displayed map can be changed.
1. Press an area below the color scale to be
changed on a map on the Map View screen.
Clicking an area displays the
“Select Color Scale” dialog.
The “Select Color Scale” dialog opens.
2. Change the color scale settings.
Mode: For setting the color scale type.
Two types of color scales are available: Relative color scale and absolute color scale
Relative color scale (Normalize): A histogram of a map is calculated and an appropriate
increment (Step) and intermediate value (Middle) are automatically set for the best possible
use of the color scale. The set increment and intermediate value cannot be changed. Select
an unit of the scale (D/mm) from the “Scale” area and number of color and color scheme from
the “Color” area.
Individual ⇒ For each individual map, an increment and intermediate value are calculated
from the maximum and minimum values of the map to make the best possible
use of the color scale.
Common ⇒ For each individual map type, an increment and intermediate value are
calculated from the maximum and minimum values.
However, the color map
Maps displayed based on the
same color scale as “Common”
pairs shown in the right
Axial map and Instantaneous map
table are respectively
“Refractive” map and Target “Refractive”
map
displayed based on the
Wavefront High Order map, Wavefront
Total map and Wavefront Group map
same color scale.
5 - 62
Min Step ⇒ This is for specifying the minimum increment value.
The calculated increment in the case of the “Individual”
or “Common” of the “Normalize” does not become
smaller than the specified value here.
Common of Adjustable: This is also a relative scale. Unlike the
“Common” of the “Normalize”, the calculated increment and intermediate
value can be changed in the “Middle & Step” area by viewing the histogram.
Checking ( ) “ Auto Step” will automatically set an appropriate
increment for a specified intermediate value.
Intermediate
value
Histogram
Absolute color scale (Absolute): With the scale, the increment and range are constant.
Regardless of the patient’s refractive conditions, areas of the same diopter are always shown
in the same color on a map. This color scale is useful for a comparison among multiple maps.
Select from two types of the absolute color scales.
Smolek_Klyce [1.5D]:
The Smolek Klyce scale. An area in the 30D to 67.5D range is shown
in 26 colors in increments of 1.5D with the fixed color scale.
Absolute [26]: The Absolute scale has the same color scheme as the Smolek Klyce
scale and the same 26 colors. Peripheral diopters in the 9D to 101.5D
range are shown in wider increments.
* The absolute color scale can only be applied to the Axial, Instantaneous, “Refractive”, and
Target “Refractive” maps.
Color: For setting color schemes and the number of colors available with the color scale.
ISO ⇒ The color schemes are in conformity with ISO-recommended ones. Specify a
color number in the entry box to the right of the “ISO” radio button. (15 to 25
color schemes: Red > Green > Blue)
NIDEK ⇒ The following color schemes are available. Designate a color number in
the entry box to the right of the “NIDEK” radio button.
White > Red > Yellow > Green > Blue > Violet (9 to 51 colors)
Smolek_Klyce ⇒Provides the same color scheme as that of the Absolute color scale
(Pink > Red > Yellow > Green > Blue > Navy blue) with a fixed
color number of 26.
Scale: Unit setting of the color scale. mm (Curvature radius), µm or Diopter (Refractive power)
The set unit is applicable to the Axial map and Instantaneous map only. For the other
maps, the unit is fixed.
3. Press
.
The changed color scale will be applied.
Green characters under the color scale show the specified color scale.
Norm : Normalize
Indv : Individual
Com : Common
Number : Increment
Adj: Adjustable
Com : Common
Number: Increment
Abs.: Absolute
S-K 1.5: Smolek- Klyce [1.5D]
26: Absolute [26]
5 - 63
NOTE
• Changes to a color scale in the “Select Color Scale” dialog are temporary.
The changes will be cleared once you select another patient’s data or turn the
instrument OFF. For setting a permanent color scale from the Map View Settings
screen, see “5.2.2 Setting a color scale”.
5.3.3 Changing an exam displayed on a map to another exam No.
For a patient with multiple exams saved in the database, it is possible to change an exam displayed
on a map to one with another Exam No. (This is available only when displaying an exam on a
map retrieved from the database.).
1. Press the measurement date and time in a
desired map on the Map View screen.
The patients’ Exam Nos. and their comments if
any will be listed.
Exam Nos. of single-eye data only will not be
displayed
2. Press a desired Exam No. to select.
The map of the selected Exam No. will be
displayed.
NOTE
• A change of an Exam No. displayed on a map on the Map View screen is temporary.
The changed Exam No. will be reset back to the previous one once you select another
patient or turn the instrument OFF.
5 - 64
5.3.4 Zooming in on a map
Pressing
under the color scale of each map
enlarges the map only.
Used to enlarge a map.
Pressing
returns the map to its original
magnification.
5.3.5 Checking the distance between two points
The distance between desired two points on a color map may be checked.
1. Make the cross cursor (“Cross Cursor” overlay option) appears on a color map.
Difference in diopter between the
See “5.3.1 Changing map types and overlay options”.
2. Press a starting point on a map to designate
while pressing Shift .
The cross cursor moves to a starting point.
Starting point
starting point and end point,
Distance between the starting point
and end point@Angle
3. Drag the cross cursor to a desired point as
an end point by pressing Shift .
The difference in diopter between the starting
point and end point (dPwr) and the distance
(dDist) are displayed over the cross cursor.
Pressing any point on the map without pressing
Shift returns the cross cursor to a normal one.
End point
The distance between two points is uniformly displayed in all the maps with cross cursors displayed.
[When displaying a distance between two desired points respectively on each individual map]
Specify the starting point and endpoint in each map as instructed from Step 1 to Step 3. In Step
2 and Step 3, specify the starting point and endpoint while simultaneously pressing the Shift
key and the Ctrl key instead of the Shift key only.
5 - 65
5.4 Displaying the Difference Map
A Difference map shows differences between two maps which are being displayed. Note that
both maps should be of the same eye (Left or Right).
In addition, be aware that it is impossible to display a difference between two Elevation maps on
the Difference map. The following explains one example of showing differences between map
(1) and map (2) on map (3).
1. Select “View 1”, “View 2”, or “View 3” to
which the Difference map is assigned.
See “5.2.1 Setting “View 1”, “View2”, and
“View 3” or “5.2.1.8 When selecting the
Difference map”.
2. Designate two exams whose difference is to
be displayed.
[Example: Obtaining the difference between Exam No.1 and Exam No.4 of a patient whose ID
is 000009.]
1) Press the patient’s line whose ID is “00009”
(a desired patient line).
Exams of the selected patient are listed in
the lower field.
2) Press the line for Exam No.1 (to be displayed
on map (1)).
3) Press the Map (1) button.
“1” is entered into the “Map No.” box of
the exam line selected in Step 2).
4) Press the line for Exam No.4 (to be displayed
on map (2)).
5) Press the Map (2) button.
“2” is entered into the “Map No.” field of
the exam line selected in Step 4).
3. Press
.
The Map View screen including the Difference
map opens.
Map (1) button
Map (2) button
5 - 66
5.5 Manual Pupillary Distance (PD) Measurement
If the “Auto PD” check box on the Settings screen is checked, the pupillary distance (PD) will
also be measured automatically .
If the “Auto PD” check box is unchecked, the PD will not be measured during REF or AR
measurement. In this case, it is also possible to manually measure the PD by selecting the PD
measurement mode.
1. Uncheck the “Auto PD” check box on the Settings screen.
2. Select the PD measurement mode by pressing the measurement select button on the
measurement screen several times.
When the PD measurement mode is selected, the symbol of the measurement select button will
be changed to
.
3. Instruct the patient not to move his/her head and eyes during the measurement.
4. After precise alignment of the right and left
eyes, press the start button each time.
When the start button is pressed, the color
of “Right”,”Center” and “Left” indication will
be changed from gray to black.
NOTE
Right-eye monocular PD Binocular PD area Left-eye monocular PD area
area
• If the patient’s head is tilted, make it straight before starting measurement.
• To measure the monocular PD at the same time as the binocular PD, press the start
button every after proper alignment of the right-eye, middle (middle of the nose bridge),
and the left-eye.
It is recommendable to use the pupillary distance meter such as the NIDEK PM-600
in order to obtain precise monocular PD.
5 - 67
5.6 Database
Loading of measured data from another instrument, outputting of data to another instrument,
editing of data, and backing-up of data are explained. As for the procedures for saving measured
data into the database and those for retrieving an exam from the database, see “4.8 Saving measured
data” and “4.6.2 Retrieving an exam from the database and displaying it in a map”.
5.6.1 Importing external data into the database (Import)
Output data on a floppy disk from another ARK-10000 unit is loaded into the database for use.
1. Insert a floppy disk into the floppy disk
drive.
2. Open the Patient Selection screen.
on the measurement screen.
Press
3. Press
.
The screen is switched to the Import (Outside
to Inside) screen.
4. Press to select a patient line to be loaded.
Selecting a patient lists his/her exams in the
bottom area of the screen.
Pressing
selects all the patients from an
external source.
5. Press the exam data to be loaded.
Pressing a patient line in Step 4 automatically
selects all the exam data of the selected patient.
To load desired exam (exams) only, press the
data line(s) to select.
In addition, pressing the second exam and after
while holding the Ctrl key or Shift key down
makes it possible to select multiple exams.
For an exam that obtained results for both eyes
in succession:
Selecting the exam also selects the exam for
the other eye.
5 - 68
6. Press
.
Data import is started. At the completion of
data import, the message dialog is displayed.
When “Same patient ID exits!” dialog is
displayed ⇒ See [If patient data with the same
ID already exists in the database of a target
ARK-10000] below.
7. Press OK button.
The screen returns to the Import (Outside to
Inside) screen.
8. Press
.
The screen returns to the Patient Selection
screen.
9. Eject the floppy disk.
[If patient data with the same ID already exists in the database of a target ARK-10000]
If patient data with the same ID, but with a
different name and/or sex, already exists in
the database of a target ARK-10000, The
“Same patient ID exits!” dialog appears in
Step 6. Lines with different data will be
shown in yellow.
To add the imported patient’s exam data
under the existing patient’s personal data:
⇒ Press
.
A message encouraging the operator
to confirm the addition appears.
Press Yes .
If a patient ID (or the patient data) on a
floppy disk (Outside) or in the database
(Inside) is incorrect:
⇓
1) Press
or press twice the “Same patient
ID exist!” dialog.
The “Message” dialog appears.
5 - 69
2) Press Yes .
3) Change the ID (or patient data) and press
.
Inside: In the database
Outside: In a floppy disk
The message dialog appears, encouraging
the operator to confirm if he/she modify the
ID (or patient data).
4) Press Yes .
will change to
.
5) Again, confirm the ID (or patient data) and
press
.
The message dialog which encourages the
operator to confirm if he/she loads the data
appears.
6) Press Yes to start data import.
After the completion of data import, the
message dialog appears to inform the
operator of the completion of data import.
7) Press OK .
8) Press
.
The screen returns to the Patient Selection
screen.
5 - 70
5.6.2 Outputting an exam from the database (Export)
Exams saved in the database are saved in a designated drive.
The output data can be loaded and viewed in a device such as another ARK-10000 unit.
1. Open the Patient Selection screen.
Press
on the measurement screen.
2. To save an exam on a floppy disk, insert a
disk into the floppy disk drive.
Use a MS-DOS-formatted 3.5-inch 2HD floppy
disk. Refer to “5.10 Formatting a Floppy Disk”.
Floppy disk drive
Eject button
3. Press
.
The Export (Inside To Outside) screen is
opened.
4. Press to select patient’s data line to be output.
Pressing an item name on the upper part of the
screen (ID, Name, Sex, Group, Last Exam Date)
sorts data in ascending order within the item
field. Pressing the item name once again sorts
data in descending order. To search for data,
use the “Search Patient Data” dialog. See
“[“Search Patient Data” dialog]” (p.3-13).
5 - 71
5. Press to select exam data to be output.
Pressing a patient line as in Step 4 automatically
selects all the exam data of the selected patient.
To load desired exam (exams) only, press the
data line(s) to select.
In addition, pressing the second exam and after
while holding the Ctrl key or Shift key down
makes it possible to select multiple exams.
For an exam that obtained results for both eyes
in succession:
Selecting the exam also selects the exam for
the other eye.
An expected size of a file to be output is calculated and
displayed at “Selected file size”.
(1MB = 1000KB, 1GB = 1000MB)
6. Press
.
The “Export Settings” dialog is displayed.
File format
Ordinarily, select “V1.10D or later”.
To output data to the ARK-10000 with V1.09D program or earlier,
select “V1.09D or earlier”.
Set whether or not to output pupil image data obtained during CT
measurement.
Set whether or not to output pupil image data obtained during AR
measurement.
Set whether or not to output the calibration file on which the output
exam data is based.
7. Select data output format and press
.
Select data output format according to the target device that receives the output data.
It is also possible to set so that the “Export Settings” dialog is not displayed every time data is
output. See “[Setting specifications for data output format] ” (p.5-74).
The selected exam will be saved. At the
completion of saving, the “Exporting of exam
data has been completed” message appears.
If the “Same patient ID exists!” dialog is
displayed ⇒ See [If patient data with the same
ID already exists in a destination] (p.5-72).
8. After saving data to a floppy disk, eject it.
Press the eject button on the floppy disk drive.
CAUTION
• Do not eject a floppy disk while the lamp of the floppy disk drive is illuminated.
Corruption of the floppy disk, or a breakdown of the floppy disk drive may result.
5 - 72
[Changing the destination of data output]
Select a desired drive and directory in the “Import/Export” area in the “Select Data Directory”
dialog. See “5.6.4.3 Setting a target location for backup data, imported data or exported data
”.
It is also possible to change the destination of data output on the Export (Inside to Outside)
screen.
Target location for imported or exported data
Checking the target location for
imported or exported data ⇒
The location is shown in the “Import/
Export” field in the upper part of the
screen.
Changing the target location for
imported or exported data ⇒
Press
on the right to open the
“Browse for Folder” dialog and select
the target location.
Creating a new directory ⇒
Press
on the right to open the
“Create New Directory” dialog and
create a new directory.
[If patient data with the same ID already exists in a destination]
If patient data with the same ID already exists
in a destination, the “Same patient ID exists!”
dialog appears in Step 7.
To add the imported patient’s exam data
under the existing patient’s personal data:
⇒ Press
.
A message encouraging the operator
to confirm the addition appears.
Press Yes .
To delete exam data on a destination:
⇒ Press
.
If a patient ID (or the patient data) on a floppy disk (Outside) or in the database (Inside)
is incorrect:
⇓
1) Press
or press twice the “Same patient
ID exists!” dialog.
The “Message” dialog appears.
5 - 73
2) Press Yes .
3) Change the patient ID (or patient data) and
then press
.
Inside: In the hard drive database
Outside: In a floppy disk
The “Message” dialog appears.
4) Press Yes .
button changes to
.
5) Check the patient ID (or patient data) again
and press
.
The “Message” dialog appears.
6) Press Yes to start savings.
5 - 74
[Setting specifications for data output format]
1) Open the Patient Selection screen.
Press
on the measurement screen.
2) Open the Database Settings screen.
Press
.
3) Open the “Export Settings” dialog.
Press
.
4) Select either the “Set each time of exporting”
option or the “Set now” option.
Set each time of exporting.
Select an output format for each data export.
Set now.
Data is exported constantly in the format
specified in the “Set now” area.
Item
File Format
Export Pupil image during CT
measurement.
Export Pupil image during AR
measurement.
Export Calibration files
Factory setting
Explanation
To output data to the ARK-10000 of program
V1.10D or later
V1.09D or earlier, select "V1.09D or earlier".
Setting of whether or not to output the
captured pupil image in the CT measurement
Yes
together with the data
Setting of whether or not to output the
captured pupil image in the AR measurement
Yes
together with the data
Setting of whether or not to output the
calibration file on which the output exam data
Yes
is based
File size
—
170 KB /eye
170 KB /eye
15 KB / eye
* Data for both eyes with pupil images captured during the CT or AR measurements that is
approx.1.3 MBytes in size can be output to a floppy disk.
5) Press
.
The screen returns to the Database Settings screen.
6) Press
.
The screen returns to the Patient Selection screen.
5 - 75
5.6.3 Editing data
Patient data saved in the database can be modified.
5.6.3.1 Editing patient data (Edit Patient Information)
1. Open the Patient Selection screen.
Press
on the measurement screen.
2. Press a desired patient line to select and press
it additional two times.
The Edit Patient Information screen is opened.
Or select a patient line and press
to open
the Edit Patient Information screen.
3. Modify or type in data in a desired field.
Pressing on data heading twice opens its entry
field. Modify or type in data using the keyboard.
The data with a “ ” mark on its left cannot
be modified.
4. Press
.
The screen returns to the Patient Selection
screen.
NOTE
• Use a unique ID such as a carte number.
If an already assigned Patient ID is entered, the message, “The input Patient ID
already exists.” will appear, and the entered Patient ID will be rejected.
5 - 76
5.6.3.2 Editing exam data (Edit Exam Information)
1. Open the Patient Selection screen.
Press
on the measurement screen.
2. Select a patient.
Selecting a patient lists the exams of the selected
patient.
3. Press twice exam data to be edited.
The Edit Exam Information screen is opened.
Or select exam data to be edited and press
to open the Edit Exam Information screen.
4. Modify or type in desired data.
Pressing each data heading twice opens its entry
field. Modify or type in data using the keyboard.
The data with a “ ” mark on its left cannot
be modified.
5. Press
.
The screen returns to the Patient Selection
screen.
5.6.3.3 Deleting data (Delete)
Data retrieved from the database is deleted.
1. Open the Patient Selection screen.
Press
on the measurement screen.
2. Press
.
The Delete screen is opened.
5 - 77
3. Select data to be deleted.
[Deleting all the data of a patient]
Press a patient line to be deleted on the Delete
screen.
Pressing an item name on the upper part of the
screen (ID, Name, Sex, Group, Last Exam Date)
once sorts the data in ascending order within
the item field. Pressing the item name once
again sorts the data in descending order.
To search for data, use the “Search Patient Data”
dialog. See “[“Search Patient Data” dialog]”
(p.3-13).
All the exams of the patient are deleted.
[Deleting an exam (exams) of a patient]
1) Press a patient line to select on the Delete screen.
Pressing patient line lists and highlights all the exams of the patient in the bottom area of the
screen.
2) Press to select an exam line (lines) to be
deleted.
For an exam that obtained results for both
eyes in succession:
Selecting the exam of one eye also selects
the exam for the other eye.
These exams only will be deleted
4. Press
.
A message dialog appears, encouraging the
operator to confirm the deletion of the selected
data.
5. Press OK .
The selected exam will be deleted.
6. Press
.
The Delete screen is switched to the Patient
Selection screen.
5 - 78
5.6.4 Backing up or rebuilding the database
5.6.4.1 Backing up the database (Database Backup)
It is recommended to regularly back up the database in case of a database crash. The database
will be backed up in a directory in a drive that are specified in the “Backup Data” field on the
“Select Database Directory” dialog (p. 5-82).
1. Open the Patient Selection screen.
Press
on the measurement screen.
.
2. Press
The “Database Backup” dialog is displayed.
If both backup destination and database are
located in the same drive, a message appears
encouraging the operator to designate the
backup destination in another drive.
Yes ⇒ Backs up data in the drive.
No ⇒ Cancels the backup process.
3. Check a backup type to select.
Back up: Backs up data. The backed-up data will be saved and used for rebuilding the database.
The “Back up” has the following options:
Differential ⇒ Only the data added and modified since the last backup will be backed up.
Ordinarily, select this option ( ).
All ⇒ The whole database including already backed-up data will be backed up. Use this
option if a storage disk where the backup data was saved is corrupted or after changing the
target location for backup data.
Free up: After data backup, data will be deleted from the oldest one in order to free up the
specified hard disk space.*15
Delete: The data which has not been retrieved for the specified year will be deleted by an item
of patient data.*16 This allows the operator to delete the data which is out of retention period.
*15 See “5.6.4.4 Setting data deletion criteria” to specify a free space. Long-unused data will be
deleted in order.
*16 See “5.6.4.4 Setting data deletion criteria” to specify a retention period.
5 - 79
4. Press
.
The progress bar reports the progress of the
backup process.
Number of patients whose data will be saved
Number of patients whose
data has already been saved
The backup may take time.
Pressing
discontinues the backup process.
In such cases, the data backed-up until the
backup process was discontinued will be
effective.
When backup is completed, the “Database
backup has been completed.” message is
displayed.
5. Press OK button.
The screen returns to the Patient Selection
screen.
CAUTION
• Be sure to back up data on a storage disk such as a ZIP disk or DVD-RAM.
In case of built-in hard disk corruption, saved data can never be used again. In
addition, a storage disk such as CD-R, CD-RW, DVD-R which need writing software
are improper for data backup.
• Operators are responsible for managing obtained data.
NIDEK assumes no responsibility for a loss of data.
NOTE
• The internal hard disk is factory-selected as a backup location.
Backing up data on the internal hard disk instead of specifying a storage disk as a
backup destination reduces the internal database capacity by half compared to backing
up data on a storage disk.
This is because both data in the database and its backup data stored on the internal
hard disk take up a part of the internal hard disk space to be allocated for a database.
5 - 80
5.6.4.2 Rebuilding the database (Rebuild Database)
In case of a database crash, rebuild the database from backup data or data remaining in data folders.
1. Open the Patient Selection screen.
Press
on the measurement screen.
2. Open the Database Settings screen.
Press
.
3. Press
.
The “Rebuild Database” dialog is displayed.
4. Check a rebuild type to select.
Check the contents…: Used to rebuild the database over the currently-used Index folder
and Data folder.
Erase the current …: Use to restore backup data after replacing the instrument with another
or after replacing the internal hard disk because of a failure etc.
CAUTION
• Rebuilding the database by selecting the “Erase the current …” option will totally
erase the current database. Do not select this option carelessly.
To retain the contents of the current database, back up the current database in advance.
• After data backup on a storage disk, once-deleted data from the database can never be
recovered even by rebuilding the database with the “Check the contents…” option
selected.
5 - 81
5. Press
.
If the “Check the contents…” option has been
selected:
⇒ The rebuilding of the database is started and
progress bar is shown .
The rebuilding may take some time. Go to
Step 9.
If the “Erase the current…” option has been
selected:
⇒ The message dialog on the right is displayed.
Go to Step 6.
6. Press the OK button.
The message encouraging the operator to insert
a backup disk appears.
If the built-in hard disk has been designated as
backup location, the database will be rebuilt.
Go to Step 9.
7. Insert the backup disk and press the OK
button.
Rebuilding of the database is performed. When
all the data on the inserted backup disk has been
loaded, the same message as in Step 6 appears.
8. Insert the next backup disk and press the OK button.
Repeat Steps 7 and 8 to load all the data on all the backup disks.
When the loading of all the data has been completed, press the Cancel button to finish the
rebuilding process.
9. After the completion of rebuilding, the
message “Rebuilding of database has been
completed” appears.
10. Press OK button.
The screen returns to the Database Settings
screen.
11. Press
.
The screen returns to the Patient Selection screen.
5 - 82
5.6.4.3 Setting a target location for backup data, imported data or
exported data (Select Database Directory)
The target location for a backup database, imported data, or exported data is changed.
CAUTION
• The initial data backup after changing the target location in the “Backup Data” field in
the “Select Database Directory” dialog should be performed on condition that the “All”
option of the “Back up” is selected. (See p. 5-78.)
• Changing the storage location in the “Index”, “Data”, “Backup Index” or “Backup
Data” field to an improper one may result in a loss of exam data.
When changing factory-set storage locations, consult NIDEK or your authorized
distributor.
1. Open the Patient Selection screen.
Press
on the measurement screen.
2. Recall the Database Settings screen.
Press
.
3. Press
.
The “Select Database Directory” dialog is
displayed.
5 - 83
4. Change a desired item.
Designate a desired drive or directory. It is also possible to designate a desired item from a
reference dialog by pressing
on the right side.
Entry box
Explanation
Index
Storage location of the database index. An external storage device
cannot be designated in this field.
Data
Storage location of the exam (analysis) data. It is recommended to
designate the internal hard disk although an external storage device
can be specified. On condition that an external storage device is
designated, only index data will be backed up at the time of backup.
It is impossible to designate the same folder as the "Backup Data"
field and "Import/Export" field.
Backup Index
Storage location of the copied index files created when the system is
shut down. The copy is used for rebuilding the database. An external
storage device cannot be designated in this field.
Backup Data
Database backup destination. It is impossible to specify the same
folder as the "Data" field and "Import/Export" field. The internal hard
disk is factory-set in this field. It is necessary to change the
destination to back up the database on an external storage device.
When the backup destination has been changed, select the "All"
option when backing up for the first time.
Calibration
Not used.
Import/Export
Data import or export destination. It is impossible to designate the
same folder as the "Data" field and "Backup Data" field.
5. Press
.
The screen returns to the Database Settings screen.
6. Press
.
The screen returns to the Patient Selection screen.
[When backing up data on a storage disk]
It is possible to backup data by connecting a USB or parallel-port external storage drive such
as a ZIP drive.
USB external storage device => Connect it to the USB connector.
External storage device provided with a parallel port => Connect it to the printer connector.
As for the connection method of each external storage device, refer to the manual of the
device.
To back up data on a storage disk, designate a target directory in the “Backup Data” field.
To avoid confusion among the used storage disk such as a Zip disk, be sure to assign a label
to each volume.
5 - 84
5.6.4.4 Setting data deletion criteria (Backup Settings)
The settings are specified for data deletion when saving backup data.
1. Open the Patient Selection screen.
Press
on the measurement screen.
2. Recall the Database Settings screen.
Press
.
3. Press
.
The “Backup Settings” dialog is displayed.
Warning level at startup
Target free space for
“Free up” backup
Retention period
4. Set data deletion criteria.
1. Warning if the disk free…: If free space of the internal hard disk is less than the specified
capacity in this field (Unit: MB), the message appears during the ARK-10000 startup to encourage
the operator to perform “Free up…” backup (to delete older data after data backup).
2. Free up…: The value shows the target free space of the internal hard disk (Unit: MB).
Backup with “Free up…” checked will free up disk space to allocate at least the free space
specified in the field. To use once-deleted data after the “Free up…” backup, retrieve the data
from a storage disk.
3. Delete patient data permanently…: After the execution of “Delete…” process which is
selectable from the “Database Backup” dialog, the data which has not been updated for the
specified year in the field will be deleted
If “0” is entered, it is impossible to check “Delete”. To make the “Delete…” selectable, input
a retention period in this field (Unit: Year).
5. Press
.
The screen returns to the Database Settings screen.
6. Press
.
The screen returns to the Patient Selection screen.
5 - 85
5.7 Outputting Map Data
The outputting of numerical data or map image of a displayed map is explained.
5.7.1 Outputting numerical data from a map (Save Map
Information)
The numerical data of a displayed map is saved
on a storage disk such as a floppy disk. The
output data can be imported to a computer and
loaded into such software as a spreadsheet
program. The output file will be in the CSV
format.
1. To save the data on a floppy disk, insert a
disk into the floppy disk drive.
Use a MS-DOS-formatted 3.5-inch 2HD floppy
disk. See “5.10 Formatting a Floppy Disk”.
Floppy disk drive
Eject button
on the Map View screen.
2. Press
The “Save Map Information” dialog appears.
3. Check the target drive and directory in the
“Directory” field.
Press
and designate a directory where the
data file is to be output.
To save the data to a floppy disk, input “A:\”.
4. Press
.
The numerical data of the displayed map is
saved on the floppy disk.
When the data has been saved successfully, the
message “Saving of the map information has
been completed” appears. If the data was not
saved because of a shortage of free space on a
target floppy disk, the error message “Couldn’t
save the map information!” appears.
5 - 86
5. Press OK .
6. When the data has been saved on the floppy disk, eject it.
Press the eject button to eject the floppy disk.
CAUTION
• Do not eject the floppy disk while the lamp of the floppy disk drive is illuminated.
Corruption of the floppy disk, or a breakdown of the floppy disk drive may result.
5 - 87
5.7.2 Outputting map images (Save Map Image)
The map image that is being displayed on the screen is saved in the procedure below.
The map images are output in the JPEG format or in the BMP format.
1. Press
on the Map View screen.
The “Save Map Image” dialog opens.
2. To save the map image on a floppy disk,
insert it into the floppy disk drive.
Use a MS-DOS-formatted 3.5-inch 2HD floppy
disk.
See “5.10 Formatting a Floppy Disk”.
3. Designate an output format from the
“Output Type” area.
JPEG format: A JPEG file in a compressed image file format is smaller in size but lower in
image quality than a BMP file.
BMP format: A 16-bit uncompressed image file. Some image processing software does not
support the BMP files.
4. Confirm a target drive and file name.
The file name is automatically assigned as:
When “Enter ID to file name” is selected: (ID) (Year/Month/Day) _ (Hour/Minute/Second) .jpg
(or bmp)
When “Enter Patient Name to file name” is selected: (Name) (Year/Month/Day) _ (Hour/
Minute/Second) .jpg (or bmp)
e.g.: 00000920020221_173553.jpg
Hour/Minute/Second at file output
ID
Date
To change a target drive, press
and change the drive on the “Browse for Folder” dialog.
When saving map images on a floppy disk, enter a file name following “A:\”.
Checking “ Reverse” turns black pixels white and vice versa.
5. Press
.
The image file will be saved and the “Message”
dialog will be displayed.
6. Press OK .
[When saving a map image changing its background]
Checking the “
Use Background Image” and pressing
in the “Background Image”
field, opens the “Select Background Image File Name” dialog. By selecting background
data, you can save a map image with the selected background.
5 - 88
5.8 Editing Detected Edges (Tools)
Any obstacles such as eyelashes may cause edges (in red and yellow) to be detected at substantially
shifted positions from captured placido rings or to have breaks.
Edge editing tools allow you to correct edges that are shifted.
Four tools are available:
Move: Used to align a detected edge that is shifted from a captured placido ring by moving a
midpoint of a designated arc.
Extend: Used to move an endpoint of the selected edge to change the selected edge in length
or in direction.
Close: Used to close a gap in a detected edge.
Erase: Used to erase an unwanted edge.
5.8.1 Entering edge edit mode
The edge editing tools can be activated during an examination or by retrieving a saved exam in
the database. The method of entering the edge edit mode is explained for both cases.
[During an examination]
Press
on the confirmation screen of the
detected edges to enter the edge edit mode.
The “Tools” dialog opens and detected edges are
shown in blue.
[Retrieving an exam from the database]
1) Select exam data to edit from the Patient
Selection screen.
2) Press
.
After loading the CT-captured image, the
confirmation screen of a detected result is
displayed.
3) Press
to enter the edge edit mode.
The “Tools” dialog opens and detected edges
are shown in blue.
NOTE
Confirmation screen of a detected result
Edge edit mode
• Only exams obtained on your ARK-10000 can be edited on your ARK-10000 by
retrieving them from the database. Imported data from another ARK-10000 cannot be
edited on your ARK-10000.
5 - 89
5.8.2 Adjusting a curved edge (Move)
This tool is for aligning a detected edge that is
shifted from a captured placido ring.
1. Enter the edge edit mode.
See “5.8.1 Entering edge edit mode”.
Detected edges
2. Trace an arc in a range of a detected edge
that is shifted from a captured placido ring
image.
The designated range of the arc turns red. To
deselect the designated arc, press
to return
it to blue.
3. Press
.
The arc in the designated range turns into a
yellow dashed line with a cyan “×” at the range
midpoint.
4. Move the cyan “×” to an edge of a captured
placido ring.
5. Make sure that the yellow dashed arc aligns to the approximate captured placido ring
and press
.
The detected edge will change its curve to that of the yellow dashed arc.
Press
not to modify the selected arc as indicated by the yellow dashed arc.
6. In the same manner, align other substantially shifted edges to the appropriate captured
placido ring.
7. Press
to exit from the edge edit mode.
The display returns to the confirmation screen of detected edges.
8. After confirming the edited edges, press
to exit the confirmation screen.
For data retrieved from the database, designate how to save edited data from the “Confirmation”
dialog:
Overwrite button ⇒ The edited data is written over original data. (The original data will
be deleted.)
Addition button ⇒ The edited data is saved with a new Exam No. assigned.
Cancel button ⇒ The edited data will not be saved.
5 - 90
5.8.3 Moving an end point (Extend)
Detected edges
This tool is for extending a detected edge in a
desired direction. A designated arc can be
changed in length or in direction by moving a
selected end point of the arc.
1. Enter the edge edit mode.
See “5.8.1 Entering edge edit mode”.
2. Trace an arc in a range whose end point is
shifted to designate.
The arc in the designated range turns red. To
deselect the designated arc, press
to return
it to blue.
3. Press
.
The arc in the designated range turns into a
yellow dashed one with a cyan “×” at an
endpoint.
4. Move the cyan “×” to a desired position.
5. Make sure that the yellow dashed arc aligns to the appropriate captured placido ring and
press
.
The detected edge will modify its curve to that of the yellow dashed arc. Press
not to
modify the designated arc to the carve indicated by the yellow dashed arc.
6. In the same manner, align other substantially shifted edges to the appropriate captured
placido ring.
7. Press
to exit from the edge edit mode.
The display returns to the confirmation screen of detected edges.
8. After confirming the edited edges, press
to exit the confirmation screen.
For data retrieved from the database, designate how to save edited data from the “Confirmation”
dialog:
Overwrite button ⇒ The edited data is written over original data. (The original data will
be deleted.)
Addition button ⇒ The edited data is saved with a new Exam No. assigned.
Cancel button ⇒ The edited data will not be saved.
5 - 91
5.8.4 Closing a gap (Close)
Detected edges
This tool is for closing a gap in a detected edge.
close a gap
1. Enter the edge edit mode.
See “5.8.1 Entering edge edit mode”.
2. Trace an arc range containing a break to
designate it.
Trace between both sides of a break in one
stroke. Releasing a finger or a touch-screen
pen from the panel halfway through tracing
results in a designation of one side of the gap
only.
The arc in a designated range turns red. To
deselect the designated arc, press
to return
it to blue.
3. Press
.
The gap in the designated arc will be bridged
by a yellow dashed line.
4. Make sure that the yellow dashed arc aligns
to the captured placido ring and press
.
The gap in the detected edge will be bridged as
shown by the yellow dashed arc. Press
not
to close the gap.
5. In the same manner, close a gap in an edge.
6. Press
to exit from the edge edit mode.
The display returns to the confirmation screen
of detected edges.
7. After confirming the edited edges, press
to exit the confirmation screen.
For data retrieved from the database, designate how to save edited data from the “Confirmation”
dialog:
Overwrite button ⇒ The edited data is written over original data. (The original data will
be deleted.)
Addition button ⇒ The edited data is saved with a new Exam No. assigned.
Cancel button ⇒ The edited data will not be saved.
5 - 92
5.8.5 Erasing edges (Erase)
The tool is for erasing an improperly-detected edge.
1. Enter the edge edit mode.
See “5.8.1 Entering edge edit mode”.
2. Trace to designate an edge range to be erased.
The designated range turns red.
To deselect a designated edge range, press
to return it to blue.
3. Press
.
The designated range turns into a yellow dashed line.
4. Make sure that the yellow dashed arc is the
one to be erased, and press
.
The yellow dashed arc will be erased. To cancel
the erasing, press
.
5. In the same manner, erase an edge that is substantially shifted from a captured placido
ring.
6. Press
to exit from the edge edit mode.
The display returns to the confirmation screen of detected edges.
7. After confirming the edited edges, press
to exit the confirmation screen.
For data retrieved from the database, designate how to save edited data from the “Confirmation”
dialog:
Overwrite button ⇒ The edited data is written over original data. (The original data will
be deleted.)
Addition button ⇒ The edited data is saved with a new Exam No. assigned.
Cancel button ⇒ The edited data will not be saved.
5 - 93
5.9 Settings
The settings of parameters, date, time and automatic assignment of patient ID are explained.
5.9.1 Setting parameters (Settings)
Specifications related to measurement, the built-in printer, or data communication can be modified
from the Settings screen.
1. Open the Settings screen.
Press
on the measurement screen.
2. Change a desired parameter setting.
: The setting is ineffective,
: The setting
is effective,
=> Press the option button of a desired value
etc (The button is turned into
).
3. Press
.
The screen is switched back to the measurement
screen.
[Measure]
Parameters related to measurements. It is also possible to set “Step”, “VD”, “Axis” and “Reading”
from the “Other” tab of the Map View Settings screen.
Step: 0.25, 0.125, 0.01
Factory setting: 0.25 [D]
Setting of the indication increment of SPH and CYL data for AR measurement.
Printed keratometry data is also based on the increment indicated.
VD: 0.0, 10.5, 12.0, 13.75, 15.0, 16.5
Factory setting: 12.0 [mm]
Setting of the vertex distance (distance between the corneal vertex to a posterior surface
of a spectacle lens if a patient wears spectacle lenses).
Axis: 1, 5
Factory setting: 1 [º]
Setting of the Axis indication increment.
5 - 94
Reading: –, MIX, +
Factory setting: –
Selection of the cylinder value sign, the reading direction of cylinder data, from “–”,
mixed (+/–), and “+” signs.
Be aware that keratometry data is shown in the “+” mode when the “+” radio button is
selected. When the “MIX” or “–” radio button is selected, the keratometry data is shown
in the “–” mode.
AI Mode
Factory setting: Checked
Selection of the shot number during AR measurement and REF measurement.
□AI Mode
Checked/Not checked
Measurement
mode
AR/KM, AR,
REF/CT, REF
Autoshot
ON
Checked
AR/KM, AR,
REF/CT, REF
OFF
Not checked
AR/KM, AR,
REF/CT, REF
OFF
Number of shot during AR measurement
Until median values are obtained (S, C, A) by taking
the median of the first 3 usable values.
When the start button is pressed once, one shot of
AR measurement takes place. While the start
button is held down, AR measurement takes place
repeatedly until AR median values are obtained (S,
C, A) by taking the median of the first 3 usable
values.
When the start button is pressed once, one shot of
AR measurement takes place. While the start
button is held down, AR measurement takes place
repeatedly.
Single Fogging
Factory setting: Checked
When the box is checked, fogging is kept on from the second time and after during
repeated AR or REF measurements.
Auto PD
Factory setting: Checked
Selection of whether or not to perform pupillary distance (PD) measurement automatically when both eyes have been measured during AR or REF measurement.
When this box is not checked, the PD will not be measured automatically; the operator
can manually select the PD measurement mode with the measurement select button. (p.
5-66).
KM Display: R1 R2, AVE CYL
Factory setting: R1 R2
Setting of the display format in which simulated keratometry data obtained during KM
or CT measurement is displayed on the measurement screen.
R1 R2: Value along the flattest meridian (R1), value along the steepest meridian (R2)
and axis angle of R1
AVE CYL: Average of R1 and R2 (AVE), amount of corneal astigmatism (CYL) and
axis angle of R1
5 - 95
KM Unit: mm, D
Factory setting: mm
Setting of the indication unit for simulated keratometry data from KM or CT measurement to be displayed on the measurement screen.
[Print]
Parameters related to the built-in printer.
Print Mode: Switch, Finish, None
Factory setting: Switch
Selection of when to start printout.
Switch: Printout is started when
or
is pressed.
Finish: Printout is started at the completion of both-eye measurement when the auto-shot
function is turned ON, or when the “AI Mode” box is checked.
None: Printout is not made.
Date Format: Y.M.D, M.D.Y, D.M.Y
Factory setting: M.D.Y
Setting of a date format on printout.
Y.M.D: Year, Month, Day
M.D.Y: Month, Day, Year
D.M.Y: Day, Month, Year
Print No. (ID)
Factory setting: Checked
Selection of whether or not to print the ID No.
Print All KM Data
Factory setting: Not checked
Setting of printout format for KM-measured data to be applied for printing the measured
data in the ARK mode. When this box is checked, all the KM-measured data is printed
out. If not, only KM median values (or the latest KM values if no KM median values
have been obtained.) will be printed out.
Print No.
Factory setting: Checked
Selection of whether or not to print patient No. when data measured in ARK mode is
printed out. The highest patient No. to be printed is designated in the “Range.” box.
e.g.: If “9999” is entered in the “Range.” box, the range of patient Nos. to be printed
out is from “1” to “9999”.
To designate the patient No., enter any number in the “No.” box.
5 - 96
Print Contact Pwr.
Factory setting: Not checked
Selection of whether or not to print CL
conversion values, which are based on
AR median values (or the latest AR values if no AR median values were obtained.), and SE values which are based
on the CL conversion values.
ID No. or patient No.
Trial lens data
CL conversion value and
Print Trial lens Pwr.
SE value
Factory setting: Not checked
Selection of whether or not to print trial lens data based on AR median values (or latest
AR values if no AR median values were obtained).
Econo Print
Factory setting: Not checked
Selection or deselection of economical printout. When the box is checked, line-spacings
are narrowed to save printer paper.
Print All AR Data
Factory setting: Checked
Selection of the print format of AR-measured data.
When the box is checked, all the AR-measured data is printed out. When the box is not
checked, only AR median values (or the latest AR values if no AR median values were
obtained) are printed out.
Print Error
Factory setting: Not checked
Selection of whether or not to print the errors that occur during AR or REF measurement
on the condition that “Print All AR Data” check box is checked. Select a print format in
the “Print Error Code” check box.
Print Error Code
Factory setting: Not checked
Selection of a print format for the errors that occur during AR or REF measurement. If
the “Print Error Code” is checked, an error code will be printed as “Error 240”. If not,
“Error” will be printed. This option is activated only if “Print Error” option has been
checked.
Print PD
Factory setting: Checked
Selection of whether or not to print the measured PD.
5 - 97
Order: R-L, AR-KM
Factory setting: R-L
Setting of the order of data to be printed out.
Data is printed in the following order:
R-L: AR data for the right eye, KM data for the right eye, AR data for the left eye and
KM data for the left eye
AR-KM: AR data for the right eye, AR data for the left eye, KM data for the right eye,
KM data for the left eye
Print High RMS Data
Factory setting: Checked
Selection of whether or not to display and print out low-confidence AR-measured data
(error data).
If the setting of the check box is changed during measurements, a disparity between the
displayed indication and performance may result. For example, even though “FINISH”
is displayed on the measurement screen, median values are not printed out.
[RS-232C]
The following are the parameters related to communication.
Baud Rate: 110, 300, 600, 1200, 2400, 4800, 9600, 19200, 38400, 57600, 115200
Factory setting: 9600 [bit/sec]
Setting of baud rate (bit transmission speed) for communication. Press
on the left
side of the box.
Bit Length: 7, 8
Factory setting: 8
Bit number for a single character used in communication.
Start Bits: 1, 1.5, 2
Factory setting: 1
Setting of the starting bit in communication.
Stop Bits: 1, 1.5, 2
Factory setting: 1
Setting of the stopping bit in communication.
Parity: Odd (Odd number), Even (Even number), None (parity function disabled)
Factory setting: Odd (Odd number)
Setting of the parity.
5 - 98
Send Aberration data
Factory setting: None
This parameter is used when transmitting the measured data to the automatic optometry system.
When this parameter is not checked, the AR measured value is transmitted.
Check this check box to automatically select and transmit either the set of ZS, ZC, and ZA
(SPH, CYL, and AXIS in the analysis area calculated using Zernike polynomials) values or AR
measured value that is more suitable for the subjective test.
To use this function, measure data must be transmitted from the map screen on which any
Wavefront map (Zernike Graph, Wavefront Total, Wavefront HO, or Wavefront Group) is
displayed. If the set of ZS, ZC, and ZA values of right and left eyes are needed, any Wavefront
map must be selected for both right and left eyes.
The data ZS, ZC, and ZA are calculated only from the last measured value. The transmitted
AR measured value is a representative value. (If the median value is not calculated, the final
measured value is transmitted.)
The selection of the value to be transmitted is printed by the built-in printer as illustrated below.
Example: **WFsent RMS0. 19D@3mm**
Set of ZS, ZC, and ZA is transmitted.
RMS of AR final measured value
@3mm is RMS analysis area (fixed).
Example: **ARsent RMS1. 18D@3mm**
Median AR value is transmitted.
RMS of AR final measured value
@3mm is RMS analysis area (fixed).
Send All Data
Factory setting: Not checked
This parameter is for setting the method of transferring measured values via communication
channels. If this parameter is checked, all the measured values will be transferred. If the
parameter is not checked, only representative values (or latest values if there are not representative ones obtained.) will be transferred.
5 - 99
[Others]
The following are the other settings.
As for “Cornea Index”, it is possible to specify on the Other tab of Map Settings screen.
Cornea Index A:
Factory setting: 1.3375
Setting of the corneal refractive index used in data calculation for display on the Axial
and Instantaneous maps.
Cornea Index R:
Factory setting: 1.3760
Setting of the corneal refractive index used in data calculation for display on the “Re
fractive” and Target “Refractive” maps.
To enter a cornea index A and corneal index R, press an entry field to select and type in
a desired index.
Auto Off:
This parameter is for selecting whether or not to activate the power saving mode and for
presetting the period of time of no-operation. If the “Auto Off” box is checked and there
is no operation for more than the set minutes, the instrument will automatically be put
into the power saving mode.
Factory setting: Checked, 5 (min)
The allowable time of latent operation is set in minutes. (1 minute to 5 minutes)
Power saving mode: The slightly-dimmed title screen is displayed.
To reactivate the instrument:
• Touch the touch-screen panel.
• Press any key on the keyboard.
• Press the start button.
• Move the joystick to the left or right to switch the measuring eye side (right or left).
* According to screen conditions, the instrument may not be put into the power saving mode.
TED Check
Factory setting: Not checked
Check this check box to check if the obtained iris image is usable with the TED function
or not when using the Torsion Error Detection (TED) function for refractive surgery
using the EC-5000.
R/L Format: R/L, OD/OS
Factory setting: R/L
Setting of the display method for the right and left eyes: R/L or OD/OS
5 - 100
5.9.2 Setting date and time
The date and time are set on Windows.
1. Call up the Windows screen.
1) Press
on the Settings screen.
The dialog for encouraging the operator to
confirm whether or not to exit the ARK10000 appears.
2) Press OK .
2. Call up the Control Panel window.
1) Press
.
2) Press “Settings”.
3) Press “Control Panel”.
The Control panel window appears.
3. Press
twice in rapid succession.
The “Date /Time Properties” dialog appears.
4. Change the date and time, and press OK .
5 - 101
5.9.3 Selecting whether or not to assign a patient ID automatically
Whether or not to automatically assign the same number with System ID as an initial Patient ID
at a time of new patient entry is selected.
NOTE
• It is recommended to enter a patient identification number such as a carte number as
the patient ID for data management over an extended period of time.
Use the patient ID automatic assignment function if it is unnecessary to manage and
save data.
A patient ID can be changed at a later date. See “5.6.3.1 Editing patient data”.
1. Open the Patient Selection screen.
Press
on the measurement screen.
2. Open the Database Settings screen.
Press
.
3. Press
.
The “Patient ID Assignment Settings” dialog
is displayed.
4. Set whether or not to assign patient ID
automatically.
When “Auto ID assignment” is selected ⇒
An ID will automatically be assigned.
An unassigned ID in the 000001 to 999999
range is automatically entered as the initial ID
in the Patient ID box. At that time, the patient
ID is changeable.
It is essential to enter a last name and first
name in order to complete patient entry.
5 - 102
When “Manual ID assignment” is selected
⇒
An ID will not be assigned automatically.
A patient ID will not be assigned automatically.
Enter a desired value. A patient cannot
be entered without entering a patient ID.
5. Press
.
5 - 103
5.10 Formatting a Floppy Disk
The ARK-10000 can also format a floppy disk used for data output. Use 3.5-inch 2HD floppy
disk.
1. Press
on the Setting screen.
The dialog for encouraging the operator to
confirm whether or not to exit the ARK-10000
appears.
2. Click on OK to return to the Windows
screen.
3. Insert a 3.5-inch 2HD floppy disk into the
floppy disk drive.
4. Press the “My Computer” icon twice in rapid succession.
The “My computer” window appears.
5. Press the “3 1/2 Floppy” icon.
6. Press “File” on the menu bar.
The sub-menu opens.
7. Press “Format”.
The “Format - 3 1/2 Floppy” dialog appears.
In the case of an unformatted floppy disk, select “Full” in “Format type” area.
8. Press Start .
Formatting of a floppy disk is started.
At the completion of formatting, the “Format Result-3 1/2 Floppy” dialog appears.
9. Press Close .
The “Format - 3 1/2 Floppy” dialog reappears.
10. Eject the 3.5-inch 2HD floppy disk from the floppy disk drive.
CAUTION
• Do not eject the floppy disk while the lamp of the floppy disk drive is illuminated.
Corruption of the floppy disk, or a breakdown of the floppy disk drive may result.
5 - 104
11. Press Close .
The “My computer” window reappears.
12. Press × in the upper right corner to close the “My computer” window.
[Starting ARK-10000 program from the Windows screen]
Pressing the OPD-Scan icon twice in rapid succession starts the ARK-10000 program.
[Power-OFF from the Windows screen]
1) Press
on the lower left corner of the screen.
The sub-menu appears.
2) Press the “Shut Down” option.
The “Shut Down Windows” dialog appears.
3) Make sure that the “Shut down” option is selected.
4) Press OK .
After a while, the “It’s now safe to turn off your computer” message appears. In this case,
the power switch will not be turned OFF automatically.
5) Turn OFF the power switch.
Be sure to turn OFF the power switch after the “It’s now safe to turn off your computer”
message appears.
CAUTION
• Be sure to turn OFF the power switch after the “It’s now safe to turn off your computer”
message appears.
If not, a loss of data or a failure of the instrument may result.
5 - 105
5.11 Transmitting ZS, ZC and ZA Data to an Auto
Optometry System
By connecting the ARK-10000 to an Auto Optometry System such as COS-550 in the same way
as connecting NIDEK AR or ARK series, the operator can import AR data measured by the
ARK-10000 to the connected Auto Optometry System and start a subjective measurement based
on the data imported from the ARK-10000.
When the ARK-10000 is connected to the Auto Optometry System, ZS, ZC and ZA data that is
calculated by wavefront analysis can be transmitted instead of the AR-measured data to the Auto
Optometry System.
To transmit the ZS, ZC and ZA data, follow the procedure below.
It is necessary to check the Send Aberration data check box on the Settings screen in advance.
See “5.9.1 Setting parameters” (p.5-93). In addition, if the Print Mode parameter is set to Finish,
the ZS, ZC and ZA data cannot be transmitted; set the parameter to Switch or None. (If the
parameter is set to None, data is transmitted, but it is not printed out.)
1. Measure eyes in the ARK/CT mode.
Never press
on the measurement screen.
2. Display maps on the Map View screen.
Display at least either Zernike graph, Wavefront Total map, Wavefront High Order map or
Wavefront Group map for both eyes.
It is recommended to enter 4.0 mm in the Zone box and 6 in the Order box (p. 5-14).
3. Press
.
When the Select Patient dialog is displayed,
enter patient data and press
.
Measured data including ZS, ZC and ZA data
is printed out from the built-in printer and
transmitted to the Auto Optometry System.
Settings of the zone to be analyzed and analysis order
ZS, ZC and ZA data
Trial lens (TL) data calculated from ZS, ZC and ZA data
(In increments of 0.25 D)
Contact lens (CL) conversion data calculated from ZS,
ZC, and ZA data (VD=0)
Trial lens data calculated
from AR-measured data
(In increments of 0.25 D)
Contact lens conversion
data calculated from ARmeasured data (VD=0)
* The TL and CL data are
printed out according to
the corresponding parameter settings.
5 - 106
NOTE
• It is possible to print out and transmit ZS, ZC and ZA data only by way of the Map
View screen. (It is also allowed to print the data again by way of the measurement
screen just after printing the data by way of the Map View screen until the next
measurement has begun.)
• ZS, ZC and ZA data that has already been saved into the database cannot be transmitted
to the connected Auto Optometry System.
§6
TROUBLESHOOTING GUIDE
In the event that the instrument is out of working order, try to correct a problem according to the
following table before asking for assistance.
Symptom
Suggestion
• The power cord may not be connected securely.
Reconnect it securely.
• The power switch may not have been turned ON.
Check the power switch.
Nothing appears on the touch-screen panel.
• The fuses may be blown. If so, replace the fuses
with new ones.
• Display settings may accidentally be changed
because of malfunctioning of the built-in
computer board.
Contact NIDEK or your
authorized distributor for details.
• The locking knob may be fixing the main body.
Loosen the locking knob which is beside the
joystick.
The main body cannot be moved laterally.
• The locking knob may be impeding the main
body. Loosen the locking knob which is beside
the joystick.
• Check the printer paper. If the paper is out,
replace with a new printer roll.
The internal printer does not work.
• “Print Mode” parameter may be set to “None”.
Reset the parameter.
The paper is fed, however, no characters are • The printer paper roll may be set with the wrong
printed on the paper.
side up. Set it with the correct side up.
6-2
Symptom
Suggestion
• The auto-tracking button may not be on. Turn
on the tracking function.
• The auto-shot button may not be on.
the auto-shot function.
Turn on
• Light such as from room illumination may be
reflecting on the cornea. Change the location
and try again.
• The auto-tracking function or auto-shot function
does not work on some eyes such as keratoconus
or recently operated corneas. In such cases,
turn off the auto-tracing function to perform
Auto-tracking function or auto-shot function
measurement.
does not work.
• For the patient who has substantial ocular ataxia
or who cannot fixate his/her eyes, there are cases
when the auto-tracking function or auto-shot
function does not work. In such cases, turn
off the auto-tracking function and start
measurement.
• If the instrument is installed in the vicinity of a
window where the instrument is exposed to
sunshine, light interference may adversely affect
these functions. Change the installed location
of the instrument and perform measurement
again.
“INVALID DATA” shown in the “Result” box • A mismatched item was found. Contact NIDEK
on the Import (Outside To Inside) screen
or your authorized distributor.
prohibits an import of external data into the
database.
6-3
Symptom
Suggestion
•
“Err code” appears on the touch-screen panel.
The patient may have blinked during
measurement. Instruct the patient not to blink,
and try again.
• The eyelid or eyelashes may be obstructing the
measurement. Instruct the patient to open their
eye wide.
• The pupil may be too small for measurement.
Let the patient be in a dark room for a while until
the pupil dilates enough, and try again.
Buttons are inoperative.
• The data may have exceeded the measurable
limit.
• Restart the ARK-10000.
1) Simultaneously press the “Ctrl” key, “Alt” key
and “Delete” key on the keyboard.
The “Close Program” dialog is displayed.
2) Select “Rk3awin”.
3) Press the “End Task” button.
The “Rk3awin” dialog is displayed.
4) Press the “End Task” button.
The ARK-10000 will be shut down and the
Windows screen appears.
5) Press the “OPD-Scan” icon twice.
* If buttons become inoperative on the
measurement screen, simultaneously press the
“Ctrl” key and “C” key and check if a message
is displayed behind the eye image.
* If the problem cannot be solved by following the suggestions above, contact your authorized
distributor. In such cases, let your authorized distributor know the serial number of your
instrument and software version.
The serial number is printed on the nameplate affixed to the right side of the instrument.
The software version is shown on the title bar of the measurement screen.
* If an external device is connected to the ARK-10000, perform the setup correctly following the
user’s manual for the external device.
§7
MAINTENANCE
7.1 Replacing the Roll of Printer Paper
When a red line appears on a side of the printer paper, it means that the paper is running short.
In such cases, stop using the printer and replace the roll with a new one.
NOTE
• Do not run the printer without paper.
It ruins the printer head.
• Do not pull the paper in the printer forcefully.
This may cause a malfunction of the printer.
1. Take off the printer cover.
Tilt the printer cover toward the front to remove
while holding the lug down.
Lug
Printer cover
2. Flip down the lever on the right side, and
turn the gear backward to rewind the paper.
3. Take out the old paper roll, and take the shaft
out of the roll.
4. Insert the shaft into a new printer roll.
Gear
5. Cut the end of the paper with a pair of
scissors, and then pass it through the printer
as shown below.
After inserting the paper through the paper
outlet, turn the gear forward to feed the paper.
Paper outlet
Shaft
Lever
7-2
NOTE
• If the roll is set in such a way that the
paper is upside down, data cannot be
printed on the paper.
Lever
6. Set the roll inside the printer.
7. Flip up the lever on the right side.
8. Reattach the printer cover.
Fit the bottom side of the cover first.
7-3
7.2 Attaching a Stack of Chin Rest Paper
1. Pull out the two fixing pins from the chin rest.
2. Take out the proper amount of chin rest paper from a whole stack.
It is impossible to fix a whole stack of chin rest paper at a time. Be sure to fix the stack with a
thickness of 6mm or less. Pay attention not to scatter the chin rest papers.
3. Insert the fixing pins into the holes in the
paper.
Insert the removed pins into both holes of the
stack.
4. Fix the stack of chin rest paper onto the chin
rest.
1) Insert a pin into a hole in the chin rest while
holding both fixing pins and the stack of
paper.
2) Push the remaining pin into the other hole
of the chin rest with your other hand.
Fixing pin
Pad of
chin rest paper
7-4
7.3 Replacing Fuses
If the instrument does not work even though the power switch is ON, fuses may be burnt out. In
such cases, replace them.
CAUTION
• Use a specified fuse only:
Fuse rating: T 2A 250V
Use of fuses other than the specified one
may cause a fire.
1. Turn off the power.
2. Unplug the power cord from the power inlet.
Spare fuses are provided on the
reverse side of the printer cover.
CAUTION
• Before a replacement of fuses, turn OFF the power and disconnect the power cord
from the outlet.
An electric shock may result.
3. Pull out the fuse holders.
Pull out the fuse holder while pushing both sides
of the fuse holder with thin screwdrivers to
release the fixing clips.
Power cord
CAUTION
• The fuse holder is also used as a voltage
selector. Be careful not to change the
numbers indicated in the voltage
indication window.
If the voltage setting does not match the
supplied mains voltage, this may cause
a fire or malfunction.
Fuse
Fuse holder
Voltage indication window
7-5
4. Replace the fuses with the new ones and fit
the fuse holder back into the original
position.
CAUTION
• If the fuses frequently blow out, do not touch the internal structure of the instrument,
but contact your authorized distributor.
Touching of the inner structure of the instrument may result in electric shock.
7.4 Checking Measurement Accuracy
It is strongly recommended to check both REF and CT measurement accuracies at least once a
day. To check a measurement accuracy, use the provided model eye.
1. Mount the provided model eye onto the chin
rest.
Fix the model eye so that the pins of the chin
rest are inserted deeply into the holes of the
model eye base.
Model eye
Pins
2. Set the “Step” parameter in the “Measure” area on the Settings screen to 0.01.
3. “REF- and CT-measure” the model eye in
the ARK/CT mode and print the measured
results.
Compare the values with the marked
values on the model eye.
If a difference between the marked values on the
model eye, and measured results is large, measure
the model eye again after confirming that “Step”
Sample printout
parameter is set to 0.01, and the model eye is
properly mounted.
If the difference in Auto Refraction-measured values is 0.25D or greater, contact NIDEK or your
authorized distributor. If a difference in KM values is 0.03mm or greater, perform the calibration
for CT measurement. See “7.5 CT Measurement Calibration”.
7-6
7.5 CT Measurement Calibration
If the difference between the marked keratometry values on a model eye, and KM-measured
values is 0.03mm or greater, perform CT measurement calibration.
1. Open the Settings screen.
Press
on the measurement screen.
2. Open the Select Calibration Menu screen.
Press
.
3. Open the screen for CT measurement
calibration.
Press
.
4. Mount the provided model eye.
See “7.4 Checking Measurement Accuracy”.
5. Bring the model eye into focus and measure the provided model eye.
The confirmation screen for the captured image is displayed.
6. Check the captured image and detected ring edges. If the they are satisfactory, press
.
The confirmation screen for the captured image is displayed again.
If the captured image and detected edges are not satisfactory, press
. Perform the CT
measurement again.
7. Check the detected ring edges. If they are satisfactory, press
.
Be sure to check the detected ring edge because they are different from the ring edges detected
in Step 6.
If the detected edges are not satisfactory, press
. Perform the CT measurement again.
8. In the same manner as Step 5 to Step 7, perform measurements four times additionally
(five times in total).
9. Press
.
Calibration is started, and the screen returns to the Select Calibration Menu screen.
10. Press
.
The screen returns to the Settings screen.
7-7
11. Press
.
The “Exit” confirmation dialog is displayed.
12. Press OK to go back to the Windows screen.
13. Press the icon of “OPD-Scan” twice in
succession to restart the ARK-10000.
14. Measure the model eye again and confirm that the difference between the obtained
keratometry value and the marked value is 0.02 mm or less.
CAUTION
• If the difference in AR-measured data is 0.25D or larger, contact NIDEK or your
authorized distributor. Only properly-trained service persons at NIDEK are licensed
to perform REF measurement calibration.
The REF measurement calibration needs special tools. Careless touch of the
calibration screen for the REF measurement may hinder proper measurement.
7.6 Cleaning Exterior
When the covers or panels get dirty, wipe with a dry and soft cloth. For stubborn dirt, immerse
the cloth in a neutral detergent, wring well, and wipe. Lastly, wipe with a dry and soft cloth.
NOTE
• Never use organic solvents such as a thinner, or detergents with abrasives to clean the
covers, touch-screen panel, and placido rings.
The covers, or touch-screen panel may be corroded or scratched. Especially, cleaning
of placido rings with organic solvents or detergents with abrasives will disturb the
concentric ring shapes, which may adversely affect measurement accuracy.
• If the touch-screen panel is getting dirty, immerse a soft cloth or gauze in water, wring
it well, and wipe the panel with it.
• Blow the dust off the placido rings with a blower.
Careless wiping may disturb the concentric ring shapes, and may adversely affect
measurement.
7-8
7.7 Cleaning the Measurement Window
When the measuring window gets fingerprints or dust on it, the reliability of measured values
will be lowered substantially. Check the measuring window for dirt before use, and then clean it
if it is dirty.
1. Blow off the dust on the measuring window
with a blower.
2. Wrap a sheet of lens cleaning paper around
a thin stick such as a chopstick (or cotton
swab) and wipe the glass of the measuring
window with the paper dampened with
alcohol.
Use a stick which will not damage the glass.
(Never use hard objects such as a metal product.)
Wrap cleaning paper around the tip.
Wipe the measuring window lightly from center
to outside along an arc.
Measuring window
Pay attention not to get alcohol on covers etc.
3. Check if the window is cleaned using a
penlight. If not, clean it again with a sheet
of new cleaning paper.
Expose the measuring window to the light of a
penlight and change the viewing angle to
properly check for dirt.
7.8 List of Parts for Replacement
Article
Order Number
Printer roll
806-20-00001
Chin rest paper
32903-M047
Fuse
804-02-02041
§8
DISINFECTING PROCEDURES
Purpose
The purpose of this procedure is to establish a consistent method by which users
may clean and disinfect the patient contact surfaces of the OPD-ScanTM unit and to assist the
users in establishing a routine for disinfection that will reduce the potential of cross infection.
Materials Required
• Disinfecting agent such as an anti-germicide or isopropyl alcohol (IPA).
• Cloth or cleaning towels
Procedures
1. Locate the patient browrest on the OPD-ScanTM device.
2. Soak the cleaning cloth or towel in disinfecting agent and wipe the surfaces that come in
contact with the patient.
3. Locate the patient chinrest on the OPD-ScanTM device.
4. Take the cleaning cloth used in the previous step and wipe the exposed surfaces of the
chin rest.
5. Repeat this procedure following each exam.
§9
SPECIFICATIONS
AR/REF measurement (Objective measurement of refractive power)
• Measurable range
Spherical power: –20.00 D to + 22.00 D (VD=12 mm)
Cylindrical power: 0 D to ± 12.00 D
Cylinder axis angle: 0º to 180º
This device conforms to “ISO 10342: 2003, Ophthalmic Instruments. Eye Refractometers”.
Measurement accuracies required in ISO 10342: 2003 are as follows:
Criterion
Measuring range
Maximum scale
interval
Spherical vertex power
-15D to +15D
(Maximum meridional
vertex power)
0.25D
Cylindrical vertex power
Cylinder axisb for
cylinder power
0D to 6D
0° to 180°
0.25D
1°
Test devicea
Tolerance
0D, ±5,±10D
±0.25D
0D to 6D
±0.25D
Sph: approx. 0 D
Cyl: -3D
Axis: 0°, 90°
±0.25D
±5°
a...The refractive error of the test device shall not differ by more than 1.0 D form the nomical value above.
b...Cylinder axis shall be indicated as specified in ISO 8429.
• Indication step
• Vertex distance
• Minimum pupil diameter
measurable
• Relaxation of
accommodating eye
• Measuring time (single eye)
• Chart type
Refractive power
0.01 D/0.12 D/0.25 D
Axis angle
1º /5º
0 mm/10.5 mm/12 mm/13.75 mm/15 mm/16.5 mm
2.6mm dia.
Auto-fogging system
0.4 secs. or less
Scenery chart
KM measurement (Corneal curvature radius measurement)
• Measurable range
• Indication step
• KM measurement range
Corneal curvature radius (R1, R2, AVE) 5.0 mm to 10.00 mm
Accuracy: ± 0.05 mm
Corneal refractive power (R1, R2, AVE) 33.75 D to 67.50 D
Corneal astigmatism (C)
0 D to ± 12.00 D
Cylinder axis angle of corneal astigmatism 0º to 180º
Corenal curvature radius (R1, R2, AVE) 0.01 mm
Refractive power
0.01D, 0.12 D, 0.25 D
Axis angle
1º, 5º
3 mm dia. on cornea (when the corneal curvature radius is 7.9 mm.)
9-2
CT measurement (Corneal shape measurement)
• Measurable range
Corneal refractive power10 D to 100 D (n= 1.3375)
(Corneal curvature radius)
(3.38 mm to 33.75 mm)
[Accuracy]
± 0.05 mm (under all the conditions)
• Number of placido ring
19 edges (9 rings × 2, Innermost circle) or more
• Corneal diameter to be measured
Maximum diameter
11 mm dia.
(Corneal curvature radius, r = 7.9 mm)
Minimum diameter
0.5 mm dia.
(Corneal curvature radius, r = 7.9 mm)
• Measuring point
6,840 (19 × 360) points or more
Pupillary distance measurement
• Measurable range
• Measurement increment
30 mm to 85 mm
1 mm
Alignment method
• Working range of
measuring unit
• Working range of
auto-alignment
Back and forth (manual):
Left and right (manual):
Up and down (motorized):
29 mm
85 mm
28 mm
Up, down, left and right:
4 mm dia. on cornea
Back and forth (Focusing direction): ± 2 mm
Alignment observation and measurement indication
• Observation area
14 mm × 8 mm
• Alignment observation method
10.4-inch TFT Color LCD (640 × 480)
Analysis and items on display
Map type
Index
Axial/Instantaneous/”Refractive”/OPD/Difference/
Target “Refractive”/Internal OPD/Elevation/
Wavefront High Order/Wavefront Total/Wavefront Group/
Zernike graph
AR-measured data (SPH, CYL/AXIS), SimK (Steep/Flat/Delta),
e, Q, photopic pupil diameter, mesopic pupil diameter, distance
between the photopic and mesopic pupil centers, direction
9-3
Recording method
58 mm high-speed thermal line printer (Built-in printer: Auto
Refraction- and KM-measured data)
Storage
FDD (2 mode), HDD (Built into the main body)
Data import/export
RS232C, Ethernet, USB
Dimensions and weight
Dimensions
Weight
290 (W) × 520 (H) × 499 (D) mm
25 kg
Power source
Power source
100V/ 120 Vac 170VA
50/60 Hz
* The power source is factory-configured.
Environmental conditions (In transport and storage)
• Temperature
• Humidity
–20 to 60 ºC
10 to 95 % (Non-condensing)
Environmental conditions (In use)
• Temperature
• Humidity
10 to 35 ºC
30 to 75 % (Non-condensing)
Service life
8 years from the date of initial operation
* Proper maintenance is necessary.
§10
ACCESSORIES
10.1 Standard Accessories
Spare fuses
Spare printer paper roll
Power cord
Dust cover
Keyboard
Touch-screen pen
Model eye
Chin rest paper
Operator’s Manual
Configuration disk
2
3 rolls
1
1
1
1
1
1 stack
1 copy
1*17
10.2 Optional Accessories
External storage device
* Provide a color printer by yourself or ask your authorized distributor for a printer.
Recommended printer: DeskJet 5550 series, Hewlett-Packard
*17 Keep the configuration disk with care because the disk includes unique information to your
ARK-10000 unit such as calibration data.
APPENDIX. A GLOSSARY
The following terms are used to help you to understand the contents of this manual. Before reading this
manual, read thoroughly and understand the following.
• AR Measurement
Fundus is scanned with slit-shaped ray bundles and measured in increments of 1º in the 2.6 mm zone. ARmeasured data is obtained.
• AR median values
The median values of the first 3 usable values taken during AR-measured values and put in order in a computer.
• AR values
One of the measured values (SPH, CYL, AXIS) obtained during AR or REF measurement which is equal to
values obtained by an auto refractometer. This represents the refractive status of an approximate center of the
eye.
• Auto-shot
A function with which the instrument automatically starts a serial measurement as soon as the instrument is
best aligned and in ideal focus.
• Auto-tracking
A function with which the instrument automatically controls the up, down, right, and left movements and
focusing of the measuring unit.
• Contact lens conversion value
The value that the AR median values (or the latest values when the median values have not been obtained) are
converted into CL values, letting the vertex distance (VD) be 0mm.
• CT measurement
The projected placido rings on the cornea are captured, analyzed, and a map is obtained which represents the
corneal curvature and distribution of refractive powers.
• KM measurement
A placido ring image projected over the cornea is captured. The captured image is analyzed and corneal
curvature radius in the 3 mm dia. zone on cornea, the direction of the steepest meridian and corneal astigmatism
are obtained.
• Limit Mark
“<LIMIT>” sign and an arrow which represent a direction appear on the touch-screen panel when the alignment
light goes out of the working range of the auto-tracking.
• PD
Abbreviation of “Pupil Distance” which is the width between the right and left pupils.
• Power saving mode
If there is no operation for more than a set number of minutes of latent operation, a dimmed title screen appears,
which is the power-saving status of the instrument. Touch the touch-screen panel or the keyboard to exit the
power saving mode and return to normal mode.
• PSF
Abbreviation of Point Spread Function. This function simulates what kind of image is formed on the retina
when the patent looks at a point source of light like a star.
A-2
• Q value
A value which is referred to when selecting a contact lens. This represents asphericity of the cornea.
• REF measurement
AR-measured data and OPD map are obtained by scanning the fundus with slit-shaped ray bundles and measuring
it in increments of 1º in the 2 mm to 6 mm zone that is divided into 4.
• Trial Lens Data
Data where the AR median values (or the latest values when the median values have not been obtained) are
examined and indicated by a cylindrical value (cylinder reading direction) which would make a spherical trial
lens have a lower power for convenience.
• Vertex Distance
The distance between a corneal vertex to the posterior surface of the spectacle lens.
APPENDIX. B INSTALLATION
CAUTION
• To carry the instrument to another location, its base should be held on both sides. (Never
hold the forehead rest, main body, or measuring unit.)
If a part other than the base is held, an injury or failure of the instrument may result.
• Install the instrument in the locations instructed in “2.1 Storage, Transportation and
Installation”.
• It is recommended to install the instrument in a dimly lit room to minimize the adverse
effect on AR measurement which is caused by miosis .
Installation procedure
1. If the keyboard, mouse or color printer is ready, connect them to corresponding connectors.
(See p. 3-2.)
2. Connect the power cord between the power inlet on the lower right side of the instrument,
and a (HOSPITAL GRADE) wall outlet.
3. Turn ON the power switch and confirm that the instrument is powered.
4. Measure the provided model eye.
See “7.4 Checking Measurement Accuracy”.
APPENDIX. C OBTAINING RELIABLE EXAM DATA
IMPORTANT!! Read the following information before using the instrument for the first time.
To obtain reliable measured data using the ARK-10000, pay attention to the following to :
Until you get accustomed to the joystick manipulation, it is recommended to turn OFF the
auto-shot function and start measurement by pressing the start button on the joystick.
When the auto-shot function is turned ON (See p.4-10 and p.4-23.), a measurement error such as
“a measurement took place when the patient blinked” may occur. This is because measurement
takes place automatically regardless of an operator’s intention if the auto-shot function is ON.
A quick measurement without straining the patient’s eye is an important tip to obtain
reliable measured results. When not using the auto-shot function, the timing of pressing
the start button on the joystick is:
Misalignment in up-and-down and right-and-left directions (See p.4-9 and p 4-22.) ⇒
Up to half of an alignment light going out of the target is acceptable.
Misalignment in forward and backward directions (See p.4-10 and p. 4-22.) ⇒
Up to two bars including the middle bar of the focusing indicator is acceptable.
If you try to align the measuring unit too precisely, the reliability of obtained results will lower.
This is because an excessively precise alignment requires longer aligning time and may induce a
shift of the patient’s visual axis, dry cornea, or excess tears.
Prior to measurement, explain as below to relieve the patient’s tension and prevent an
excess reaction to an accidental flash of the placido during KM or CT measurement:
1) After having the patient place his/her forehead on the forehead rest and his/her chin on the
chin rest, instruct as: “You will see a red balloon inside. Gaze at it during measurement.”
“During measurement, the rings in front of you will flash. Keep looking at the inside of the
measuring window.”
2) After rough alignment of the measuring unit, instruct as: “First, slowly blink your eyes once
or twice.”
3) After making sure that the patient has blinked, instruct as: “Open your eye wide and keep
looking at the red balloon inside.”
4) Make quick alignment and focusing of the measuring unit and press the start button of the
joystick.
5) During the measurement, observe the measuring eye on the panel. If the eye substantially
moved, make the measuring unit follow the movement of the eye by manipulating the joystick.
6) After AR (or REF) measurement and before performing KM (or CT) measurement, instruct
as: “Slowly blink your eyes once or twice.”
7) After both AR and KM measurements (or REF and CT measurements) have been completed,
and the “Edge Detection” dialog appears, say, “Thank you very much for your cooperation.
Now you may blink”.
However, to obtain reliable PD (Pupillary Distance) data, do not allow the patient to move
his/her face until the measurement of both eyes has been completed since the PD is obtained
during both-eye measurement.
C-2
The following sign displayed in the measured value display area on the LCD during AR or
REF measurement indicates that the reliability of the data is low. Re-measure the eye.
S
C
A
– 1.25 – 4.25 170E
Only when the same sign always appears after repeating measurement several times, use the data
as “reference” data. (See “OPD-Scan Error Message Table” on p.C-4.)
Just after CT measurement, the placido-ring image projected on the patient’s cornea is
displayed posterior to the “Edge Detection” dialog. Check the captured placido-ring image.
(See p.4-24.)
The concentric ring image may appear “distorted” or may appear to have “irregular breaks”
because of insufficient tears by continuous opening of the eye or excess tears just after blinking.
Do not analyze such an image; Delete it by pressing
on the edge detection confirmation
screen and retry CT measurement.
* When retrying CT measurement, the “Placido Intensity” dialog is displayed. (See p.4-24.)
The “Placido Intensity” dialog should be used for an eye with a light-colored iris such as a
blue eye which reflects a large amount of light. Temporarily lower the placido illumination
intensity to improve the contrast of the placido-ring image.
For an ordinary retry, set “Placido Intensity” to “100”.
During operation, an error number such as “Err200” may appear on the screen. In addition,
an error number may appear according to the measured results. When an unfamiliar
error number or message appears, see “OPD-Scan Error Number Table” and “OPD-Scan
Error Message Table” on page.
If the pupil size is less than 6 mm in diameter, the periphery may be unnaturally colored in
red or blue on the OPD map. These red or blue noises do not represent correct measured
data. In such cases, check the map for the distance of the noises from the center and for
the followings:
1. If the red or blue noises are present within 5 mm in diameter from the map center, Sphere,
Cylinder and Axis data in the 5 mm zone on the OPD map is adversely affected by the
noises and therefore, the reliability of the data is low.
2. There is a possibility where the reliability of
Noises
numerical data (WF error, ZS, ZC, ZA) on the
Wavefront High Order map, Wavefront Group
map, Wavefront Total map, and data on the
Zernike graph may be lower. In such cases, it is
recommended to decrease the Zone value to
exclude the noises from the area to be analyzed.
Before starting CT or KM measurement, instruct the patient not to move his or her eyes.
A CCD camera that captures 30 frames per second is used for CT and KM measurements.
However, it has been verified that the motion of the eyes during measurement causes the captured
image to blur, and this lowers the measurement accuracy.
As this Operator’s Manual includes various instructions, read the manual when turning
ON or OFF the instrument, saving patient data, measuring eyes and printing measured
data for the first time. Use the instrument safely and properly as instructed in this Manual.
C-3
OPD-Scan Error Number Table
Error No.
0
200 - 201
220
230 - 231
Content
Hardware error
234
As
As
As
As
240
As above
300
As above
311 - 312
above
above
above
above
Detection error of AR
measuring ray
314
As above
330
Hardware error
332
As above
333
Blink Err
334 - 335 As above
Solution
Turn OFF the instrument once and turn it ON again. If the
same error No. still appears, contact your authorized
distributor.
As above
As above
As above
As above
Measure the same eye. If the same error No. still appears,
contact your authorized distributor.
Shut the instrument down once. If the same error No. still
appears, contact your authorized distributor.
Measure the same eye. If the same error No. still appears,
contact your authorized distributor.
As above
Turn OFF the instrument once and turn it ON again. If the
same error No. still appears, contact NIDEK or your
authorized distributor.
As above
The patient may have blinked during AR or REF
measurement. Measure the same eye again. If the same
error No. still appears, contact your authorized distributor.
The patient may have blinked during KM measurement.
Measure the same eye again. If the same error No. still
appears, contact your authorized distributor.
360 - 363
As above
As above
370 - 371
As above
As above
380 - 381
As above
As above
A printer paper has run
out.
The head lever of the
internal printer is open.
The thermal head of the
internal printer is
overheated.
Set the specified printer paper roll. (See p. 7-1 of
Operator's Manual.)
Flip the printer head fixing lever upward. (See p. 7-2 of
Operator's Manual.)
Do not operate the internal printer for 10 minutes. If the
same error No. still appears, contact NIDEK or your
authorized distributor.
400
401
402
* Error Nos, “240”, “311”, “312” and “314” are shown in the lower middle area of the measurement
screen where the latest AR-measured data is displayed.
Error Nos. “333”, “334” and “335” are displayed in the lower middle area of the measurement
screen where the latest measured data is displayed as “Blink Err” in red.
C-4
OPD-Scan Error Message Table
Message
Content
Solution
"ERR X"
Hardware error
"ERR Z"
As above
Turn OFF the instrument once and turn it ON
again. If the same message still appears, contact
NIDEK or your authorized distributor.
As above
The PD window is shaded by the
patient's body.
Make sure that the patient's arm etc does not
shade the PD window. (See p.3-2.)
The measuring eye side
could not be detected.
Measure the eye again.
AR-measure the same eye again. If the sign is
"E" at the right side of AXIS AR measured data with low confidence
still shown, it is probable that the patient's eye has
of AR-measured data
index
an irregular astigmatism or is not wide open.
"Finish"
Serial shots of AR or REF
measurement are complete. (The
message does not mean an error.)
If "AR- (or REF-) measuring" the same eye again,
release the start button once and then press the
button again.
"A printer paper has run out.
The printer runs out of paper.
Set the specified printer
paper roll."
Set the specified printer paper roll. (See p. 7-1)
"The head lever of the
internal printer is open. Flip The head lever of the built-in printer is
the printer head fixing lever open.
upward."
Flip up the head lever of the printer. (See p. 7-2)
"The measuring unit has
been moved to the other eye As described on the left.
during measurement"
Do not move the measuring unit to the other eye
during measurement.
APPENDIX. D BEFORE FIRST BACKUP PROCEDURES
IMPORTANT!! Read the following instruction before performing data backup for the first
time.
This section explains the first backup procedures and the backup procedures for the second time
and after.
It is recommended to regularly back up measured data on an external storage disk such as a ZIP
disk or DVD-RAM in case of an internal hard disk crash.
Operators should be responsible for managing the obtained data. NIDEK assumes no
responsibility for a loss of data.
D.1 Preparation
Have an external storage device (such as a Zip drive) and 2 or more storage disks (such as
Zip disk) handy.
NOTE
• Storage disks such as CD-R, CD-RW, DVD-R which need writing software are improper
for data backup.
The following explanation is based on the use of a ZIP drive provided with a USB connector.
To use any other storage device, be sure to install the driver software for the device.
* “Zip” is a registered trademark of Iomega, USA.
D.2 Connection
Connect a Zip drive.
NOTE
• In the case of a non USB storage device, connect the external storage device, turn it on
first, and then turn ON the ARK-10000.
D-2
D.3 Setting
“Select Database Directory” dialog:
Change the setting in the “Backup Data” field to
“E:\”.
See “5.6.4.3 Setting a target location for backup
data, imported data or exported data”.
The internal hard disk is factory-selected
as a target storage location for backup data.
Be sure to select an external storage device (E:\) as a target backup location.
“Database Backup” dialog: Maintain the factory setting
“Export Settings” dialog: Unrelated to backup procedures
“Rebuild Database” dialog: Unrelated to backup procedures
D.4 Ordinary Backup
An ordinary backup procedure differs according to whether the data is backed up for the first
time or not. In this section, the first-time backup procedure and procedure for backing up for the
second time and after are respectively explained.
If an external storage device (removable storage disk) is selected in the “Data” box on the
“Select Database Directory” dialog, back up only the index data. See “D.5 Index Backup”.
D.4.1 First-time backup
1. Press
on the Patient Selection screen to
display the “Database Backup” dialog.
D-3
2. Confirm the setting on the “Database
Backup” dialog and then press
.
Ordinarily, maintain the factory setting as
shown in the figure on the right.
Ordinarily, the “Differential” option should be selected.
Select the “All” option to make a new backup copy of
data just after changing the storage location for the
backup data.
3. The message encouraging the operator to
insert a new disk appears. Write the
displayed volume label (disk name) on an
adhesive label of the Zip disk.
Volume label
NOTE
• Be sure to write down the volume label on an adhesive label of the disk to avoid losing
track of where the backup data is saved.
• Disks can be identified by the volume name as long as the data on the backup disks is
from one unit of the OPD-Scan only. When using multiple units of the OPD-Scan,
write down the ID information (S/N of the product etc) in addition to the volume
name.
4. Insert a Zip disk and press OK .
Data backup is performed.
If one disk cannot hold backup data to be saved,
the message requiring the operator to insert a
new disk appears. Write down the volume label
on an adhesive label of the disk in the same
manner as Step 3 and insert the disk.
5. When data backup is completed, the message
“Database Backup has been completed”
appears. Press OK .
This is the end of the first-time backup
procedure.
D-4
D.4.2 Backup for the second time and after
From second-time backup and after, only newly-saved data will be saved. As soon as a disk is
full, the ARK-10000 will require the operator to insert a new disk.
1. Press
on the Patient Selection screen to
display the “Database Backup” dialog.
2. Confirm the setting on the “Database
Backup” dialog and then press
.
Ordinarily, maintain the factory setting as
shown on the right.
Ordinarily, the “Differential” option should be
selected.
Select the “All” option to make a new backup
copy of data just after changing the storage
location for the backup data.
3. The message encouraging the operator to
insert a backup disk appears. Insert the disk
of a displayed volume label (disk name) and
press OK .
Data backup is performed. If one disk cannot
hold backup data to be saved, the message
requiring the operator to insert a new disk
appears. Write down the volume label on an
adhesive label of the disk and insert the disk.
4. When data backup is completed, the message
“Database Backup is completed” appears.
Press OK .
This is the end of the backup procedures.
D-5
The following is one example of managing disks.
[Example of disk management]
Conditions: Storage disk used for backup: 250 MB-Zip disk for data backup
Storage disk used for saving the database: Internal hard disk
Number of days: 5 days a week (From Monday to Friday)
Number of patients: 20 patients/ day
Number of eyes: Both left and right eyes × 1 time = 2 eyes /patient (Approx. 2.4MB)
Limitations on use: A storage disk whose occupied space is already 90% or more
should not be used for adding the backup data of a new patient.
Example:
Lapsed
days
1st day OPD-BAK 0001
(Mon.)
Media type
Backup
20% occupied
:
5th day OPD-BAK 0001
(Fri.)
Storage
90% occupied
OPD-BAK 0002
10% occupied
6th day OPD-BAK 0002
(Mon.)
OPD-BAK 0001
30% occupied
:
9th day OPD-BAK 0002
(Thu.)
OPD-BAK 0001
90% occupied
10th day OPD-BAK 0003
(Fri.)
20% occupied
:
14th day OPD-BAK 0003
(Thu.)
90% occupied
15th day OPD-BAK 0004
(Fri.)
OPD-BAK 0001 -0002
30% occupied
OPD-BAK 0004
OPD-BAK 0001 -0002
10% occupied
OPD-BAK 0001 -0003
D-6
D.5 Index Backup
In this section, the procedure for backing up only the index data using an external storage device
(removable storage disk) as designated on the “Select Database Directory” dialog is explained.
If the internal hard disk drive or the hard disk drive of the computer connected to the ARK10000 on a network, see “D.4 Ordinary Backup”.
D.5.1 First-time backup
1. Press
on the Patient Selection screen to
display the “Database Backup” dialog.
2. Confirm the setting on the “Database
.
Backup” dialog and then press
3. The message encouraging the operator to
insert a new disk appears. Write the
displayed volume label (disk name) on an
adhesive label of the Zip disk.
Volume label
NOTE
• Be sure to write down the volume label on an adhesive label of the disk to avoid losing
track of where the backup data is saved.
• Disks can be identified by the volume name as long as the data on the backup disks is
from one unit of the OPD-Scan only. When using multiple units of the OPD-Scan,
write down the ID information (S/N of the product etc) in addition to the volume
name.
D-7
4. Insert a Zip disk and press OK .
Index data backup is performed.
5. When the data backup is completed, the
message “Database Backup has been
completed” appears. Press OK .
This is the end of the backup procedure.
D.5.2 Backup for the second time and after
1. Press
on the Patient Selection screen to
display the “Database Backup” dialog.
2. Confirm the setting on the “Database
.
Backup” dialog and then press
3. The message asking the operator whether or
not to create a new index backup disk is
displayed.
Press No when overwriting data to a disk
where backup index data has already been
saved.
(This message is not displayed when the
index backup disk is created for the first time
for the ARK-10000.)
D-8
It is also possible to create multiple index backup disks as an insurance against loss or breakage
of index backup disks. To create new index backup disks, press OK and back up the index
data in the same manner as Step 3 to Step 4 of “D.5.1 First-time backup” instead of Step 4. By
rotating the multiple index backup disks, overwrite the latest index data over a disk where the
oldest data is saved.
4. The message encouraging the operator to
insert an index backup disk appears. Insert
the disk of a displayed volume label (disk
name) and press OK .
Data backup is performed.
5. When data backup is completed, the message
“Database backup is completed” appears.
Press OK .
This is the end of the backup procedures.
[In case of a corruption or loss of an index backup disk]
If the specified index backup disk cannot be
inserted because of disk corruption or a loss
of the disk in Step 4, press Cancel .
The message asking the operator whether or
not to continue to use the index backup disk
appears.
Press No .
An insertion of the index backup disk will never be required. When there have been multiple
index backup disks created, an insertion of another disk will be required. Insert the disk.
When there has been only one index backup disk created, the backup mode will be canceled.
Enter the backup mode again to create a new index backup disk.
APPENDIX. E POINTS TO NOTE WHEN UTILIZING INTERNAL OPD MAP
In the Internal OPD map, intraocular (from the posterior surface of the cornea through retina)
astigmatic components are calculated from the Refractive map calculated from CT (Corneal
Topography) measurement and from the OPD map calculated from REF measurement.
Therefore, the reliability of the Internal OPD map largely depends on whether the CT and
REF measurements were performed accurately. Pay special attention to the following:
• The measuring unit should be accurately aligned to the eye during both measurements. (See
Step 6 on P.4-21.)
• The black and white edges of the placido ring are traced correctly.
In addition, for keratoconus, eyes after coronal transplantation, irregular-astigmatic eyes, eyes
with excessive myopia corrected etc, carefully interpret the Internal OPD map because the
map will be adversely affected by the posterior surface of the cornea due to a substantial
deformation of both anterior and posterior surfaces of the cornea.
For information, it is strongly recommended to specify the “Standard2” map layout (5 maps:
Refractive map, OPD map, Internal OPD map, Axial map and Eye Image) for displaying the
Internal OPD map.
The examples of real human eyes are illustrated for reference:
Astigmatic eye with no intraocular astigmatism:
Corneal astigmatism: 1.47 D, Total astigmatism (OPD): 1.50 D, Internal OPD astigmatism: 0.31
D
Case where intraocular astigmatism counteracts total astigmatism.:
Corneal astigmatism: 1.83 D, Total astigmatism (OPD): 0.49 D, Internal OPD astigmatism:
1.28 D
E-2
Case where intraocular astigmatism increases total astigmatism.:
Corneal astigmatism: 1.69 D, Total astigmatism: 2.60 D, Internal OPD astigmatism: 1.58 D
Case 1 where an intraocular lens is tilted:
The pattern in the Refractive map of the cornea is almost symmetrical, whereas the OPD map
represents myopia (in red) in the upper right of the map. In the same way, the Internal OPD
map also represents myopia in the upper right of the map. These patterns of the IOL (Intraocular
lens)-implanted eyes suggest the tilting or decentering of the IOL. If the pupil is about 6 mm
in diameter, the position of the IOL can be checked by a spot image reflected from the surface
of the IOL on the pupil image map (Eye Image).
Case 2 where an intraocular lens is tilted:
Regardless of a small amount of corneal astigmatism, astigmatism is observed in the OPD
map. It is assumed that the astigmatism observed in the Internal OPD map is caused by the
tilting of the IOL.
E-3
Keratoconus:
The Internal OPD map reflects the presence of a large prism, displaying the distribution of
Warmer colors
both warmer and cooler colors.
Cooler colors
Eye after corneal transplantation:
The Internal OPD map reflects the corneal surface after corneal transplantation.
APPENDIX. F EMC (ELECTROMAGNETIC COMPATIBILITY)
The ARK-10000 complies with the International Electrotechnical Commission standards (IEC 60601-12:2001) for electromagnetic compatibility as listed in the tables below. Follow the guidance in the tables for
use of the device in an electromagnetic environment.
EMC (IEC 60601.1.2:2001)
Guidance and manufacturer's declaration - electromagnetic emissions
The ARK-10000 is intended for use in the electromagnetic environment specified below. The customer or the
user of the ARK-10000 should assure that it is used in such an environment.
Emissions test
Compliance
Electromagnetic environment - guidance
RF emissions
CISPR 11
Group 1
The ARK-10000 uses RF energy only for its internal
function. Therefore, its RF emissions are very low and are
not likely to cause any interference in nearby electronic
equipment.
RF emissions
CISPR 11
Harmonic emissions
IEC 61000-3-2
Voltage fluctuations/Flicker
emissions IEC 61000-3-3
Class A
The ARK-10000 is suitable for use in all establishments
other than domestic and those directly connected to the
public low-voltage power supply network that supplies
buildings used for domestic purposes.
Not applicable
Not applicable
Guidance and manufacturer's declaration – electromagnetic immunity
The ARK-10000 is intended for use in the electromagnetic environment specified below. The customer or the
user of the ARK-10000 should assure that it is used in such an environment.
Immunity test
IEC 60601 test level
Electrostatic
±6kV contact
Discharge (ESD) ±8kV air
IEC 61000-4-2
Compliance level
±6kV contact
±8kV air
Electrical fast
transient/burst
IEC 61000-4-4
±2kV for power supply
lines
±1kV for input/output
lines
±2kV for power supply Mains power quality should be that of a
typical commercial or hospital environment.
lines
±1kV for input/output
lines
Surge
IEC 61000-4-5
±1kV
Differential mode
±2kV
Common mode
±1kV
Differential mode
±2kV
Common mode
Mains power quality should be that of a
typical commercial or hospital environment.
Voltage, dips,
short
interruptions and
voltage variations
on power supply
input lines IEC
61000-4-11
<5% U T
(>95% dip in U T)
for 0,5 cycle
40% U T
<5% U T
(>95% dip in U T)
for 0,5 cycle
40% U T
(60% dip in U T)
for 5 cycles
70% U T
(60% dip in U T)
for 5 cycles
70% U T
Mains power quality should be that of a
typical commercial or hospital environment.
If the user of the ARK-10000 requires
continued operation during power mains
interruptions, it is recommended that the
ARK-10000 be powered from an
uninterruptible power supply or a battery.
(30% dip in U T)
for 25 cycles
<5% U T
(>95% dip in U T)
for 5 sec
(30% dip in U T)
for 25 cycles
<5% U T
(>95% dip in U T)
for 5 sec
Power frequency 3 A/m
(50/60Hz)
magnetic field
IEC 61000-4-8
3 A/m
Electromagnetic environment - guidance
Floor should be wood, concrete or ceramic
tile. If floors are covered with synthetic
material, the relative humidity should be at
least 30%.
Power frequency magnetic fields should be
at levels characteristic of a typical location in
a typical commercial or hospital
environment.
NOTE U T is the a.c. mains voltage prior to application of the test level.
F-2
Guidance and manufacturer's declaration - electromagnetic immunity
The ARK-10000 is intended for use in the electromagnetic environment specified below. The customer or the
user of the ARK-10000 should assure that it is used in such an environment.
Immunity test
IEC 60601 test level
Compliance level
Conducted RF
IEC 61000-4-6
3Vrms
150kHz to 80MHz
3Vrms
(V1=3)
Radiated RF
IEC 61000-4-3
3V/m
80MHz to 2.5GHz
3V/m
(E1=3)
Electromagnetic environment - guidance
Portable and mobile RF communications
equipment should be used no closer to any
part of the ARK-10000, including cables, than
the recommended separation distance
calculated from the equation applicable to the
frequency of the transmitter.
Recommended separation distance
d =1.2 √P
d =1.2 √P 80MHz to 800MHz
d =2.3 √P 800MHz to 2.5GHz
where P is the maximum output power rating
of the transmitter in watts (W) according to the
transmitter manufacturer and d is the
recommended separation distance in metres
(m).
Field strengths from fixed RF transmitters, as
determined by an electromagnetic site survey,a
should be less than the compliance level in
each frequency range.b
Interference may occur in the vicinity of
equipment marked with the following symbol:
NOTE 1 At 80MHz and 800MHz, the higher frequency range applies.
NOTE 2 These guidelines may not apply in all situations. Electromagnetic propagation is affected by
absorption and reflection from structures, objects and people.
a. Field strengths from fixed transmitters, such as base stations for radio (cellular/cordless) telephones and
land mobile radios, amateur radio, AM and FM radio broadcast and TV broadcast cannot be predicted
theoretically with accuracy. To assess the electromagnetic environment due to fixed RF transmitters, an
electromagnetic site survey should be considered. If the measured field strength in the location in which the
ARK-10000 is used exceeds the applicable RF compliance level above, the ARK-10000 should be observed to
verify normal operation. If abnormal performance is observed, additional measures may be necessary, such as
reorienting or relocating the ARK-10000.
b. Over the frequency range 150kHz to 80MHz, field strengths should be less than 3V/m.
F-3
Recommended separation distances between portable and mobile RF communications equipment and the
ARK-10000
The ARK-10000 is intended for use in an electromagnetic environment in which radiated RF disturbances are
controlled. The customer or the user of the ARK-10000 can help prevent electromagnetic interference by
maintaining a minimum distance between portable and mobile RF communications equipment (transmitters)
and the ARK-10000 as recommended below, according to the maximum output power of the communications
equipment.
Rated maximum output power of transmitter
W
Separation distance according to frequency of transmitter
m
150kHz to 80MHz
d =1.2 √P
80MHz to 800MHz
d =1.2√P
800MHz to 2.5Hz
d =2.3 √P
0.01
0.12
0.12
0.23
0.1
0.38
0.38
0.73
1
1.2
1.2
2.3
10
3.8
3.8
7.3
100
12
12
23
For transmitters rated at a maximum output power not listed above, the recommended separation distance d in
metres (m) can be estimated using the equation applicable to the frequency of the transmitter, where P is the
maximum output power rating of the transmitter in watts (W) according to the transmitter manufacturer.
NOTE 1 At 80MHz and 800MHz, the separation distance for the higher frequency range applies.
NOTE 2 These guidelines may not apply in all situations. Electromagnetic propagation is affected by
absorption and reflection from structures, objects and people.
F-4
[This page is intentionally left blank.]