1
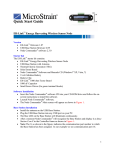
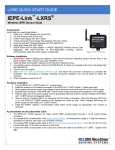
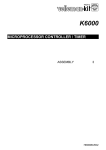
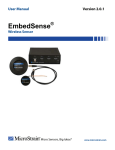
Quick Start Guide
SG-Link® OEM Wireless Strain Node
Firmware Version 6.10 and higher
Software Version 1.5.26 and higher
Issued: 5 April 2010
Document #: 8501-0003
Software Installation
• Place the Node Commander® CD in your CD-ROM drive and follow the onscreen instructions to install MicroStrain’s Node Commander® software.
Hardware Installation
• Install the antenna on the base station antenna connector. Tighten hand tight; do
not over tighten.
• If you have a serial base station (see Figure 1), connect the RS-232 cable to a
serial port on your PC and to the serial base station RS-232 connector. Connect
the external power supply to the power connector on the serial base station and
plug it into a proper power receptacle. Turn the serial base station power switch
on and the green LED will illuminate indicating the base station is powered
• If you have a USB base station, plug the USB connector into any USB port on
your PC. The blue LED will illuminate indicating the base station is powered.
• If you have an analog base station, connect the USB cable to any USB port on
your PC and to the analog base station USB connector on the back panel.
Connect the external power supply to the power connector on the back panel of
the analog base station and plug it into a proper power receptacle. Depress the red
power button on the front panel and the green LED will illuminate indicating the
base station is powered.
• The SG-Link® OEM has a chip-type (fractal) antenna mounted on the circuit
board surface and the unit is ready to transmit/receive as-is.
USB
Serial
Analog
Figure 1
1
Power
The SG-Link® OEM does not have an on/off switch. It receives its power through pins 7
and 8 on the terminal strip header. Before proceeding further, please refer to page 28 of
the SG-Link® OEM User Manual for details. An 8 pin mating connector, 9 volt battery
and battery power lead are provided with the SG-Link® OEM to get you up started.
Software Operations
• Double-click the Node Commander® desktop icon to launch the software.
• The Streaming Graph screen will appear. See Figure 2.
• If you have a USB or analog base station, the software will discover it and a base
station icon and com port label (example: Base Station Com 4) will appear in the
Controller frame. This indicates that the PC and the base station are
communicating.
• If you have a serial base station, move your mouse pointer within the white area
of the Controller frame on the left.
• Right-click in the white area and a pop-up menu will appear. See Figure 3.
• Click Scan Com Ports. The Scanning Com Ports window will appear.
• The program will scan the serial ports on your PC and attempt to locate the base
station.
• If the serial base station is found, a base station icon and com port label (example:
Base Station Com 1) will appear in the Controller frame. This indicates that the
PC and the base station are communicating.
• Right-click on the base station and a pop-up menu will appear. See Figure 4.
• Click Node Discovery. The Node Discovery window will appear. See Figure 5.
• Apply power to the SG-Link® OEM and a node icon and address label (example:
Node 236) will appear under the base station.
• Click Stop on the Node Discovery window.
• Right-click on the node icon/label and a pop-up menu will appear. See Figure 6.
• Click Load Node Information. A tree of information (Model, Serial number,
Firmware, Memory Full and Num Triggers) will open up under the node. See
Figure 7. This indicates that the PC, the base station and the node are all
communicating.
• Right-click on the node and a pop-up menu will appear.
• Click Range Test. The Short Packet Range Test window will appear. Radio
signal strength and good vs. bad pings will be reported. Good pings indicate that
the PC, the base station and the node are all communicating at range. Click
Cancel.
• Right-click on the node and a pop-up menu will appear.
• Click Configure. The Configuration window will appear. See Figure 8.
• Click the Channels tab. Check the box to enable SG-Link® OEM’s channel 1
(differential input channel). By default, channel 1’s physical units will be in bits
and the hardware gain will be set to 20. Uncheck channels 3 and 4 (channel 2 is
unused). Click Apply.
2
•
•
•
•
•
•
•
•
•
•
•
•
•
•
•
•
•
•
Click the Streaming tab. Uncheck box for Continuous Streaming. Enter the
value 5000 into the Sweeps scroll box. Note that a streaming session of
approximately 6 seconds has been set. Click Apply. Click OK.
Right-click on the node and a pop-up menu will appear.
Click Stream. Click Start. The node will start streaming its raw sensor data (04096 bits) and display channel 1 (green line) as an advancing plot on the
Streaming Graph. The Y-axis will auto-scale the raw sensor bits and should
report approximately 4096 bits (high railing) if no strain gauge (or other sensor) is
connected to the SG-Link® OEM inputs. The channel plot will continue along the
X-axis until 5000 sweeps (~6 seconds) has elapsed. See Figure 9. This indicates
that the node is successfully streaming its sensor data.
Move your mouse pointer within the black area of the Streaming Graph. Rightclick and a pop-up menu will appear.
Click Save Stream. A Save As dialog box appears. Accept or modify the File
Name for the CSV file that will be saved. Click Save. The dialog box will
disappear. This indicates that the streaming data was successfully saved to file on
your PC.
Right-click on the node and a pop-up menu will appear.
Click Configure. The Configuration window will appear.
Click the Datalogging tab. Uncheck box for Continuous Datalogging. Uncheck
box for Enable Sensor Event Driven Trigger. Enter the value 1000 into the
Sweeps scroll box. Enter the value 256Hz in the Sample Rate drop-down. Note
that a datalogging session of approximately 3.9 seconds has been set. Click
Apply. Click OK.
Right-click on the node and a pop-up menu will appear.
Click Datalogging. Click Erase. A confirming message box will appear. Click
Yes. A progress bar will appear and disappear. This indicates that the
datalogging memory of the node was successfully erased.
Right-click on the node and a pop-up menu will appear.
Click Datalogging. Click Trigger Session. A progress bar will appear and
disappear. This indicates that a datalogging session was successfully triggered.
Right-click on the node and a pop-up menu will appear.
Click Datalogging. Click Download. A progress bar will appear and disappear.
This indicates that all datalogging sessions were successfully downloaded.
Right-click on the node and a pop-up menu will appear.
Click Datalogging. Click Browse Triggers. The Trigger Browser window will
appear.
Click the + sign to the left of the trigger label (example: July 20, 2009 09:36:07)
and Trigger 1 will appear. Highlight Trigger 1 and click Open Trigger. The
data in Trigger 1 will be displayed in spreadsheet format (assuming you have
Microsoft® Excel installed). This indicates that the data from Trigger 1 was
successfully saved to file on your PC.
Close the spreadsheet. Click OK on Trigger Browser window.
3
Congratulations!
You are off and running! Please read the SG-Link® OEM user manual and the Node
Commander® software manual to learn how to successfully put your wireless data
acquisition system to work.
Further Support
MicroStrain Support Engineers are always available by phone, email or SKYPE to
support you in any way we can.
Figures
Figure 2
Figure 3
Figure 4
4
Figure 5
Figure 6
Figure 7
5
Figure 8
Figure 9
Copyright © 2010 MicroStrain, Inc.
MicroStrain, Inc.
459 Hurricane Lane, Unit 102
Williston, VT 05495 USA
www.microstrain.com
[email protected]
ph: 800-449-3878
fax: 802-863-4093
6