1
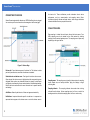
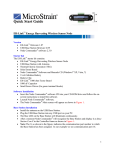
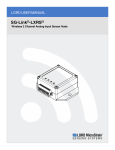
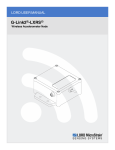
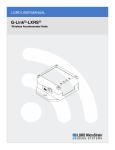
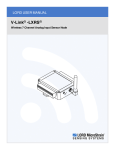
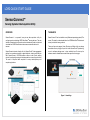
LORD QUICK START GUIDE
SensorConnect™
Sensing Systems Data Acquisition Utility
OVERVIEW
THE BASICS
SensorConnect ™ is a powerful, easy- to- use data acquisition utility for
configuring and coordinating LORD MicroStrain ® sensing devices. The user
interface is simple and intuitive and can be simultaneously used to collect and
view data from LORD MicroStrain wireless sensor networks and inertial
sensors.
SensorConnect™ can be installed on any Windows® operating system (XP or
newer). The installer is downloaded from the LORD MicroStrain® website and
is also provided with many products.
SensorConnect interacts directly with the SensorCloud™ data aggregation
platform for a seamless transition to data distribution, alerting, and analysis.
With SensorConnect , LORD MicroStrain offers an end- to- end sensing
solution, from physical sensing to data interpretation, across all product lines.
The result is simplified data acquisition for many interdisciplinary and
complex applications.
There are three main pages: Home, Devices, and Data, which are always
accessible at the top of page. A quick-link to the SensorCloud™ platform login and a software settings menu is also available here. On start-up the
software scans for attached sensors and then opens the home page.
Figure 1 - Home Page
SensorConnect™ Quick Start Guide
CONNECTING TO DEVICES
SensorConnect automatically detects any LORD MicroStrain device plugged
into an active port. Device connections are managed on the Devices page.
the device list. These notifications provide information about device
performance, such as communication and sampling status. Green
notifications typically indicate confirmed actions, while orange notifications
indicate information that may require further action.
COLLECTING DATA
Data sampling is initiated for each device through its device menu. For a
WSN, sampling can also be started for the entire network by initiating
sampling from the network gateway menu. The sampling menu options vary
depending on the type of device.
Figure 2 - Devices Page
Devices list - Found devices appear in the device list. This list also includes
previously found devices, even when the software is restarted.
Selected device and device menu - Each type of device has its own menu.
Once selected, the device name is highlighted and the corresponding menu
displayed. Menu options vary between devices but typically include device
configuration, start sampling, sensor mode selections, and data downloading.
Refer to the device user manual for more information on its specific features
and settings.
Add Device - Manually add a device if it does not appear automatically.
Notifications - Important information specific to a device or in response to a
requested action appears in the device menu or next to the device name in
2
Sampling menu - The sampling menu typically includes options for sampling
mode, sample rate, and sample duration. Apply the settings to begin
collecting data.
Sampling indicator - The sampling indicator shows when data is being
collected from the device. At slow sampling rates it will turn on and off as
readings are taken, while at fast sampling rates it will be on continuously.
SensorConnect™ Quick Start Guide
VIEWING DATA
1. Using Dashboards and Widgets
Collected data is viewed on the Data page through the creation of
dashboards and widgets. Think of dashboards as individual pages, and
widgets as an illustration on the page. Create multiple data widgets on each
dashboard to display sampled data as a time-series graph, text chart, or a
simple gauge that only displays the most current reading.
This format provides an easy way to organize many sensors and networks,
and it allows the information to be displayed in the most appropriate layout.
Figure 4 - Completed Dashboard
2. Navigating Graphs
Use the mouse, shift, and control keys inside the graph window to adjust the
data view.
Figure 3 - Data Page
NOTE
When device sampling is started a
notification appears with a shortcut
to create a time-series graph.
3
Control
Action
Mouse wheel
Shift + Mouse wheel
Mouse double-click
Shift + Mouse left-click and drag left/right
Shift + Mouse left-click and drag up/down
Ctrl + Mouse left-click and drag
Zoom in/out on x-axis
Zoom in/out on y-axis
Zoom to extends
Zoom window left/right
Zoom window up/down
Zoom box
Table 1 - Graph View Controls
SensorConnect™ Quick Start Guide
3. Widgets Options
The widget configuration menu is different for each type of widget, but
typically includes sensor or channel selections and widget settings such as
titles and legends. The time-series widget also includes a menu for exporting
data in a specified time range.
WORKING WITH WIRELESS SENSOR NETWORKS
When using SensorConnect with LORD MicroStrain wireless sensor
networks, transmission frequency and device operating modes effect how
SensorConnect is used.
1. Transmission Frequency
Gateways and sensor nodes do not need to be set to the same transmission
frequency to communicate with each other. However, if the node is on a
different frequency, confirmation will be required before the node is added to
the devices list. It will appears as an "unattached node" on the gateway
device menu with a notification indicating it is available to be added. Open the
menu to select nodes to attach.
Figure 5 - Widget Configuration Menus
Figure 6 - Nodes on Different Frequencies
2. Node Operational Modes
Sensor nodes have three operational modes: active , sleep , and idle. When
the node is sampling it is in active mode. To stop sampling, the node is put
into idle mode. Idle mode is used for configuring node settings (such as
frequency and sampling rates) and is the only way to stop sampling or toggle
between active and sleep modes. Sleep mode is an ultra-low power mode.
The node will automatically go into sleep mode after a user-selectable period
of inactivity. The node will not go into sleep mode while sampling.
4
SensorConnect™ Quick Start Guide
NOTE
Nodes can be configured to boot- up in different operational
modes. Automatic discovery in SensorConnect will only occur if
the node is set to idle mode. To force boot-up into idle mode,
toggle the node power switch rapidly two times, and then leave
it in the ON position. The status indicator on the node should
pulse once per second to indicate it is in idle mode.
Figure 7 - Node Operational Modes
Copyright © 2015 LORD Corporation
Document 8501-0063 Revision A. Subject to change without notice.
LORD Corporation
MicroStrain® Sensing Systems
459 Hurricane Lane , Suite 102
Williston, VT 05495 USA
www.microstrain.com
ph: 800-449-3878
fax: 802-863-4093
[email protected]
[email protected]