1
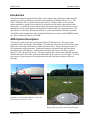
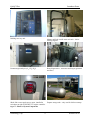
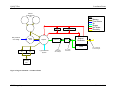
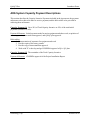
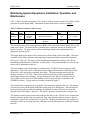
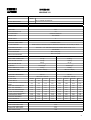
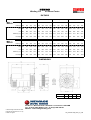
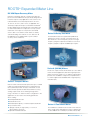
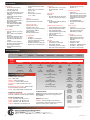
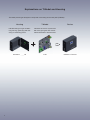
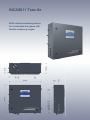
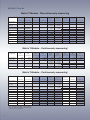
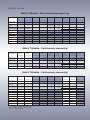
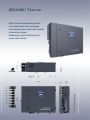
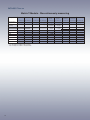
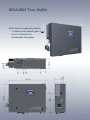
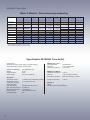
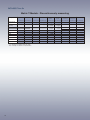
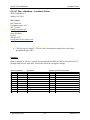
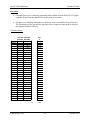
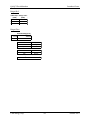
QUALITY ASSURANCE/QUALITY CONTROL (QA/QC) PLAN FOR LAWNHURST FARMS, LLC ANAEROBIC DIGESTER GAS (ADG) SYSTEM Agreement NEIS # 21426 Final December, 2014 Submitted to: New York State Energy Research and Development Authority 17 Columbia Circle Albany, NY 12203-6399 And Lawnhurst Farms 4124 County Route 5 Stanley, NY 14561 Submitted by: CDH Energy Corp. P.O. Box 641 Cazenovia, NY 13035 PROJECT PARTICIPANTS NYSERDA Project Manager Tom Fiesinger 17 Columbia Circle Albany, NY 12203-6399 518.862.1090 X 3218 Email: [email protected] ADG-to-Electricity Program Contractor (the: “ADG Contractor”) Lawnhurst Farms, LLC Contact: Don Jensen II, Principal 4124 County Route 5 Stanley, NY 14561 (585)-526-4534 Email: [email protected] ADG Contractor Site Contact Don Jensen III 4124 County Route 5 Stanley, NY 14561 585-738-9403 Email: [email protected] Nathan Rudgers Farm Credit East 4363 Federal Drive Batavia, NY 14020 585-815-1900 ext. 2239 585-993-0395 (cell) Digester System Vendor/Designer EnviTech Patrick Dumpe Schulz Systemtechnik Rainer Giese Schneiderkruger Str. 12 D-49429 Visbek Email: [email protected] NYSERDA Technical Consultant (TC) CDH Energy Corp. Contact: Daniel Robb P.O. Box 641 Cazenovia, NY 13035 315-655-1063 ext. 20 Email: [email protected] NYSERDA CHP Website Contractor (CHP Website Contractor) CDH Energy Corp. Contact: Hugh Henderson P.O. Box 641 Cazenovia, NY 13035 315-655-1063 ext. 13 Email: [email protected] QA/QC Plan Lawnhurst Farms Introduction This plan describes the approach that will be used to monitor the performance of the anaerobic digester gas (ADG) system that is currently being installed at Lawnhurst Farms, LLC, (“The Farm”) in Stanley, NY, to produce biogas and electricity. Biogas will be used to fuel one engine-generator to produce power that will be consumed on site and/or exported back to the local utility. A monitoring system will be installed to measure and collect the data necessary to quantify the electric power produced and amount of biogas used by the engine-generator. The data will serve as the basis for payment of three (3) years of performance incentive payments, which The Farm has applied for under a Standard Performance Contract with NYSERDA based on a Total Contracted Capacity of 541 kW. ADG System Description The digester system at the farm was designed by EnviTech Biogas AG. The power plant equipment will be provided by GE Jenbacher. Gas metering is provided by a Roots rotary meter while power metering is provided by a Shark 200 power meter. The site will operate one 541 kW synchronous engine-generator. Piping and controls are installed in the dedicated utility building in front of the digester. All the electrical loads at the farm are fed from a single 3phase, 277/480 volt electrical service. The farm currently does not have the capability to isolate itself from the grid, black start, and run in island mode, in the event of a power outage. The farm does expect to export a portion of the generated electricity, and has been approved for net metering. Mixer Location Installed, covered and filled digester, safety vent (left) and mixer location (1 of 4). Digester flare (back) and dewatering well (front). CDH Energy Corp. 3 December 2014 QA/QC Plan Lawnhurst Farms Bedding recovery unit. Manure and food or milk waste mix tank – before entering digester. Permanent gas analyzer (O2 ,CH4, H2S) Roots biogas meter – measures total biogas (generator and flare) Propane storage tank – only used for boiler at startup. Shark 200 revenue grade power meter, installed in switchgear to right of DIA.NE XT3 engine controller. Figure 1 - Photos of System Components CDH Energy Corp. 4 December 2014 QA/QC Plan Lawnhurst Farms Table 1 - Biogas Systems at Lawnhurst Farms Digester Feedstock Engine Generator Biogas Conditioning Engine Backup/startup Fuel Heat Recovery Use Additional Heat Recovery EnviTech Anaerobic Digester, fully mixed, soft cover, heated, 194,231 cf capacity, 45 to 50 day retention time Dairy Manure (approx. 1,400 cows), corn silage, dairy waste 12 cylinder, GE Jenbacher J312 GS C81, Reciprocating Engine, 541 kW on biogas Stamford CG 634 J2 – 480 VAC, 3 Phase, 541 kW Sulfur abatement system installed in digester. Propane Boiler – Used to heat digester until sufficient biogas is produced to run engine / generator. Generator cannot run on propane. Digester heating Milking parlor water heating & engine building heating Figure 2 below shows the basic process flow of the anaerobic digester system installed at the farm. Manure is collected in one of three lagoons, one main and two secondary. Manure is then pumped from the primary lagoon to either the mixing tank or the digester. The mixing tank is used when corn silage or dairy waste is being added to the digester in addition to the manure. Flowmeters are installed on both the food waste and manure feed so that specific ratios of each feedstock can be mixed together to uniform consistency. The digester has a H2S abatement system installed. This works by injecting air into the biogas. The O2 reacts with the H2S to form H2O and elemental sulfur, which precipitates out of the biogas in solid form. When biogas leaves the digester it passes thru underground condensate lines and a condensate pit. The cooler temperature under the ground dehumidifies the biogas and is used in place of a chiller and liquid to gas heat exchanger for dehumidification. Biogas then passes thru a blower, to increase pressure, before either being combusted in the engine or flared. A pressure and temperature compensated Roots rotary gas meter measures the total biogas that flows to both the engine and flare. According to the digester design when the engine is running, the flare should never be on because the engine at full load can consume all of the biogas the digester is projected to produce. The engine generator includes both an exhaust gas and engine jacket heat recovery system. Heat is recovered in the form of hot water which is pumped thru piping lining the perimeter of the digester to help maintain a temperature of around 100 ⁰F. The facility also plans on using some of the recovered heat for preheating water used for cleaning in the dairy parlor. CDH Energy Corp. 5 December 2014 QA/QC Plan Lawnhurst Farms Manure Collection Pits (3x) Key Engine Bldg. Heating Dairy Waste & Corn Silage Mixing Tank Digester Condensate Lines & Pit Manure Food Waste Air Biogas Hot Water Electricity Milking Area / Process Water Heating Blower Engine / Generator Flare Separator #1 Separator #2 H2S Abatement System Union Instruments Gas Analyzer FG - Roots Gas Meter WG - Electricity to farm and grid Bedding Recovery Unit Figure 2. Digester Schematic - Lawnhurst Farms CDH Energy Corp. 6 December 2014 QA/QC Plan Lawnhurst Farms ADG System Capacity Payment Descriptions This section describes the Capacity Incentive Payments included in the Agreement, the payment milestones to be achieved in order to receive payment, and the deliverables to be provided in achieving these milestones. Capacity Payment #1: Up to 50% of Total Capacity Incentive or 50% of the total initial payments (whichever is less). Payment Milestones: Initial payments made for major equipment and other work, acquisition of necessary permits, interconnection approval, and QA/QC plan approval. Deliverables: 1. Documentation of payments for equipment and work. 2. Provide copies of necessary permits. 3. Provide copy of interconnection approval. 4. Work with TC to develop and get NYSERDA approval of QA / QC plan. Capacity Payment #2: The remainder of the Total Capacity Incentive. Payment Milestones: NYSERDA approval of the Project Installation Report. CDH Energy Corp. 7 December 2014 QA/QC Plan Lawnhurst Farms Monitoring System Equipment, Installation, Operation, and Maintenance Table 2 shows the general location of the meters used to measure biogas flow (FG) and the generator electrical output (WG). Information on these data points is shown in Table 2. Table 2 - Monitored Points for ADG System Point Type Point Name Description Instrument Engineering Units Expected Range Modbus WG EngineGenerator Power Shark 200 power meter kW 0 – 575 kW Pulse FG Total Gas Flow Roots Rotary Gas Meter Series B4 G250 SCFH 0 – 15,000 SCFH The electrical output of the engine-generator (WG) will be measured with the Shark 200 revenue grade power meter. The power meter is installed in the switchgear directly to the right of the engine controller. The power meter will be installed according to the requirements in the appropriate operator guide. The biogas input to the engine will be measured by a Roots Rotary flow meter (FG). The meter is capable of providing a pressure and temperature compensated pulse output and can measure flows up to 15,891 cfh. The meter will be installed and maintained according to the “Roots Installation and Maintenance Guidelines” by the facility. A log of maintenance activities for the meters will be maintained at the site. The lower heating value for the biogas is estimated to be 524 Btu/ft3, based on past the ADG application. This value will be verified based on the logged measurements of the biogas taken by the INCA 4001 gas analyzer installed at the farm. The measurements taken by the gas analyzer include O2 ,CH4, H2S. These values will be included in the daily transmitted file containing generator power and gas. The gas analyzer provides data at 10 minute intervals. These values will be in the local CDH database, however they will not be uploaded to the NYSERDA website. The gas analyzer location is marked in Figure 3. The boiler backup /startup fuel flow (propane) is not metered or logged at this site. The propane will only be used to run the boiler during the startup process for the digester. Once the digester heats up and is producing sufficient amounts of biogas the facility will switch over from the propane boiler to the engine / generator. The engine / generator is tuned to run on biogas only. The facilities control system creates and sends one data file per day. The file is row oriented and includes generator power, total gas production, flare valve position, digester pressure, digester temperature, ppm of H2S, and percent of O2 and CH4. The data points from the gas analyzer are provided at coarse and varying intervals, while the rest of the data points are consistent 5-minute intervals. CDH Energy Corp. 8 March 2014 QA/QC Plan Lawnhurst Farms The Farm has created a FTP site that they will upload the data files to daily. CDH has confirmed that the FTP site can be accessed and the daily log files can be downloaded, processed, and upload the data to the NYSERDA CHP Website. If the daily FTP files are interrupted, CDH will alert Envitech and request them to fix the daily file transfers and send any missing files. Once the previous days data is successfully downloaded and stored locally it is removed in order to not take up unnecessary space on the FTP server. The server has the capability to store at least forty (40) days of data. Management of Monitoring System Data The Farm will perform the following quality assurance and quality control measures to ensure the data produced from our system accurately describes system performance. On a daily basis, The Farm equipment manager will perform inspections of the digester and engine-generator equipment and record findings into the project log. On a weekly basis, The Farm equipment manager will perform inspections of the QA/QC meter installations and complete the routine maintenance on the meters, noting any abnormalities or unexpected readings. The Farm will also maintain a weekly log of the cumulative power generation (kWh) from the Shark 200 (WG) and gas flow (cf or ft3) recorded by the Roots meter (FG) in the event that data transfer to the NYSERDA CHP Website fails or other anomalies occur. On a weekly basis, The Farm staff will review the data stored in the NYSERDA CHP Website (chp.nyserda.org) to ensure it is consistent with our observed performance of the ADG system and logged readings. The Farm will review the data using the reporting features at the website, including: Monitored Data – Plots and Graphs, and RPS: Customer-Sited Tier Anaerobic Digester Gas-to-Electricity Program NYSERDA Incentive Program Reports. In addition, The Farm staff will also setup and use the email reports that are available at the CHP Website to help track the system performance, including: a periodic email report summarizing system performance and the estimated incentive, an email report sent out if data is not received at the web site or does not pass the quality checks. The website will automatically take the data collected from the data-logger and evaluate the quality of the data for each 5-minute interval using range and relational checks. Details on the range and relational checks can be found in the Database Notes.PDF document, located on the NYSERDA CHP Website. CDH Energy Corp. 9 March 2014 QA/QC Plan Lawnhurst Farms Only data that passes the range and relational quality checks will be used in the incentive reports listed above. However, all hourly data is available from the NYSERDA CHP Website if the data quality flag of “Data Exists” is selected. In the event of a communications or meter failure, the farm will work with CDH Energy to resolve the issue in a few days. If unanticipated loss of data occurs when the engine-generator continues to produce electricity, The Farm intends to follow the procedures outlined in Exhibit C, of their contract, i.e. taking the average output measured from similar length periods just prior and just after the outage (or other method acceptable to NYSERDA). The Farm understands that they can use this approach for up to two outages for up to 36 hours each per12-month performance period. If more than two such data outages occur per 12-month period, then the Farm will provide independent cumulative meter readings or other documentation to demonstrate any system power output during outages. Otherwise, the generator output will be assumed to equal zero for the outage period. Annual Performance Reports Lawnhurst Farms will prepare Annual Performance Reports summarizing the monthly data over the 12-month performance period. The reports will include a table (example provided below) showing the monthly kWh production, biogas use by the engine, and other data listed in Table 3, and if used, any heating oil or other fuel used for the engine/boiler. The methods for calculating these values are provided below. Table 3 - Summary of Monthly Data for Annual Performance Reports Start Date of Reporting Period Number of Days in Each Period Electricity Production, kWhgenerator Biogas Used by Engine, (cubic feet) LHVbiogas (Btu/cf) Biogas Energy Content, Qbiogas (BTU) Electrical Efficiency (percent) TOTALS The Farm will calculate monthly values for lower heating value of the biogas (LHVbiogas) and total energy content of the biogas (Qbiogas) as follows. CDH Energy Corp. 10 March 2014 QA/QC Plan Lawnhurst Farms Monthly Biogas Lower Heating Value The logged CH4 data will be used to calculate an average monthly Biogas Lower Heating Value using the following equation: LHVbiogas LHV methane CH 4 where: LHVmethane - lower heating value of methane (911 Btu/ft3 at standard conditions, 60 °F and 1 atm) CH4 - measured percent methane in biogas Since CH4 data is sporadic, it will be used to calculate monthly averages. These monthly averages will then be used to calculate a monthly biogas LHV. Monthly Biogas Energy Content Calculate the average monthly Biogas Energy Content using the following equation: Qbiogas CF LHVbiogas where: CF - volume (cubic feet or ft3) of biogas in month Reasonable Electrical Efficiency The Annual Performance Report will also provide a monthly comparison of power output and fuel input for the engine to confirm their reasonableness. For instance, the electrical efficiency – measured as power output (kWhgenerator) divided by the energy content of the fuel input (Qbiogas) in similar units and based on lower heating value – should be in the 25% to 35% range over any interval for the engine-generator at Lawnhurst Farms. CDH Energy Corp. 11 March 2014 Appendices Cut sheets and Manuals for: GE Janbacher J312 GS C81 Stamford, CG 634 J2 Generator Roots Rotary Gas Meter Shark 200 Power Meter Union Instruments INCA 4001 Gas Analyzer GE Energy Gas Engines Jenbacher type 3 efficient, durable, reliable Long service intervals, maintenance-friendly engine design and low fuel consumption ensure maximum efficiency in our type 3 engines. Optimized components prolong service life even when using non-pipeline gases such as landfill gas. The type 3 stands out in its 500 to 1,100 kW power range due to its technical maturity and high degree of reliability. reference installations model, plant key technical data description J312 GS Containerized solution Landfill site; Cavenago, Italy Fuel . . . . . . . . . . . . . . . . . . . . . . . . . . . . . . . . . . . . . . . . . . . . . . Landfill gas Engine type . . . . . . . . . . . . . . . . . . . . . . . 2 x JMC 312 GS-L.L Electrical output . . . . . . . . . . . . . . . . . . . . . . . . . . . . . . . 1,202 kW Thermal output . . . . . . . . . . . . . . . . . . . . . . . . . . . . . . . . 1,494 kW Commissioning . . . . . . . . . . . . . . . . . . . . . . September 1999 Every system has its own landfill gas feeder line and exhaust gas treatment line. The generated electricity is used on-site, excess power is fed into the public grid. The employment of the CL.AIR* system ensures the purification of the exhaust gas to meet stringent Italian emission requirements. As a special feature, at this plant the thermal energy is used for landfill leachate treatment, as well as for greenhouse heating. J316 GS Profusa, producer of coke; Bilbao, Spain Fuel . . . . . . . . . . . . . . . . . . . . . . . . . Coke gas and natural gas Engine type . . . . . . . . . . . . . . . . . . 12 x JGS 316 GS-S/N.L Electrical output a) with 100% coke gas . . . . . . . . . . . . . . . . . . . . . . . 5,642 kW b) with 60% coke gas and 40% natural gas, or 100% natural gas . . . . . . . . . . . . . . . . . . . . . . . . 6,528 kW Commissioning . . . . . . . . . . . . . . . . . . . . . . November 1995 This installation designed by GE’s Jenbacher product team enables Profusa to convert the residual coke gas with a hydrogen content of approximately 50% into valuable electrical energy. Beginning 2008, the 12 engines reached a combined total of one million operating hours. J320 GS Ecoparc I; Barcelona, Spain Fuel . . . . . . . . . . . . . . . . . . . . . . . . . . . . Biogas and natural gas Engine type . . . . . . . . . . . . . . . . . . . 5 x JMS 320 GS-B/N.L Electrical output . . . . . . . . . . . . . . . . . . . . . . . . . . . . . . . . . . 5,240 kW Thermal output a) with biogas . . . . . . . . . . . . . . . . . . . . . . . . . . . . . . . . . . . . . 2,960 kW b) with natural gas . . . . . . . . . . . . . . . . . . . . . . . . . . . . . . 3,005 kW Commissioning . . . . . . . . . . . . . . . . . . . . . . . . December 2001 to January 2002 In Ecoparc I, organic waste is processed into biogas, which serves as energy source for our gas engines. The generated electricity is used on-site as well as fed into the public power grid. A portion of the thermal energy is used as process heat in the digesters, and the excess heat is bled off in the air coolers. J320 GS Amtex Spinning Mills; Faisalabad, Pakistan Fuel . . . . . . . . . . . . . . . . . . . . . . . . . . . . . . . . . . . . . . . . . . . . . Natural gas Engine type . . . . . . . . . . . . . . . . . . . . . 12 x JGS 320 GS-N.L Electrical output . . . . . . . . . . . . . . . . . . . . . . . . . . . . . . 12,072 kW Commissioning . . . November 2002 (1st, 2nd engine), April 2003 (3rd engine), May 2003 (4th - 7th engine), April 2004 (8th engine), April 2005 (9th, 10th engine), March 2008 (11th, 12th engine) The natural gas-driven units generate electricity for spinning mills in one of Pakistan’s most important textile centers. Special features of this Jenbacher plant allow for high ambient temperature, dusty inlet air, and operation in island mode. *Trademark of General Electric Company technical data Configuration V 70° Bore (mm) 135 Stroke (mm) 170 Displacement/cylinder (lit) 2.43 Speed (rpm) 1,500 (50 Hz) 1,200/1,800 (60 Hz) Mean piston speed (m/s) 8.5 (1,500 rpm) 6.8 (1,200 rpm) 10.2 (1,800 rpm) Scope of supply Generator set, cogeneration system, generator set/cogeneration in container Applicable gas types Natural gas, flare gas, propane, biogas, landfill gas, sewage gas. Special gases (e.g., coal mine gas, coke gas, wood gas, pyrolysis gas) Engine type J312 GS J316 GS J320 GS No. of cylinders 12 16 20 Total displacement (lit) 29.2 38.9 48.7 Dimensions l x w x h (mm) Generator set Cogeneration system Container J312 GS J316 GS J320 GS J312 GS J316 GS J320 GS J312 GS J316 GS J320 GS 4,700 x 1,800 x 2,300 5,200 x 1,800 x 2,300 5,700 x 1,700 x 2,300 4,700 x 2,300 x 2,300 5,300 x 2,300 x 2,300 5,700 x 1,900 x 2,300 12,200 x 2,500 x 2,600 12,200 x 2,500 x 2,600 12,200 x 2,500 x 2,600 Weights empty (kg) Generator set Cogeneration system Container (generator set) Container (cogeneration) J312 GS 8,000 9,400 19,400 20,800 J316 GS 8,800 9,900 22,100 23,200 J320 GS 10,500 11,000 26,000 26,500 outputs and efficiencies 500 mg/m 3 N 250 mg/m3N 350 mg/m3N Type Pel (kW)1 el (%) Pth (kW) th (%) 312 312 316 320 312 316 320 312 316 320 527 637 835 1,063 637 802 1,063 637 802 1,063 39.9 40.8 40.0 40.8 39.6 39.0 39.8 40.1 39.2 40.1 626 725 968 1,193 759 977 1,240 741 984 1,226 47.3 46.4 47.2 45.8 47.1 47.5 46.4 46.7 48.1 46.3 Biogas NOx < 500 mg/m3N 250 mg/m3N 350 mg/m3N 1.800 rpm | 60 Hz tot (%) Pel (kW)1 87.2 87.1 87.2 86.6 86.7 86.5 86.2 86.9 87.3 86.4 633 848 1,059 633 848 1,059 1,500 rpm | 50 Hz el (%) Pth (kW) th (%) 38.1 38.3 39.0 36.8 36.9 38.1 814 1,089 1,324 875 1,159 1,380 49.0 49.2 48.8 50.8 50.5 49.7 1.200 rpm | 60 Hz tot (%) Pel (kW)1 87.1 87.4 87.8 87.5 87.4 87.8 el (%) Pth (kW) th (%) tot (%) 435 583 795 39,7 40,3 40,7 503 655 855 45,9 45,2 43,8 85,6 85,5 84,5 418 559 795 38,6 38,8 40,7 504 671 855 46,5 46,5 43,8 85,2 85,3 84,5 GEA-13690A NOx < 1.500 rpm | 50 Hz 1,800 rpm | 60 Hz Type Pel (kW)1 el (%) Pth (kW) th (%) tot (%) Pel (kW)1 312 312 316 316 320 312 316 320 312 316 320 526 637 703 835 1,063 41.1 40.3 40.5 39.9 40.8 532 682 743 920 1,081 41.5 43.2 42.8 44.0 41.5 82.6 83.6 83.3 83.9 82.3 1,063 40.1 1,108 41.8 82.0 el (%) Pth (kW) th (%) tot (%) 633 38.1 787 47.4 85.5 848 38.3 1,054 47.6 85.9 1,059 633 848 1,059 39.0 36.8 36.9 36.9 1,269 837 1,118 1,406 46.7 48.6 48.7 49.0 85.7 85.3 85.6 85.9 1) Total heat output with a tolerance of +/- 8%, exhaust gas outlet temperature 120°C, for biogas exhaust gas outlet temperature 180°C All data according to full load and subject to technical development and modification. GE Energy Jenbacher gas engines Austria (Headquarters) 6200 Jenbach T +43 5244 600-0 F +43 5244 600-527 [email protected] www.gejenbacher.com © 2012 GE Jenbacher GmbH & Co OG. All rights reserved. Natural gas HCI634H - Technical Data Sheet HCI634H SPECIFICATIONS & OPTIONS STANDARDS TERMINALS & TERMINAL BOX Newage Stamford industrial generators meet the requirements of BS EN 60034 and the relevant section of other international standards such as BS5000, VDE 0530, NEMA MG1-32, IEC34, CSA C22.2-100, AS1359. Other standards and certifications can be considered on request. Standard generators feature a main stator with 6 ends brought out to the terminals, which are mounted on the frame at the non-drive end of the generator. A sheet steel terminal box contains the AVR and provides ample space for the customers' wiring and gland arrangements. It has removable panels for easy access. VOLTAGE REGULATORS SHAFT & KEYS MX321 AVR - STANDARD All generator rotors are dynamically balanced to better than BS6861:Part 1 Grade 2.5 for minimum vibration in operation. Two bearing generators are balanced with a half key. This sophisticated Automatic Voltage Regulator (AVR) is incorporated into the Stamford Permanent Magnet Generator (PMG) system and is fitted as standard to generators of this type. The PMG provides power via the AVR to the main exciter, giving a source of constant excitation power independent of generator output. The main exciter output is then fed to the main rotor, through a full wave bridge, protected by a surge suppressor. The AVR has in-built protection against sustained overexcitation, caused by internal or external faults. This de-excites the machine after a minimum of 5 seconds. Over voltage protection is built-in and short circuit current level adjustments is an optional facility. WINDINGS & ELECTRICAL PERFORMANCE All generator stators are wound to 2/3 pitch. This eliminates triplen (3rd, 9th, 15th …) harmonics on the voltage waveform and is found to be the optimum design for trouble-free supply of non-linear loads. The 2/3 pitch design avoids excessive neutral currents sometimes seen with higher winding pitches, when in parallel with the mains. A fully connected damper winding reduces oscillations during paralleling. This winding, with the 2/3 pitch and carefully selected pole and tooth designs, ensures very low waveform distortion. INSULATION/IMPREGNATION The insulation system is class 'H'. All wound components are impregnated with materials and processes designed specifically to provide the high build required for static windings and the high mechanical strength required for rotating components. QUALITY ASSURANCE Generators are manufactured using production procedures having a quality assurance level to BS EN ISO 9001. The stated voltage regulation may not be maintained in the presence of certain radio transmitted signals. Any change in performance will fall within the limits of Criteria 'B' of EN 61000-6-2:2001. At no time will the steady-state voltage regulation exceed 2%. NB Continuous development of our products entitles us to change specification details without notice, therefore they must not be regarded as binding. Front cover drawing typical of product range. 2 HCI634H WINDING 312 CONTROL SYSTEM SEPARATELY EXCITED BY P.M.G. A.V.R. MX321 VOLTAGE REGULATION ± 0.5 % SUSTAINED SHORT CIRCUIT With 4% ENGINE GOVERNING REFER TO SHORT CIRCUIT DECREMENT CURVES (page 7) CLASS H INSULATION SYSTEM IP23 PROTECTION 0.8 RATED POWER FACTOR DOUBLE LAYER LAP STATOR WINDING WINDING PITCH TWO THIRDS WINDING LEADS 6 STATOR WDG. RESISTANCE 0.003 Ohms PER PHASE AT 22°C STAR CONNECTED ROTOR WDG. RESISTANCE 1.88 Ohms at 22°C R.F.I. SUPPRESSION BS EN 61000-6-2 & BS EN 61000-6-4,VDE 0875G, VDE 0875N. refer to factory for others WAVEFORM DISTORTION NO LOAD < 1.5% NON-DISTORTING BALANCED LINEAR LOAD < 5.0% MAXIMUM OVERSPEED 2250 Rev/Min BEARING DRIVE END BALL. 6224 (ISO) BEARING NON-DRIVE END BALL. 6317 (ISO) 1 BEARING 2 BEARING WEIGHT COMP. GENERATOR 2117 kg 2145 kg WEIGHT WOUND STATOR 1010 kg 1010 kg WEIGHT WOUND ROTOR 866 kg WR² INERTIA 821 kg 20.0438 kgm 2180kg 183 x 92 x 140(cm) 183 x 92 x 140(cm) 50 Hz 60 Hz THF<2% TIF<50 1.614 m³/sec 3420 cfm 1.961 m³/sec 4156 cfm TELEPHONE INTERFERENCE COOLING AIR 19.4965 kgm2 2173kg SHIPPING WEIGHTS in a crate PACKING CRATE SIZE 2 VOLTAGE STAR 380/220 400/231 415/240 440/254 416/240 440/254 460/266 480/277 VOLTAGE DELTA 220 230 240 254 240 254 266 277 kVA BASE RATING FOR REACTANCE VALUES 910 910 910 875 1025 1063 1075 1125 Xd DIR. AXIS SYNCHRONOUS 2.99 2.70 2.51 2.15 3.37 3.13 2.89 2.78 X'd DIR. AXIS TRANSIENT 0.25 0.23 0.21 0.18 0.29 0.27 0.25 0.24 X''d DIR. AXIS SUBTRANSIENT 0.18 0.16 0.15 0.13 0.19 0.18 0.17 0.16 Xq QUAD. AXIS REACTANCE 1.77 1.60 1.49 1.27 2.00 1.86 1.72 1.65 X''q QUAD. AXIS SUBTRANSIENT 0.19 0.17 0.16 0.14 0.22 0.20 0.19 0.18 XL LEAKAGE REACTANCE 0.09 0.08 0.07 0.06 0.10 0.09 0.08 0.08 X2 NEGATIVE SEQUENCE 0.20 0.18 0.17 0.14 0.23 0.21 0.20 0.19 X0 ZERO SEQUENCE 0.03 0.02 0.02 0.02 0.03 0.03 0.02 0.02 REACTANCES ARE SATURATED VALUES ARE PER UNIT AT RATING AND VOLTAGE INDICATED T'd TRANSIENT TIME CONST. 0.185 T''d SUB-TRANSTIME CONST. 0.025 T'do O.C. FIELD TIME CONST. 2.44 Ta ARMATURE TIME CONST. SHORT CIRCUIT RATIO 0.04 1/Xd 3 50 Hz 4 HCI634H Winding 312 THREE PHASE EFFICIENCY CURVES HCI634H Winding 312 THREE PHASE EFFICIENCY CURVES 60 Hz 5 HCI634H Winding 312 Locked Rotor Motor Starting Curve 50 Hz 346V 30 380V 400V 415V 440V PER CENT TRANSIENT VOLTAGE DIP . 25 20 15 10 5 0 0 200 400 600 800 1000 1200 1400 1600 1800 2000 2200 2400 LOCKED ROTOR kVA 60 Hz 380V 30 416V 440V 460V 480V PER CENT TRANSIENT VOLTAGE DIP . 25 20 15 10 5 0 0 200 400 600 800 1000 1200 1400 1600 LOCKED ROTOR kVA 6 1800 2000 2200 2400 2600 2800 HCI634H Three-phase Short Circuit Decrement Curve. No-load Excitation at Rated Speed Based on star (wye) connection. 50 Hz CURRENT (Amps) 100000 SYMMETRICAL ASYMMETRICAL 10000 1000 0.001 0.01 0.1 TIME (secs) 1 10 1 10 Sustained Short Circuit = 3,300 Amps 60 Hz CURRENT (Amps) 100000 SYMMETRICAL ASYMMETRICAL 10000 1000 0.001 0.01 0.1 TIME (secs) Sustained Short Circuit = 4,000 Amps Note 1 The following multiplication factors should be used to adjust the values from curve between time 0.001 seconds and the minimum current point in respect of nominal operating voltage : 50Hz Voltage 380v 400v 415v 440v Factor X 1.00 X 1.07 X 1.12 X 1.18 60Hz Voltage 416v 440v 460v 480v Note 2 The following multiplication factor should be used to convert the values calculated in accordance with NOTE 1 to those applicable to the various types of short circuit : 3-phase Factor x 1.00 x 1.06 x 1.12 x 1.17 The sustained current value is constant irrespective of voltage level 2-phase L-L 1-phase L-N x 1.30 x 3.20 x 2.50 2 sec. x 1.00 x 0.87 Instantaneous Minimum x 1.00 x 1.80 Sustained x 1.00 x 1.50 Max. sustained duration 10 sec. 5 sec. All other times are unchanged Note 3 Curves are drawn for Star (Wye) connected machines. 7 HCI634H Winding 312 0.8 Power Factor RATINGS Cont. F - 105/40°C Class - Temp Rise 50Hz 50 60Hz Cont. H - 125/40°C Standby - 150/40°C Standby - 163/27°C Star (V) 380 400 415 440 380 400 415 440 380 400 415 440 380 400 415 440 Delta (V) 220 230 240 254 220 230 240 254 220 230 240 254 220 230 240 254 kVA 830 860 830 800 910 940 910 875 960 980 960 920 1000 1010 1000 960 kW 664 688 664 640 728 752 728 700 768 784 768 736 800 808 800 768 Efficiency (%) 95.2 95.3 95.4 95.6 94.9 95.0 95.2 95.4 94.7 94.8 95.1 95.3 94.5 94.7 94.9 95.2 kW Input 697 722 696 669 767 792 765 734 811 827 808 772 847 853 843 807 Star (V) 416 440 460 480 416 440 460 480 416 440 460 480 416 440 460 480 Delta (V) 240 254 266 277 240 254 266 277 240 254 266 277 240 254 266 277 kVA 913 963 1000 1025 1025 1063 1075 1125 1088 1125 1138 1188 1125 1163 1175 1219 kW 730 770 800 820 820 850 860 900 870 900 910 950 900 930 940 975 Efficiency (%) 95.2 95.3 95.3 95.4 94.9 95.1 95.2 95.2 94.8 94.9 95.0 95.1 94.6 94.8 94.9 95.0 808 839 860 864 894 903 945 918 948 958 999 951 981 991 1027 kW Input 767 DIMENSIONS © 2002 Newage International Limited. Reprinted with permission of N.I. only. Printed in England. SAE 14 18 21 24 AN 25.4 15.87 0 0 PO Box 17 • Barnack Road • Stamford • Lincolnshire • PE9 2NB Tel: 00 44 (0)1780 484000 • Fax: 00 44 (0)1780 484100 Website: www.newage-avkseg.com TD_HCI634H.GB_08.02_01_GB ROOTS® Expanded Meter Line B3-VRM Vapor Recovery Meter Rated for a maximum capacity of 3000 actual cubic feet per hour, the B3-VRM meters are specifically designed and tested for vapor recovery applications and conform to the California Air Resources Board specifications TP-201.1, TP-201.1A, TP-201.2, and P-201.5, as applicable. The extremely low pressure drop associated with the ROOTS® positive displacement meter makes this meter ideal for the accurate measurement in low pressure recovery systems. Odometers on the vapor recovery meters are marked at 0.02 cubic foot increments, which allows accurately estimated readings in increments of 0.01 cubic feet. All B3-VRM meters are supplied with a 7 point certified accuracy curve for reference. Series B4 Rotary Gas Meter The Series B4 meters have a permanently lubricated, maintenance free uncorrected counter unit which can be rotated 355°. One low frequency (LF) and one high frequency (HF) pulse output are standard, a second low frequency (LF) pulse output is available upon request. Series A (LM-MA) Meters The 8C175 compact meter, like the Series Z, is also ideal for small commercial applications, but with a higher pressure rating. This meter is rated for a 175 PSIG (12 Bar) working pressure. Also available as a Vapor Recovery Meter that is C.A.R.B. approved and available with a High Frequency transmitter (PX). Series Z Compact Meters Ideal for small commercial loads at pressures up to 15 PSIG (1 Bar), the aesthetically pleasing 5C15 (500 ACFH) and 8C15 (800 ACFH) meters are easy to install and conceal. Series Z meters provide excellent measurement accuracy starting at “pilot loads” and continuing throughout the range of the meter. To match the meter configuration to the application, the user selects the following parameters when ordering: ■ ■ ■ ■ ■ ■ Dial Imperial Wheel Index Sealed Index Cover Standard (Atmospheric) or 2 PSIG Compensated Index Top or Bottom Inlet Sprague 4 (male), 45 Light (male), or 1–1/2 inch NPT (female) Connections Optional Inlet Strainer/Screen Series A1 Foot Mount Meter The 102M125 Foot Mount meter is used for the measurement of high volume industrial gas loads for capacities up to 965.3 MSCFH at 125 PSIG (27,334 Nm3/h at 8,6 Bar). Meters and Instruments | 9 ® UPGRADABLE FULLY FEATURED POWER & ENERGY METER www.electroind.com Revenue Grade with Advanced I/O and Power Quality Shark® 200 Meter/Transducer Shark® 200T Transducer Only From Simple to Sophisticated Industry Leading Performance • Simple Multifunction Meter: V-Switch™ Key 1 • Highly Accurate Metering Technology • Historical Data-logging: V-Switch™ Key 2 • Expandable I/O with 100BaseT Ethernet • Advanced Power Quality Waveform • V-Switch™ Technology Upgrade Recorder: V-Switch™ Keys 5 or 6 • Extensive Data Logging • Power Quality Recording • Up to 512 Samples/Cycle Electro Industries/GaugeTech The Leader in Power Monitoring and Smart Grid Solutions • Embedded Web Server HIGH PERFORMANCE WAVEFORM RECORDING Basic Features Summary • 0.2% Class Revenue Certifiable Energy and Demand Metering • Meets ANSI C12.20 and IEC 687 (0.2% Class) • Multifunction Measurement • 3 Line .56" LED display • % of Load Bar for Analog Perception • Standard RS485 (Modbus and DNP 3.0) • IrDA Port Enables Laptop PC Reading and Programming • Ultra-Compact • Fits both ANSI and DIN Cutouts APPLICATIONS Advanced Features Summary • Utility Metering • Commercial Metering • High Performance Waveform Recorder • Substations • Industrial Metering • Up to 4 Megabytes Flash for Historical Data Logging & PQ Recording • Power Generation • Campus Metering • Extremely Configurable Field Upgradable I/O • Submetering • Analog Meter Replacement • 100BaseT Ethernet – Rapid Response™ Technology • Power Quality Studies • Disturbance Recording • V-Switch™ Technology • Load Studies • Voltage Recording ACCURACY AND UPGRADE SWITCHES Electro Industries introduces a new standard in panel mounted power metering. The Shark® 200 metering system is an ultra-compact power metering device providing industry leading revenue metering functionality combined with advanced data-logging, power quality, communication and I/O traditionally found only in high performance and high cost systems. This product is designed to incorporate advanced features in a cost effective, small package for large scale, low cost deployment within an electrical distribution system. V-Switch™ Technology The Shark® 200 meter is equipped with EIG’s exclusive V-Switch™ technology. This technology allows users to upgrade and add features by using communication commands as needed, even after the meter is installed. V-Switches Include the Following Features: Feature V1 Multifunction Measurement with I/O Expansion P P P P P P P P P PP P P P P P 2 Megabytes Data-Logging 3 Megabytes Data-Logging 4 Megabytes Data-Logging Harmonic Analysis TLC and CT/PT Compensation Limit and Control Functions 64 Samples per Cycle Waveform Recorder 2 512 Samples per Cycle Waveform Recorder V2 V3 V4 V5 V6 P P P P ACCURACY Measured Parameters Accuracy % Display Range Voltage L-N 0.1% 0-9999 Scalable V or kV Voltage L-L 0.2% 0-9999 V or kV Scalable Current 0.1% 0-9999 Amps or kAmps +/- Watts 0.2% 0-9999 Watts, kWatts, MWatts +/-Wh 0.2% 5 to 8 Digits Programmable +/-VARs 0.2% 0-9999 VARs, kVARs, MVARs +/-VARh 0.2% 5 to 8 Digits Programmable VA 0.2% 0-9999 VA, kVA, MVA VAh 0.2% 5 to 8 Digits Programmable PF 0.2% +/- 0.5 to 1.0 Frequency +/- 0.03 Hz 45 to 65 Hz %THD +/- 2.0% 1 to 99.99% % Load Bar +/- 1 Segment (0.005 to 6) A Note: Applies to 3 element WYE and 2 element Delta connections. See full accuracy specifications in Shark® 200 Meter User Manual. Neutral current 2% accuracy. Traceable Watt-Hour Test Pulse for Accuracy Verification The Shark® 200 device is a traceable revenue meter. It contains a utility grade test pulse allowing power providers to verify and confirm that the meter is performing to its rated accuracy. This is an essential feature required of all billing grade meters. • Utility Block and Rolling Average Demand • Historical Load Profiling • Transformer Log Compensation P • CT/PT Compensation SHARK®200 METER EXTENSIVE DATA-LOGGING CAPABILITY (V2 and Higher) The Shark®200 meter offers the capability of having 2 Megabytes of data-logging to be used for historical trends, limit alarms, I/O changes and sequence of events. The unit has a real-time clock that allows for time stamping of all the data in the instrument when log events are created. I/O Change Log • Provides a Time Stamped Log of any Relay Output • Provides a Time Stamped Log of Input Status Changes • 2048 Events Available Limit/Alarm Log Historical Logs • Provides Magnitude and Duration of an Event • 3 Assignable Historical Logs • Independently Program Trending Profiles • Includes Time Stamps and Alarm Value • 2048 Events Available • Up to 64 Parameters per Log System Events Log Historical Trending To protect critical billing information, the meter records and logs the following with a time stamp: • Demand Resets • Password Requests • System Startup • Energy Resets • Log Resets • Log Reads Alarm Log Limits Alarms and Control Capability (V4 Option) Limit Events • Any measured parameter • Up to 16 Limits • Voltage Imbalance • Current Imbalance • Programmable Settings Changes Limit Set Up • Based on % of full scale settings HIGH PERFORMANCE POWER QUALITY ANALYSIS (V5 AND V6) Simultaneous Voltage and Current Waveform Recorder Independent CBEMA Log Plotting The unit records up to 512 samples per cycle for a voltage sag or swell or a current fault event. The unit provides the pre- and postevent recording capability shown in the table below. Waveform records are programmable to the desired sampling rate. V5 provides up to 3 Megabytes storage and V6 provides a total of 4 Megabytes. The meter stores an independent CBEMA log for magnitude and duration of voltage events. This allows a user to quickly view total surges, total sags and duration without retrieving waveform data. The meter's advanced DSP design allows Power Quality triggers to be based on a 1 cycle updated RMS. Up to 170 events can be stored until the memory fills. The meter stores waveform data in a first-in/first-out circular buffer to insure data is always recording. Harmonic Recording to the 40th Order The Shark® 200 meter provides advanced harmonic analysis to the 40th order for each voltage and current channel in real time. Using the stored waveforms, harmonic analysis is available to the 255th order. Optional Waveform Recorder V5 V6 Samples per Cycle Pre Event Cycles 16 32 64 128 256 512 32 16 8 4 2 1 Post Event Cycles 96 48 24 12 6 3 Max Waveform per Event Number of Stored Events 256 128 64 32 16 8 85 85 85 170 170 170 Harmonic Spectrum (40th Order) Waveform Zoomed Note: Sampling rate based on 60Hz systems. For 50Hz systems, multiply by 1.2. Waveform Scope The unit uniquely offers a waveform scope to view the real time waveform for voltage and current. Waveform scope allows the meter to be used as a basic oscilloscope throughout a power system. Waveform Scope Display 6 Channels of Waveforms 3 STANDARD COMMUNICATION CAPABILITY The Shark® 200 meter provides two independent communication ports with advanced features. Rear Mounted Serial Port with KYZ Pulse Front Mounted IrDA Communication Uniquely, the Shark® 200 meter also has an optical IrDA port, allowing you to program it with an IrDA-enabled laptop PC. • R S485 - This port allows RS485 communication using Modbus or DNP 3.0 Protocols. Baud rates are from 9600 to 57.6k. • K YZ Pulse - In addition to the RS485, the meter also includes Pulse Outputs mapped to absolute energy. FIELD EXPANDABLE I/O AND COMMUNICATION CAPABILITIES The Shark® 200 meter offers unequaled I/O expandability. Using the two universal option slots, the unit can easily be configured to accept new I/O cards even after installation. The unit auto-detects installed I/O option cards. Up to 2 cards of any type can be used per meter. 1. INP100S: 100BaseT Ethernet Capability 5. PO1S: Four Pulse Outputs / Four Status Inputs The meter can provide 100BaseT Ethernet functionality. • Programmable to any energy parameter and pulse value Using this card, a user can connect to 12 simultaneous Modbus TCP/IP connections. • Form A: Normally open contacts • Embedded web server •Can function for manual relay control and limit based control (V4-V6 Options) • Also used for End of Interval pulse • Network Time Protocol (NTP) Support • 120mA continuous load current 2. 1mAOS: Four Channel Bi-directional 0-1mA Outputs • Status Inputs - Wet/Dry Auto Detect (Up to 150 VDC) • Assignable to any parameter • 0.1% of full scale 6. FOVPS or FOSTS: Fiber Optic Card • 0 to 10K Ohms •EIG’s exclusive Fiber Optic Daisy Chain switchable built‑in logic mimics RS485 half duplex bus, allowing you to daisy chain meters for lower installation costs. Full duplex is also assignable. • Range +/- 1.20mA 3. 20mAOS: Four Channel 4-20mA Outputs • ST Terminated Option (-FOST) • Assignable to any parameter • Versatile Link Terminated Option (-FOVP) • 0.1% of full scale • Modbus and DNP 3.0 protocols available • 0 to 850 Ohms at 24VDC • Loop Powered using up to 24 Volts DC Meter Auto Detects I/O Card Type 4. RO1S: Two Relay Outputs / Two Status Inputs • 250VAC/30VDC - 5A Relays, Form C • Trigger on user set alarms Simple Field Upgrade • Set delays and reset delays • Status Inputs – Wet / Dry Auto Detect (Up to 150 VDC) •Must be used with V4 or higher V-Switch™ option for limit based alarms and control Field Expandable I/O Slots Note: I/O cards can be ordered separately - see last page. 4 SHARK®200 METER 100BASE T ETHERNET (INP100S) Simultaneous Data Connections Web Server SCADA Meter Reading Software Modbus TCP Modbus TCP Simultaneous Connections to Multiple Software Systems Embedded Web Server 100BaseT Ethernet and Web Server 4.85” [12.32cm] 5.02” [12.75cm] SHARK® 200 METER ANSI AND DIN MOUNTING 4.14” 10.52cm HI HI Ic Ib LO LO 0.62” 1.61cm SHARK® 200T TRANSDUCER Ia HI 3.56” 9.04cm Electro Industries Rapid Response™ Ethernet card allows for high speed Ethernet communication utilizing a 100BaseT protocol communicating with up to 12 connections with Modbus TCP. The card supports a static IP address 4.65" and is treated like a node on4.76" 12.10cm the network. The Shark® [11.81cm] 200 meter provides fast and reliable 4.10" updates to HMI packages, [10.41cm] SCADA and COM EXT download software. The Web Server allows access by almost all browsers over the Internet. The unit mounts directly in an ANSI C39.1 (4” Round form) or an This transducer version of the Shark® 200 meter does not include IEC 92 mm DIN square form. This is perfect for new installations a display. The unit mounts directly to a DIN rail and provides an and for existing panels. In new installations, simply use DIN or RS485 Modbus or DNP 3.0 output and the expandable I/O. ANSI punches. For existing panels, pull out old analog meters and replace them with the Shark® 200 meter. The0.91" meter uses 3.25” 3.25” 2.31cm standard voltage and current PT wiring does8.26cm [8.26cm]inputs so that CT and not need to be replaced. ANSI Mounting LO DIN Mounting 3.38" Sq. 9.20cm 4 X 0.2” 9.20cm 3.56” [9.04cm] 4.0” Shark® 200T - DIN Rail Mounted Transducer American European (One meter fits both standards) 5 TYPICAL SUBSTATION SOLUTIONS SUBSTATION VOLTAGE RECORDING Traditionally, voltage recording meters were relegated to high cost metering or monitoring solutions. The Shark® 200 meter can be placed throughout an electrical distribution network. The meter provides one of the industry's lowest cost methods of collecting voltage information within a Utility power distribution grid. • V oltage reliability analysis insuring proper voltage to customers • C ompare voltage reliability throughout transmission or distribution networks • M onitor the output of substation transformers or line regulators • Initiate conservation voltage reduction, reducing system demand LOAD PROFILING The Shark® 200 meter allows you to log substation data over time with regard to electrical usage, demand, voltage, current, PF and many other parameters. This enables a complete analysis of the power system over time. • Provide revenue accurate load profiling • Determine substation usage • Analyze feeder capacity and utilization • Provide time based load profile for planning one estimation • D ata trend PF distribution and imbalances for system efficiency analysis LOW COST SUBSTATION TELEMETRY The Shark® 200 meter's advanced output capability brings back data using many different communication mediums such as RS485, Ethernet and analog outputs. This insures that one meter can be used for almost every substation application no matter what communication infrastructure is needed. • Perfect for new or retrofit applications • Multiple Com paths • One meter provides outputs for every application • M ultiple systems and/or user accessing data simultaneously 6 SHARK®200 METER DIMENSIONAL DRAWINGS 4.85” 4.76" 12.10cm 5.02” 12.75cm 4.14” 10.57cm 12.32cm 4.85” 4.10" 10.41cm 0.91" 2.31cm 3.25” 8.26cm Shark® 200 Meter Side Shark® 200 Meter Face HI HI HI Ic Ib Ia LO LO LO 0.62” 1.61cm 3.56” 9.04cm 12.32cm 3.25” 8.26cm Shark® 200T Transducer Side 3.56” 3.38" Sq. 9.04cm 3.56" 9.20cm 8.5cm WIRING DIAGRAMS 4.0"dia 10.2cm 3 Phase 4 Wire WYE with PTS 3.56” 9cm 3 Phase 4 Wire WYE Direct 3.56" 9.20cm 0.20"dia 0.5cm 1.69” 4.3cm 3 Phase 3 Wire Delta Direct 3 Phase 3 Wire Delta with PTS 7 Specifications Voltage Inputs • 20-576 Volts Line To Neutral, 0-721 Volts Line to Line • Universal Voltage Input • Input Withstand Capability – Meets IEEE C37.90.1 (Surge Withstand Capability) • Programmable Voltage Range to Any PT ratio • Supports: 3 Element WYE, 2.5 Element WYE, 2 Element Delta, 4 Wire Delta Systems • Burden: Input Impedance 1 Mega Ohms. Burden 0.014W at 120Volts • Input wire gauge max (AWG 12 / 2.5mm2 ) • • • Burden 0.005VA per phase Max at 11Amps Pickup Current: 0.1% of Nominal Class 10: 5mA Class 2: 1mA Pass through wire diameter: 0.177” / 4.5mm Update Rate • Watts, VAR and VA - every 6 cycles • A ll other parameters - every 60 cycles Power Supply Option D2: • (90 to 265) Volts AC and (100 to 370) Volts DC. Universal AC/DC Supply Isolation All Inputs and Outputs are galvanically isolated to 2500 Volts Option: D: • ( 18-60) Volts DC (24-48 VDC Systems) Burden: 10VA Max Environmental Rating Storage: (-20 to +70)° C Operating: (-20 to +70)° C Humidity: to 95% RH Non-Condensing Faceplate Rating: NEMA12 (Water Resistant) Mounting Gasket Included Current Inputs • Class 10: (0.005 to 11) A, 5 Amp Nominal • Class 2: (0.001 to 2) A, 1A Nominal Secondary • Fault Current Withstand (at 23°C): 100 Amps for 10 Seconds, 300 Amps for 3 Seconds, 500 Amps for 1 Second • Continuous current withstand: 20 Amps for Screw Terminated or Pass Through Connections • Programmable Current to Any CT Ratio Standard Communication Format • 2 Com Ports (Back and Face Plate) • RS485 Port (Through Back Plate) • IrDA (Through Faceplate) • Com Port Baud Rate: (9,600 - 57,600) • Com Port Address: 1-247 • 8 Bit, No parity • Modbus RTU, ASCII or DNP 3.0 Protocols Sensing Method • True RMS • Sampling at over 400 samples / cycle on all channels of measured readings simultaneously • Harmonics resolution to 40th order • Waveform up to 512 samples/cycle KYZ Pulse • Type Form C Contact • On Resistance: 35 Ohms Max • Peak Voltage: 350 VDC • Continuous Load Current: 120mA • Peak Load Current: 350mA (10ms) • O ff State Leakage Current@ 350VDC: 1uA Dimensions and Shipping • Weight: 2 lbs • Basic Unit: H4.85 x W4.85 x L4.65 • S hark® 200 meter mounts in 92mm DIN & ANSI C39.1 Round Cut-outs • S hark® 200T Transducer DIN rail mounted • 2-inch DIN Rail Included • S hipping Container Dimensions: 6” cube Meter Accuracy • See page 2 • N ote: For 2.5 element programmed units, degrade accuracy by an additional 0.5% of reading. Compliance: • IEC 687 (0.2% Accuracy) • ANSI C12.20 (0.2% Accuracy) • ANSI (IEEE) C37.90.1 Surge Withstand • ANSI C62.41 (Burst) • IEC1000-4-2 – ESD • IEC1000-4-3 – Radiated Immunity • IEC 1000-4-4 – Fast Transient • IEC 1000-4-5 – Surge Immunity Ordering Information All fields must be filled in to create a valid part number. Frequency Model Option Numbers: Example: Shark200 - Shark200 (Meter/Transducer) Shark200T (Transducer Only) 60 Current Input - - 10 Power Supply V-Switch Pack V2 50 50 Hz System 10 10 Amp Secondary V1 Multifunction Meter Only 60 60 Hz System 2 2 Amp Secondary V2 Standard DataLogging Memory - Additional Accessories V3 Power Quality Harmonics Communication Converters V4 Limits & Control 9PINC – RS232 Cable D2 D2 90-265V AC/DC D 18-60V DC V5 64 Samples/cycle Waveform Recording CAB6490 - USB to IrDA Adapter Unicom 2500 - RS485 to RS232 Converter Unicom 2500-F – RS485 to RS232 to Fiber Optic Converter V6 512 Samples/cycle Waveform Recording Modem Manager, Model #, MM1 – RS485 to RS232 Converter for Modem Communication IrDA232 - IrDA to RS232 Adapter for Remote Read Compliance Documents Certificate of Calibration, Part #: CCal – This provides Certificate of Calibration with NIST traceable Test Data. Current Transformer Kits CT200K – 200/5 Ratio 1.00” Window 3 CTs CT400K – 400/5 Ratio, 1.25” Window, 3 CTs CT800K – 800/5 Ratio, 2.06” Window, 3 CTs CT2000K – 2000/5 Ratio, 3.00” Window, 3 CTs CT Specifications: Frequency: 50 to 400Hz; Insulation: 600 Volts, 10kV BIL Flexible Leads: UL 1015 105°C, CSA Approved, 24” Long, #16AWG Software Option Numbers COMEXT3 – CommunicatorEXT 3.0 for Windows® * Consult factory application engineer for additional transformer ratios, types or window sizes. I/O Slot 1* - INP100S I/O Slot 2* - X X None X None RO1S 2 Relays / 2 Status RO1S 2 Relays / 2 Status PO1S 4 Pulses / 4 Status PO1S 4 Pulses / 4 Status 1mAOS 4 channel Analog Output 0-1 (bidirectional) 1mAOS 4 channel Analog Output 0-1 (bidirectional) 20mAOS 4 Channel Analog Output 4-20mA 20mAOS 4 Channel Analog Output 4-20mA FOSTS Fiber Optic Output ST Terminated FOSTS Fiber Optic Output ST Terminated FOVPS Fiber Optic Output VPIN Terminated FOVPS Fiber Optic Output VPIN Terminated INP100S 100BaseT Ethernet INP100S 100BaseT Ethernet * I/O cards can be ordered separately using the above part numbers. Electro Industries/GaugeTech 1800 Shames Drive • Westbury, NY 11590 1- 877-EIMETER (1- 877-346-3837) • E-Mail: [email protected] Tel: 516-334-0870 • Web Site: www.electroind.com • Fax: 516-338-4741 8 E 149702 032311 O ® UNION INCA30xx and INCA40xx Instruments Process gas analyzer for the measurement of biogas, biomethane, landfill gas and sewage gas Version: V0.11R02 Dok-ID: WM-0007 UNION Instruments GmbH Tel. +49 (0) 721 9 52 43-0 Fax +49 (0) 721 9 52 43-33 [email protected] www.union-instruments.com Explanations on T-Model and Housing The INCA process gas analyzer is composed of a housing and a base plate (T-Model). 2 Housing T-Model indicates the type of gas conditioning, like e.g. gas drying and switching of measuring points. indicates the sensor system and with it the gas types and concentrations which are to be measured. INCA3011 _ _ _-04 T100 Device INCA3011 T100-04 INCA3011 Txxx-0x Multi-channel measuring device for condensate-free gases with flexible measuring ranges 3 INCA3011 Txxx-0x Matrix T-Models - Discontinuously measuring Component CH4 CO2 H2S H2S H2S H2S O2 O2 H2 +µPulse +µPulse (Chemical) (Paramagnetic) discontinuously discontinuously discontinuously discontinuously discontinuously discontinuously discontinuously discontinuously discontinuously Measurement range Vol% Vol% ppm ppm ppm ppm Vol% Vol% ppm Measurement accuracy ± 1% FS¹ ± 1% FS¹ ± 3 ppm ± 60 ppm ± 3 ppm (≤ 25 ppm) ± 5 ppm (≤ 25 ppm) ± 1% FS¹ ± 1% FS¹ ± 5% FS¹ ± 15% MV² > 25 ppm ± 15% MV² > 25 ppm T060 - - 100 - - - - - 4000 T062 - - 100 - - - - - - T096 - - - - 10000 - - - - T098 100 - - - 10000 - 25 - - T100 100 100 - - 10000 - 25 - - T140 100 100 - - 10000 - 25 - 4000 T160 100 100 - - 50000 25 - - 3 Matrix T-Models - Continuously measuring Component CH4 CO2 continuously H2S continuously H2S H2S H2S O2 O2 H2 +µPulse +µPulse (Chemical) (Paramagnetic) discontinuously discontinuously discontinuously discontinuously discontinuously discontinuously discontinuously Measurement range Vol% Vol% ppm ppm ppm ppm Vol% Vol% ppm Measurement accuracy ± 1% FS¹ ± 1% FS¹ ± 3 ppm ± 60 ppm ± 3 ppm (≤ 25 ppm) ± 5ppm (≤ 25 ppm) ± 1% FS¹ ± 1% FS¹ ± 5% FS¹ ± 15% MV² > 25 ppm ± 15% MV² > 25 ppm - - 25 - 4000 T137 100 10 100 - 3 Matrix T-Models - Continuously measuring Component CH4 CO2 continuously H2S continuously H2S H2S +µPulse +µPulse discontinuously discontinuously discontinuously discontinuously O2 O2 H2 (Chemical) continuously (Paramagnetic) continuously discontinuously Measurement range Vol% Vol% ppm ppm ppm ppm Vol% Vol% ppm Measurement accuracy ± 1% FS¹ ± 1% FS¹ ± 3 ppm ± 60 ppm ± 3 ppm (≤ 25 ppm) ± 5 ppm (≤ 25 ppm) ± 1% FS¹ ± 1% FS¹ ± 5% FS¹ ± 15% MV² > 25 ppm ± 15% MV² > 25 ppm T045 - - - - - - - 25 - T051 - 100 - - - - - - - T053 - 10 - - - - - - - T095 100 100 - - - - 25 - - T101 100 100 - - 10000 - 25 - - T107 100 - - - - - - - - T113 - - - - - - 25 - - T127 100 100 - 2000 - - - 5 4000 T141 100 100 - 10000 - - 25 - 4000 ¹ FS = Linearity error relative to full scale value ² MV = Linearity error relative to measured value 3 Only for one measuring point 4 H2S Specification INCA3011 Txxx-0x INCA3011 Txxx-0x for indoor installation Consisting of: aluminium housing, power supply, controller display, electrical interface, pumps, control valves Dimensions (WxHxD) Weight Protection class Power supply 640x600x229 mm 21 kg IP42 100–240 V, 50/60 Hz Gas inlets Sample gas inlets Calibration gas inlets Purge gas inlets Gas connections Max. gas inlet pressure Min. gas inlet pressure Flame arrester Rel. gas humidity Condensate trap 1–4 1 1 Compression fitting 6 mm 20 mbar rel. (optionally 300 mbar) -100 mbar rel. ATEX certification G IIC < 95 % condensate-free Yes Ambient conditions Operating temperature Humidity Atmospheric pressure 5–40 °C 0–95 % relative humidity 900–1250 hPa (0,9–1,2 bar) Storage temperature 0–60 °C Interfaces Relays 3 Communication Interface RS232 5 INCA3021 Txxx-0x Multi-channel measuring device for condensate-free gases with flexible measuring ranges and two calibration gas inlets 6 INCA3021 Txxx-0x Matrix T-Models - Discontinuously measuring Component CH4 CO2 H2S H2S H2S H2S O2 O2 H2 +µPulse +µPulse (Chemical) (Paramagnetic) discontinuously discontinuously discontinuously discontinuously discontinuously discontinuously discontinuously discontinuously discontinuously Measurement range Vol% Vol% ppm ppm ppm ppm Vol% Vol% ppm Measurement accuracy ± 1% FS¹ ± 1% FS¹ ± 3 ppm ± 60 ppm ± 3 ppm (≤ 25 ppm) ± 5 ppm (≤ 25 ppm) ± 1% FS¹ ± 1% FS¹ ± 5% FS¹ ± 15% MV² > 25 ppm ± 15% MV² > 25 ppm T060 - - 100 - - - - - 4000 T062 - - 100 - - - - - - T096 - - - - 10000 - - - - T098 100 - - - 10000 - 25 - - T100 100 100 - - 10000 - 25 - - T140 100 100 - - 10000 - 25 - 4000 T160 100 100 - - 50000 25 - - 3 Matrix T-Models - Continuously measuring Component CH4 CO2 continuously H2S continuously H2S H2S H2S O2 O2 H2 +µPulse +µPulse (Chemical) (Paramagnetic) discontinuously discontinuously discontinuously discontinuously discontinuously discontinuously discontinuously Measurement range Vol% Vol% ppm ppm ppm ppm Vol% Vol% ppm Measurement accuracy ± 1% FS¹ ± 1% FS¹ ± 3 ppm ± 60 ppm ± 3 ppm (≤ 25 ppm) ± 5ppm (≤ 25 ppm) ± 1% FS¹ ± 1% FS¹ ± 5% FS¹ ± 15% MV² > 25 ppm ± 15% MV² > 25 ppm - - 25 - 4000 T137 100 10 100 - 3 Matrix T-Models - Continuously measuring Component CH4 CO2 continuously H2S continuously H2S H2S H2S +µPulse +µPulse discontinuously discontinuously discontinuously discontinuously O2 O2 H2 (Chemical) continuously (Paramagnetic) continuously discontinuously Measurement range Vol% Vol% ppm ppm ppm ppm Vol% Vol% ppm Measurement accuracy ± 1% FS¹ ± 1% FS¹ ± 3 ppm ± 60 ppm ± 3 ppm (≤ 25 ppm) ± 5 ppm (≤ 25 ppm) ± 1% FS¹ ± 1% FS¹ ± 5% FS¹ ± 15% MV² > 25 ppm ± 15% MV² > 25 ppm T045 - - - - - - - 25 - T051 - 100 - - - - - - - T053 - 10 - - - - - - - T095 100 100 - - - - 25 - - T101 100 100 - - 10000 - 25 - - T107 100 - - - - - - - - T113 - - - - - - 25 - - T127 100 100 - 2000 - - - 5 4000 T141 100 100 - 10000 - - 25 - 4000 ¹ FS = Linearity error relative to full scale value ² MV = Linearity error relative to measured value 3 Only for one measuring point 7 Specification INCA3021 Txxx-0x INCA3021 Txxx-0x for indoor installation Consisting of: aluminium housing, power supply, controller display, electrical interface, pumps, control valves Dimensions (WxHxD) Weight Protection class Power supply 640x600x229 mm 21 kg IP42 100–240 V, 50/60 Hz Gas inlets Sample gas inlets Calibration gas inlets Purge gas inlets Gas connections Max. gas inlet pressure Min. gas inlet pressure Flame arrester Rel. gas humidity Condensate trap 1–3 2 1 Compression fitting 6 mm 20 mbar rel. (optionally 300 mbar) -100 mbar rel. ATEX certification G IIC < 95 % condensate-free Yes Ambient conditions Operating temperature Humidity Atmospheric pressure 5–40 °C 0–95 % relative humidity 900–1250 hPa (0,9–1,2 bar) Storage temperature 0–60 °C Interfaces Relays 3 Communication Interface RS232 8 INCA4001 Txxx-xx Multi-channel measuring device for condensate-carrying gases with sample gas cooler and flexible measuring ranges. Measuring point switching with pneumatic valves 9 INCA4001 Txxx-xx Matrix T-Models - Discontinuously measuring Component CH4 CO2 H2S H2S H2S H2S O2 O2 H2 +µPulse +µPulse (Chemical) (Paramagnetic) discontinuously discontinuously discontinuously discontinuously discontinuously discontinuously discontinuously discontinuously discontinuously Measurement range Vol% Vol% ppm ppm ppm ppm Vol% Vol% ppm Measurement accuracy ± 1% FS¹ ± 1% FS¹ ± 3 ppm ± 60 ppm ± 3 ppm (≤ 25 ppm) ± 5 ppm (≤ 25 ppm) ± 1% FS¹ ± 1% FS¹ ± 5% FS¹ ± 15% MV² > 25 ppm ± 15% MV² > 25 ppm T060 - - 100 - - - - - 4000 T062 - - 100 - - - - - - T096 - - - - 10000 - - - - T098 100 - - - 10000 - 25 - - T100 100 100 - - 10000 - 25 - - T140 100 100 - - 10000 - 25 - 4000 T160 100 100 - - 50000 25 - - ¹ FS = Linearity error relative to full scale value ² MV = Linearity error relative to measured value 10 Specification INCA4001 Txxx-xx INCA4001 Txxx-xx for indoor installation Consisting of: aluminium housing, power supply, controller display, electrical interface, pumps, control valves Dimensions (WxHxD) Weight Protection class Power supply 741x600x214 mm 29 kg IP42 100–240 V, 50/60 Hz Gas inlets Sample gas inlets Calibration gas inlets Purge gas inlets Gas connections Max. gas inlet pressure Min. gas inlet pressure Flame arrester Rel. gas humidity Condensate trap 1–10 1 1 Compression fitting 6 mm 20 mbar rel. (opitionally 300 mbar) -100 mbar rel. ATEX certification G IIC ≤ 100% (condensate possible) Yes Sample gas cooler Cooling principle Dewpoint Condensate removal thermoelectric 3–30 °C adjustable Vacuum jet pump Pneumatics Control pressure Compressor 6–8 bar (87–116 psi) 10 l Ambient conditions Operating temperature Humidity Atmospheric pressure 5–40 °C 0–95 % relative humidity 900–1250 hPa (0,9–1,2 bar) Storage temperature 0–60 °C Interfaces Relays 3 Communication Interface RS232 11 INCA4002 Txxx-01 Single-channel measuring device for condensate-carrying gases with sample gas cooler and flexible measuring ranges 12 INCA4002 Txxx-01 Matrix T-Models - Discontinuously measuring Component CH4 CO2 H2S H2S H2S H2S O2 O2 H2 +µPulse +µPulse (Chemical) (Paramagnetic) discontinuously discontinuously discontinuously discontinuously discontinuously discontinuously discontinuously discontinuously discontinuously Measurement range Vol% Vol% ppm ppm ppm ppm Vol% Vol% ppm Measurement accuracy ± 1% FS¹ ± 1% FS¹ ± 3 ppm ± 60 ppm ± 3 ppm (≤ 25 ppm) ± 5 ppm (≤ 25 ppm) ± 1% FS¹ ± 1% FS¹ ± 5% FS¹ ± 15% MV² > 25 ppm ± 15% MV² > 25 ppm T060 - - 100 - - - - - 4000 T062 - - 100 - - - - - - T096 - - - - 10000 - - - - T098 100 - - - 10000 - 25 - - T100 100 100 - - 10000 - 25 - - T140 100 100 - - 10000 - 25 - 4000 T160 100 100 - - 50000 25 - - 3 Matrix T-Models - Continuously measuring Component CH4 CO2 continuously H2S continuously H2S H2S H2S O2 O2 H2 +µPulse +µPulse (Chemical) (Paramagnetic) discontinuously discontinuously discontinuously discontinuously discontinuously discontinuously discontinuously Measurement range Vol% Vol% ppm ppm ppm ppm Vol% Vol% ppm Measurement accuracy ± 1% FS¹ ± 1% FS¹ ± 3 ppm ± 60 ppm ± 3 ppm (≤ 25 ppm) ± 5ppm (≤ 25 ppm) ± 1% FS¹ ± 1% FS¹ ± 5% FS¹ ± 15% MV² > 25 ppm ± 15% MV² > 25 ppm - - 25 - 4000 T137 100 10 100 - 3 Matrix T-Models - Continuously measuring Component CH4 CO2 continuously H2S continuously H2S H2S H2S +µPulse +µPulse discontinuously discontinuously discontinuously discontinuously O2 O2 H2 (Chemical) continuously (Paramagnetic) continuously discontinuously Measurement range Vol% Vol% ppm ppm ppm ppm Vol% Vol% ppm Measurement accuracy ± 1% FS¹ ± 1% FS¹ ± 3 ppm ± 60 ppm ± 3 ppm (≤ 25 ppm) ± 5 ppm (≤ 25 ppm) ± 1% FS¹ ± 1% FS¹ ± 5% FS¹ ± 15% MV² > 25 ppm ± 15% MV² > 25 ppm T045 - - - - - - - 25 - T051 - 100 - - - - - - - T053 - 10 - - - - - - - T095 100 100 - - - - 25 - - T101 100 100 - - 10000 - 25 - - T107 100 - - - - - - - - T113 - - - - - - 25 - - T127 100 100 - 2000 - - - 5 4000 T141 100 100 - 10000 - - 25 - 4000 ¹ FS = Linearity error relative to full scale value ² MV = Linearity error relative to measured value 3 Only for one measuring point 13 Specification INCA4002 Txxx-01 INCA4002 Txxx-01 for indoor installation Consisting of: aluminium housing, power supply, controller display, electrical interface, pumps, control valves Dimensions (WxHxD) Weight Protection class Power supply 741,5x600x212 mm 29 kg IP42 100–240 V, 50/60 Hz Gas inlets Sample gas inlets Calibration gas inlets Purge gas inlets Gas connections Max. gas inlet pressure Min. gas inlet pressure Flame arrester Rel. gas humidity Condensate trap 1 1 1 Compression fitting 6 mm 20 mbar rel. -100 mbar rel. ATEX certification G IIC ≤ 100 % (condensate possible) Yes Sample gas cooler Cooling principle Dewpoint Condensate removal thermoelectric 3–30 °C adjustable Hose pump Ambient conditions Operating temperature Humidity Atmospheric pressure 5–40 °C 0–95 % relative humidity 900–1250 hPa (0,9–1,2 bar) Storage temperature 0–60 °C Interfaces Relays 3 Communication Interface RS232 14 INCA4002 Txxx-0x(0x) Multi-channel measuring device - 1 channel with sample gas cooler - up to 3 channels for condensate-free gases 15 INCA4002 Txxx-0x(0x) Matrix T-Models - Discontinuously measuring Component CH4 CO2 H2S H2S H2S H2S O2 O2 H2 +µPulse +µPulse (Chemical) (Paramagnetic) discontinuously discontinuously discontinuously discontinuously discontinuously discontinuously discontinuously discontinuously discontinuously Measurement range Vol% Vol% ppm ppm ppm ppm Vol% Vol% ppm Measurement accuracy ± 1% FS¹ ± 1% FS¹ ± 3 ppm ± 60 ppm ± 3 ppm (≤ 25 ppm) ± 5 ppm (≤ 25 ppm) ± 1% FS¹ ± 1% FS¹ ± 5% FS¹ ± 15% MV² > 25 ppm ± 15% MV² > 25 ppm T060 - - 100 - - - - - 4000 T062 - - 100 - - - - - - T096 - - - - 10000 - - - - T098 100 - - - 10000 - 25 - - T100 100 100 - - 10000 - 25 - - T140 100 100 - - 10000 - 25 - 4000 T160 100 100 - - 50000 25 - - ¹ FS = Linearity error relative to full scale value ² MV = Linearity error relative to measured value Specification INCA4002 Txxx-0x(0x) Consisting of: aluminium housing, power supply, controller display, electrical interface, pumps, control valves 16 Dimensions (WxHxD) Weight Protection class Power supply 741,5x600x212 mm 29 kg IP42 100–240 V, 50/60 Hz Gas inlets Sample gas inlets I Sample gas inlets II Calibration gas inlets Purge gas inlets Gas connections Max. gas inlet pressure Min. gas inlet pressure Flame arrester Condensate trap 1 (cooled inlet, condensate possible) 1–3 (condensate free) 1 1 Compression fitting 6 mm 20 mbar rel. -100 mbar rel. ATEX certification G IIC Yes Sample gas cooler Cooling principle Dewpoint Condensate removal thermoelectric 3–30 °C adjustable Hose pump Ambient conditions Operating temperature Humidity Atmospheric pressure 5–40 °C 0–95 % relative humidity 900–1250 hPa (0,9–1,2 bar) Storage temperature 0–60 °C Interfaces Relays 3 Communication Interface RS232 INCA4003 Txxx-0x Multi-channel measuring device for condensate-carrying gases with sample gas cooler and flexible measuring ranges. Measuring point switching with electrical ball valve 17 INCA4003 Txxx-0x Matrix T-Models - Discontinuously measuring Component CH4 CO2 H2S H2S H2S H2S O2 O2 H2 +µPulse +µPulse (Chemical) (Paramagnetic) discontinuously discontinuously discontinuously discontinuously discontinuously discontinuously discontinuously discontinuously discontinuously Measurement range Vol% Vol% ppm ppm ppm ppm Vol% Vol% ppm Measurement accuracy ± 1% FS¹ ± 1% FS¹ ± 3 ppm ± 60 ppm ± 3 ppm (≤ 25 ppm) ± 5 ppm (≤ 25 ppm) ± 1% FS¹ ± 1% FS¹ ± 5% FS¹ ± 15% MV² > 25 ppm ± 15% MV² > 25 ppm T060 - - 100 - - - - - 4000 T062 - - 100 - - - - - - T096 - - - - 10000 - - - - T098 100 - - - 10000 - 25 - - T100 100 100 - - 10000 - 25 - - T140 100 100 - - 10000 - 25 - 4000 T160 100 100 - - 50000 25 - - ¹ FS = Linearity error relative to full scale value ² MV = Linearity error relative to measured value 18 Specification INCA4003 Txxx-0x INCA4003 Txxx-0x for indoor installation Consisting of: aluminium housing, power supply, controller display, electrical interface, pumps, control valves Dimensions (WxHxD) Weight Protection class Power supply 740x600x212 mm 29 kg IP42 100–240 V, 50/60 Hz Gas inlets Sample gas inlets Calibration gas inlets Purge gas inlets Gas connections Max. gas inlet pressure Min. gas inlet pressure Flame arrester Rel. gas humidity Condensate trap 1–4 1 1 Compression fitting 6 mm 20 mbar rel. -100 mbar rel. ATEX certification G IIC ≤ 100% (condensate possible) Yes Sample gas cooler Cooling principle Dewpoint Condensate removal thermoelectric 3–30 °C adjustable Hose pump Ambient conditions Operating temperature Humidity Atmospheric pressure 5–40 °C 0–95 % relative humidity 900–1250 hPa (0,9–1,2 bar) Storage temperature 0–60 °C Interfaces Relays 3 Communication Interface RS232 19 ® UNION Instruments UNION Instruments GmbH Zeppelinstraße 42 76185 Karlsruhe Germany Tel. +49 (0) 721 9 52 43-0 Fax +49 (0) 721 9 52 43-33 [email protected] www.union-instruments.com QA/QC Plan Addendum Lawnhurst Farms QA/QC Plan Addendum - Lawnhurst Farms 4124 County Route 5 Stanley, NY 14561 Site Contact Don Jensen III Lawnhurst Farms, LLC 585-738-9403 [email protected] Steve McGlynn Envitec 585-802-0174 [email protected] CDH was on site October 7, 2014 to verify metering and complete the sites Project Installation Report (PIR) Summary Data is collected by Envitec’s control system and made available to CDH to download via FTP. Multiple data files are made daily, and consist of data in varying time stamps. Data Point WG FG H2S O2 CH4 TD PD FLARE WG_ACC WG_d WG_KW_d Data File Messwerte Protokollierung Messwerte Messwerte Messwerte Messwerte Messwerte Protokollierung Protokollierung Protokollierung Messwerte CDH Energy Corp. Description Energy Generated Biogas to Engine Hydrogen Sulfide in Biogas Oxygen in Biogas Methane in Biogas Digester Temperature Digester Pressure Flare Runtime Energy generated - Accumulated Energy Generated - Shark 200 Meter Power Generated - Shark 200 Meter A-1 Eng Units kW cfh ppm % % F bar Minutes kWh kWh kW Instrument / Transducer Jenbacher DIA.NE XT3 Engine Controller Roots Rotary Gas Meter - B4 G250 INCA 4001 Gas Analyzer INCA 4001 Gas Analyzer INCA 4001 Gas Analyzer Jenbacher DIA.NE XT3 Engine Controller Shark 200 Power Meter Shark 200 Power Meter October 2014 QA/QC Plan Addendum Lawnhurst Farms Procedure Generator power was verified by comparing collected data from the DIA.NE XT3 engine controller to data from the Shark 200 revenue grade power meter. Gas data was verified by timing the face of the gas meter to determine the gas flow rate. The calculated gas flow rate and the generator power output were then used to calculate the engines electrical efficiency. Generator Power 9/1/2014 9/2/2014 9/3/2014 9/4/2014 9/5/2014 9/6/2014 9/7/2014 9/8/2014 9/9/2014 9/10/2014 9/11/2014 9/12/2014 9/13/2014 9/14/2014 9/15/2014 9/16/2014 9/17/2014 9/18/2014 9/19/2014 9/20/2014 9/21/2014 9/22/2014 9/23/2014 9/24/2014 9/25/2014 9/26/2014 9/27/2014 9/28/2014 9/29/2014 9/30/2014 Shark 200 DIA.NE XT3 Daily kWh Daily kWh 12,578.9 12,500.0 12,352.1 12,300.0 11,878.8 11,800.0 11,782.6 11,700.0 12,042.3 11,900.0 12,707.2 12,600.0 13,097.1 13,000.0 12,855.3 12,700.0 10,395.9 10,300.0 13,075.4 13,000.0 13,107.1 12,900.0 13,107.6 13,000.0 13,098.8 13,000.0 12,184.2 12,100.0 12,588.9 12,500.0 12,473.4 12,400.0 10,461.7 10,400.0 12,803.0 12,700.0 13,045.4 12,900.0 13,006.2 13,000.0 12,818.1 12,700.0 11,558.0 11,400.0 12,992.4 12,900.0 13,027.2 13,000.0 13,092.5 12,900.0 13,065.0 13,000.0 12,560.7 12,500.0 12,021.7 11,900.0 12,452.6 12,400.0 12,997.1 12,900.0 Diff. % 0.6% 0.4% 0.7% 0.7% 1.2% 0.8% 0.7% 1.2% 0.9% 0.6% 1.6% 0.8% 0.8% 0.7% 0.7% 0.6% 0.6% 0.8% 1.1% 0.0% 0.9% 1.4% 0.7% 0.2% 1.5% 0.5% 0.5% 1.0% 0.4% 0.7% Avg: CDH Energy Corp. 0.8% A-2 October 2014 QA/QC Plan Addendum Lawnhurst Farms Biogas H2S H2S Analyzer Draeger Tube (PPM) (PPM) 250 475 250 50 250 400 Biogas Flow Roots Reading (m^3) 11:01 2893023 11:16 2893102 79 316 11,159 m^3/15-min m^3/hr cfh 540 578 Generator kW Btu/cf 28.6% Generator Eff. CDH Energy Corp. A-3 October 2014