1
Project Number: KGP-0109
DESIGN OF A WEARABLE BALANCE CONTROL INDICATOR
A Major Qualifying Project Report:
Submitted to the Faculty
Of the
WORCESTER POLYTECHNIC INSTITUTE
In partial fulfillment of the requirements for the
Degree of Bachelor of Science
by
Amanda Martori
Elizabeth Tuite
Kevin Goggins
April 29, 2010
Approved:
___________________________________
Professor Krystyna Gielo Perczak, Major Advisor
___________________________________
Professor Yitzhak Mendelson, Co-Advisor
1
Table of Contents
AUTHORSHIP PAGE ....................................................................................................................................... 5
ACKNOWLEDGEMENTS ................................................................................................................................. 8
ABSTRACT...................................................................................................................................................... 9
TABLE OF FIGURES ...................................................................................................................................... 10
TABLE OF TABLES ........................................................................................................................................ 13
EXECUTIVE SUMMARY ................................................................................................................................ 14
1
INTRODUCTION ................................................................................................................................... 16
2
LITERATURE REVIEW ........................................................................................................................... 18
2.1
UNDERSTANDING BALANCE CONTROL ....................................................................................... 18
2.1.1
Basics of Balance ................................................................................................................. 18
2.1.2
Human Balance Control and the Inverted Pendulum Model ............................................. 20
2.1.3
Maintaining Balance during Perturbation........................................................................... 22
2.1.4
Example of Balance Control: Balancing a Pencil ................................................................. 25
2.2
RISK FACTORS OF FALLING .......................................................................................................... 26
2.3
REDUCING THE NEGATIVE EFFECTS OF FALLS............................................................................. 31
2.3.1
Improving Balance Control.................................................................................................. 31
2.3.2
Fall Detection Patents ......................................................................................................... 33
2.3.3
Current Fall Detection Technology ..................................................................................... 41
2.3.4
Limitations of Current Technology...................................................................................... 46
2.4
2.4.1
Vibrotactile Based Patents .................................................................................................. 47
2.4.2
Current Devices for Assessing Balance Control .................................................................. 52
2.5
3
METHODS FOR ASSESSING BALANCE CONTROL ........................................................................ 47
PROACTIVELY MONITORING BALANCE CONTROL ...................................................................... 55
2.5.1
Accelerometry ..................................................................................................................... 55
2.5.2
Gyroscopes .......................................................................................................................... 58
2.5.3
Strain Gauges and Pressure Transducers ........................................................................... 59
2.5.4
Motion Analysis................................................................................................................... 60
2.5.5
Advantages and Disadvantages of Current Balance Monitoring Methods ......................... 61
PROJECT STRATEGY ............................................................................................................................. 63
3.1
CLARIFYING THE ORIGINAL PROBLEM STATEMENT.................................................................... 63
2
4
3.2
OBJECTIVES & CONSTRAINTS ...................................................................................................... 66
3.3
REVISED PROBLEM STATEMENT ................................................................................................. 68
3.4
PROJECT APPROACH ................................................................................................................... 69
ALTERNATIVE DESIGNS ....................................................................................................................... 71
4.1
Preliminary designs ..................................................................................................................... 71
4.1.1
Preliminary Design 1: Shoe Insole ....................................................................................... 71
4.1.2
Preliminary Design 2: Waist-mounted Accelerometer ....................................................... 73
4.1.3
Preliminary Design 3: Ankle Brace Accelerometer/Gyroscope........................................... 75
4.1.4
Preliminary Design 4: V-Tact Belt........................................................................................ 78
4.2
NEEDS ANALYSIS ......................................................................................................................... 79
4.2.1
4.3
FUNCTIONS AND SPECIFICATIONS .............................................................................................. 85
4.3.1
Choosing the Activity .......................................................................................................... 87
4.3.2
Choosing the Signal and Sensor .......................................................................................... 90
4.3.3
Choosing the Location......................................................................................................... 93
4.3.4
Choosing the Method of Analyzing Acceleration Data ....................................................... 95
4.3.5
Final Solution....................................................................................................................... 98
4.4
PRELIMINARY EXPERIMENTS ...................................................................................................... 98
4.4.1
Materials and method........................................................................................................ 99
4.4.2
Results of Preliminary Testing ........................................................................................... 103
4.4.3
Conclusions of Preliminary Results ................................................................................... 107
4.5
5
Rank-ordering Design Objectives ........................................................................................ 79
Conceptual design ..................................................................................................................... 108
FINAL DESIGN .................................................................................................................................... 120
5.1
OVERVIEW OF FINAL DESIGN .................................................................................................... 120
5.2
DESIGN COMPONENTS.............................................................................................................. 121
5.3
BUILDING THE DEVICE............................................................................................................... 126
5.4
PROGRAMMING THE DEVICE .................................................................................................... 132
6
DESIGN VERIFICATION ...................................................................................................................... 137
7
DISCUSSION....................................................................................................................................... 142
8
DESIGN VALIDATION ......................................................................................................................... 148
8.1
PRELIMINARY TESTING WITH ELDERLY SUBJECTS .................................................................... 148
8.1.1
Materials and Methods ..................................................................................................... 148
3
9
8.1.2
Determine the Difference Between Balanced and Unbalanced STS ................................ 152
8.1.3
Verify the device ............................................................................................................... 153
CONCLUSIONS AND FUTURE RECOMMENDATIONS ......................................................................... 155
GLOSSARY.................................................................................................................................................. 157
REFERENCES .............................................................................................................................................. 159
Appendix A: ADXL 345 Data Sheet ............................................................................................................. A1
APPENDIX B: KinetaMap User Manual........................................................................................................ B1
APPENDIX C: Client Interviews .................................................................................................................... C1
APPENDIX D: Data from Preliminary Testing ..............................................................................................D1
APPENDIX E: Center of Pressure Data from Preliminary Testing ................................................................ E1
APPENDIX F: Acceleration Plots from Preliminary Testing ......................................................................... F1
APPENDIX G: Data from Device Verification .............................................................................................. G1
APPENDIX H: Code for Device .................................................................................................................... H1
APPENDIX I: Abstract Accepted to Northeast Bioengineering Conference ................................................. I1
APPENDIX J: Conversions of accekeration data ........................................................................................... J1
APPENDIX K: IRB APPROVAL ....................................................................................................................... K1
4
AUTHORSHIP PAGE
ABSTRACT-LT
EXECUTIVE SUMMARY
1
INTRODUCTION-LT
2
LITERATURE REVIEW
2.1
2.1.1
Basics of Balance-LT
2.1.2
Human Balance Control and the Inverted Pendulum Model-LT
2.1.3
Maintaining Balance during Perturbation-LT & AM
2.1.4
Example of Balance Control: Balancing a Pencil-LT
2.2
RISK FACTORS OF FALLING-AM
2.3
REDUCING THE NEGATIVE EFFECTS OF FALLS-AM
2.4
2.5
3
UNDERSTANDING BALANCE CONTROL-LT
2.3.1
Improving Balance Control-AM
2.3.2
Fall Detection Patents-AM
2.3.3
Current Fall Detection Technology-AM
2.3.4
Limitations of Current Technology-AM
METHODS FOR ASSESSING BALANCE CONTROL-AM
2.4.1
Vibrotactile Based Patents-AM
2.4.2
Current Devices for Assessing Balance Control-AM & LT
PROACTIVELY MONITORING BALANCE CONTROL-AM
2.5.1
Accelerometry-KG, AM, LT
2.5.2
Gyroscopes-KG & LT
2.5.3
Strain Gauges and Pressure Transducers-KG <
2.5.4
Motion Analysis-AM
2.5.5
Advantages and Disadvantages of Current Balance Monitoring Methods-LT
PROJECT STRATEGY-LT
3.1
CLARIFYING THE ORIGINAL PROBLEM STATEMENT-LT
3.2
OBJECTIVES & CONSTRAINTS-LT
5
4
3.3
REVISED PROBLEM STATEMENT-LT
3.4
PROJECT APPROACH-LT
ALTERNATIVE DESIGNS-LT
4.1
4.2
PRELIMINARY DESIGNS-LT
4.1.1
Preliminary Design 1: Shoe Insole-KG
4.1.2
Preliminary Design 2: Waist-mounted Accelerometer-KG
4.1.3
Preliminary Design 3: Ankle Brace Accelerometer/Gyroscope-LT
4.1.4
Preliminary Design 4: V-Tact Belt-AM
NEEDS ANALYSIS-LT
4.2.1
4.3
4.4
4.5
5
Rank-ordering Design Objectives-LT
FUNCTIONS & SPECIFICATIONS-LT
4.3.1
Choosing the Activity-LT
4.3.2
Choosing the Signal and Sensor-LT
4.3.3
Choosing the Location-LT
4.2.4
Choosing the Method of Analyzing Acceleration Data-LT
4.3.5
Final Solution-LT
PRELIMINARY EXPERIMENTS-LT
4.4.1
Materials and method-LT
4.4.2
Results of Preliminary Testing-LT & KG
4.4.3
Conclusions of Preliminary Results-LT
CONCEPTUAL DESIGN-LT & AM
FINAL DESIGN-AM
5.1
OVERVIEW OF THE FINAL DESIGN-AM
5.2
DESIGN COMPONENTS-AM
5.3
BUILDING THE DEVICE-AM
5.4
PROGRAMMING OF THE DEVICE-AM
6
DESIGN VERIFICATION-AM
7
DISCUSSION-LT, AM & KG
8
DESIGN VALIDATION-LT
6
8.1
9
PRELIMINARY TESTING WITH ELDERLY SUBJECTS-LT
8.1.1
Materials and Methods-LT
8.1.2
Determine the Difference Between Balanced and Unbalanced STS-LT
8.1.3
Verify the device-LT
CONCLUSIONS AND FUTURE RECOMMENDATIONS-KG
GLOSSARY-KG
APPENDICES- LT & AM
7
ACKNOWLEDGEMENTS
The design team would like to thank the following people for their continuous support
throughout the course of our Major Qualifying Project. Without your advice, expertise, and
volunteered time, this project would not have been possible. We greatly appreciate all your help.
Professor Mendelson
Professor Gielo-Perczak
Lisa Wall
Barbara Milanese
Dave, Chris & Kelly Johnson
Lauren Roberts, Fairlawn Rehabilitation Hospital
The Tuite Family
Louise Mayer
Liz Dailey
Brian Gaffey
WPI Biomedical Engineering Department
8
ABSTRACT
Each year, one in three elderly fall. Studies show that many factors contribute to an elderly
person‘s risk of falling, but if the factors causing imbalance are improved, a person‘s risk of
falling may be reduced. A device that detects and alerts the user of an off-balance situation
before the fall occurs could identify a specific need for improved balance control. This paper
describes the design, testing, and verification of a prototype wearable device that is worn on the
right hip during the sit-to-stand activity (STS) to detect and notify the user of an unbalanced
STS. By signaling an off-balance situation during STS, our device notifies the user of poor
balance control and identifies the need for balance control improvement.
9
TABLE OF FIGURES
Figure 1 Location of the COM, COG and BOS (Shumway-Cook & Woollacott, 2007). .......................... 19
Figure 2 The body modeled as an inverted pendulum adapted from (Winter, Patla, Prince, Ishac, & GieloPerczak, 1998)............................................................................................................................................. 21
Figure 3: Sinusoidal Behavior of COP- A Working Model Simulation (Gielo-Percak, 2010)................... 23
Figure 4 (a) Anterior Posterior Stabilization Strategies and (b) COP acceleration vs. Position (ShumwayCook & Woollacott, 2007). ......................................................................................................................... 24
Figure 5: Balancing a pencil on the tip of the finger to illustrate balance control and (a) forward sway and
(b) backward sway. ..................................................................................................................................... 26
Figure 6: Factors that could contribute to a fall. ......................................................................................... 28
Figure 7: Elderly participating in Tai Chi (Rose, 2005). ............................................................................ 32
Figure 8: Patent 7,150,048: Active protective garment (Buckman, 2006). ................................................ 34
Figure 9: Patent Application Number 2006/0195050 and Floor Vibration Prototpe ( (Alwan, Felder, Kell,
& Dalal, 2004). ........................................................................................................................................... 36
Figure 10: Patent Number 6, 433, 690: Elderly fall monitoring method and device (Petelenz, Peterson, &
Jacobsen, 2002). .......................................................................................................................................... 38
Figure 11: Patent Number 5, 515, 858: Wrist held monitoring device (Myllymake, 1996). ...................... 39
Figure 12: Figure 10: Patent Number 6, 611, 783: Attitude indicator and activity monitoring device (Kelly
& Schoendorfer, 2003)................................................................................................................................ 40
Figure 13: Patent Number 6, 997, 882: Subject monitoring device and method (Parker, Fabeny, Larson, &
Monaco, 2006). ........................................................................................................................................... 41
Figure 14: Correct positioning of MyHalo chest strap and device adapted from (Halo Monitoring, 2009).
.................................................................................................................................................................... 42
Figure 15: Philips LifeLine Personal Emergency Response System (Koninklijke Philips Electronics,
2010). .......................................................................................................................................................... 42
Figure 16: Patent Number 5, 919, 149: Apparatus and method for determination of body sway (Allum,
1999). .......................................................................................................................................................... 48
Figure 17: Patent Number 6, 984, 208: Method and apparatus for sensing body movement (Zheng, 2006).
.................................................................................................................................................................... 50
Figure 18: Patent Number 4, 750, 480: Posture-correcting devices (Jenness, 1988). ................................. 51
Figure 19: Patent 10/793,729: Method and apparatus for improving human balance and gait (Harry,
Collins, Prplata, & Kleshinkski, 2004). ...................................................................................................... 52
Figure 20: MEMS accelerometer and muscle behavior model (Fung, 1993). ............................................ 56
Figure 21: The Effect of Gravitation Acceleration on an MEMs Accelerometer. ...................................... 57
Figure 22: Hip fracture most costly and traumatic effect of falls. .............................................................. 65
Figure 23: Objectives of the design. ........................................................................................................... 67
Figure 24: Preliminary design 1, Shoe Insole. ............................................................................................ 73
Figure 25: Preliminary Design 2, Waist-mounted accelerometer. .............................................................. 75
Figure 26: Preliminary Design 3, Ankle Brace. .......................................................................................... 77
Figure 27: Preliminary Design 4, V-Tact Belt. ........................................................................................... 78
10
Figure 28: Outline of goals (red), functions (blue), specifications (green), and constraints (grey) of the
design. ......................................................................................................................................................... 86
Figure 29: Factors needed in choosing an activity. ..................................................................................... 88
Figure 30: Berg Balance Test (American Academy of Health and Fitness, 2010). .................................... 89
Figure 31: Choosing the Device Activity. .................................................................................................. 90
Figure 32: Factors signal and sensor need to fulfill. ................................................................................... 91
Figure 33: Signals to monitor balance control (pressure, acceleration, tilt). .............................................. 92
Figure 34: Choosing the Device Signal and Sensor. ................................................................................... 93
Figure 35: Factors location of device needs to fulfill. ................................................................................ 94
Figure 36: Possible locations of device (http://www.ehow.com/how_4629008_draw-personstanding.html). ............................................................................................................................................ 95
Figure 37: Choosing the Device Location. ................................................................................................. 95
Figure 38: Factors method of analysis needs to fulfill. ............................................................................... 96
Figure 39: Choosing the Method of Analysis. ............................................................................................ 97
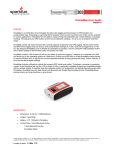
Figure 40: KinetaMap Triple-Axis Accelerometer and Data Logger (SparkFun Electronics, 2009). ...... 100
Figure 41: Chair and force platform experimental set-up. ........................................................................ 101
Figure 42: Attachment of the KinetaMap device. ..................................................................................... 101
Figure 43: Shoulder-width foot position representing a balanced condition. ........................................... 102
Figure 44: Tandem foot position representing an unbalanced condition. ................................................. 102
Figure 45: Root Sum of Squares of Acceleration of the STS in relation to hip flexion and extension of
lower limbs................................................................................................................................................ 104
Figure 46: Example of shoulder-width (black) and tandem (green) acceleration curves showing the time
duration measured (between organge lines).............................................................................................. 105
Figure 47: COP plots of tandem (green) and shoulder-width (black) trials. ............................................. 105
Figure 48: Average time between peaks (RL: 1, 2, 3, 4, 5, 6, 7, 8,). .................................................... 106
Figure 49: X axis acceleration during Z axis tilt ....................................................................................... 110
Figure 50: Y axis acceleration during Z axis tilt ....................................................................................... 111
Figure 51: Z axis acceleration during Z axis tilt ....................................................................................... 111
Figure 52: Magnitude of Acceleration during Z axis Tilt ......................................................................... 112
Figure 53: X axis acceleration during X axis tilt ...................................................................................... 113
Figure 54 Y axis acceleration during X axis tilt ...................................................................................... 113
Figure 55 Z axis acceleration during X axis tilt ....................................................................................... 114
Figure 56 Magnitude of Acceleration during X Axis Tilt......................................................................... 114
Figure 57: X axis acceleration during Y axis tilt ...................................................................................... 115
Figure 58: Y axis acceleration during Y axis tilt ...................................................................................... 116
Figure 59: Z axis acceleration during Y axis tilt ....................................................................................... 116
Figure 60: Magnitude of Acceleration during Y axis Tilt......................................................................... 117
Figure 61: ADXL345 Data Sheet 0g Bias Level ...................................................................................... 117
Figure 62: Block diagram of algorithm..................................................................................................... 118
Figure 63: Block diagram of device function. .......................................................................................... 119
Figure 64: Duino Balance: A Wearable Balance Control Indicator.......................................................... 120
Figure 65: Placement of device on user. ................................................................................................... 121
11
Figure 66: Arduino Duemilanove Microcontroller Board (Arduino, 2009). ............................................ 122
Figure 67: Size of Arduino and its size relative to a 6 inch A to B USB plug (Arduino, 2009). .............. 123
Figure 68: ADXL345 Tri-axis Accelerometer (Sparkfun Electronics, 2009). .......................................... 124
Figure 69: CEM 1203 Buzzer (Sparkfun Electronics, 2009). ................................................................... 124
Figure 70: Rechargeable battery pack (left) and battery attached to Arduino (right) (Allum, 1999)
(Arduino, 2009)......................................................................................................................................... 125
Figure 71: 9V Wall Adapter Plug (Maker Media, 2009). ......................................................................... 125
Figure 72: On-Off Slide Switch (Digikey, 2009)...................................................................................... 126
Figure 73: ProtoShield Board (Sparkfun Electronics, 2009). ................................................................... 126
Figure 74: Schematic of Device. ............................................................................................................... 127
Figure 75: Final Product of Device. .......................................................................................................... 129
Figure 76: Acceleration curve for the STS activity showing the peaks and time between them. ............. 132
Figure 77: Block Diagram of Final Design. .............................................................................................. 133
Figure 78: Block diagram of device functions and specifications for subject 1. ...................................... 136
Figure 79: Shoulder Width STS with Device. .......................................................................................... 138
Figure 80: KinetaMap acceleration vs. time data during Shoulder Width STS with device. ................... 138
Figure 81 COP graph for shoulder width (black) and tandem (green) STS trial. ..................................... 139
Figure 82: Tandem STS with Device........................................................................................................ 139
Figure 83: KinetaMap acceleration vs. time data during Tandem STS with device. ................................ 140
Figure 84: Chair and force platform experimental set-up ......................................................................... 149
Figure 85: Attachment of the KinetaMap device ...................................................................................... 150
Figure 86: Shoulder-width foot position representing a balanced condition. ........................................... 151
Figure 87: Tandem foot position representing an unbalanced condition. ................................................. 151
Figure 88: a) COP plot for a balanced STS b) COP plot for an unbalanced STS. ................................... 152
12
TABLE OF TABLES
Table 1: Existing Fall Detection Technology ............................................................................................. 43
Table 2: Devices that Assess/Monitor Balance Control ............................................................................. 54
Table 3: Pairwise Comparison Chart of Marketability Objectives ............................................................. 80
Table 4: Pairwise Comparison Chart of Safety Objectives ......................................................................... 81
Table 5: Weighted Objectives-Marketability .............................................................................................. 82
Table 6: Weighted Objectives- Safety ........................................................................................................ 82
Table 7: Numerical Evaluation Matrix-Marketability ................................................................................ 83
Table 8: Numerical Evaluation Matrix-Safety ............................................................................................ 84
Table 9: Numerical Evaluation Matrix- Overall Objectives ....................................................................... 84
Table 10: Subject information .................................................................................................................. 100
Table 11: Results of shoulder-width trials ................................................................................................ 106
Table 12: Results of tandem trials............................................................................................................. 107
Table 13: p-values comparing average shoulder-width to average tandem time between peaks.............. 107
Table 14: Morphological Chart-Electronic functions and means ............................................................. 109
Table 15: Change in magnitude of acceleration due to tilt on X, Y, and Z axis ....................................... 117
Table 16: Calculation of Subject 1‘s time range ....................................................................................... 118
Table 17: Cost of Device .......................................................................................................................... 131
Table 18 Results of Device Testing .......................................................................................................... 141
13
EXECUTIVE SUMMARY
Every year, one in three adults age 65 years and (Tideiksaar, 2002) costing the United States 20
to 30 billion health care dollars annually (Centers for Disease Control & Prevention, 2009).
Physicians often help high fall-risk patients improve balance, however many elderly may not
have their balance control assessed before a fall occurs. As a result, there is a need for a device
that detects and directly notifies the user of their balance control condition before a fall occurs.
Current technology is able to assess balance control, however the devices are not catered to the
elderly daily life or directly notify the user of their balance control. Therefore, the team designed
a wearable device catered to the elderly population that is used only during the sit-to-stand (STS)
rehabilitation activity. The device requires the user to perform a rehabilitation activity and
detects and directly notifies the user of an unbalanced STS thereby strengthening the user‘s
awareness of their balance condition and forcing rehabilitation to improve balance control.
Through research and client interviews the team determined design objectives,
constraints, and necessary functions. The most important objectives were that the device was
easy to use, sensitive to balance control, accurate, and adapted to elderly life. According to these
objectives, the team determined an activity that the device should monitor, the signal and sensor
used as a monitor, the location of the device, and the method of analyzing the signal. The team
chose to monitor the STS activity using an accelerometer placed on the right hip, and analyzed
the magnitude of the acceleration.
The team performed preliminary experiments to determine the difference between a
balanced and unbalanced STS in terms of acceleration. Subjects attached the SparkFun
KinetaMap tri-axial accelerometer to their right hip and performed 10 STS‘s with feet shoulderwidth (SW) apart (balanced) and 10 with feet in tandem (unbalanced) with feet placed on the
14
AMTI force platform. Data from the force platform was used to verify a balanced and
unbalanced STS and data from the KinetaMap was used to plot the magnitude of acceleration for
each trial. Time between the positive and negative peak amplitudes of the acceleration plots was
calculated and the team found that time between peaks of balanced trials was significantly longer
(p< 0.05) than the time between peaks of the unbalanced trials, which was consistent with
research (Pai & Patton, 1997). Preliminary data of subject 1 was used to calculate the time range
during which a balanced STS occurred and time range during which an unbalanced STS
occurred. The latter end of the unbalanced time range was chosen as the expected time (T e)
separating a balanced from unbalanced STS. This minimized false errors but included the
maximum amount of unbalanced situations
The device, Duino Balance was built with a tri-axis accelerometer, Arduino Duemilanove
Microcontroller Board, and a CEM1203 buzzer, a rechargeable battery pack and slide switch for
powering the device, as well as a protoboard for connecting and attaching all the components.
Duino Balance is enclosed in a plastic project box and attached to a belt to be worn around the
user‘s waist. The device was programmed to detect the minimum and maximum peaks of the
STS and measure the time (Tm) between these peaks. If Tm Te, the device was programmed to
buzz. If Tm Te,the device was told to reset. Device verification was conducted using the same
tests used during preliminary testing. During SW tests, the device buzzed once when it should
not have buzzed (90% accuracy) and during tandem trials, the device reset twice when it should
have buzzed (80% accuracy).
Therefore, the design was verified by having greater than 75% accuracy. The team also
validated the design by interviewing clients who reported the device was ―straightforward, easy
to use, and not cumbersome‖ and could be used in a clinical setting (See Appendix C).
15
1
INTRODUCTION
Every year, one in three adults age 65 years and older fall and ten thousand elderly die each year
as a result of falls (Tideiksaar, 2002). Of those who fall, 20-30% suffer injuries that impair their
ability to live healthy, independent lives (Centers for Disease Control & Prevention, 2009).
These injuries include moderate injuries such as bruises and arm fractures, and severe injuries
such as hip fractures and head trauma. In fact, most fractures among the elderly and traumatic
brain injuries are caused by falls (Centers for Disease Control & Prevention, 2009). In addition,
falls in the elderly may cause feelings of increasing frailty, fear and stress, ultimately leading to
anxiety during activities of daily living (ADLs) (e.g. getting out of bed). Of those who fall, 50%
avoid performing ADLs because they fear additional falls (Tideiksaar, 2002).
Furthermore, falls cost the United States 20 to 30 billion health care dollars each year
(Services, 2007) and this amount is expected to increase with the increasing elderly population.
By 2030, 80 million people will be elderly, an approximate 43% increase since the year 2000,
and by 2020, total indirect and direct medical costs of falls may reach 54.9 billion dollars
(Centers for Disease Control & Prevention, 2009).The financial burden and effects of falls on the
quality of life of the elderly cause the need for a cost-effective solution that minimizes the
negative effects of falls, particularly on the elderly population.
The Centers for Disease Control and Prevention (CDC) have administered various fall
prevention and education programs aimed at reducing the occurrence of falls in the elderly.
These programs address a few of the many risk factors associated with elderly falls. For
example, two risk factors that cause falls are decreased balance control and strength in the
elderly. As a result, two studies funded by the CDC and conducted over a three-year time span
utilized education and exercise programs intended to improve balance and increase strength in
the elderly participants, thereby reducing falls. However, neither study produced a significant
16
reduction in falls (Centers for Disease Control & Prevention, 2009). On the other hand, previous
research showed that Tai Chi exercise can improve balance and decrease falls among the elderly,
but researchers do not know if the general elderly community can adopt this exercise into daily
life (Rose, 2005). According to this research, regular exercise that the elderly can readily
integrate into their daily life is one way of reducing the risk falling (Stevens, 2005). The CDC
has also identified a need to increase elderly self efficacy and sense of balance control in relation
to fall risk in order to prevent elderly falls (Centers for Disease Control & Prevention, 2009).
Therefore, the MQP team set out to design a device that would enable elderly to independently
assess their balance control and requires daily exercise.
In order to design a device that assesses balance control we had to understand how
humans maintain balance and why the elderly experience an increased amount of falls. In
addition, we identified current methods used to assess and monitor balance control, and
evaluated the advantages and disadvantages of each method.
The final balance control indicator aims to strengthen the user‘s awareness of their
balance condition, while requiring a rehabilitation activity. These features make the device
distinct among existing products and the team hopes this will enable the device to reduce elderly
falls in the future. This report describes the strategic design of the current balance control
indicator. The report will discuss the background of human balance control, advantages and
disadvantages of current technology, and the gap in the current market. Following, the report
will detail the team‘s project approach, strategy of design, testing and analysis, and final design
and verification.
17
2
LITERATURE REVIEW
A human‘s balance control system enables a person to maintain balance while standing, during
locomotion (i.e. walking, running), and upon perturbation (e.g. tripping). Three sensory systems
in the body are used to maintain balance: vision, the vestibular system, and the somatosensory
system. As the functionality of these systems deteriorates, a person‘s ability to remain balanced
decreases. However, studies showed that consistent exercise, especially Tai Chi, can improve
balance control and decrease the risk of falling. This chapter discusses the details of balance
control, how it is assessed, why elderly are susceptible to falls, and how balance control can be
improved. The final sections of this chapter discuss advantages and disadvantages of current
technology aimed at reducing the negative effects of falls, and subsequently identify important
objectives that will guide the design of the present balance control indicator.
2.1
UNDERSTANDING BALANCE CONTROL
To analyze how each sensory system contributes to balance control, researchers assume the
human body behaves like an inverted pendulum (Winter, Patla, Prince, Ishac, & Gielo-Perczak,
1998); the body is always swaying. Certain factors regarding the body‘s movement can dictate
how well a person is balanced. This section describes how the body maintains balance during
locomotion and while standing, how each sensory system contributes to maintaining balance. In
addition, this chapter discusses the parameters associated with balance control and ways that
these parameters are measured in order to assess a person‘s balancing ability.
2.1.1
Basics of Balance
Balance is how the body moves relative to the gravitational force vector in order to maintain
posture and prevent falling. To understand how balance is maintained, researchers study the
relation between the body‘s center of gravity (COG), the center of mass (COM), the center of
18
pressure (COP), and the base of support (BOS). The COM is a point on the body equal to the
sum of the body‘s mass as shown in Figure 1. The COG is the vertical projection of the COM
shown in Figure 1. The area of the feet in contact with the ground and the area between them
when standing is referred to as the BOS. The COP is located at the point of the vertical ground
reaction force and represents the weighted average of the pressure on the surface area in contact
with the ground (Winter, Patla, Prince, Ishac, & Gielo-Perczak, 1998) (See Figure 1). Therefore,
when standing on one foot the COP is located within the surface area of that foot and when
standing on both feet, the COP is located somewhere between the two feet. The COP is totally
independent of the COM. The ground reaction force exists between the ground and the surface in
contact with the ground (e.g., the person‘s feet) and is an equal and opposite reaction to the force
of the body weight (Winter, Patla, Prince, Ishac, & Gielo-Perczak, 1998).
Figure 1 Location of the COM, COG and BOS (Shumway-Cook & Woollacott, 2007).
19
The weight of the body and the ground reaction force exert a moment about the same
point of action. The moment of each force is equal to the product of the force and the
perpendicular distance from the force to the point. When the moments due to body weight and
ground reaction force are different, the body will sway in the anterior-posterior direction (i.e.,
forward or backward) and medial-lateral direction (i.e., side to side). While standing, the body
continuously attempts to balance these moments to reduce sway (Winter, Patla, Prince, Ishac, &
Gielo-Perczak, 1998). The concepts of moments, COG, BOS and COP as they relate to balance
will be described as they relate to human balanced control and through an example of balancing
a pencil.
2.1.2
Human Balance Control and the Inverted Pendulum Model
Maintaining balance in a human is difficult because the COG is located at a distance 2/3 up from
the point of the reaction force, or the feet. Depending on the position of the COG in relation to
the point of the reaction force, the body will sway forward or backward. The body is able to react
to forward and backward sway in order to recover balance and prevent falling. As a result, the
body is continuously swaying forward and backward or in the anterior-posterior (A/P) direction.
This phenomenon and factors that determine how the body sways is referred to as the inverted
pendulum model shown in Figure 2 (Winter, Patla, Prince, Ishac, & Gielo-Perczak, 1998).
20
Figure 2 The body modeled as an inverted pendulum adapted from (Winter, Patla, Prince,
Ishac, & Gielo-Perczak, 1998).
In Figure 2, the body‘s COG, labeled W, acts downward and an equal and opposite
reaction force, R, acts upward. Force R represents the COP. These forces remain constant. R acts
at a distance, ‗p‘, from the ankle joint, Aj, and W acts at a distance ‗g‘ from the ankle joint.
According to the inverted pendulum model, the body sways in the A/P direction while a person
is standing still. The body experiences a counterclockwise moment equal to Rp and a clockwise
moment equal to Wg, and has a mass moment of inertia equal to the product of the moment of
inertia of the whole body about the ankle joint, ‗I‘ and the angular acceleration of the body, ‗‘.
act to create this forward and backward sway. Rp – Wg = I, where I is the moment of inertia of
the whole body about the ankle joint and = the angular acceleration. At time 1, the COG is
ahead of the COP and Wg > Rp, resulting in a clockwise angular acceleration or the body
21
swaying forward. As a result, the body will increase the COP so that it lies anterior or in front of
the COG. This causes Rp > Wg and to reverse. As reverses, the angular velocity,, will start
to decrease until at time 3 it reverses. This causes the body to sway backwards. Again, the body
needs to adjust to prevent itself. from swaying further backward and so it decreases the COP
until it lies behind the COG. This causes to reverse until at point 5 the angular velocity
completely reverses and causes the body to sway forward. This cycle continuously repeats while
a person is standing still (Winter D. , 1995).
2.1.3
Maintaining Balance during Perturbation
The COP of the inverted pendulum model has also been found to behave sinusoidally as shown
in Figure 3 (Winter, Patla, Prince, Ishac, & Gielo-Perczak, 1998). When the body sways forward,
the COP lies outside the COG and has a positive amplitude of acceleration as shown on the
graph. When the body sways backward, the COP lies behind the COG and has a negative
amplitude of acceleration as shown on the graph. The amplitude of the COP is largest at first and
continually decreases. This shows that upon perturbation, a person is accelerating the quickest
and sways most. As the body reacts to maintain balance, the body sways less and the acceleration
decreases (Shumway-Cook & Woollacott, 2007).
22
0.025
Acceleration (m/s/s)
0.02
0.015
0.01
0.005
COP
0
-0.005
0
2
4
6
8
10
12
14
-0.01
-0.015
Time (sec)
Figure 3: Sinusoidal Behavior of COP- A Working Model Simulation (Gielo-Percak, 2010).
Depending on the acceleration of the perturbation, the body uses different methods to
maintain balance. Balance control and anterior-posterior stabilization strategies are utilized to
prevent or attempt to prevent a person from falling. There are three major anterior-posterior
stabilization strategies: the ankle, hip and stepping strategies, as shown in Figure 4a. The ankle
strategy, shown by the number 1 in Figure 4a, only provides a small range of motion and is
therefore used when only a small adjustment is needed to maintain balance. The hip strategy,
number 2 in Figure 4a, provides a larger range of motion and is used when the person is at their
stability limit. Both the ankle and hip strategy can also be combined together in order to
maintain balance. The third strategy is the stepping strategy, number 3 in Figure 4a, which is
used when the person is about to fall and cannot maintain their balance without taking a step (Pai
& Patton, 1997).
23
Figure 4 (a) Anterior Posterior Stabilization Strategies and (b) COP acceleration vs.
Position (Shumway-Cook & Woollacott, 2007).
These three balance control strategies directly relate to the acceleration and position of
the person‘s COP as shown in Figure 4b. The graph shows the COP acceleration in m/s2 on the
y-axis and the COP position on the x-axis relative to the midfoot or the arch and the toe. Curve 1
corresponds to the ankle strategy, and is a balanced situation because the COP is maintained
within the foot. Curve 1 has a small amplitude and acceleration. Curve 2 corresponds to the hip
strategy, and when the person is at their stability limit. The COP is just outside the toe region,
and has a higher amplitude and acceleration than situation 1. The third curve is the unbalanced
situation that requires the stepping strategy to maintain balance. In the off balance situation, the
COP is far outside the foot region. This situation also has the highest acceleration and amplitude.
From this graph you can see that as the acceleration increases, the loss of balance increases and
thus the person has less time to react (Shumway-Cook & Woollacott, 2007).
In addition to amplitude of acceleration, reaction time is an important component of
balance. There are two different reaction strategies, the reactive control and proactive control
24
strategies. The reactive control strategy occurs as a result of a loss of balance or the COP moving
outside of the BOS. The second strategy is the proactive control strategy, which occurs in
anticipation to an off balance situation. The reaction time involved in a fall is small and thus it is
important to utilize both the proactive and reactive strategies. The proactive strategy occurs when
a person becomes used to a routine, or occurrence and is able to alter their movements based on
anticipation (Shumway-Cook & Woollacott, 2007).
2.1.4
Example of Balance Control: Balancing a Pencil
Balancing a pencil on your finger is an example that illustrates the concepts of balance control.
When balancing a pencil at the tip using one finger, the ―ground reaction force‖ is the force of
the finger pushing up on the pencil. The COG of the pencil, ‗X‘, is located far above the tip
(Figure 5), close to the middle of the pencil. In order to balance a pencil at the tip with one
finger, the finger needs to push up at exactly the same point as the COG. If the point of reaction
force (R) of the finger does not push up at exactly the same point as the COG, then the weight of
the pencil, ‗W‘, creates a moment equal to the product of the weight of the pencil and the
perpendicular distance ‗d‘ (distance from point X to point R in Figure 5). The position of COG in
relation to ‗R‘ causes the pencil to sway forward or backward. If the COG is located in front of
the reaction force, a clockwise moment is created (Figure 5a), causing the pencil to turn forward;
if the COG is behind the reaction force a counter-clockwise moment is created (Figure 5b),
causing the pencil to turn backward. Balancing a pencil at the tip using one finger is difficult
because the COG and point of the reaction force (i.e. the finger) are located far apart.
25
Figure 5: Balancing a pencil on the tip of the finger to illustrate balance control and (a)
forward sway and (b) backward sway.
2.2
RISK FACTORS OF FALLING
There are many risk factors that are a result of normal ageing that can cause an elderly person to
be more susceptible and likely to fall than a younger adult as shown in Figure 6. Risk factors can
be classified into two main categories: extrinsic factors and intrinsic factors. Extrinsic factors are
present in the environment or the person‘s home, and include factors such as stairs, uneven
terrain, loose carpet, poor lighting and wet bathroom tiles. Intrinsic factors are present within an
individual and generally relate to physiological factors such as balance, vision, proprioception,
muscle weakness, reaction time, postural sway, gender, post-fall anxiety syndrome, use of
26
medication, chronic diseases both neurological and musculoskeletal, and mobility. A fall can be
caused by extrinsic factors or intrinsic factors or a combination of the two (Rubenstein, 2006).
In the elderly population, physiological factors have a major impact on why the elderly lose their
balance and cannot recover when they fall, and why they cannot get up after a fall.
27
Figure 6: Factors that could contribute to a fall.
Balance control decreases with age. Elderly people have an especially hard time
maintaining balance while walking because the COM is outside of the BOS for 80% of the gait
28
cycle, thus falls often occur while elderly people are walking (Woolley, Czaja, & Drury, 1997).
Therefore, it is important to assess and evaluate gait in the elderly because any additional
problems will increase their already high risk of falling. For example, elderly people who do not
pick up their feet when they walk are more likely to trip over obstacles. Other factors like
walking patterns, stride length, response time, and ankle and knee flexion also affect balance
control and contribute to why elderly people fall (Voermans, Snijders, Schoon, & Bloem, 2007).
Between the ages of twenty and sixty, there is a 25% increase in response time, which
increases the likelihood that an elderly person is going to fall because they are unable to react as
quickly to obstacles or changes in their COM (Sturnieks, St George, & Lord, 2008). Response
time is an important factor when determining whether a person will be able to recover from a trip
or if they will fall. The walking patterns of the elderly also greatly increase their risk of falling.
Elderly people have a smaller stride length when they walk and as a result have a slower walking
velocity (Winter D. , 1995). Walking velocity is particularly important when an elderly person
encounters an obstacle or trips, because the speed of forward rotation of the body related to the
person‘s walking velocity (Bogert, Pavol, & Grabiner, 2002). Elderly people also spend a longer
time in the double support phase, which is the phase of the gait cycle where both feet are on the
ground (Chong, Chastan, Welter, & Do, 2009). Elderly people have a larger toe out angle,
reduced toe pressure, and a higher horizontal heel velocity during heel contact. These gait
differences occur in the elderly because they are trying to maintain balance and limit the amount
of time during which their COM is outside the BOS. However these gait changes often put them
at a greater risk of falling (Woolley, Czaja, & Drury, 1997).
Kinematic and kinetic differences at the trunk, hip, knee, and ankle are also present in the
elderly and lead to an increased risk of falling. The elderly have a decreased range of motion in
29
ankle, knee and hip. Elderly people have reduced ankle range of motion, larger ankle plantar
flexion at heel contact, reduced ankle power generation and delayed dorsiflexion. Kemoun et al.
found that delay in ankle dorsiflexion during gait is one factor that could prevent falls (Kemoun,
Thoumie, Boisson, & Guieu, 2002). When walking down stairs, elderly people also have a
substantial decrease in ankle range of motion (Woolley, Czaja, & Drury, 1997). Tripping over an
obstacle or falling down stairs can be also be caused by reduced knee flexion (Schillings,
Mulder, & Duysens, 2005). Range of motion at the hip is another factor that increases the risk of
falling in the elderly. Hip extension in the elderly is reduced during walking. Increased anterior
pelvic tilt and hip extension moment during the swing phase also occurs in the elderly (Kemoun,
Thoumie, Boisson, & Guieu, 2002). During falls, the elderly also experience increased trunk
flexion and trunk velocity. Grabiner et, al found that older adults had trunk flexion angles after a
trip that were double the trunk flexion angle of the young subjects (Grabiner, Pavol, & Owings,
2002). Kinetic differences present in the elderly are reduced ankle power generation, increased
hip extension moment during swing phase (Grabiner, Pavol, & Owings, 2002), reduced toe
pressure and slower generation of joint moments (Lockhart, Smith, & Woldstad, 2005).
The famous slogan ―I‘ve fallen and I can‘t get up!‖ is both a fear and a reality of many
elderly people (Life Alert Emergency Response Inc., 2010). Studies of community dwelling
elderly people have shown that approximately 50% of fallers, including those who have not
suffered any injuries as a result of the fall, cannot get up on their own after a fall (Tinetti, Lui, &
Claus, 1993). The number of people who cannot get up after a fall increases significantly to
about 80% over the age of 90 years old (Fleming & Brayne, 2008). The inability to get up after a
fall can lead to more serious injuries like dehydration, hypothermia, pneumonia, pressure sores,
muscle damage and increased fear of falling (Lord, Sherrington, & Menz, 2000). Lying on the
30
ground for extended period of time also leads to post fall anxiety syndrome. People with post
fall anxiety syndrome alter or avoid daily activities because of the constant fear of another fall.
When someone avoids daily activities or changes their gait because of a fear of falling, their
muscles become weaker and atrophied and this leads to an abnormal gait and as a result
increased risk of falling (Rubenstein, 2006).
2.3
REDUCING THE NEGATIVE EFFECTS OF FALLS
The prevalence and cost of falls in the elderly population has resulted in the development of
many rehabilitation methods, risk assessment strategies and devices. All these options are
intended to reduce the negative effects of falls (Centers for Disease Control & Prevention, 2009).
2.3.1
Improving Balance Control
Since many factors affect balance, methods of improvement focus on different aspects of balance
control. In addition to assessment of fall risk, exercise has been shown to be the most successful
form of intervention for reduced fall risk and improved balance control (Stevens, 2005). Several
exercise methods for improving balance control are physical therapy, Tai Chi and the Nintendo
Wii Fit balance board and gaming console. Physical therapy focuses primarily on increasing
muscle strength and flexibility. Tai Chi involves controlling the movement of the COM and
reducing body sway (Mao, Hong, & Li, 2006). The Wii Fit balance board and gaming console
evaluates COP, BOS, and works on improving reaction time and proprioception (Clark, Bryant,
Pua, McCrory, Bennell, & Hunt, 2010). Studies have shown that all three methods are effective
for strengthening a person‘s balance control (Stevens, 2005).
Muscle weakness, especially in the lower extremities, is one cause of falls in the elderly.
Studies have shown that muscle weakness negatively affected balance control and postural
stability in the elderly because they were not able to generate enough muscle force in response to
31
a perturbation (Horlings, van Engelen, Allum, & Bloem, 2008). As a result, many studies
evaluated the effects of physical therapy and strength training on improved balance and
concluded that physical therapy is a successful form of intervention (Rose, 2005).
It is also difficult for the elderly to control movements of their COM and BOS during
forward and backward sway, which can cause falls. Tai Chi, shown in Figure 7, is a type of
exercise that involves slow forward and backward motions, and has been used in many research
studies for the elderly population (Mao, Hong, & Li, 2006). The movements during Tai Chi help
the elderly concentrate on slow movements, weight shifting, flexibility, foot positioning and
proprioception. Studies have concluded that after participating in Tai Chi the elderly have
increased awareness of their body sway and limb movements, reduced fear of falling and
considerably improved balance control (Rose, 2005).
Figure 7: Elderly participating in Tai Chi (Rose, 2005).
The Nintendo Wii Balance Board and Wii Fit gaming console has several games and
activities that specifically target balance control and COP movements. A study by Clark et al.
investigated the validity of the Wii Balance Board for assessing balance control. The study
32
concluded that the Balance Board is comparable to a laboratory force platform, and can be used
to assess standing balance (Clark, Bryant, Pua, McCrory, Bennell, & Hunt, 2010). The Wii Fit
video game has balance mini games that are also intended to improve balance through an
interactive gaming experience. These games involve moving the user‘s COP and COM to
complete various tasks in the video game and have been used in rehabilitation programs to
improve balance control (Clark, Bryant, Pua, McCrory, Bennell, & Hunt, 2010).
2.3.2
Fall Detection Patents
Numerous patents exist for devices that detect falls and the methods by which these devices
detect falls vary greatly. These patents can be classified into three categories based on their
method of detection: ambient sensors, active protection garments and accelerometer based.
2.3.2.1 Active Protection Garments
Active protection garments (Figure 8) detect certain conditions that could predict a fall and upon
these conditions, deploy an airbag intended to cushion the impact of the fall. The design pictured
in Figure 8 contains airbags within non-gas porous pockets. The airbags deploy under the
following conditions: a rotation rate between sensors on the waistband or torso and at the bottom
of the leg exceeding 45 degrees in 0.1 seconds, nearly weightless condition for a period of 0.1
seconds, and lateral and vertical accelerations meeting certain parameters with respect to each
other and with respect to normal values (Buckman, 2006). These conditions are not claimed to
accurately predict a fall. Therefore, the device could deploy an air bag unexpectedly. Another
drawback to this device is that the undergarment could be uncomfortable and hard for an elderly
person to put on and take off. However, if the device were optimized to detect only falls, it could
be useful in limiting hip injuries.
33
Figure 8: Patent 7,150,048: Active protective garment (Buckman, 2006).
2.3.2.2 Ambient Sensor Patents
Ambient devices differ from wearable fall detection devices in that they detect a fall by
measuring indirect factors such as pressure or vibrations in the floor. An ambient floor vibration
sensor (Figure 9) was developed and patented by the Medical Automation Research Center at the
University of Virginia. This device is positioned on the floor and has a transducer at the bottom
of the unit that comes in direct contact with the floor and is used to measure the vibrations
patterns in the floor to detect human falls. The device uses parameters such as frequency,
amplitude, duration, and succession. The study at the University of Virginia showed that
34
different activities like walking and running have vastly different vibration patterns and these
patterns are also very different from the vibration patterns that occur during and after falling. An
anthropomorphic dummy was used to determine the signal and vibration pattern of a ‗human‘
fall, that was then programmed into the device as the only signal and vibration pattern that
triggers the device to detect a fall. The fall alert can be sent through a wireless communication as
a message to a cell phone or pager. The detection range of this device is around 15 feet, which is
large enough to cover most rooms in a home or assisted living facility (Alwan, Felder, Kell, &
Dalal, 2004). The obvious limitation of this device is its lack of portability; it cannot be used for
active elderly clients that intend to leave one room and go to another room, or go outside, to the
supermarket, etc. This device, despite its limitations, was able to perform with 0% false alarms
and 100% true positives (Alwan, Felder, Kell, & Dalal, 2004).
35
Figure 9: Patent Application Number 2006/0195050 and Floor Vibration Prototpe (
(Alwan, Felder, Kell, & Dalal, 2004).
2.3.2.3 Accelerometer-Based Patents
The most common method of detecting a fall is through the use of an accelerometer. Devices that
use an accelerometer to detect a fall vary by threshold acceleration values, the algorithm used to
confirm the fall, and location of the sensor or sensors on the body.
Patent number 6, 433, 690 (Figure 10) is a wearable accelerometer based device that aims
to monitor the user, detect a fall and automatically alert a caregiver or call station that a fall has
36
occurred. The remote monitoring device (30) is worn on the side of the hip and attaches to the
user by a clip. Two biaxial accelerometers with a sensitivity of +/- 2G are enclosed in the
monitoring device. These accelerometers are used to measure the angle and acceleration of the
body in order to determine if the user is horizontal for longer than two seconds, and if any of the
threshold accelerations or angles are exceeded. The patent claims to detect falls with a 95%
accuracy rate (Petelenz, Peterson, & Jacobsen, 2002). An advantage of the design is it can
automatically detect fall events and rapidly send an alert to a caregiver or call station without any
input from the user, which is important if the user were to become unconscious as a result of the
fall. By alerting a caregiver or call station of the fall, the faller is able to receive help quickly and
reduce long lie injuries and further injuries that could occur as a result of not being able to get up
off the floor. The small size of the device allows the user to wear the monitor without interfering
with their daily activities. The drawback of the design is that the fall is not detected until after the
person is lying horizontal on the ground. Another drawback is that attention needs to be paid to
how the device is worn, as false alarms are more likely to occur if the device is not aligned
properly with respect to the vertical axis.
37
Figure 10: Patent Number 6, 433, 690: Elderly fall monitoring method and device
(Petelenz, Peterson, & Jacobsen, 2002).
Accelerometer based designs have also be applied to patient monitoring systems. Patent
number 5, 515, 858 (Figure 11) is a monitoring device that resembles a watch and is worn on the
wrist. The main objective of this device is to monitor physiological conditions such as
temperature and pulse, but the device also incorporates an accelerometer (4) to detect movements
of the hand or wrist in order to monitor the actions of the user. The device is able to determine
any abnormal acceleration or lack of movement for an extended period of time and automatically
transmit an alarm to a surveillance monitor. This design also has a call button which the user can
press to send an alert to a caregiver and receive assistance in getting up after a fall (Myllymake,
1996). One benefit of this design is that by monitoring the movements of the user, the device
could identify if the user loses consciousness after a fall or remains lying on the ground for a
period of time and is not moving. One drawback of the device is that the device does not
specifically detect a fall, which is partially addressed with the addition of a call button. This issue
is partially addressed with the call button, but if the user becomes unconscious as a result of a
38
fall and cannot press the button, the faller cannot receive help until a period of time goes by and
the device recognizes that the user is not moving.
Figure 11: Patent Number 5, 515, 858: Wrist held monitoring device (Myllymake, 1996).
An accelerometer based device can also be used to detect the orientation of the user.
Patent number 6, 611, 783 (Figure 12) is a device that uses an accelerometer placed on the back
of the user‘s thigh to detect tilt and variation from a reference angle. The device can be used to
monitor patients in a hospital, determine range of motion assessment in physical therapy or
prevention and detect falls. The threshold values and reference angles for the accelerometer can
be adjusted depending on the application. When threshold value or reference angle is exceeded
an alarm is activated to alert and provide feedback to the user. An alert is also sent by a radio
frequency transmitter to a caregiver or monitoring station (Kelly & Schoendorfer, 2003). This
device is easy to use and does not require any manual activation of the device. One drawback of
this device is the risk of false alarms if the user exceeds the reference angle when bending over
to pick something up off the ground or sitting in a chair.
39
Figure 12: Figure 10: Patent Number 6, 611, 783: Attitude indicator and activity
monitoring device (Kelly & Schoendorfer, 2003).
Patent 6, 997, 882 (Figure 13) is a combination of the methods used in the previous
patents and monitors the user‘s activities, measures physiological signals, and detects the
velocity, acceleration, orientation and position of the user. This design utilizes sensors attached
to a belt with a Velcro strap. The device contains three biaxial accelerometers that can acquire
data using six degrees of freedom, and concurrently monitors heart rate using heart rate
electrodes. The accelerometers are attached to the belt so that one accelerometer placed over the
midline of the back; one accelerometer is placed over the right hip; and the other is placed over
the left hip.
Bluetooth technology is used to wirelessly transmit the acceleration and
physiological data (Parker, Fabeny, Larson, & Monaco, 2006). One major benefit of attaching
the sensors at the waist is the sensor‘s are close to the user‘s COM. Another advantage of this
design is the device is easy to use and does not require any manual activation of the device. A
40
drawback of this device is potential false alarms as a result of activities of daily living such as
bending forward and picking something up off the floor or reaching for something on a shelf.
Figure 13: Patent Number 6, 997, 882: Subject monitoring device and method (Parker,
Fabeny, Larson, & Monaco, 2006).
2.3.3
Current Fall Detection Technology
Current methods of fall detection are summarized in Table 1. Of these methods, there several
commercialized products: MyHalo Monitoring System, BrickHouse Alarm System, and Phillips
LifeLine. MyHalo consists of a strap that wraps around the user‘s chest, a chest strap, and
sensing component (Figure 14) (Halo Monitoring, 2009). The sensing component contains a
triple-axis accelerometer that automatically detects a fall after the fall has occurred. Upon
detection of a fall, the MyHalo system connects to the MyHalo Operating Center who then calls
a caretaker. The MyHalo System also sends messages to caretakers via e-mail, text message, or a
personal web page. The sensing component is placed no more than 2 inches below the sternum
as shown in Figure 14. The device can also be clipped on the pants of the user; however in this
position other vital signs (e.g. blood pressure, heart rate) cannot be obtained (Halo Monitoring,
2009). Disadvantages of the MyHalo Monitoring System are that it does not detect a fall before
the fall occurs, it is only for use inside the home or immediate area of the home (e.g. yard,
41
garage), and that wrapping the strap around the chest to put the device on and take it off may be
difficult.
Figure 14: Correct positioning of MyHalo chest strap and device adapted from (Halo
Monitoring, 2009).
Philips Lifeline Personal Emergency Response System (PERS) is another method of fall
protection. This device is contained within an apparatus such as a watch or necklace. The device
contains a button and when the buttons is pressed, the system contacts an operator who calls a
caretaker or sends emergency response (Figure 15). The button is pressed by the user when in
need of assistance and cannot reach help (Koninklijke Philips Electronics, 2009). The main
disadvantage of the PERS is that it is user-activated so if the user cannot reach the device, is
unconscious, or is in any other way unable to press the button, the device is not beneficial.
Figure 15: Philips LifeLine Personal Emergency Response System (Koninklijke Philips
Electronics, 2010).
42
Table 1: Existing Fall Detection Technology
Device
myHalo Fall Monitor
Sensor for
Fall Detection
3-axis
accelerometer
Location
Strap is worn on
upper torso near
sternum
http://www.halomonitoring.com
http://www.halomonitoring.com
Clip can be worn on
belt
Brick House Alert Fall
Monitoring and Panic
Button System
3-axis
accelerometer
Clips onto side of
hip
http://www.brickhousealert.com
Pros & Cons
Pros:
-Automatically detects the
fall
-Alerts call center that user
has fallen who can then
alert emergency response
-Detects vital signs
Cons:
-Only for home use
-Multiple components and
set up required
-Chest strap could be difficult
for the elderly to put on
-Does not detect fall before it
occurs
Pros:
-Automatically detects the fall
-Alerts central monitoring
station who can alert
emergency response
-Waterproof: can wear in
shower
Cons:
http://www.brickhousealert.com
Philips Lifeline
& other Call Buttons
No sensor for fall
detection
Worn around neck
http://www.lifelinesys.com/
http://www.lifelinesys.com
/
Other buttons are
incorporated into a
watch
-Only for home use
-Does not detect fall before it
Occurs
-Set up required
Pros:
-May prevent long lie injuries
-Contacts a caregiver,
monitoring station or
emergency response
-Device is discrete and doesn’t
draw attention to user
Cons:
-Does not detect a fall
-Not useful is user is
unconscious
-Requires user activation
43
Device
SmartFall Cane
Sensor for Fall
Detection
3-axis accelerometer
Location
On cane, not worn
Pros:
-Alerts caregiver or
monitoring service when
user has fallen
-Uses subsequence matching
Algorithm
-No set up required
-Does not restrict user’s
mobility
3 single axis
gyroscopes
2 Pressure sensors
http://cs.ucla.edu/~alireza/Body
Nets08.pdf
Cons:
-Not wearable
-False alarms
-Cane can fall and user not
-Bumps into something
-Rotation of cane from
vertical to horizontal
-Does not detect fall before it
happens
http://cs.ucla.edu/~alireza/
BodyNets08.pdf
FallSaver
Pros & Cons
3-axis accelerometer
Back of thigh
Pros:
-Minimal false alarms
-Easy to use
-Detects when user starts to
rise from a sitting position
-Wireless
Tilt switch
http://fallsaver.net
Cons:
http://fallsaver.net
-Does not detect a fall
-Beeps every time user starts
to stand up
-Going to keep beeping until
user sits back down
44
Device
Floor Vibration Sensor
Sensor for Fall
Detection
Piezo transducer
Location
On floor, not worn
Pros & Cons
Pros:
-Automatically detects a fall
once person is on the ground
-No false alarms
-Alerts a caregiver of a fall
Cons:
http://marc.med.virginia.
edu/pdfs/library/ICTTA_fa
ll.pdf
UVirginia
TEMPO
http://marc.med.virgini
a.edu/pdfs/library/ICTT
A_fall.pdf
3-axis accelerometer
Center of trunk and
front of thigh
2-axis gyroscope
-Does not detect a fall before
it occurs
-Lack of portability
-Only useful for one room
Pros:
-Able to recognize different
dynamic and static positions
-Low cost
Z-axis gyroscope
Cons:
-Detects fall after it occurs
-Difficulty determining
whether someone is getting
into bed or falling against a
wall into a seated position
-Attached to user with tape
http://marc.med.virginia.edu/pdfs/library
/ICTTA_fall.pdf
http://marc.med.virginia.
edu/pdfs/library/ICTTA_fa
ll.pdf Coat
Smart
Micro-mercury
switches
Embedded in a coat
Pros:
-Automatically detects a fall
-Alerts a monitoring station
-May prevent long lie injuries
Optical sensors
Cons:
http://www.sciencedirect.com/science?_ob=Ar
ticleURL&_udi=B6V424NMC8781&_user=74021
&_rdoc=1&_fmt=&_orig=search&_sort=d&_doc
anchor=&view=c&_searchStrId=1140042312&_
rerunOrigin=google&_acct=C000005878&_versi
on=1&_urlVersion=0
http://www.sciencedirect.com/scie
nce?_ob=ArticleURL&_udi=B6V424
NMC8781&_user=74021&_rdoc=1
&_fmt=&_orig=search&_sort=d&_d
ocanchor=&view=c&_searchStrId=1
140042312&_rerunOrigin=google&
_acct=C000005878&_version=1&_
urlVersion=0
-Does not detect a fall before
it occurs
-Only detects when user is
Horizontal
-Can only detect falls in the
sagittal plane
45
Device
CSEM wrist fall detector
Sensor for
Fall Detection
2 MEMS 3-axis
accelerometers
Location
Wrist
http://www.csem.ch/docs/Sh
ow.aspx?id=9383
3-axis
accelerometer
Pros:
-Automatically detects a fall
-Alerts a monitoring station
-Discrete and doesn’t draw
attention to user
-Call button
-Able to wear to bed
http://www.csem.ch/docs/Sh
ow.aspx?id=9383
Z Star fall detector
Pros & Cons
Trunk
Cons:
-Does not detect a fall before
it occurs
-False alarms
-Difficult to distinguish fall
from wrist acceleration data
due to normal movement of
the forearm during ADLs
Pros:
-Automatically detects a fall
-Small size
-Alarm when fall occurs
- Alerts a monitoring station
-Detects orientation of user
Cons:
http://www.csem.ch
-Does not detect a fall before
it occurs
-Limited transmission range
-Study not conducted on
elderly but by students
intentionally falling
The overlying disadvantage of the aforementioned devices is that they do not detect a fall
before the fall occurs. Therefore, these device are no proactive and do not help assess a user‘s
risk of falling.
2.3.4
Limitations of Current Technology
The main limitation common among all commercial fall devices is that they do not detect
or signal a fall prior to it happening. Therefore, the user does not have a decreased risk of falling
46
by wearing the device. The devices containing a call button are not useful if the user is
unconscious. However, the main downfall of devices on the market is that they do not decrease
the risk of falling.
2.4
METHODS FOR ASSESSING BALANCE CONTROL
There are patents and devices on the market that are used for assessing balance control. The
patents are vibrotactile based and are used to alert a user of abnormal posture or sensory
function. There are two devices currently on the market, the iShoe (Trafton, 2008) and the Wii
Fit Balance Board and game (Nintendo, 2009).
2.4.1
Vibrotactile Based Patents
Vibrotactile based patents can be used for monitoring user movements and to correct abnormal
posture. The main difference between all of the vibration based feedback devices is the location
of the vibration tactors.There are no vibrotactile based patents designed specifically for fall
detection or prevention, but some are used to detect balance issues.
Patent number 5, 919, 149 (Figure 16) is a wearable device used to detect balance
problems, mainly abnormal postural sway of the upper torso, and to provide feedback to the user
to help with rehabilitation. The device collects angular velocity and body tilt angles using two
gyroscopes. One of the gyroscopes (12A) is mounted in the middle of the chest for the purpose
of measuring side to side movements or roll of the trunk. The other gyroscope is attached on the
side of the chest (12B) and is used to measure forward and backward movements or pitch. In
this design, feedback is provided to the use through visual and vibration feedback. Visual
feedback is provided by projecting an image, of the body sway angle and angular velocity of the
trunk, onto a pair of eye glasses (24). Vibrotactile feedback is provided to the user by two
vibration tactors that activate when the user has exceeded a particular tilt angle or velocity
47
(Allum, 1999). One benefit of this design is it can be worn under the user‘s clothing, so it does
not attract any additional attention to the user that could cause embarrassment. This design also
attempts to provide the user with feedback about the postural sway which could potentially
prevent the user from falling or allow them to anticipate the fall and catch themselves, assuming
that the stimuli was activated soon enough and that the user was able to respond to the stimuli
quickly. One disadvantage of this design is the purpose of the device is not to detect a fall. A
major drawback of this design is the location of the device on the upper chest would make it very
difficult for an elderly user to put on and take off.
Figure 16: Patent Number 5, 919, 149: Apparatus and method for determination of body
sway (Allum, 1999).
Patent number 6, 984, 208 (Figure 17) is a device used to measure the movement and
posture of various body parts by transmitting ultrasound signals into the user‘s muscles. The
ultrasound signals are sent to the muscles by ultrasound transducers and recorded by the
48
receivers (12 & 14). The ultrasound signals are either scattered or reflected by the muscles and
this can be used to determine the position, angle, and stiffness of the muscles as well as detect
changes in the muscles during particular movements (Zheng, 2006). This design identified an
additional method, ultrasound signals, that can be used to measure body movement and detect
abnormal body movement. One benefit of this device is the ultrasound sensors and system can be
combined with EMG sensors, accelerometers and gyroscopes to apply the design to other
applications. A drawback of the design is the design would be beneficial in a clinical setting such
as a gait analysis lab or hospital where a trained medical professional could apply the electrodes
in the proper location, but would not be practical for home use especially for the elderly because
there are too many transducers to apply and proper location is important.
49
Figure 17: Patent Number 6, 984, 208: Method and apparatus for sensing body movement
(Zheng, 2006).
In addition to monitoring body sway and movement, vibrotactile devices can be used to
correct posture. Patent number 4, 750, 480 (Figure 18) is a belt that is worn around the waist to
detect when the user is slouching and activate a vibration signal to alert the user to correct their
posture. The pad (12) is worn on the front of the abdomen and is used to determine whether the
abdominal muscles are tightened or relaxed. A switch on the inside of the pad is pressed when
the user relaxes their abdominal muscles and this triggers the vibration component to activate
and continue vibrating until the user tightens their muscles and releases the switch (Jenness,
1988). A benefit of the design is the device shows that the user is able to respond to the vibration
feedback and adjust their posture accordingly. One drawback of the device is the pad is very
50
large and could be uncomfortable to the wearer. Another drawback of the device is it needs to be
worn on the outside of the user‘s clothing. This would attract unwanted attention to the user,
making them self conscious and embarrassed and ultimately not want to use the device.
Figure 18: Patent Number 4, 750, 480: Posture-correcting devices (Jenness, 1988).
There is also a design that utilizes vibrotactile feedback to enhance sensory function in
the foot, thereby improving human balance. Vibration actuators or electrodes are contained
within a wearable system such as a sock or shoe insole (Figure 19).These actuators or electrodes
provide electrical stimulation to the mechanoreceptors in the foot and ankle to increase their
sensitivity and ability to transmit sensory information to the central nervous system (Harry,
Collins, Prplata, & Kleshinkski, 2004). By increasing the sensory performance of the
mechanoreceptors in the foot, the device may improve balance in the user. However, this device
is located in the user‘s shoes, which is a difficult location for the elderly to use. Also, the
vibration from this device could startle the elderly user and cause them to fall. This device is
51
being pursued as a therapeutic tool by a small business, Afferent Corporation, however, it is not
currently on the market.
Figure 19: Patent 10/793,729: Method and apparatus for improving human balance and
gait (Harry, Collins, Prplata, & Kleshinkski, 2004).
2.4.2
Current Devices for Assessing Balance Control
There are two devices, the iShoe and the Wii Fit Balance Board and gaming system that are
currently on the market for assessing and monitoring balance control. A summary of these
devices can be found in Table 2.
The iShoe is a shoe insert that contains pressure sensors to determine abnormal pressure
patterns in the user‘s feet. This device can be connected to a computer and a medical
professional is able to analyze the data to determine and monitor a user‘s balance control
52
(Trafton, 2008). One major disadvantage of the iShoe is that the data needs to be brought to a
doctor‘s office and interpreted by a medical professional. Another disadvantage is the device is
not proactive and does not provide instant feedback to the user. This device is only beneficial
when the user is wearing shoes, and putting on the device could be difficult for an elderly user.
The Wii Fit Balance Board and gaming system provides an interactive way for user‘s to
assess their balance control. The balance board contains pressure sensors that display the user‘s
COP on a television screen through a video game interface. The Wii Fit game has several games
for user‘s to play in order to improve their balance control (Nintendo, 2009). While this device
provides visual feedback to the user, and an opportunity to work on their balance control, this
device does not directly assess the user‘s risk of falling. This device is also targeted for the
younger population, and the video games are not catered to an elderly user.
While both of these devices are able to assess and monitor balance control, neither device
is proactive or directly assesses the user‘s risk of falling. The devices are also not designed to be
easy for an elderly person to use them.
53
Table 2: Devices that Assess/Monitor Balance Control
Device
Sensor for
Fall
Detection
Pressure sensors
iShoe
Location
Insert for a shoe
Pros & Cons
Pros:
-Able to detect abnormal
pressure patterns
-Bluetooth enabled to transfer
data to a doctor
-Monitors balance control
http://web.mit.edu/newsoffi
ce/2008/i-shoe-0716.html
http://web.mit.edu/newsoffice
/2008/i-shoe-0716.html
Wii Fit Balance Board
http://www.nintendo.com/wii
/what/accessories/balanceboa
rd
Pressure sensors
Board that users stand
on
http://wiifit.com/bodytest/#body-control
Cons:
-Does not detect a fall before
it occurs
-User must be wearing a shoe
to use the device
-Data must be interpreted by
a medical professional
Pros:
-Videogame to improve
balance control
-User awareness of balance
control
-Measure COP
-Cheaper than a force
platform
Cons:
-Games are not catered to the
elderly
-Many steps for operating the
device
-Games are not related to
repetitive daily activities
http://wiifit.com/bodytest/#body-control
Although there are currently devices on the market to alert emergency response, detect a
fall after it occurs and assess balance control, there is a need for a device that proactively
monitors balance control, provides instant feedback, and notifies the user of their risk of falling.
54
2.5
PROACTIVELY MONITORING BALANCE CONTROL
An important step in preventing falls is identifying of a person‘s risk of falling as soon as
possible (Zijlstra, Bisseling, Schlumbohm, & Baldus, 2010). This can be achieved by assessing
and proactively monitoring balance control. One way to proactively monitor balance control is
through the use of sensors placed on the body. Sensors such as accelerometers, gyroscopes,
pressure transducers or strain gauges are portable, can be used in a person‘s home and are not
very expensive (Janssen, Kulcu, Horemans, Stam, & Bussmann, 2008).
2.5.1
Accelerometry
An accelerometer measures acceleration relative to freefall and is used in many of the fall
detection applications. Accelerometers can measure acceleration on one axis, two axis, or three.
Accelerometers are micro electro-mechanical systems (MEMs), and behave as a series of small
dashpots, damped with a gas (Figure 20). As the spring-mass system moves due to an external
acceleration being applied, the electrical impedance of the system changes. These changes are
outputted digitally or through an analog signal and must be processed to be interpreted in a
circuit. Some considerations taken in choosing an accelerometer for device design include
sensitivity (for analog accelerometers, this will mean amplitude of the change of the output
voltage relative to g‘s of acceleration), maximum measurable acceleration, and number of axis
on which to measure acceleration. Accelerometers can be combined with gyroscopes, which in
the case of device design are sensors that can measure orientation based on the principles of
angular momentum (Omega Engineering Inc., 2003).
55
Figure 20: MEMS accelerometer and muscle behavior model (Fung, 1993).
There are a number of functions that an accelerometer can have, one of which is tilt. This
is due to the accelerometer‘s inherent ability to detect gravitational acceleration on each sensing
axis relative to its rotational position. A MEMs accelerometer can be modeled after a cantilever
beam with a proof mass in a gas-damped chamber between two capacitive plates. As gravity acts
on the beam, it displaces from its neutral position toward the lower capacitive plate. This would
be read the same as if a force was displacing the sensor upwards accelerating at the equivalent
local gravity (Figure 20). This is a useful application for devices that are intended to make use of
this rotational property of the accelerometer. However, in applications where the accelerometer
is intended to measure motion components as well as rotational components of movement, or
only motion components, it can become difficult to discern which portions of the signal are
resultant of tilt and which are of motion.
The key to understanding the effects of different components of motion on the signal can
be understood from observing the output on the timescale. A rotation of the accelerometer will
result in a ―DC‖ or step-like component, where the baseline of the signal will change, and the
sensing axis will reflect between zero and one g at rest. The offset from the gravitational
acceleration vector will be critical in determining the observed output, where the output will be
reflected by cos(Θ)*9.81 m/s2 (gravity). Θ will be the angle which the sensor is offset from
56
directly measuring the reactive force of gravitational acceleration. Because of this, the
accelerometer‘s output will be a nonlinear (sinusoidal) response to changes in orientation on
each sensing axis. It is important to note that an accelerometer will only sense changes in
acceleration on the axis that it has defined as measurement axis, and will not observe any
changes if there is acceleration on an axis that has no sensor associated with it.
Figure 21: The Effect of Gravitation Acceleration on an MEMs Accelerometer.
Digital Accelerometers output a serial stream of data rather than a voltage on each of the
independent measuring axis. They utilize pulse width modulation to determine the specific
acceleration magnitude recorded. This means that there is a square wave with a certain frequency
and a varying duty cycle. The duty cycle will be proportionate to the severity of acceleration
acting on the sensing axis, and obtaining an acceleration measure from this data will be
dependent on the sensitivity of the sensing axis (i.e. +/- 2g accelerometer on a 100% duty cycle
will be measuring either +2g or -2g, 50% duty cycle will be recording either +1g or -1g). This
technique of pulse-width modulation is necessary because of the Boolean nature of digital
electronics, as a device can either be fully on or fully off, and an accelerometer requires
intermediary measurements.
57
Accelerometers have been used frequently in motion analysis research studies for both
walking and balance control (Janssen W. G., Bussmann, Horemans, & Stam, 2005). According
to a study by Janssen et al,
The results of the study indicate that accelerometer is able to provide a sensitive
measure of balance during the sit-to-stand movement. Accelerometery offers the
benefit of low cost and portability. An important advantage of accelerometery
therefore is that it allows measurement outside of a movement laboratory.
(Janssen, Kulcu, Horemans, Stam, & Bussmann, 2008)
Accelerometer signals have also been shown to ―contain information on kinematic events
that will enable us to define time markers to describe the phasing and duration of the sitto-stand movement without the use of a gait laboratory‖ (Janssen W. G., Bussmann,
Horemans, & Stam, 2005).
Research has shown that the acceleration of a person‘s COM can determine how
close they are to their stability limit. For example, a quick acceleration would cause a
person to become more unstable. As a result, studies have used accelerometry to assess
balance control and have shown that it is an accurate, affordable alternative to using more
expensive motion analysis system. Therefore, the team investigated accelerometry as a
design alternative.
2.5.2
Gyroscopes
Gyroscopes are sensors primarily used to measure position, tilt, and orientation.
As a
mechanical system, a gyroscope is a spinning wheel with a high angular momentum. The system
is mounted within two rotors that make the system highly susceptible to external torque forces.
This design can be found in gyroscope toys. MEMs gyroscopes, such as those present in
gyroscope ICs used in fall detection devices make use of a spinning disc built into a vibrating
structure. Because of the spinning disc configuration, larger acceleration forces will act on the
outside of the disc versus the inside of the disc. Therefore changed in rotation will act with
58
greater force on the outside of the disc, causing it to stray from its axis. By using two discs, as
they stray from their axis the capacitance between them will change. In order to accommodate
the extremely small size of this complex system, complex micromachining is necessary to create
a gyroscope sensor. Because of this, these sensors tend to be costly (Torrence, 2008).
Gyroscopes have been used to monitor the tilt of the body, in particular the angle
of the trunk at the hip and the angle between the body and the ground when standing.
Certain angles of the body have been shown to correspond to unbalanced situations. In
addition, gyroscopes have been used in combination with accelerometers in fall detection
devices. Therefore, the team investigated gyroscopes for use in the design of a balance
control indicator.
2.5.3
Strain Gauges and Pressure Transducers
Strain gauges are electrical resistors configured to measure strain by means of changing
resistance/conductance values when the device is deformed. A Typical strain gauge will change
in its resistance value when compressive or tensile force is applied. This changing value of
resistance can easily be used in a simple circuit to produce a varying voltage or current change as
necessary. There are many different types of strain gauges, ranging from simple foil strain
gauges through piezoelectric sensors designed from semiconductive material, with capacitive
and fiber optic strain gauges in between. Different types of strain gauges tend to have markedly
different gauge factors (or sensitivity to strain) from one another. For instance, piezoelectric
sensors are much more sensitive to deformation than foil gauges. These devices are also much
more sensitive to temperature deviations, like most resistive circuits (Omega Engineering Inc.,
2003).
59
Pressure transducers convert pressure signals into an analog electrical signal. They
sometimes implement and are very similar to strain gauges. When a strain gauge, either
capacitive, resistive, inductive, or piezoelectric is attached to a wheatstone bridge in order to
produce a small amplitude electrical voltage signal, it is considered a pressure transducer.
Pressure transducers are available in many different forms with many different applications
ranging from small IC component-mounted pressure transducers to large pressure transducers
useful in industrial and automotive settings. The analog voltage output of pressure transducers
makes them easily useable via basic signal processing (Aston, 1990).
Research has shown that variations in the position of a person‘s COP along their feet can
represent how well the person is balanced. For example, if a person is unbalanced their COP may
be positioned closer to their toes while if a person is balanced their COP may be positioned close
to the middle of their foot (Pai & Patton, 1997). Current technology, such as the iShoe, has
utilized the concept of measuring pressure along the feet as a means of assessing balance control
(Trafton, 2008). Since pressure transducers and strain gauges are two methods of measuring
pressure, the team investigated these devices for use in the current balance control indicator.
2.5.4
Motion Analysis
Motion analysis laboratories are used to assess balance control and gait. These laboratories have
expensive infrared motion capture cameras, and force platforms. The force platform
measurements are used to assess COP and BOS during both standing and gait. Spherical
reflective markers are placed on anatomical landmarks on the body, and the infrared cameras
track the movement of the markers. The video footage is analyzed to assess the movement and
location of the markers during the activity, and can be used to analyze body sway and the
movement of the COM (Culhane, O'Connor, & Lyons, 2005). While motion analysis can be an
60
effective and beneficial assessment of balance and gait, the process is expensive, time consuming
and can only be performed in a laboratory setting.
2.5.5
Advantages and Disadvantages of Current Balance Monitoring Methods
The accelerometer, pressure transducers and strain gauges, and gyroscope are four devices that
can be used to measure acceleration, pressure, and tilt respectively. A person‘s acceleration,
pressure under the foot, and tilt of a person‘s body has also been shown to relate to balance
control. Therefore, each device was investigated for use in the current balance control indicator.
The advantages of the accelerometer are that it is most accurate when placed on the trunk
which is an accessible location and could make the device easily positioned. In addition, the
accelerometer has shown to be accurate in monitoring balance control during activities such as
the sit-to-stand and has been used to monitor balance control in place of a motion analysis
system.
Pressure transducers and strain gauges could be used to measure pressure under the foot
and monitor a person‘s balance control by tracking their COP. Although COP has been shown to
be one factor that relates to a person‘s balance control, acceleration of a person‘s COM has
shown to be more reliable in indicating whether a person is balanced. In addition, the sensors
need to be placed under the foot, an inaccessible location and requiring the use of footwear.
Gyroscopes have been used in combination with accelerometers, but only measure tilt.
Although tilt can indicate whether a person is balanced or unbalanced, it is not a characteristic
shown research to be characteristic of balance control. Therefore, using a gyroscope in the
balance control indicator may not be the most accurate means of interpreting a person‘s balance
condition.
61
Through research, pressure and acceleration were identified as the signals most sensitive
to balance control. Therefore, preliminary designs utilized the measurement of these signals or a
combination of these signals to create the balance control indicator.
62
3
PROJECT STRATEGY
Falls are the leading cause of unintentional death in the elderly population (Centers for Disease
Control & Prevention, 2009). Although there are many physical risk factors associated with
aging that are inevitable and can cause falls, balance control can be improved to reduce a
person‘s risk of falling (Stevens, 2005). Current fall-detection technology, such as MyHalo
Monitoring is not proactive and detects a fall after it has occurred. Proactive balance control
technology is not geared towards the elderly population (e.g. Wii Fit) or requires professional
intervention (e.g. iShoe). The Wii Fit is not catered to the elderly population because the games
require running, jumping and fast movements which could put an elderly user at risk for injury
(Clark, Bryant, Pua, McCrory, Bennell, & Hunt, 2010). The Wii Fit is also a video game
interface which could be too complicated for an elderly person to set up and operate. Therefore,
we identified the need for a device that indicates a user‘s balance control and risk of falling and
is catered to the elderly population. This chapter details the strategic design process used to
determine client needs and wants, objectives, and constraints of the device. The final sections
discuss the methods that the team created to reach objectives of the design.
3.1
CLARIFYING THE ORIGINAL PROBLEM STATEMENT
The team was originally given the following problem statement by Professor Gielo-Perczak and
Professor Mendelson:
―Design an early balance control device which can be used particularly by the elderly.
The first part of a project will involve data collection and analysis of signals during daily
movement, in particular situations when individuals can potentially lose their balance. A sensor
attached to the subject will be used to collect the data. Based on the data acquired, an early
balance control indicator will be designed and tested.‖
63
From the original client statement, the team identified the main goal of the project—to
design an early and wearable balance control indicator for the elderly. Three steps that were
identified to achieve this goal as established by the original problem statement are as follows:
1. Use a wearable sensor to collect data during daily movement and situations when
individuals can lose balance
2. Analyze the data
3. Design an early balance control indicator based on the data analysis
A key piece of information that was missing from the original problem statement was the
purpose for creating a balance control indicator. To establish the purpose of the design, the team
further defined the problem by using a strategy of design thinking called ‗decomposition‘ where
the larger problem was broken down into smaller, subproblems (Dym & Little, 2004).
To narrow the problem, the team researched the root cause of falls in the elderly
population. Numerous risk factors can contribute to the likelihood of falling. Since an elderly
person can obtain any combination of these risk factors, an infinite amount of situations could
lead to a fall. Therefore, the team identified the most costly and traumatic effects of falls as
shown in Figure 22. Nonfatal fall injuries were found to account for the majority of healthcare
expenditures due to falls (Centers for Disease Control & Prevention, 2009) and of these nonfatal
injuries, fractures account for 61% of the costs. Among fractures, hip fractures are the most
costly and traumatic fall injury as 1 in 5 who suffer a hip fracture dies within a year. Women are
2/3 more likely to sustain a fracture due to an unintentional fall than men and 72% of elderly
admitted to the hospital due to a hip fracture were women (Centers for Disease Control &
Prevention, 2009).
64
Figure 22: Hip fracture most costly and traumatic effect of falls.
As a result, the team identified the causes of hip fractures and specified a cause that could be
ameliorated via the present balance control indicator. The leading causes of hip fracture were
tripping and slipping, but numerous variables (e.g. lighting, surface, obstacles) can contribute to
tripping and slipping (Kerr, White, Barr, & Mollan, 1997). Fractures were found to be prevalent
among people with lower-body weakness, problems with gait and balance, and chronic diseases,
e.g. Parkinson‘s Diseases, arthritis (The National Council on the Aging, 2005). Studies showed
that falls can be prevented by increasing strength and balance control by exercises such as Tai
Chi and strength training (The National Council on the Aging, 2005).
In addition, clinical assessment where a person is tested for gait, balance, and
neurological function, and reviewing medication allows a physician to individually manage a
patient‘s needs in order to prevent falling. For example, the physician may refer the patient to a
specialist or change a medication. However, these assessments are recommended for high fall
risk patients or those who have already suffered a fall and have gait and balance problems (The
National Council on the Aging, 2005). As result, many elderly are not assessed for their fall risk
and could be at risk of falling. These people may not be assessed for their fall risk before it is too
late.
65
3.2
OBJECTIVES & CONSTRAINTS
Therefore, the team identified two goals of the project: to strengthen the user‘s awareness of
their balance control, and to proactively force user rehabilitation in order to operate the device.
Objectives were the criteria that the project and device addressed in order to meet the defined
goals. The objectives of this project are outlined in Figure 23.
66
Accurate
Sensitive to
balance control
Safe
Light-weight
Unharmful to
user
Securely attached
Easy to put
on/take off
Wearable Balance
Control Indicator
Easy to use
Easy to operate
Manufacturable
Easy to repair
Portable
Comfortable
Marketable
Durable
Aesthetically
appealing
Adapted to
elderly daily life
Cost-efficient
Figure 23: Objectives of the design.
A constraint was a condition that imposes a restriction or limitation on the design (Dym
& Little, 2003). Constraints of the design included elderly disabilities, available testing
equipment, and affordability. Because of the limited gait analysis capacity we had in the
67
laboratory, we needed to confirm balance condition by making use of only a single force
platform and a tri-axial accelerometer. We also needed to factor in affordability and user
acceptance. In order for a device to reach the widest population of elderly clients, it needed to be
affordable and uncomplicated in its operation. We needed to account for varying elderly
disabilities, making sure that the feedback provided by the device, as well as the controls to
operate the device were minimalist and simple. We needed a means of alerting the user that
would be able to be understood and sensed by a wide margin of elderly subjects, and directions
that were simple for clients to understand.
3.3
REVISED PROBLEM STATEMENT
According to the goals, objectives, and constraints of the project, the design team revised the
original client statement as follows:
Design balance control indicator which can be used particularly by the elderly to improve
awareness of their balance control. The first part of a project will involve data collection and
analysis of acceleration of COP signals during both a balanced and unbalanced STS activity. An
accelerometer data logger attached to the subject and an AMTI force platform will be used to
collect the data. Based on the data acquired, a lightweight and compact-form-factor balance
control indicator will be designed and tested that will be worn on a convenient location for the
client and utilize a daily activity to strengthen the user‘s awareness of their balance condition by
notifying the user of an off balance STS situation before a fall has occurred and proactively force
user rehabilitation by requiring the STS activity in order for the device to function. The device
will need to be easy to use, affordable, reliable, sensitive to changes in balance control, and
require no professional intervention to interpret its results. The device should be placed in a
68
location that is easy to take off and put on, and should utilize a repetitive daily activity so the
device can easily be incorporated into the daily life of the user.
3.4
PROJECT APPROACH
To establish an approach, the team identified specific subtasks under each step derived from the
problem statement. The subtasks were as follows:
1. Use a wearable sensor to collect data during daily movement and situations when
individuals can lose balance
a. Chose an activity during which a person can lose their balance
b. Chose a sensor that can be used to collect data during the activity
c. Chose a location for the sensor
2. Analyze the data
a. Identify characteristic parameters of the collected data
b. Choose specific parameter to analyze
3. Design a balance control indicator based on the data analysis
a. Identify wants and needs of stakeholders (i.e., client, designers, users)
b. Establish and prioritize design objectives
c. Identify constraints of the design
Therefore the team completed four tasks:
1. Identify a daily activity for the device to monitor
2. Identify a signal that can be used to monitor balancing control and an accompanying
sensor to detect that signal
3. Identify a specific location where the device can be easily worn and the signal can be
accurately monitored
69
4. Identify a specific parameter of the signal to analyze and use to distinguish between a
balanced and unbalanced condition
The following chapter details how the design team completed each of the aforementioned tasks.
70
4
ALTERNATIVE DESIGNS
The goal of this MQP was to design a wearable device for the elderly that detects an unbalanced
situation before a fall occurs. The design team identified constraints and objectives by
researching and understanding balance control, identified advantages and disadvantages of
current fall detection and balance control technology, and interviewed stakeholders (Appendix
C). Based on the constraints and objectives, the team developed three design alternatives. A
needs analysis was performed and results of the analysis were used to identify necessary
functions of the device and develop a conceptual design. Preliminary experiments were
conducted to determine feasibility of the design. This section describes the process used and
strategic decisions that we made in developing functions and specifications of a feasible
conceptual design.
4.1
Preliminary designs
Through extensive literature review and patent search, the team identified advantages,
disadvantages, and methods of signal detection of current fall and balance control technology.
Advantages of current devices include: sense unbalanced situation before a fall occurs, device is
comfortable and catered to the elderly population. Disadvantages of current technology include:
detects a fall after it has occurred, not catered to the elderly population, requires professional
intervention. In addition, the team found that current devices monitor pressure, acceleration, or
tilt to detect imbalance or a fall. Based on these findings, the team developed the four design
alternatives described in this section.
4.1.1
Preliminary Design 1: Shoe Insole
The first preliminary design (Figure 24) utilized an array of micro-strain gauges embedded in a
shoe or shoe insole. The strain gages would detect a threshold pressure indicative of an
71
unbalanced situation. Upon detecting this threshold pressure, the insole would vibrate to notify
the user that an off-balance situation had occurred.
Advantages of this design were that pressure is a common and accurate means of
assessing balance control. In addition, a force platform would be needed to identify the threshold
pressure and WPI has possession of this equipment. Therefore, no extra costs would be necessary
for testing. However, the main disadvantage of this design was that the user would have to be
wearing some type of footwear in order to use the device. This was unfavorable because our
client interviews (Appendix C) revealed that elderly have trouble putting on and taking off
footwear. Therefore, this design would make the device difficult to manage.
72
Figure 24: Preliminary design 1, Shoe Insole.
4.1.2
Preliminary Design 2: Waist-mounted Accelerometer
The second preliminary design (Figure 25) utilized a waist-mounted triple-axis accelerometer to
monitor the acceleration of the user. The accelerometer would detect a threshold acceleration
indicative of an unbalanced situation. Upon detecting this threshold acceleration, the device
73
would buzz to notify the user that an off-balance situation had occurred.
The electrical
components of the device would be housed in a plastic box. A clip on the back of the box would
be used to attach the device to a belt or pants.
The advantages of this design were that the accelerometer has been shown to accurately
monitor balance control, especially when positioned on a person‘s waist (Ward, Evenson,
Vaughn, Rodgers, & Troiano, 2005). Therefore, the device could be placed in an accessible
location, easy for the user to locate and attach the device. The location would also enable the
user to wear it at any time of day, unlike the Preliminary Design 1 (shoe insole).
74
Figure 25: Preliminary Design 2, Waist-mounted accelerometer.
4.1.3
Preliminary Design 3: Ankle Brace Accelerometer/Gyroscope
The preliminary design shown in Figure 26 is based off the concept of vibration therapy described in
the vibrotactile shoe insert patent mentioned previously (Harry, Collins, Prplata, & Kleshinkski,
2004) and studies that show changes in the angle and acceleration at the ankle joint help maintain
75
balance. The design was an ankle brace that contains an accelerometer or gyroscope positioned at the
ankle joint of the brace and removable vibrating components located near tendons of the ankle such
as the Achilles tendon within pockets of the brace. The accelerometer or gyroscope acts to monitor
the acceleration or change of position of the ankle joint, respectively. A threshold acceleration or
change in position defined through testing would occur before the individual was going to fall. Upon
reaching this threshold, the sensor would activate the vibrating components in the brace. The
vibrations would signal to the user that he/she was at risk of falling.
The ankle brace preliminary design also consisted of a removable strap that attaches via
Velcro around the top of the ankle brace. The strap houses the battery of the device and wiring
components. The wires would plug or snap into the accelerometer or gyroscope and vibrating
components. This preliminary design was most closely related to the device described in the Patent
Number US 2004/0173220 A1 consists of a wearable system (e.g. a shoe or sock) that contains
actuators that create vibration feedback in the ankle or foot (Harry, Collins, Prplata, & Kleshinkski,
2004). The vibration feedback acts to increase the sensitivity of the mechanoreceptors in the foot or
ankle and enhance the sensory function of those with decreased sensory performance (e.g. the
elderly). Although the patented device could enhance balance control in an elderly individual, the
device does not detect and notify the user when a fall is about to occur. Therefore, the preliminary
design differs in that it would detect an unbalanced situation before the fall occurs.
The vibrations would also enhance the sensitivity of the mechanoreceptors in the ankle which
would help convey information regarding the position of the ankle joint more quickly to the central
nervous system. In turn, the vibrating components would increase the ability of the user to recover
his or her balance.
An advantage of the ankle brace design shown in Figure 26 was that it could be worn
consistently throughout the day. In addition, the location would have a limited interference with the
user‘s everyday activities and could also remain out of the public view. However, it may difficult for
76
the user to attach the wires from the strap to the vibrating components and gyroscope or
accelerometer. The elderly may have limited grip strength and also decreased vision which would
make this task more difficult and hence make the device more difficult to put on and take off. In
addition, assistive devices that aid the elderly in putting on socks already exist in the market
indicating that elderly people have trouble putting on and taking off socks. Therefore, it may also be
difficult for an elderly individual to put on the ankle brace. One advantage of this design was that the
device directly notifies the user of an off-balance situation before a fall occurs. However, small
changes of acceleration or position at the ankle joint may be difficult to detect, making the device
inaccurate.
Figure 26: Preliminary Design 3, Ankle Brace.
77
4.1.4
Preliminary Design 4: V-Tact Belt
The V-Tact Belt design (Figure 27) combined the concept of a vibrotactile navigation device with the
SHIMMER platform (accelerometer-based sensor) (Lorincz, Chen, Patel, & Welsh, 2008). The design
incorporated small vibration tactors (similar to the ones used in a cell phone or pager) into the inside
surface a belt. SHIMMER sensors with the gyroscope board connection will be placed inside MP3 player
holders and attached to the outside surface of the belt. The device is worn at the waist because it is close
to the user‘s COM and is attached using Velcro so the user can put it on and take it off easily. The
SHIMMER sensors will be programmed and used to detect when the user is off balance and at risk of
falling. When the SHIMMER sensors determine the user is off balance, a signal will be transmitted to the
vibration tactors on the side which the user is unbalanced.
The vibration tactors will then vibrate and
alert the user that they are off balance in a particular direction, and the vibration should help them readjust
their posture back to a balanced stance or gait. This device can be considered an early fall detection
device because it detects and alerts the user when they are off balance and at risk of falling, and allows
them to potentially correct their posture and balance before they actually fall. The device would also be
able to detect that a fall has occurred.
Figure 27: Preliminary Design 4, V-Tact Belt.
78
4.2
NEEDS ANALYSIS
In order to evaluate the design alternatives, the team first determined the requirements of the
design. Designers discussed with all stakeholders the needs of the device, or the attributes it must
have, and wants of the device, attributes that a stakeholder would like to have, but may not be
possible given other constraints (Gielo-Perczak, 2009). Based on the needs and wants of the
stakeholders, objectives were rank-ordered, necessary functions were determined, and
specifications were outlined. All design alternatives were then assessed according to how well
they met the client‘s wants and needs, and fulfilled the necessary functions of the device. This
sections describes the specific tools used to rank-order the objectives and establish necessary
functions and specifications of the device.
4.2.1
Rank-ordering Design Objectives
The team prioritized design objectives by rank-ordering them using pairwise comparison charts
(PCC). A PCC is a tool that compares each objective against every one of the other objectives in
order to rank order them according to their importance to the final design. In the following PCCs,
a ‗1‘ means that the objective in the row was more important than the objective in the column. A
‗0‘ indicates that objective in the column was more important than the objective in the row. An
‗x‘ was given when comparing an objective against itself. Total points that each objective
received were summed in the last column of the table. The objective with the highest total was
the most important. The first table (Table 3) evaluated objectives that contributed to the
marketability of the design, while the second table (Table 4) evaluated objectives that
contributed to the safety of the design.
79
Table 3: Pairwise Comparison Chart of Marketability Objectives
Marketability
PCC
Comfortable
Easy to
put
on/take
off
Easy to
operate
Cater
to
elderly
daily
life
Costefficient
Manufacturable
Total
1
0
0
0
0
1
0
2
0
x
0
0
0
0
0
0
0
1
1
x
0
0
1
1
0
4
1
1
1
x
1
1
1
0
6
1
1
1
0
x
1
1
0
5
1
1
0
0
0
X
1
0
3
0
1
1
1
0
1
0
1
0
1
0
1
x
1
0
X
1
7
Durable
Aesthetically
appealing
x
Durable
Aesthetically
appealing
Comfortable
Easy to put
on/take off
Easy to operate
Cater to elderly
daily life
Cost-efficient
Manufacturable
According to the results of the marketability PCC, the order of importance of these objectives
from most to least important was as follows:
1. Manufacturable
2. Easy to put on/take off
3. Easy to operate
4. Comfortable
5. Adaptable to elderly daily life
6. Durable
7. Cost-efficient
8. Aesthetically appealing
80
Table 4: Pairwise Comparison Chart of Safety Objectives
Lightweight
Securely
attached
No
pressur
e points
Total
Safety
PCC
Accurate
Accurate
Sensitive
to
balance
control
Minimal
interactio
n with
user’s
skin
Lightweight
Securely
attached
X
0
1
1
1
1
0
4
0
X
1
1
1
1
0
4
0
0
X
1
1
1
0
3
0
0
0
X
0
1
0
1
0
0
0
1
1
X
0
2
1
1
1
1
1
1
X
6
No
pressure
points
Minimal
interaction
with user’s
skin
Does not
interfere
with
daily
activity
Sensitive
to
Balance
Control
According to the results of the safety PCC, the order of importance of these objectives from most
to least important was as follows:
1. No pressure points
2. Accurate
2. Sensitive to balance control
3. Minimal interaction with user‘s skin
4. Securely attached
5. Light-weight
The team then assigned relative weights to each objective according to their importance. For
example, a highly ranked objective was assigned a higher weight indicating that it was more
81
important to the design. The objectives of each of the two PCCs were weighted as shown in
Tables 5 and 6.
Table 5: Weighted Objectives-Marketability
Objective
Score
7
Manufacturable
6
Easy to put on/take off
5
Easy to operate
4
Comfortable
3
Adapted to elderly daily life
0
Aesthetically appealing
2
Durable
1
Cost-efficient
28
TOTAL
Adjusted Score
7 +1 =8
6 +1 = 7
5+1=6
4 +1 = 5
3 +1=4
0 + 1= 1
2+1=3
1 +1= 2
36
Table 6: Weighted Objectives- Safety
Objective
No pressure points
Minimal interaction with user’s skin
Accurate
Sensitive to balance control
Lightweight
Securely attached
TOTAL
Score
6
3
4
4
1
2
21
Weight
8/36 = 0.22
7/36= 0.19
6/36= 0.17
5/36= 0.14
4/36= 0.11
1/36= 0.03
3/36= 0.08
2/36= 0.06
1
Weight
6/20 = 0.30
3/20 = 0.15
4/20 = 0.20
4/20 = 0.20
1/20 = 0.05
2/20 = 0.10
1
A numerical evaluation matrix was then used to assess how well each design alternative
met the objectives. The numerical evaluation matrix contained objectives and constraints of the
design in the first column. The second column contained the weighted percentage assigned to each
objective. The next three columns contained the preliminary designs. Each design was then ranked
on a scale from 0-1 in an increment of 0.1 on how well it met the objective (0- it does not met the
objective and 1-it completely met the objective). Each team member ranked the design on how well it
mets each objective. The rankings for each objective were averaged. A total percentage of how well
the objective was met by the design was calculated by multiplying the ranking by the corresponding
weighted percentage. Two numerical evaluation matrices were completed: one determined how well
82
the preliminary designs met the objectives of marketability (Table 7) and the other determined how
well the alternative designs met the objectives of safety (Table 8). The Preliminary Design that met
the highest percentage of the objectives is highlighted in red.
Table 7: Numerical Evaluation Matrix-Marketability
DESIGN
Constraints
&
Objectives
Manufacturable
Easy to put on/take off
Easy to operate
Comfortable
Cater to elderly daily
life
Aesthetically
appealing
Durable
Cost-efficient
TOTALS
Weight
Shoe Insole
(%)
22%
19%
17%
14%
11%
3%
8%
6%
100%
0.3
6.6%
0.4
7.6%
0.1
1.7%
0.4
5.6%
0.6
6.6%
0.7
2.1%
0.3
2.4%
0.3
1.8%
34.4%
Waistmounted
accelerometer
Ankle
Brace
V-Tact
0.8
17.6%
0.8
15.2%
0.8
13.6%
0.8
11.2%
0.7
7.7%
0.5
1.5%
0.6
4.8%
0.8
4.8%
76.4%
0.2
4.4%
0.2
3.8%
0.2
3.4%
0.3
4.2%
0.4
4.4%
0.5
1.5%
0.4
3.2%
0.3
1.8%
23.3%
0.2
4.4%
0.2
3.8%
0.2
3.4%
0.5
7.0%
0.5
5.5%
0.5
1.5%
0.5
4.0%
0.4
2.4%
32%
83
Table 8: Numerical Evaluation Matrix-Safety
DESIGN
Constraints
&
Objectives
No pressure points
Minimal interaction
with user’s skin
Accurate
Sensitive to balance
control
Lightweight
Does not interfere
with daily activity
Securely attached
TOTALS
Weight
(%)
29%
14%
19%
19%
5%
5%
9%
100%
Shoe
Insole
Waistmounted
accelerometer
Ankle
Brace
V-Tact
0.8
23.2%
0.8
11.2%
0.5
9.5%
0.7
13.3%
0.6
3.0%
0.5
2.5%
0.6
5.4%
65.6%
0.5
14.5%
0.8
11.2%
0.8
15.2%
0.8
15.2%
0.5
2.5%
0.5
2.45%
0.5
4.5%
65.6%
0.2
5.8%
0.1
1.4%
0.5
9.5%
0.1
1.9%
0.5
2.5%
0.6
3.0%
0.6
5.4%
26.5%
0.5
14.5%
0.8
11.2%
0.5
9.5%
0.8
15.2%
0.3
1.5%
0.4
2.0%
0.6
5.4%
48.1%
Through interviews with Lauren Roberts (Appendix C), a physical therapist of Fairlawn
Rehabilitation Hospital, the design team established that marketability and safety were equally
important to the design. Therefore, an additional Numerical Evaluation Matrix (Table 9) was
created to determine mathematically which alternative design best met the objectives of the
design as a whole.
Table 9: Numerical Evaluation Matrix- Overall Objectives
DESIGN
Shoe
Waist-mounted
Weight
Overall
Insole
accelerometer
Objectives
65.6 %
65.6%
Safety
0.50
32.2%
32.8%
34.4%
76.4%
Marketability
0.50
17.2%
38.2%
TOTALS
1
49.4%
71%
Ankle
Brace
V-Tact
26.5%
13.3%
23.3%
11.7%
24.9%
48.1%
24.1%
32%
16%
50.1%
84
According to the Numerical Evaluation Matrices, the waist-mounted belt best satisfied
the objectives, as it met 65.55% of the safety objectives, and 76.4% of the marketability
objectives, and thus fulfilled 71% of the overall objectives of the design. Therefore, the team
chose the waist-mounted conceptual design and determined the functions, specifications, and
feasibility of the design.
4.3
FUNCTIONS AND SPECIFICATIONS
The two main goals of the design were to strengthen the user‘s awareness of their balance control
condition and to proactively force the user to perform a rehabilitation exercise. In order to verify
that the waist-mounted accelerometer preliminary design would be capable of fulfilling the goals
of the project, the team established three necessary functions and used research and client
interviews to create specifications that would enable the device to achieve each function. The
team also identified constraints that could prevent the design from achieving the goals.
To strengthen the user‘s awareness of their balance conditions, our device should notify
the user if they experience an unbalanced situation. Specifically, our device should detect and
notify the user of an unbalanced situation before a fall occurs. In order to proactively force user
rehabilitation, operation of the device should require the user to perform a rehabilitation activity.
Specifically, the rehabilitation activity should be a daily activity so that operation of the device is
integrated into the daily life of the user. Constraints of the design were the varying disabilities of
the elderly such as osteoporosis, decreased muscle strength, and decreased range of motion. The
device needed to remain easy to use and to operate regardless of disabilities due to normal aging.
Two other constraints were the available testing equipment at WPI and affordability. The team
only had access to a force platform and the cost of the device should remain equivalent or less
than the fall detection technology on the market so that the device can be afforded without the
85
aid of health insurance. Figure 28 outlines the goals (red), functions (purple), specifications
(green), and constraints (grey).
STRENGTHEN USER’S
AWARENESS OF BALANCE
CONDITION
Notify user of
unbalanced situation
Detect unbalanced
situation before fall
occurs
PROACTIVELY FORCE USER
REHABILITATION
Require rehabilitation
activity for operation of
device
Utilize repetitive
daily activity
- Elderly Disabilities
- Available Testing Equipment
- Affordability
Figure 28: Outline of goals (red), functions (blue), specifications (green), and constraints
(grey) of the design.
To determine if the waist-mounted accelerometer met the necessary functions and
specifications (Figure 28), the team posed four questions:
1. What activity should be monitored?
2. Where should the device be located?
3. What signal and sensor should be used?
4. How should the signal be analyzed?
The following sections describe the team‘s process of answering these questions to further
identify specifications of the design. These sections also verify that the waist-mounted
86
accelerometer would be able to fulfill the specifications making it the best choice for the final
design.
4.3.1
Choosing the Activity
The two goals of the device were to proactively force user rehabilitation and strengthen the
user‘s awareness of their balance condition. In order to do this, operation of the device should
require the user to perform a rehabilitation activity. Specifically, the rehabilitation activity should
be a daily activity so that operation of the device is integrated into the daily life of the user. To
strengthen awareness, the device should detect and notify the user of an unbalanced situation
before a fall occurs. Therefore, the activity should be a daily activity that is repetitive in the life
of the elderly, sensitive to balance control, and a feasible rehabilitation technique as shown in
Figure 29 (Gross, Stevenson, Charette, Pyka, & Marcus, 1998).
87
Sensitive to
balance
control
?
Feasible
rehabilitation
technique
Repetitive in
Daily Life
Figure 29: Factors needed in choosing an activity.
To ensure that the chosen activity would be sensitive to balance control, the team looked
at the fourteen activities on the Berg Balance Test (BBT) shown in Figure 30. The team
identified through research and an interview with a physical therapist at Fairlawn Rehabilitation
Hospital that the BBT was the most common exam used to assess balance control and that three
activities on the BBT were the most sensitive to balance control: standing on one foot, standing
in tandem (one foot in front of the other), and the sit-to-stand (STS) (Lauren Roberts, Fairlawn
Rehabilitation Hospital).
88
Figure 30: Berg Balance Test (American Academy of Health and Fitness, 2010).
Standing on one foot and standing in tandem were eliminated because they can be
dangerous for the elderly user and are also not repetitive daily activities. STS was chosen as the
activity because it was sensitive to balance control (Gross, Stevenson, Charette, Pyka, & Marcus,
1998), and repetitive in daily life (Figure 31).
89
Figure 31: Choosing the Device Activity.
4.3.2
Choosing the Signal and Sensor
The two goals of the device were to proactively force user rehabilitation and strengthen the
user‘s awareness of their balance condition. In order to force rehabilitation, the device required
the user to perform the STS activity, which is both a daily activity and a rehabilitation technique.
To strengthen awareness, the device detected and notified the user of an unbalanced situation
before a fall. To do this, the team had to identify an appropriate signal that was sensitive to
balance control and maintains high accuracy. The sensor that monitors this signal must be
positioned in an accessible location to maintain ease of use of the device (Figure 32).
90
Sensitive
to balance
control
?
Accessible
Location
High
Accuracy
Figure 32: Factors signal and sensor need to fulfill.
The team identified three signals that were currently used to monitor balance control:
pressure under the foot, acceleration of the body, and tilt of the upper body at the hip as shown in
Figure 33 (Ward, Evenson, Vaughn, Rodgers, & Troiano, 2005). Tilt was eliminated because it
was not sensitive to balance control (Mathie, Coster, & Lovel, 2004). Through research, the team
identified that acceleration of COM was a key factor in determining a person‘s ability to stay
balanced (Pai & Patton, 1997). In addition, the team found that pressure under the foot can
indicate where a person‘s COM is located. However, research showed that location of COM
along the BOS was not the factor that determines a person‘s balance condition, but the
acceleration of a person‘s mass can dictate if a person is balanced (Pai & Patton, 1997). In
addition, acceleration was shown to be the most accurate measure of balance control during the
STS activity and is often used in research to assess balance control (Winter D. , 1995), (Gross,
Stevenson, Charette, Pyka, & Marcus, 1998). Acceleration is most accurately monitored on the
trunk, which would be an accessible location (Ward, Evenson, Vaughn, Rodgers, & Troiano,
91
2005). On the other hand, pressure under the foot would require the device to be located at the
feet. It has been shown that elderly have trouble putting on shoes and socks, so a device similarly
worn on the foot could be difficult for the elderly to use (Dunne, Bergman, Rogers, & Rivara,
1993).
Figure 33: Signals to monitor balance control (pressure, acceleration, tilt).
Therefore, as shown in Figure 34 acceleration was chosen as the signal to monitor during the
STS and a triple-axis accelerometer was used as the sensor because it has high accuracy in
monitoring balance control in accessible locations (Gross, Stevenson, Charette, Pyka, & Marcus,
1998).
92
Figure 34: Choosing the Device Signal and Sensor.
4.3.3
Choosing the Location
The two goals of the project were to proactively force user rehabilitation and strengthen the
user‘s awareness of their balance condition. In order to force rehabilitation, the device required
the user to perform the STS activity. To strengthen awareness, the device monitored acceleration
and detected and notified the user of an unbalanced situation (abnormal acceleration) before a
fall. Therefore, the team identified the location to monitor acceleration during the STS that is the
most accurate and sensitive to balance control, and maintains comfort and ease of use of the
device (Figure 35).
93
Sensitive to
change in
balance
control
Easy to put
on & take
off the
device
?
High
Accuracy
Comfortable
Figure 35: Factors location of device needs to fulfill.
The team identified that the trunk was the most sensitive location for monitoring
acceleration of the body (Gross, Stevenson, Charette, Pyka, & Marcus, 1998). Specifically, the
sternum, hip, and lower back, shown in Figure 36, were the three locations most sensitive to
monitoring balance control because they are closest to the body‘s COM. Since the device has to
be comfortable and easy for the user to put on and take off, the team eliminated the sternum
location because a device placed here would require the user to lift their arms. In addition, the
team found through research that the most sensitive location on the trunk for monitoring balance
control was the hip (Ward, Evenson, Vaughn, Rodgers, & Troiano, 2005). The lower back was a
difficult place to reach and locate. While sitting, the device would also be more prone to being
bumped if placed on the lower back.
94
Figure 36: Possible locations of device (http://www.ehow.com/how_4629008_draw-personstanding.html).
Therefore, the team eliminated lower back and chose to monitor acceleration during the STS at
the hip as shown in Figure 37. The hip bone is a universal anatomical marker making the device
user-friendly and since the hip is a reliable location for measuring acceleration, it ensures high
accuracy.
Figure 37: Choosing the Device Location.
4.3.4
Choosing the Method of Analyzing Acceleration Data
The two goals of the project were to proactively force user rehabilitation and strengthen the
user‘s awareness of their balance condition. In order to force rehabilitation, the device required
the user to perform the STS activity. To strengthen awareness, the device monitored acceleration
and detected and notified the user of an unbalanced situation (abnormal acceleration) before a
95
fall occurred. Therefore, the team identified the most accurate, repeatable method of analyzing
acceleration of the COM that clearly illustrated the difference between a balanced and
unbalanced STS (Figure 38).
Sensitive
to balance
control
?
Repeatable
Accurate
Figure 38: Factors method of analysis needs to fulfill.
Through research the team found that the signal of the COM was directly related to its
acceleration in the A/P and M/L directions (Winter D. , 1995). In particular the magnitude and
frequency of this signal and reaction time of the subject were the most important in classifying
the balance control (Winter D. , 1995). The team identified 5 potential methods for analyzing
frequency, magnitude, and time duration of acceleration: Fast Fourier Transform (FFT),
acceleration on the X-axis, acceleration on the Y-axis, acceleration on the Z-axis, and route sum
of squares of the X-Y-Z axis. FFT is used to enhance or remove periodic noise in a signal and
yields the power of the signal as a function of the frequency. Although FFT is an accurate means
of assessing balance control, research showed that analysis of a short record can result in
erroneously high means and median frequencies (Winter D. , 1995). Since the STS activity is
short, only lasting approximately 3 seconds, we eliminated the FFT method of analysis.
96
Research also shows that the signal of our COM is directly related to its acceleration in
both the A/P and M/L directions. Therefore, we eliminated the methods of analyzing acceleration
on the X, Y, or Z-axis independently and decided to use the root sum of squares method in order
to analyze acceleration of the COM in all planes of movement.
Using the root sum of squares method of analysis, the team could look at one of two
parameters of the graph: amplitudes or time variations. Research showed that as acceleration of
the COM increased, a person became closer to their ―stability limit‖, meaning they became more
likely to lose their balance and fall (Pai & Patton, 1997). Studies also showed that the duration of
the STS differs depending on the speed of the movement. According to this research, if a person
accelerated quickly during the STS they became more unbalanced and the duration of the STS
got shorter. On the other hand, if the person accelerated slowly during the STS they can maintain
balance more easily and the duration of the STS got longer. Therefore, the team decided to
analyze the time duration of the STS activity (Figure 39).
Figure 39: Choosing the Method of Analysis.
97
4.3.5
Final Solution
The two goals of the device were to proactively force user rehabilitation and strengthen
the user‘s awareness of their balance condition. In order to do this, operation of the device
requires the user to perform the STS rehabilitation activity which is a repetitive daily activity and
most sensitive to balance control. To strengthen awareness, the device is worn on the right hip
and monitors acceleration in all planes of movement during the STS activity. Finally, the device
detects an abnormal acceleration indicative of an unbalanced situation and instantly alerts the
user of the imbalance. Therefore, the team answered the four questions as follows:
1. What activity should be monitored? The STS rehabilitation and daily activity
2. Where should the device be located? At the right hip bone
3. What signal and sensor should be used? Acceleration will be monitored with a triaxial accelerometer.
4. How should the signal be analyzed? Analyze time duration of STS looking at the
magnitude of the x, y, and z axis of acceleration
Since the most accurate and sensitive means to monitor balance control during STS was
by acceleration at the hip, the hip-mounted accelerometer (Preliminary Design 2) was shown to
be a feasible conceptual design. The team hypothesized that the time duration of the STS would
be longer when a person was balanced and shorter during an unbalanced STS. To verify the
accuracy and repeatability of this method, the team performed preliminary testing which is
discussed in the following section.
4.4
PRELIMINARY EXPERIMENTS
The purpose of the device was to detect an unbalanced STS in terms of acceleration and notify
the user when an unbalanced STS occurs. In order for the device to do this, the team needs to
98
develop an algorithm or a set of well-defined instructions to completing a task. In this project,
the task was to notify the user of unbalanced situation. Therefore, the team needed to conduct
preliminary testing to identify a significant difference between the acceleration patterns of a
balanced and unbalance STS. In particular, the team needed to verify that the time duration of the
STS would be longer when a person was balanced and shorter during an unbalanced STS. This
sections details the methods used to verify the hypothesis, results, and conclusions drawn from
preliminary testing.
4.4.1
Materials and method
Preliminary tests were conducted to identify significant differences between the acceleration
patterns of a balanced STS situation and unbalanced STS situation. Nine healthy subjects
participated in preliminary testing. One subject (male, age 11) was eliminated from testing
because he did not perform the STS properly. Subject information can be found in Table 10. The
SparkFun KinetaMap (SparkFun Electronics, 2009) data logger (Figure 40) containing an
ADXL345 tri-axial accelerometer (Sparkfun Electronics, 2009) was used for collecting
acceleration data. The AMTI AccuSway force platform and AMTI NetForce and BioAnalysis
software were used to record and analyze balance control data, respectively. Acceleration data
were collected from each subject. Force platform data were not collected from subjects 5, 6, 7, 8
because these tests were performed in a home setting and the force platform was not available in
this location. Force platform data were collected from all other subjects.
99
Figure 40: KinetaMap Triple-Axis Accelerometer and Data Logger (SparkFun Electronics,
2009).
Table 10: Subject information
1
2
3
F
F
F
Gender
20
21
21
Age
5‘ 8‖ 5‘ 5‖ 5‘ 7‖
Height
70
63
Mass (kg) 67
4
M
21
5‘ 1‖
63
5
6
7
8
F
53
5‘2‖
67
M
23
5‘ 11‖
82
M
63
5‘ 10‖
75
F
50
5‘ 1‖
59
The force platform and a regular chair were set up as shown in Figure 41. The force
platform was placed directly on the ground. A wooden platform, the same height as the force
platform was placed adjacent to the force platform. The chair was placed on top of the wooden
platform and in front of the force platform so that when the subject sat in the chair her feet rested
comfortably on the force platform. The KinetaMap was attached with Velcro to an adjustable
belt. The belt was positioned so that the KinetaMap was mounted on the right side of the
subject, externally adjacent to the iliac crest (Figure 42).
100
Figure 41: Chair and force platform experimental set-up.
Figure 42: Attachment of the KinetaMap device.
The subject first stood still with feet shoulder-width apart on the force platform. Their
weight was collected and saved in NetForce software. The subject then sat in the chair and
NetForce data collection was started. The subject then turned on the KinetaMap, and waited for
the KinetaMap‘s LED to start blinking blue, signifying that the accelerometer had started
collecting data. Ten seconds after the LED started blinking blue, the subject stood up from the
seated position. Ten seconds after the subject reached a balanced standing position, the subject
turned the KinetaMap off to stop data collection. This was repeated 10 times with the subject‘s
feet positioned shoulder-width apart while performing the STS (Figure 43) and 10 times with the
subject‘s feet positioned in tandem (Figure 44). Subjects who conducted preliminary testing in
the home setting performed a minimum of 5 tandem and shoulder-width STS trials due to time
101
constraints of the subjects‘ schedules. After each STS trial, the subject rated their comfort on a
scale from 1-5 (1 being completely unbalanced, 5 being completely balanced).
Figure 43: Shoulder-width foot position representing a balanced condition.
Figure 44: Tandem foot position representing an unbalanced condition.
The KinetaMap collected data at 20Hz and logged each trial in a Microsoft Excel
document in terms of time and the X, Y, and Z components of acceleration. The X, Y, and Z
components of acceleration were converted into m/s2 using the ADXL345 Tri-Axial
accelerometer data sheet (Appendix A). The raw data were multiplied by 18mg/digit and divided
by 9.8 m/s2 (See Appendix J). These data were used to plot the X, Y, and Z components of
acceleration and magnitude of the acceleration in Microsoft Excel. An offset of about 9.8 m/s2
was observed in each plot due to gravity. Therefore, the average of the first 5 seconds of
102
acceleration data were subtracted from the entire data set in order to zero each plot. The team
then quantitatively compared the X, Y, Z, and root-sum-squares plots of the unbalanced and
balanced trials to identify differences. The NetForce data files were imported into BioAnalysis
software, and plots of COP were obtained.
The COP data for the tandem trials were
quantitatively compared to the COP of the shoulder-width trials to determine if the subjects were
more off balance and quantitatively represent their balance control. The COP data were also
compared to the subject‘s comfort level.
4.4.2
Results of Preliminary Testing
Results of preliminary testing showed that the STS activity produces an acceleration curve as
shown in Figure 45 and contained a positive and negative amplitude of acceleration. The positive
amplitude of acceleration corresponded to when the subject flexed the hips to sway forward
during the STS activity. The negative amplitude of acceleration corresponded to when the
subject extended the lower limbs to sway backward during the STS activity. The peaks of these
two amplitudes (red and blue squares) represented the forward sway and backward sway of the
STS, respectively.
103
Figure 45: Root Sum of Squares of Acceleration of the STS in relation to hip flexion and
extension of lower limbs.
Through quantitative assessment, the team observed that the time between the two peaks
was longer in the shoulder-width trials than in the tandem trials as shown by Figure 46. This was
consistent with research that showed if a person accelerated quickly during the STS they became
more unbalanced and the duration of the STS got shorter. On the other hand, if the person
accelerated slowly during the STS they can maintain balance more easily and the duration of the
STS got longer. In addition, the team observed that each plot had baseline noise and that in some
occasions the final baseline did not equal zero. This is due to the change in tilt of the device
from the start to the end of the activity.
104
Figure 46: Example of shoulder-width (black) and tandem (green) acceleration curves
showing the time duration measured (between organge lines).
The COP plots of the tandem and shoulder-width trials verified that the shoulder-width
trials were balanced and tandem trials were unbalanced (Figure 47). The unbalanced tandem
trials showed a large variation of the COP (green), which showed that the subject‘s COM moved
across a large area. On the other hand, the balanced shoulder-width trails showed less variation
as seen by the more compact black circle. This showed that the subject‘s COM did not move or
sway across a larger area and the subject maintained their balance.
Figure 47: COP plots of tandem (green) and shoulder-width (black) trials.
The average times between the positive and negative peaks are shown for each subject in
the bar graph Figure 48 and data are listed in Tables 11 and 12. The average time of shoulder105
width trials was greater than in tandem trials for all subjects tested and was significantly different
in subjects who performed 10 shoulder-width and 10 tandem trials. P-values are listed in Table
13. The average comfort ratings for each subject (Tables 11 and 12) were greater for shoulderwidth trials than tandem trials.
Figure 48: Average time between peaks (RL: 1, 2, 3, 4, 5, 6, 7, 8,).
Table 11: Results of shoulder-width trials
Subject
# of Trials
1
2
3
4
5
6
7
8
35
10
10
10
7
5
5
5
Average
Comfort
Level (1-5)
5
5
5
5
5
5
4.8
5
Average
Time (s)
0.85
0.71
0.71
0.59
0.55
0.75
0.74
0.35
Standard
Deviation
0.20
0.26
0.14
0.28
0.16
0.05
0.10
0.06
Coefficient of
Variance
p-value
0.23
0.37
0.19
0.48
0.29
0.07
0.23
0.17
0.01
0.01
0.02
0.02
0.10
0.01
0.12
0.23
106
Table 12: Results of tandem trials
Subject
1
2
3
4
5
6
7
8
# of
Trials
11
10
10
10
7
5
5
5
Average
Comfort
Level (1-5)
3.4
4
3.8
3.8
3.5
3
3.6
3.8
Average
Time (s)
Standard
Deviation
0.45
0.40
0.49
0.31
0.41
0.55
0.65
0.26
0.16
0.18
0.22
0.19
0.18
0.10
0.06
0.14
Coefficient
of
Variance
0.35
0.45
0.44
0.60
0.44
0.18
0.09
0.55
p-value
0.01
0.01
0.02
0.02
0.10
0.01
0.12
0.23
Table 13: p-values comparing average shoulder-width to average tandem time between
peaks
Subject
1
2
3
4
5
6
7
8
4.4.3
# of Trials
11
10
10
10
7
5
5
5
p-value
0.01
0.01
0.02
0.02
0.10
0.01
0.12
0.23
Conclusions of Preliminary Results
Based on preliminary results the team verified that the time between the positive and
negative peaks of the STS acceleration curve was longer in shoulder-width trials than in tandem
trials. Through client feedback and COP data, the team also showed that tandem trials
represented an unbalanced situation and shoulder-width trials represented an unbalanced
situation. Since the time between peaks was significantly different (p<0.05) for all subjects who
107
performed 10 tandem and 10 shoulder-width STS‘s, the team concluded that a specific time
range corresponds to a balanced STS and a specific time range corresponds to an unbalanced
STS. The preliminary data showed similar results between subjects of the same gender and age,
however not enough data were collected to show that these similarities were significant.
Therefore, the time ranges were specific to the individual and the team designed specifications
according to the data of one particular subject. The following section discusses how the team
conceptualized specifications and made decisions regarding the final design.
4.5
Conceptual design
The purpose of the device is to detect an unbalanced STS in terms of acceleration and
notify the user when an unbalanced STS occurs. Based on preliminary results, the time between
the positive and negative peaks of these amplitudes was significantly longer in shoulder-width
trials than in tandem trials. Therefore, the team concluded that a specific time range
corresponded to a balanced STS and a specific time range corresponded to an unbalanced STS.
These time ranges were specific to the individual. Based on this finding and necessary functions
of the device, the team brainstormed the steps that would enable the device to detect an
unbalanced situation and directly notify the user. These steps included:
1. Detect the maximum peak of the positive amplitude
2. Detect the minimum peak of the negative amplitude
3. Calculate the time difference between the maximum and minimum peaks
4. Notify the user if a specified time is calculated
108
Given these specific steps, the team researched and brainstormed electronic components that
would enable the device to achieve these functions. A Morphological chart was developed to
organize necessary functions and potential means.
Table 14: Morphological Chart-Electronic functions and means
Functions
Means
1
2
Arduino Microcontroller
VEX
Notify user
Buzzer
Vibration
LED
Power device
Rechargeable batteries
Throw-away
Lithium
batteries
Battery pack
Toggle switch
Slide-switch
Detect peaks; Calculate time
3
between peaks
Turn on/off
Button
Monitor acceleration
ADXL345 accelerometer
To detect the peaks and calculate the time between the peaks, the device needed to
contain a microcontroller. Two microcontrollers were identified: the Arduino Duemilanove and
the Vex. The Arduino Duemilanove was chosen because it has open source software, so there
were many resource materials, example codes, tutorials and other reference materials online. In
order to notify the user of imbalance, the device could buzz, vibrate, or light up. During an
interview an elderly client stated that a sound would be the best way to notify the user.
Therefore, a buzzer was chosen as the best means of notifying the user. Since the team chose to
use the Arduino, the device required a Lithium battery pack as its power source. When
determining the best means of turning the device on and off, the team considered which type of
switch would be least likely to get bumped and turn the device on or off unintentionally.
Therefore, a slide switch was chosen. The ADXL345 accelerometer was chosen to monitor
acceleration because it is the accelerometer in the KinetaMap which was used in testing.
109
In order to understand the gravitational effect on the accelerometer and the offset values
we obtained, as well as the change in offset before and after the STS motion, tabletop testing was
performed to understand how acceleration offset values changed as the device is tilted.
The first test performed was the z axis rotation test and was used to determine if changes
in the orientation relative to gravitational acceleration will yield a different static offset in the
device. On each axis, device was positioned with Z axis parallel to gravitation acceleration, with
positive end of the axis point upward on a table top. Device was tipped forward, so that the Z
axis was offset by approximately 45 degrees relative to gravitational acceleration vector, device
was held in this position for some duration of time. Then device was further-tipped forward, such
that the switch-face of the device was against the tabletop and Z axis was perpendicular to
gravitational acceleration. Plots were created for X (Figure 49), Y (Figure 50), and Z (Figure 51)
axis as well as a Magnitude plot (Figure 52) to demonstrate the observed change in baseline
value at different orientations.
X Axis Acceleration
5
Acceleration (m/s^2)
4
3
2
1
0
-1
0
10
20
30
40
50
60
Time (sec)
Figure 49: X axis acceleration during Z axis tilt
110
Y Axis Acceleration
0
Acceleration (m/s^2)
-2
0
10
20
30
40
50
60
-4
-6
-8
-10
-12
Time (sec)
Figure 50: Y axis acceleration during Z axis tilt
Z Axis Acceleration
12
Acceleration (m/s^2)
10
8
6
4
2
0
-2 0
-4
10
20
30
40
50
60
Time (sec)
Figure 51: Z axis acceleration during Z axis tilt
111
Magnitude of Acceleration
Acceleration (m/s^2)
12
10
8
6
4
2
0
0
10
20
30
40
50
60
Time (sec)
Figure 52: Magnitude of Acceleration during Z axis Tilt
Next x axis rotation tests were performed and the device was positioned with X axis
initially positioned 90 degrees askew relative to gravitational acceleration (with the same starting
position as described for the Z axis test). The device was then tipped approximately 45 degrees,
with the +X axis coming more closer to the gravitational acceleration vector (pointing
downward). This position was then held, followed by the device being tipped to a position where
the +X axis pointed approximately parallel to the gravitational acceleration vector (downward).
X (Figure 53), Y(Figure 54), and Z (Figure 55) axis were again plotted, in addition to a
magnitude plot (Figure 56). Pulsatile noise artifacts were due to the imperfections of the
movement of the device (human hand).
112
X Axis Acceleration
2
Acceleration (m/s^2)
0
-2
0
10
20
30
40
50
-4
-6
-8
-10
-12
Time (sec)
Figure 53: X axis acceleration during X axis tilt
Y Axis Acceleration
2
Acceleration (m/s^2)
0
-2
0
10
20
30
40
50
-4
-6
-8
-10
-12
Tme (sec)
Figure 54 Y axis acceleration during X axis tilt
113
Z Axis Acceleration
0
Acceleration (m/s^2)
0
10
20
30
40
50
-0.5
-1
-1.5
-2
-2.5
Time (sec)
Figure 55 Z axis acceleration during X axis tilt
Magnitude of Acceleration
Acceleration (m/s^2)
12
10
8
6
4
2
0
0
10
20
30
40
50
Time (sec)
Figure 56 Magnitude of Acceleration during X Axis Tilt
114
Lastly y-axis rotation tests were performed and the device was positioned with the
positive Y axis pointing directly upward, in parallel with the gravitational acceleration vector.
The device was then rotated toward the USB port on the ‗top‘ of the device, thusly also creating
a change in the orientation of the Z vector relative to gravity, first at approximately 45 degrees,
followed by a perpendicular orientation. Observed below are the X (Figure 57), Y (Figure 58), Z
(Figure 59), and magnitude (Figure 60) changes for this procedure. Note that during any change
in orientation of the device, more than one axis will be effected.
X Axis Acceleration
5
Acceleration (m/s^2)
4
3
2
1
0
-1
-2
0
10
20
30
40
50
Time (sec)
Figure 57: X axis acceleration during Y axis tilt
115
Y Axis Acceleration
0
Acceleration (m/s^2)
-2
0
10
20
30
40
50
-4
-6
-8
-10
-12
time (sec)
Figure 58: Y axis acceleration during Y axis tilt
m/s^2
Z Axis Acceleration
6
4
2
0
-2 0
-4
-6
-8
-10
-12
-14
10
20
30
40
50
Time (sec)
Figure 59: Z axis acceleration during Y axis tilt
116
Magnitude of Acceleration
14
12
m/s^2
10
8
6
4
2
0
0
10
20
30
40
50
time (sec)
Figure 60: Magnitude of Acceleration during Y axis Tilt
Table 15: Change in magnitude of acceleration due to tilt on X, Y, and Z axis
Axis of rotation
Maximum change in magnitude value
X
0.9 (m/s2)
Y
0.7 (m/s2)
Z
1.4 (m/s2)
Note that this greater observed change in Z axis data due to gravitational acceleration is
consistent with the higher 0g bias sensitivity as noted on the ADXL 345 datasheet, as shown
below in Figure 61.
Figure 61: ADXL345 Data Sheet 0g Bias Level
117
After the team identified the components of the device, the design team brainstormed and
researched how the components would interface to notify the user of an unbalanced situation.
First, sample code was used to verify that the buzzer could make a sound and that the
accelerometer could collect data. In order for the device to detect the maximum and minimum
peaks, the team chose to design the device such that it did not look at the baseline noise. This
eliminated the possibility of the device identifying a peak in the baseline as a maximum or
minimum peak. Therefore, after a certain baseline was reached the device would start looking for
the maximum and minimum peaks. The following (Figure 62) is the basic block diagram of the
designed algorithm.
Figure 62: Block diagram of algorithm.
The buzzer would sound if an unbalanced situation occurred and reset if a balanced
situation occurred. To specify the difference between subject 1‘s unbalanced and balanced STS,
the time range for a balanced STS and unbalanced STS was calculated by adding and subtracting
the standard deviation to and from the corresponding average time. Subject 1‘s time ranges are
shown in Table 16.
Table 16: Calculation of Subject 1’s time range
Subject 1
Tandem
Shoulder-width
Average
Time (s)
0.45
0.85
Standard
Deviation
0.16
0.20
Time Range
(s)
0.29 – 0.61
0.65- 1.1
118
The team decided that above an expected time (Te) would classify as balanced and below
the same expected time, Te, would classify as unbalanced. In choosing Te the team chose a
threshold acceleration that encompassed as many unbalanced situations as possible without
having false errors. Therefore, the team chose 0.60 seconds, the latter end of the tandem time
range, as the expected time. If the device calculated a time equal to or less than the expected
time, then the device would buzz. If the device calculated a time greater than the expected time,
then the device would reset as shown in Figure 63.
Figure 63: Block diagram of device function.
The device was created for subject 1 based on this conceptual design. The final design is
described in following section.
119
5
FINAL DESIGN
The purpose of the device is to detect an unbalanced STS in terms of acceleration and
notify the user when an unbalanced STS occurs. The team found that the STS activity produced
an acceleration curve that contained a positive and negative amplitude of acceleration that
corresponded to the forward and backward sway of the STS activity, respectively. Based on
preliminary results, the time between the positive and negative peaks of these amplitudes was
significantly longer in shoulder-width trials than in tandem trials. Comfort ratings of all subjects
and COP plots confirmed that shoulder-width trials represented a balanced situation and tandem
trials represented imbalance. Therefore, the device was designed to calculate the time interval
between the positive and negative peaks of the STS acceleration curve and determine if the time
corresponded to a balanced or an unbalanced situation. In preliminary testing the time between
peaks was not shown to be significantly similar between subjects, so specifications were
designed based on the data obtained from Subject 1. This section details the functions,
specifications, and components used in the final design.
5.1
OVERVIEW OF FINAL DESIGN
Our final design and wearable balance control indicator is called Duino Balance and is
shown in Figure 64. The device was enclosed in a plastic project box and is attached to a belt that
can be worn around the user‘s waist. The overall size of the device is 4 inches long by 2.5 inches
wide by 2 inches tall and weighs about 2 pounds.
Figure 64: Duino Balance: A Wearable Balance Control Indicator.
120
The belt is worn around the user‘s waist with the device located on the right hip as shown
in Figure 65. The device is only be worn when performing the STS activity and provides instant
feedback to the user about their balance control. If the user is balanced during the STS activity
then the device does not buzz. However, if the user unbalanced during the STS activity, then the
device buzzes for 3 seconds.
Figure 65: Placement of device on user.
5.2
DESIGN COMPONENTS
Duino Balance consists of three main components, an ADXL345 tri-axis accelerometer,
Arduino Duemilanove Microcontroller Board, and a CEM1203 buzzer. The device also includes
a rechargeable battery pack and slide switch for powering the device, as well as a protoboard for
connecting and attaching all the components.
The primary component of our device is the Arduino Duemilanove microcontroller board
(Figure 66). In our device, the Arduino microcontroller board is used to collect the data from the
accelerometer, process the data, and sound a buzzer if necessary. One of the key components on
the Arduino board is the USB connector (A to B plug) which can be used to connect the board to
a computer to program a code onto the board, or to charge or power the board. The board
requires between 7 and 12 Volts of power to run properly. Another important component is the
121
power connector which can be used to connect the device to a 9V wall adapter plug, allowing the
device to be charged through a wall outlet. The digital, analog, and power inputs can be used to
connect additional components to the board.
Lastly, the main component of the Arduino
Duemilanove board is the ATmega168 Microcontroller which was used for the digital signal
processing. (Arduino, 2009)
Figure 66: Arduino Duemilanove Microcontroller Board (Arduino, 2009).
The board can be programmed using Arduino software, which is open source software based on
the C/C++ programming language. Code is stored on the Arduino using internal 16KB of Flash
memory. Since this is open source software, there are a lot of resource materials, example codes,
tutorials and other reference materials online. The board is 2.1‖ wide by 2.95‖ long by 0.6‖ tall
and is shown in Figure 67 relative to a 6 inch A to B USB plug. (Arduino, 2009)
122
Figure 67: Size of Arduino and its size relative to a 6 inch A to B USB plug (Arduino, 2009).
The most important component of our device is the ADXL345 accelerometer (Figure 68)
that is used to sense accelerations patterns during the STS activity. One of the reasons we chose
this specific accelerometer because it is the same accelerometer in the SparkFun KinetaMap that
we used in preliminary testing. Also according to the ADXL345 Data Sheet, ―the ADXL345 is
well suited for mobile device applications. It measures the static acceleration of gravity in tilt
sensing applications, as well as the dynamic acceleration resulting from motion‖ (Analog
Devices, 2009). The ADXL345 is a low power, tri-axial accelerometer that can be set to
different sensitivities, but for our application is set to +/-2g. This accelerometer is attached to a
breakout board allowing for a simple connection to the Arduino microcontroller board (Sparkfun
Electronics, 2009). The accelerometer is connected to the analog pins of the Arduino using an
I2C configuration. This allows the Arduino to process the data collected by the accelerometer.
123
Figure 68: ADXL345 Tri-axis Accelerometer (Sparkfun Electronics, 2009).
A buzzer is also included in our device to alert the user of an off balance situation. The
buzzer produces a loud sound at 2.04 kHz and is shown in Figure 69, where its size is compared
relative to a U.S. quarter (Sparkfun Electronics, 2009). The Arduino processes the data from the
sit to stand activity and determines whether or not to sound the buzzer.
Figure 69: CEM 1203 Buzzer (Sparkfun Electronics, 2009).
Since the Arduino microcontroller board requires 7-12V of power, another component of
our device is a lithium battery pack because otherwise the device would require connection to a
computer constant connection to a computer. This component allows the device to be both
wireless and portable. The high capacity lithium battery attaches to the Arduino Duemilanove
with screws through the holes in the Arduino board, and fits below the Arduino board (Figure
124
70). The PCB board that the battery is attached to is the same size as the Arduino board, and the
height of the battery is approximately 0.4 inches. The battery can provide power to the device
for up to 29 hours, this would allow the user to perform the STS activity many times before
recharging the device. There are several ways the battery pack can be charged including using
the USB plug on the Arduino to connect a computer, a mini-USB to connect the battery pack to a
computer or a wall adapter plug (Huynh, 2009).
Figure 70: Rechargeable battery pack (left) and battery attached to Arduino (right)
(Allum, 1999) (Arduino, 2009).
The user charges our balance control indicator using a 9V wall adapter plug. This 2.5mm wall
adapter plug with a positive center (Figure 71) connects to the power connector on the Arduino
board. The Alternative Current (AC) from the wall is converted to 9V Direct Current (DC) that
is used to charge the battery pack that powers our device. (Maker Media, 2009)
Figure 71: 9V Wall Adapter Plug (Maker Media, 2009).
125
A slide switch like the one shown in Figure 72 is used to turn the device on and off. (Digikey,
2009) This type of switch was selected because we want an elderly user to be able to easily turn
the device on and off.
Figure 72: On-Off Slide Switch (Digikey, 2009).
Lastly, a ProtoShield board (Figure 73) was used as a PCB with attached header pins that
connect directly to the header pins on the Arduino (Sparkfun Electronics, 2009). The board was
used to attach the accelerometer, buzzer, two 2k resistors and a 100Ω resistor both of which are
needed to reduce the power from the Arduino to the accelerometer and buzzer.
Figure 73: ProtoShield Board (Sparkfun Electronics, 2009).
5.3
BUILDING THE DEVICE
A schematic diagram of the device is shown in Figure 74, where the ADXL345
accelerometer is shown in red, Arduino Duemilanove Microcontroller Board is shown in blue,
126
and the CEM1203 buzzer is shown in green.
Figure 74: Schematic of Device.
The Arduino Duemilanove Microcontroller supports both SPI and I2C communication.
However, the Arduino programming language does not have functions for SPI communication;
therefore we connected the ADXL345 accelerometer to the Arduino using I2C (Inter-Integrated
Circuit). I2C wiring connections between the Arduino and ADXL345 accelerometer are shown
in Figure 74. The I2C pins on the Arduino are Analog pins 4 and 5, where analog pin 4 is wired
to the Serial Data (SDA) pin on the accelerometer and analog pin 5 is connected to Serial Clock
(SCL) pin on the accelerometer (Arduino, 2009). Pull up resistors, the 2k resistors shown in
Figure 74 were suggested in the data sheet for the accelerometer, are needed to reduce the
voltage from the Arduino because the ADXL345 cannot handle more than 3.6V (Analog
Devices, 2009). The SDO pin on the ADXL345 was connected to ground on the Arduino. The
3V3 and CS pins on the accelerometer were connected to the 3V3 pin on the Arduino.
127
One lead of the CEM 1203 buzzer was connected to digital pin 4 on the Arduino
Microcontroller Board and the other was connected to ground. A 100Ω resistor was connected
between pin 4 and the buzzer because the current from the Arduino was too high for the buzzer
to handle. The proper resistor value was determined using the equations and calculations below:
𝑀𝑎𝑥𝑖𝑚𝑢𝑚 𝑐𝑢𝑟𝑟𝑒𝑛𝑡 𝑓𝑜𝑟 𝐴𝑟𝑑𝑢𝑖𝑛𝑜 = 40𝑚𝐴
𝐶𝑜𝑖𝑙 𝑟𝑒𝑠𝑖𝑠𝑡𝑎𝑛𝑐𝑒 = 42 Ω ± 6.3
𝐴𝑟𝑑𝑢𝑖𝑛𝑜 𝑉𝑜𝑙𝑡𝑎𝑔𝑒 = 5𝑉
𝑂𝑚′ 𝑠 𝐿𝑎𝑤 = 𝑉 = 𝐼𝑅
𝐼=
𝐼=
𝑉
𝑅
5𝑉
= 0.119𝐴 = 119𝑚𝐴
42Ω
𝐼 = 𝐴𝑐𝑡𝑢𝑎𝑙 − 𝑀𝑎𝑥 = 119𝑚𝐴 − 40𝑚𝐴 = 79𝑚𝐴
79𝑚𝐴 > 40𝑚𝐴
Since the current is greater than the Arduino can handle we added a resistor. If we add a 100Ω
resistor to the circuit:
𝑅 = 42Ω + 100Ω = 142Ω
𝐼=
𝑉
5𝑉
=
= 0.0352𝐴 = 35.2𝑚𝐴
𝑅 142Ω
With the 100 Ω resistor the current was 35.2 mA which is less than the maximum current for the
Arduino of 40mA. The 100 Ω resistor provided enough resistance to activate the buzzer.
128
Lastly, the rechargeable battery pack was connected to the 5V power pin and ground pin
on the Arduino Microcontroller Board. The battery pack provides enough power to operate the
device without being connected to a computer.
The final assembly of the device is shown in Figure 75. The battery pack was also
connected to a slide switch for turning the device on an off. Some foam was also added inside
the box on both sides of the device. The foam was used to prevent the device from moving
within the box because the box was too long.
Figure 75: Final Product of Device.
The list and size of all the components in the Duino Balance device is included in Table
17. The cost of each component and the total cost of the device is also listed. The total cost to
produce our device was $143.69. The myHalo Monitoring and BrickHouse fall detection
devices cost about $200 for the device plus additional monthly fees for the monitoring service.
(Halo Monitoring, 2009) The Wii gaming console and Wii Fit Balance Board costs approximate
129
$300. Therefore, the hardware of our device would not only be cheaper than the current
monitoring systems but also significantly cheaper in the long term because it would not require
monthly fees for monitoring.
130
Table 17: Cost of Device
Component
Cost
Size
$29.95
Length: 2.95”
Width: 2.1”
Height: 0.6”
Weight: 0.07 lb
$47.35
Length: 2.73”
Width: 2.1”
Height: 0.498”
Weight: 0.22 lb
Arduino
ProtoShield Board
$16.95
Length: 2.95”
Width: 2.1”
Height: 0.6”
Weight: 0.1 lb
ADXL345-3 Axis
Accelerometer Board
$27.95
Length: 0.79”
Width: 0.51”
CEM 1203 Buzzer
$1.95
Diameter: 0.47”
Height: 0.55”
Slide Switch
$1.55
Width: 0.2”
9V Wall Adapter Plug
$6.50
Arduino Duemilanove
Microcontroller Board
High Capacity Lithium
Battery Backpack
Length: 4”
Width: 2.5”
Height: 4”
Weight: 0.6 lb
Plastic Project Box
$3.69
3 Resistors
$0.30
2k (Qty:2)
100Ω
Laptop Shoulder Strap
$5.00
Weight: 1 lb
Velcro
$2.50
Total
$143.69
Length: 4”
Width: 2.5”
Height: 2”
Weight: 2 lb
131
5.4
PROGRAMMING THE DEVICE
As mentioned previously, the Arduino Microcontroller is programmed using the Arduino
software which is software that utilizes a programming language similar to C/C++. The code
was written in an Arduino sketch, compiled and uploaded onto the Arduino Microcontroller
Board through a USB.
Since through testing we determined that the time between the maximum positive
acceleration peak and minimum negative acceleration peak (Figure 76) was significantly
different for balanced and unbalanced trials, the device was programmed to detect these two
peaks and measure the time between them.
Figure 76: Acceleration curve for the STS activity showing the peaks and time between
them.
132
If the time between the peaks is greater than the expected time, then the user is considered
balanced and the device resets. However, if the time between the peaks is less than the expected
time the user is unbalanced and the device buzzes. Through testing, we determined that the
expected time between the peaks for subject 1 was 0.6 seconds, and the device was programmed
specifically for this expected time. The block diagram of the final design is shown in Figure 77.
Figure 77: Block Diagram of Final Design.
The program consisted of four main sections:
1. Defining and initializing the I2C communication between the Arduino and ADXL345
2. Reading and writing the data from the accelerometer
3. Processing the accelerometer data
4. Sounding the buzzer
Several of the parameters are defined as constants in the beginning of the program using
the #define function. The #define function was used to assign a constant value to a variable so
that whenever this variable is used throughout the code, the compiler replaced the variable with
the defined constant (Arduino Reference, 2009). The #define function was used specifically to
define the expected time between peaks, the threshold acceleration, expected length of time for
133
the entire STS activity and the duration time for the buzzer. This feature made the device easily
programmable for different users.
The first section of the program was used to define the address of the accelerometer and
initialize the I2C communication between the ADXL345 and the Arduino and was adapted from
an example code on the Arduino Forum (Arduino Forum, 2009). The first line of the program is
#include <wire.h> function, which was necessary to use the Wire library functions within the
Arduino software. The next several lines of code are used to define the address of the ADXL345
accelerometer and numbers of bytes, in this case 6, that the device reads using the #define
function. The device address found in the ADXL345 datasheet is 0x53 (Analog Devices, 2009).
Next the I2C communication is initialized using the Wire.begin function and the serial output is
set to 9600 bits/second (Arduino Forum, 2009).
The next section of the program was used to read and write the data from the ADXL345
accelerometer. The ADXL345 is turned on using the WriteTo function and the power control
register address 0x2D which is used to take the accelerometer out of sleep mode. Finally, the
regAddress function is used to read the registers for each of the three axes on the ADXL345
(Arduino Forum, 2009). The ADXL345 data sheet states that the address for the x axis is 0x32
and 0x33, the y axis is 0x34 and 0x35, and the z axis is 0x36 and 0x37 (Analog Devices, 2009).
The data from each axis is squared using the sq(x) function, then each square of each axis is
added together using the + operator, and the square root of this sum is taken using the sqrt(x)
function (Arduino, 2010) to represent the overall magnitude of the acceleration.
The third section of the code was used to process the accelerometer data, and is where the
parameters defined at the beginning of the code are used. One of the defined parameters is
134
StartMinA which is the threshold acceleration, for subject 1 this acceleration was determined
through testing to be 0.5 m/s2. Another important parameter is tE the expected time between the
maximum and minimum peaks, which for subject 1 is 0.6 seconds corresponding to the value 0.6
* 1000 milliseconds. Initially, tAA (time corresponding to the max acceleration), tAD (time
corresponding the minimum acceleration), AA (maximum acceleration) and AD (minimum
acceleration) are set equal to zero. TestStarted, TestFinished, and RingBuzzer were set to false.
The test is started and TestStarted is true when A, the current acceleration, is greater than
StartMinA. The time the test was started was defined as TimeStart and current time was defined
as T. The expected test length was defined at TestLength. In this section of code, If statements
were used. A moving time window was used to search for the maximum acceleration peak AA
and minimum acceleration peak AD. Therefore, throughout the duration of the test if A was
greater than the value stored as the maximum acceleration AA, and then AA was now equal to A.
Similarly, if A was less than the value stored as the minimum acceleration AD, then AD was now
equal to A. The values tAA for and tAD correspond the time at which AA and AD respectively
occurred, and these values change as AA and AD change. TestFinished was set to true when T
minus TimeStart was greater than the TestLength. When TestFinished is true, if tAD minus tAA is
less than tE then RingBuzzer is true. When TestFinished is true, and tAD minus tAA is greater than
or equal to tE then RingBuzzer is false.
The final section of the program was the code for RingBuzzer or to sound the buzzer.
The RingBuzzer code was modified from an example code by Rob Faludi (Faludi, 2007). The
function pinMode(4, OUTPUT)was used to define digital pin 4 on the Arduino as the output pin
for the buzzer. The buzzer was set to buzz at 2048 Hz for 3 seconds or 3000 milliseconds.
135
All four sections were integrated together to form the Duino Balance code which was
used to analyze a STS activity to determine whether the user is balanced or unbalanced, and
sound a buzzer for 3 seconds if the user is unbalanced. Figure 78 illustrates how the current
device works for subject 1.
Figure 78: Block diagram of device functions and specifications for subject 1.
136
6
DESIGN VERIFICATION
In order to verify that our device operated properly, we performed STS tests using the same
method that was used during preliminary testing except that our device was placed on the right
hip and the KinetaMap on the left hip. The subject sat in a chair with their feet on a force
platform, turned on both devices, and stood up from the chair with their feet shoulder width
apart. The same test was then performed with their feet in tandem. Ten shoulder width STS tests
were performed, followed by ten tandem tests. We used the KinetaMap and force platform data
to confirm whether the STS activity was balanced or unbalanced. The device was programmed
specifically for subject 1 with an expected time between the maximum and minimum
acceleration peaks of 0.6 seconds. During the STS activity, if the time between the peaks was
greater than 0.6 seconds then the trial was considered balanced and the device should reset
without a buzz. But if the time between the peaks was less than or equal to 0.6 seconds, the
device should buzz to indicate that the trial was unbalanced.
An example of the progression of one of the shoulder width STS trials is shown in Figure
79. During this trial, the subject appeared to remain balanced throughout the activity and the
device did not buzz.
137
Figure 79: Shoulder Width STS with Device.
In order to confirm whether the trial was balanced, we analyzed the KinetaMap data and
generated the acceleration vs. time plot shown in Figure 80. We identified the maximum and
minimum acceleration peaks shown by the blue circles in the figure and measured the time
between the two peaks. The time between the peaks was 0.95 seconds. This time was greater
than the expected time of 0.6 seconds, which was representative of a balanced trial.
Figure 80: KinetaMap acceleration vs. time data during Shoulder Width STS with device.
138
In addition, we used the COP data as another method to confirm whether the trial was balanced.
The COP data from the shoulder width STS trial is shown in black in Figure 81. The COP was
compact and had little variation, which was also representative of a balanced trial.
Figure 81 COP graph for shoulder width (black) and tandem (green) STS trial.
An example of a tandem STS test with the device is shown in Figure 82. The device
buzzed after this trial and visual analysis also suggested that the subject was unbalanced.
Figure 82: Tandem STS with Device.
139
In order to confirm whether the device successfully identified an unbalanced trial, we first
analyzed the KinetaMap data. The acceleration vs. time graph that we generated for this tandem
trial is shown in Figure 83. The maximum and minimum acceleration peaks were identified and
circled in blue. We determined that the time between these peaks was 0.45 seconds. This time
was less than the expected time of 0.6 seconds, which was representative of an unbalanced trial.
Figure 83: KinetaMap acceleration vs. time data during Tandem STS with device.
Similar to the shoulder width trials, we verified whether the trial was unbalanced by analyzing
the COP data from the force platform. The COP data for the tandem trial is shown in green in
Figure 81. As you can see, there was a greater variation in the green COP, which was consistent
with an unbalanced trial.
After we completed and analyzed the ten shoulder width and ten tandem trials, we
compiled the results and determined the accuracy of our device as shown in Figure 85. The COP
and KinetaMap data confirmed that all ten shoulder width trials were balanced, so the device was
not supposed to buzz at all during these trials. However, the device incorrectly buzzed and
140
produced a false alarm during one of the shoulder width trials. As a result, the device
successfully identified a balanced STS activity for 9 out of 10 shoulder width trials. Whereas for
the tandem trials, the COP and KinetaMap data identified all the trials as unbalanced, thus the
device was supposed to buzz for all ten trials. But the device correctly buzzed and indicated an
unbalanced situation during 8 out of the 10 tandem trials.
Table 18 Results of Device Testing
Therefore, the device was 90% accurate for balanced shoulder width STS trials and 80%
accurate for unbalanced tandem STS trials.
141
7
DISCUSSION
Testing of our final device revealed that our device correctly identified 9 out of 10
balanced trials. KinetaMap and COP data showed that all 10 trials were balanced; therefore the
device produced a false alarm for one trial. We noticed that when the KinetaMap shifted during
preliminary testing this caused a shorter time between the maximum and minimum acceleration
peaks. Therefore, the false alarm during the device verification testing could have been caused
by shifting of the device during the STS activity.
Testing of our final device revealed that our device correctly identified 8 out of 10
unbalanced trials. Kinetamap and COP data showed that all 10 trials were unbalanced; therefore
the device produced a false alarm for two trials. We noticed that when the KinetaMap shifted
during tandem preliminary testing, it caused a peak due to noise to have a more negative
acceleration than the actual peak that occurred during the backward sway. Therefore, the two
false alarms during the device verification testing could have been caused by shifting of the
device during the STS activity. Due to these results, one improvement for the device would be
creating an attachment that keeps the device secure and eliminates shifting during the STS
activity.
The functionality of the Duino Balance, balance control indicator device is fairly unique
in that no commercial device has been released to perform the same task, either by the same or
different means. One current device which bears the most similarity to the balance control
indicator is the Wii Fit videogame system, which is roughly based on a force platform with an
interactive videogame interface that tests the user‘s balance and rewards them for strengthening
their balance control. This device differs markedly from the balance control indicator in that it
does not integrate into the daily lives of the elderly, utilizing a complex graphical user interface
142
that will be unfamiliar and difficult for many elderly subjects to comprehend. Another device
with bears some similarity to the balance control indicator is the iShoe pressure mapping insole,
which has not been released to market but remains in a patent-pending status. This device is
worn underfoot and capable of measuring COP data and gathering balance control information
from the user. However, this device differs from the balance control indicator in that the results
are required to be interpreted by a professional and are far more complex than the simple
‗balanced or not balanced‘ logic implemented by the balance control indicator. Because of the
complexity of this device and the need for professional interpretation, it would not be useful in a
home situation to integrate into a user‘s daily routine. Because of the simplicity of interpreting
the balance control indicator‘s results as well as the ease of integration into the daily activities of
the elderly, it has clear advantages over the similar balance control indicating devices that
currently exist on the market or in product development.
The device differs from wearable fall indicators and PERS systems in its core
functionality. The fall indicators and emergency response systems are a capable means of
ensuring that elderly will receive proper attention after a fall has occurred, but neither addresses
the need for preventative measures that can minimize or eliminate the risk of fall. Whereas the
balance control indicator device will allow the elderly to strengthen their balance control,
potentially eliminating the risk of fall and resultant injury, the fall detection device will simply
be able to detect the fall once it has happened and reduce the risk of long-lie injuries and increase
the survival rate. PERS systems may be less effective as they require that the user be conscious
and capable of activating a call signal in order to receive help. The primary advantage present in
the balance control indicator device is the ability to reduce the risk of fall through preventative
exercises with instant feedback.
143
The objectives for the device, specifically strengthening of the user‘s awareness of their
balance condition and proactive forcing of user rehabilitation, were both met in the design of the
balance control indicator device. The Berg balance test indicates that the STS activity is a valid
indication of the user‘s overall balance control, and therefore by creating a device that provides
understandable feedback on the balance condition with which a user performs this activity the
device has succeeded in assisting the user in becoming aware of their balance control condition.
Whereas the user may not have been aware that he or she was in need of assistance in order to
become balanced before the application of the device, a sounding buzzer will notify the user that
he or she is not so balanced as he may have perceived. In the daily performance of the STS
activity, and by attempting to reduce imbalance so as to not trigger the device to sound, the user
will be forced to actively participate in rehabilitation. Without taking any extraordinary measure
(as using the device can easily be incorporated into the daily routine of the elderly), the elderly
user has taken a step towards the recognition and improvement of his or her balance condition.
The limitations to the data used to design the device would pose a quite passable
challenge in verifying the functionality of the device for direct use in the elderly population.
Foremost, the subjects used to gather information used to set device thresholds and values for
programming were healthy young subjects, mostly under the age of 30. The values that would be
obtained in elderly testing may vary, which would necessitate the reprogramming of the device.
As with any real world device, there is the possibility for error in the results given by the device
as well. Through preliminary testing, thresholds were collected that represented the data obtained
from most of the trials collected. There are, of course, trials which may have been balanced but
resulted in a peak-to-peak time duration of less than 0.6 seconds, and likewise for unbalanced
144
trials. Though there is this limitation, we do feel that in most instances our device will be able to
accurately distinguish balanced from unbalanced situations with minimal opportunity for error.
The clear and present economic benefits of the widespread implementation of a device of
this type are abundantly apparent. Minimization of healthcare dollars spent treating victims postfall could reduce overall national spending. With an aging population and a need for reduction in
healthcare dollars spent, the utility of preventative maintenance shines. A low cost in-home
device that can reach a widespread population and assist them in regaining their balance and
mobility could reduce overconsumption of natural resources used to produce other devices and
facilities that are needed after falls have occurred, specifically increased rehabilitation facilities
and products as well as mobility devices and intensive care resources.
The device has the capacity to reach a global market, in that it is low cost and that it is
needed globally in any culture where there are elderly people. In areas where there is a reduced
availability of healthcare a low-cost device that could prevent the need for expensive treatment
would be a welcomed alternative to having lower income brackets not receive the healthcare that
they need. Likewise, in developed areas with modernized healthcare a reduction of expenditures
related to post-fall healthcare costs would also be welcomed as well as the obvious benefits to
the quality of life of individuals that can avoid the devastating effects of a fall.
Despite advancements in treatment available to fall victims, the simplest means to avoid
lasting fall-related disabilities and quality of life limitations would be to avoid falling and
injuring oneself in the first place. Because of this, the device would succeed in addressing
improvements to the quality of life of subjects who used it properly to address balance control
issues before the issues resulted in a fall. By not only helping to prevent the lasting and
145
sometimes devastating effects of a fall injury, but also mitigating the financial ruin that can be
resultant of a costly hospitalization and rehabilitation following a fall, the device serves to
address the need for the elderly to live a good and satisfying life. This device would have a clear
influence on the health and personal safety of its users, as it would attempt to remediate a
potentially dangerous situation of an elderly person lacking proper balance.
Because of a simple and condensed list of components, and the low cost nature of the
device, it is very manufacturable. The prototype was built entirely from off-shelf components,
and could easily be optimized to minimize cost as well as reduce size and weight. The lithium
ion rechargeable battery pack contained within the device reduces the need for repeated use of
costly and environmentally-damaging alkaline batteries present in some electronics, though the
need for proper disposal of the device and rechargeable battery pack would need to be addressed.
In the prototype, all components in the design were RoHS compliant, or compliant in regard to
restriction of hazardous substances such as lead, cadmium, and mercury. In this sense, the device
is no more damaging to the ecological system than any other small consumer electronic device
such as a phone or mp3 player.
As can be seen above, the balance control indicator device addresses a need for a lowcost in-home balance indicator for use by the elderly to analyze their balance and alert them of a
lack of balanced state. The device was required by team-designed objectives to increase user
awareness of his or her balance control and proactively force user rehabilitation, both of which
the designed device was capable in its ability to do. The need for a low cost preventative device
that can reduce or eliminate the occurrence of costly hospitalizations and needless diminishment
of the quality of life of the elderly population due to falls is strongly presented in the staggering
healthcare costs associated with elderly post-fall hospitalization, and the fact that these costs will
146
be rising exponentially due to a growing number of elderly within only the next ten years. The
issue of an increased elderly population and thusly the need to maintain their quality of life is a
global one, and the creation of a low cost device that could be accessible to lower income
societies globally is an important step in the direction of improvement of the lives of elderly
from many different situations. Manufacturability and environmental consciousness were factors
that were considered during the production of the device, and because of this a device has been
designed that is very manufacturable and additionally is RoHS compliant.
147
8
DESIGN VALIDATION
Through preliminary testing, the team designed a device to be used during the STS activity that
detects and directly notifies the user of an unbalanced STS. The final device was tested for
subject 1 (college-age female) and buzzed during an unbalanced STS situation and did not buzz
during a balanced STS situation. Operation of the device required the user to perform the STS,
both a rehabilitation and daily activity. Thus, the device demonstrated its ability to strengthen the
user‘s awareness of their balance control and force user rehabilitation.
In addition, the design team verified that the design met client objectives by interviewing
physical therapist and an elderly user. Both reported that the design will be ―straightforward,
easy to use, and not cumbersome‖. In addition, both clients reported that it could be used in a
clinical setting such as a nursing home, physical therapy session, and also as additional tool to
assess a patient‘s fall risk (Appendix C). However, the device was not tested and verified on an
elderly user. Therefore, this section describes how the study can be continued to prove the
device‘s viability for elderly users.
8.1
PRELIMINARY TESTING WITH ELDERLY SUBJECTS
The designers need to prove that the current device is able to accurately detect and notify an
elderly user of an unbalanced STS and that it does not buzz during a balanced STS. This section
outlines the preliminary testing that needs to be conducted in order to customize the device for an
elderly user.
8.1.1
Materials and Methods
The team needs to gather all materials needed for the study. This includes at least 10 healthy
elderly subjects age 70 years or older. The health of the subjects should be evaluated by a
physical therapist. Subjects should score a 41 or above on the Berg Balance Test, meaning they
148
can walk independently without an assistive device or supervision (Internet Stroke Center, 2010).
In addition, the SparkFun KinetaMap data logger will be used for collecting acceleration data.
Set the parameters of the KinetaMap according to the parameters outlined in Appendix B. The
AMTI AccuSway force platform and AMTI NetForce and BioAnalysis software will be used to
record and analyze balance control data, respectively. A physical therapist should be present
during all tests to rate the subject‘s STS performance according to how well they maintained
their balance.
The force platform and a regular chair will be set up as shown in Figure 84. The force
platform will be placed directly on the ground and a wooden platform, the same height as the
force platform, will be placed adjacent to the force platform. The chair will be placed on top of
the wooden platform and in front of the force platform so that when the subject sits in the chair
their feet rest comfortably on the force platform. The KinetaMap will be attached with Velcro to
an adjustable belt. The belt will be positioned so that the KinetaMap is mounted on the right side
of the subject, externally adjacent to the iliac crest (Figure 85).
Figure 84: Chair and force platform experimental set-up
149
Figure 85: Attachment of the KinetaMap device
Using the NetForce Software, create a subject account for each subject. Press subject and
then add record. Enter the subject information. Select the first subject. Press weigh and then tare
and ask subject 1 to stand still with feet shoulder-width apart on the force platform. Click weigh.
Their weight will be collected and saved in NetForce software.
With the KinetaMap attached properly to the subject‘s right hip, ask the subject to sit in
the chair. Start NetForce data collection and press tare to start data collection. Ask the subject to
turn on the KinetaMap. Wait for the KinetaMap‘s LED to start blinking blue, which signifies that
the accelerometer has started collecting data. Ten seconds after the LED starts blinking blue, tell
the subject to stand from the seated position. Ten seconds after the subject reaches a balanced
standing position, tell them to turn the KinetaMap off in order to stop data collection.
Repeat this procedure 10 times with the subject‘s feet positioned shoulder-width apart
(Figure 86), giving the subject at least 3 minutes rest between trials and at least 2 hours rest
every 5 trials. If the subject is capable of standing with their feet in tandem, have the subject
repeat the same test except rising from the chair with their feet in tandem (Figure 87). The test
should be repeated 10 times with at least 5 minutes rest between trials and at least 2 hours rest
every 5 trials. If the subject is unable to stand or perform the STS with feet in tandem, the STS
should be repeated 20 times with feet shoulder-width apart, with 3 minutes rest between trials
and at least 2 hours rest every 5 trials. After each STS trial, ask the subject to rate their comfort
150
on a scale from 1-5 (1 being completely unbalanced and 5 being completely balanced). The
physical therapist should also rate the patient‘s balance control on the same scale after each trial.
Figure 86: Shoulder-width foot position representing a balanced condition.
Figure 87: Tandem foot position representing an unbalanced condition.
The KinetaMap collects data at 20Hz and logs each trial in a Microsoft Excel document
in terms of time and the X, Y, and Z components of acceleration. The X, Y, and Z components of
acceleration need to be converted into m/s2 using the procedure outlined in (see Appendix J).
Subtract the average of the first 5 seconds of acceleration data from the entire data set in order to
zero each plot. Calculate the magnitude of the acceleration as outlined in Appendix J for each
trial and plot the acceleration as a function of time. Import the NetForce data files into
BioAnalysis software to obtain the plots of COP.
151
8.1.2 Determine the Difference Between Balanced and Unbalanced STS
Next the team then needs to establish the difference between the subject‘s balanced and
unbalanced STS. This will be done by determining the expected time (Te) above which is
considered balanced and equal to or below which is considered unbalanced.
In order to calculate this value, first separate all trials into two groups: one containing all
data belonging to trials where the physical therapist rated the STS 3 (unbalanced) and the other
containing all data belonging to trials where the physical therapist rated the STS 3 (balanced).
There should be at least 10 trials in each category to prove that results are significant. If there are
less than 10 trials in either category, more data needs to be collected.
Verify that the trials rated 3 are unbalanced and the trials rated 3 are balanced by
qualitatively comparing the COP plots of each group. Unbalanced trials are characterized by a
larger variation of the COP than balanced trials (Figure 88).
Figure 88: a) COP plot for a balanced STS b) COP plot for an unbalanced STS.
152
After verifying that all trials are properly categorized as balanced or unbalanced, the team
needs to evaluate the acceleration plots. Each acceleration plot should have a positive and
negative amplitude. For each plot, calculate the time between the maximum peak and minimum
peak. Calculate the average time between peaks for balanced trials (STS 3) and unbalanced
trials (rated 3) and the corresponding standard deviation. Calculate the time range for a
balanced STS and unbalanced STS by adding and subtracting the standard deviation from the
corresponding mean. For example, if the mean is 5 and the standard deviation is 1, the range
will be 4-6. Choose Te by identifying the greatest time within the unbalanced time range that is
not included in the balanced time range. For example, if the balanced time range is 5.5-7.3 and
the unbalanced time range is 3.5-6, Te would be 5. Insert the new Te into the code as explained in
Section 5.4.
8.1.3
Verify the device
To verify the design, attach both the KinetaMap and the new device to the belt such that when
the belt is attached to subject 1 the new device is positioned at the right hip and the KinetaMap is
positioned at the left hip. With the belt attached, conduct the same testing procedure as was
performed in preliminary testing. During all trails, observers need to note whether the device
buzzes. And after each trial, the physical therapist and subject should rate the comfort level as
done in preliminary testing.
Using data from the KinetaMap, plot the magnitude of the acceleration for each trial and
calculate the time between the positive and negative peaks. Label the trial unbalanced if the
calculated time was less than or equal to Te and it should have buzzed. Label the trial balanced if
the calculated time was greater than Te and it should not have buzzed. For each trial, label what
actually happened during the test (buzz or no buzz). For balanced trials calculate the percentage
153
of times the device did not buzz and for unbalanced trials calculate the percentage of times it did
buzz.
Results should be at least 90% accurate for balanced trials, meaning that the device did
not incorrectly buzz for more than 10% of the trials. Results should be at least 80% accurate for
unbalanced trials, meaning that the device did not buzz for more than 20% of the trials when it
should have buzzed. If the device achieves the accuracy rates, then the device was successful at
identifying a balanced and unbalanced STS activity and thus notifying the user of their balance
control.
154
9
CONCLUSIONS AND FUTURE RECOMMENDATIONS
By creating a device that can proactively monitor balance control in the elderly population and
utilize a repetitive daily activity, we have impacted the ability of the elderly to become aware of
their own balance control and helped them to prevent falls and fall injuries. By developing a
device that is low cost and can be used with no professional intervention, we have enabled the
elderly to frequently observe their own balance control from their home without the requirement
of transportation to a clinical setting the without incurring the large expense of clinical visits and
post-fall hospitalization. By developing a device that is simple to use, with no outward
complexity beyond a simple toggle switch and status indicator, we have developed a device that
will be unintimidating to the elderly and promote frequent use. Therefore, a device of this nature
bridges the void between existing balance control indicators and in-home fall monitoring devices
for the elderly. Combining simplicity of operation present in the fall indicators and the proactive
nature of the balance control indicators, the device creates a simplistic means for proactive
balance control monitoring. This addresses issues with devices not catered to the elderly
population, e.g. Wii Fit, and those requiring professional intervention, e.g. the iShoe, and those
which do not proactively monitor balance control or force user rehabilitation, e.g. the Phillips
Lifeline pendant and myHalo fall monitoring system. This system, using principles of monitoring
acceleration of COM and how it relates to the stability limits of the user, implements a simple
means for balance analysis that has been proven through testing to be as effective as a
conventional gait monitoring system for the process of monitoring the sit-to-stand motion. This
eliminated the need for costly motion detection systems, markers, and force plates for the user to
conduct a simple at-home balance test.
155
For future development of the device, a larger population study would improve the
viability of the time duration between peaks idea. With a larger sample population including the
elderly, more support could be made for the observed pattern of a longer time duration between
peaks in acceleration. This would also confirm that this pattern was observable for elderly
subjects. With a larger population, it could be either confirmed or refuted that there is significant
variability between elderly subjects necessitating a reprogramming of the device between
subjects.
Additionally, improvements could be made to the device to make it more effective in a
home or clinical setting. For instance, the added capability of the device to log number of STS
performed and the number of balanced/unbalanced trials and the accessibility of this information
by a clinician would help a clinician or physical therapist to be sure that a subject was
performing the activity and reporting correct results. Finally, a user interface for the computer to
the device could allow not only for better clinician accessibility of this information, but also for
an easier means to program and reprogram the device based on the changing needs of the user.
Such device/personal computer communication would allow for greater flexibility of the device
in that it could be reprogrammed within a clinician‘s office and used during physical
examinations for multiple elderly clients.
156
GLOSSARY
Base of Support (BOS)- The area of the body that is in contact with the support surface (GieloPerczak, 2009).
Bluetooth- An open wireless protocol for exchanging data over short distances (using short
length radio waves) from fixed and mobile devices.
Center of Mass (COM)- In a uniform gravity field to represent the unique point in an object or
system which can be used to describe the system's response to external forces and torques (Nave,
2010).
Center of Pressure (COP)- The point on a body where the total sum of the aerodynamic
pressure field acts, causing a force and no moment about that point (Hurt, 1965).
Dorsiflexion- Flexion of the foot in an upward direction (Encyclopedia, 2010).
Inverted Pendulum Model- A pendulum with a mass above its pivot point.
Personal Emergency Response Systems (PERS)- An electronic device designed to let the user
summon help in an emergency (Federal Trade Commission, 2002).
Post-fall anxiety Syndrome- Post-fall syndrome is commonly observed in geriatric medicine,
affecting near one out of five fallers. Left untreated, this condition can lead to a regressive
syndrome, with physical, psychological and social consequences. To avoid such an evolution,
specific physical therapy must be proposed as soon as possible (Morisod & Coutaz, 2007).
Pressure Ulcers- An area of skin that breaks down when the patient remains in one position for
too long without shifting weight.
157
Proprioceptive System- The sense of the orientation of one's limbs in space (Anissimov, 2010).
Mechanoreceptors- A sensory receptor that responds to mechanical pressure or distortion.
Mediolateral Movement- movement along the frontal plane of a body (i.e. lateral sway) (GieloPerczak, 2009).
Microelectromechanical Systems (MEMS)- the integration of mechanical elements, sensors,
actuators, and electronics on a common silicon substrate through microfabrication technology.
micromechanical components are fabricated using compatible "micromachining" processes that
selectively etch away parts of the silicon wafer or add new structural layers to form the
mechanical and electromechanical devices (Reithel, 2010).
Somatosensory System- A diverse sensory system comprising the receptors and processing
centres to produce the sensory modalities such as touch, temperature, proprioception (body
position), and nociception (pain) (Boulpaep & Boron, 2003).
Tai Chi- A meditative form of gentle stretching and postural changes in a slow and flowing
manner (Rose, 2005).
Vestibular System- A sensory system in mammals that determines body position with respect to
gravity and orientation with respect to self-generated movements. It allows for the transmission
of information that allows for compensatory movement and adjustment in body positioning
(Gray, 2000).
158
REFERENCES
Allum, J. H. (1999). Patent No. 5,919,149.
Alwan, M., Felder, R. A., Kell, S. W., & Dalal, S. (2004). Patent No. 10/550,157.
American Academy of Health and Fitness. (2010). Berg Balance Scale. Retrieved April 10,
2010, from American Academy of Health and Fitness:
http://www.aahf.info/pdf/Berg_Balance_Scale.pdf
Analog Devices. (2009, June). ADXL345 Data Sheet. Retrieved from Analog Devices Inertial
Sensors: http://www.analog.com/static/imported-files/data_sheets/ADXL345.pdf
Anissimov, M. (2010, April 06). What is Proprioception? Retrieved 2010, from wiseGEEK:
www.wisegeek.com/what-is-proprioception.htm
Arduino. (2009, July 14). Retrieved November 29, 2009, from Arduino Duemilanove:
http://arduino.cc/en/Main/ArduinoBoardDuemilanove
Arduino. (2010, April 1). Retrieved April 5, 2010, from Language Reference:
http://www.arduino.cc/en/Reference/HomePage
Arduino Forum. (2009, October 10). Retrieved March 15, 2010, from Hardware Interfacing:
http://www.arduino.cc/cgi-bin/yabb2/YaBB.pl?num=1255602368
Arduino Reference. (2009, January 9). Retrieved March 15, 2010, from Define:
http://arduino.cc/en/Reference/Define
Aston, R. (1990). Principles of Biomedical Instrumentation and Measurementq. New York, New
York: Merrill.
Bogert, A. J., Pavol, M. J., & Grabiner, M. D. (2002). Response time is more important than
walking speed for the ability of older adults to avoid a fall after a trip. Journal of Biomechanics ,
35 (2), 199-205.
Buckman, R. F. (2006). Patent No. 7,150,048.
Centers for Disease Control & Prevention. (2009, January 19). Cost of Falls Among Older
Adults. Retrieved September 25, 2009, from CDC:
http://www.cdc.gov/HomeandRecreationalSafety/Falls/fallcost.html
Centers for Disease Control & Prevention. (2009, September 24). Focus on Preventing Falls.
Retrieved September 25, 2009, from CDC: http://www.cdc.gov/Features/OlderAmericans/
159
Chern-Sheng Lin, H. C.-L.-C.-S. (2007). Wearable device for real-time monitoring of human
falls. Science Direct .
Chong, R. K., Chastan, N., Welter, M. L., & Do, M. C. (2009). Age-related changes in teh center
of mass velocity control during walking. Neuroscience Letters , 458 (1), 23-27.
Clark, R. A., Bryant, A. L., Pua, Y., McCrory, P., Bennell, K., & Hunt, M. (2010). Validity and
reliability of the Nintendo Wii Balance Board for assessment of standing balance. Gait and
Posture , 31, 307-310.
Culhane, K. M., O'Connor, M., & Lyons, G. M. (2005). Accelerometers in rehabilitation
medicine for older adults. Age and Ageing , 34, 556-560.
Digikey. (2009). Digikey. Retrieved December 13, 2009, from Tyco Alcoswitch:
http://media.digikey.com/photos/Tyco%20Alcoswitch%20Photos/SSJ1204.jpg
Dunne, R., Bergman, A., Rogers, L., & Rivara, F. (1993). Elderly Persons' Attitudes Towards
Footwear: A Factor in Preventing Falls. Public Health Reports in Brief , 106 (2), 245-248.
Dym, C. I., & Little, P. (2004). Engineering Design: A Project-Based Introduction. Hoboken:
John & Wiley Sons, Inc.
Dym, C. L., & Little, P. (2003). Engineering design: a project-based introduction. (2. Illustrated,
Ed.) Wiley.
Encyclopedia, M.-W. M. (2010). Dorsiflexion, Definition. Retrieved April 10, 2010, from
meriam-webster.com: www.meriam-webster.com/medical/dorsiflexion
Faludi, R. (2007, April 23). Rob Faludi. Retrieved February 16, 2010, from Buzzer Example
Code: http://www.faludi.com/2007/04/23/buzzer-arduino-example-code/
Fleming, J., & Brayne, C. (2008). Inability to get up after falling, subsequent time on the floor,
and summoning help: prospective cohort study in people over 90. British Medical Journal , 337344.
Fung, Y. C. (1993). Biomechanics: Mechanical Properties of Living Tissues. (2nd, Ed.) New
York: Springer-Verlag.
Gielo-Perczak, K. (2009). Major Qualifying Project Guide for Writing Report. Worcester:
Worcester Polytechnic Institute: Department of Biomedical Engineering.
Grabiner, M. D., Pavol, M. J., & Owings, T. M. (2002). Can fall-related hip fractures be
prevented by characterizing the biomechanical mechanisms of failed recovery? Endocrine , 17
(1), 15-20.
160
Gray, L. (2000). Vestibular System: Structure and Function. Retrieved April 04, 2010, from
Neuroscience Online: http://nba.uth.tmc.edu/neuroscience/s2/ii10-1.html
Gross, M., Stevenson, P., Charette, S., Pyka, G., & Marcus, R. (1998). Effect of muscle strength
and movement speed on the biomechanics of rising from a chair in healthy elderly and young
women. Gait and Posture , 8, 175-185.
Halo Monitoring. (2009). Halo Monitoring. Retrieved September 20, 2009, from myHalo:
http://www.halomonitoring.com/halo/LinkClick.aspx?fileticket=afZzmD8XB0c%3d&tabid=110
Harry, J. D., Collins, J. J., Prplata, A. A., & Kleshinkski, S. J. (2004). Patent No. 10/793,729.
Horlings, C. G., van Engelen, B. G., Allum, J. H., & Bloem, B. R. (2008). A weak balance: the
contribution of muscle strength to postural instability and falls. Clinical Practice Neurology , 4
(9), 504-515.
Hurt, H. H. (1965). Aerodynamics for Naval Aviators. Naval Air Systems Command, United
States Navy , 16-21.
Huynh, J. (2009). Liquidware Open Source Electronics. Retrieved December 4, 2009, from
Lithium Backpack: http://www.liquidware.com/shop/show/BP/Lithium+BackPack
Internet Stroke Center. (2010). Stroke Scales and Balance Assessment Tools. Retrieved April 18,
2010, from The Internet Stroke Center: http://www.strokecenter.org/trials/scales/berg.html
Janssen, W. G., Bussmann, J. B., Horemans, H. L., & Stam, H. J. (2005). Analysis and
decomposition of accelerometric signals of trunk and thigh obtained during the sit-to-stand
movement. Medical & Biological Engineering and Computing , 43, 265-272.
Janssen, W. G., Bussmann, J. B., L.D., H., & Stam, H. H. (2008). Validity of Accelerometry in
assessing the duration of the sit-to-stand movement. Medical Biological Engineering
Computations , 879-887.
Janssen, W. G., Kulcu, D. G., Horemans, H. L., Stam, H. J., & Bussmann, J. B. (2008).
Sensitivity of Accelerometry to Assess Balance Control During Sit-to-Stand Movement. IEEE
Transaction on Neural Systems and Rehabilitation Engineering, 16, pp. 479-484.
Janssen, W., Bussmann, J., Horemans, H., & Stam, H. (2005). Analysis and Decomposition of
Accelerometric Signals of Trunk and Thigh Obtained during the Sit-to-Stand Movement.
Medical & Biological Engineering & Computing .
Jenness, L. (1988). Patent No. 4,750,480.
Kelly, P. B., & Schoendorfer, D. W. (2003). Patent No. 6,611,783.
161
Kemoun, G., Thoumie, P., Boisson, D., & Guieu, J. (2002). Ankle dorsiflexion delay can predict
falls in the elderly. Journal of Rehabilitation Medicine , 34 (6), 278-283.
Kerr, K. M., White, J. A., Barr, D. A., & Mollan, R. A. (1997). Analysis of the sit-stand-sit
movement cycle in normal subjects. Clinical Biomechanics , 12, 236-245.
Koninklijke Philips Electronics. (2009). How Philips Lifeline Medical Alarm Works. Retrieved
September 20, 2009, from Philips: http://www.lifelinesys.com/content/how-lifelineworks/index.jsp
Koninklijke Philips Electronics. (2010). Lifeline Standard Medical Alert Service. Retrieved April
10, 2010, from Phillips: http://www.lifelinesys.com/content/lifeline-products/how-lifeline-works
Life Alert Emergency Response Inc. (2010). Retrieved from Life Alert:
http://www.lifealert.com/index.html
Lindsay, J. (2008, 7 31). Astronaut technology could prevent elderly falls. Retrieved 10 13, 2009,
from www.msnbc.msn.com: http://www.msnbc.msn.com/id/25949023/
Lockhart, T. E., Smith, J. L., & Woldstad, J. C. (2005). Effects of aging on the biomechanics of
slips and falls. Human Factors , 47 (4), 708-729.
Lord, S., Sherrington, C., & Menz, H. (2000). Falls in Older People: Risk Factors and Strategies
for Prevention. Cambridge, United Kingdom: Cambridge University Press.
Lorincz, K., Chen, B.-r., Patel, S., & Welsh, M. (2008). Mercury: A Wearable Sensor Network
and Platform for High-Fidelity Motion Analysis. Retrieved from Havard Sensor Networks Lab:
http://fiji.eecs.harvard.edu/Mercury
Maker Media. (2009). Maker Shed. Retrieved December 4, 2009, from 9V Wall Adapter Plug for
Arduino: http://www.makershed.com/ProductDetails.asp?ProductCode=MKSF3
Mao, D. W., Hong, Y., & Li, J. X. (2006). Characteristics of Foot Movement in Tai Chi
Exercise. Physical Therapy , 86 (2), 215-222.
Mathie, M. J., Coster, A. C., & Lovel, N. H. (2004). Accelerometry: providing an integrated,
practical method for long-term, ambulatory monitoring of human movement. Physiological
Measurement , 24, R1-R20.
Morisod, J., & Coutaz, M. (2007). Post-Fall Syndrome: how to recognize and treat it? Rev Med
Suisse , 2531-2536.
Myllymake, M. (1996). Patent No. 5,525,858.
Nave, R. (2010). Center of Mass. Retrieved 2010, from HyperPhysics: http://hyperphysics.phyastr.gsu.edu/HBASE/cm.html
162
Nintendo. (2009). Balance Games. Retrieved April 10, 2010, from WiiFit:
http://wiifit.com/training/balance-games.html
Omega Engineering Inc. (2003). Force, Acceleration and Torque. Retrieved 10 14, 2009, from
Omega Engineering Literature:
http://www.omega.com/Literature/Transactions/volume3/force2.html
Omega Engineering Inc. (2003). The Strain Gage. Retrieved 10 14, 2009, from Omega
Engineering Literatue: http://www.omega.com/Literature/Transactions/volume3/strain.html
Pai, Y.-C., & Patton, J. (1997). Center of Mass Velocity Position Predictions for Balance
Control. Journal of Biomechanics , 30 (4), 347-354.
Pai, Y.-C., & Patton, J. (1997). Center of mass velocity-position predictions for balance control.
Journal of Biomechanics , 30, 347-354.
Parker, E. B., Fabeny, B. M., Larson, E. C., & Monaco, J. F. (2006). Patent No. 6,997,882.
Petelenz, T. J., Peterson, S. C., & Jacobsen, S. C. (2002). Patent No. 6,433,690.
Reithel, B. J. (2010). Micro-Electro-Mechanical Systems. Retrieved April 04, 2010, from
Faculty.bus.olemiss.edu:
http://faculty.bus.olemiss/edu/breithel/b620s02/riley/Micro_Electro_Mechanical_Systems.htm
Robert F. Buckman, J. A. (2006). Patent No. 7017195. United States.
Rose, D. J. (2005). The Role of Exercise in Reducing Falls and Fall Related Injuries in Older
Adults. Falls Free: Promoting a National Falls Prevention Action Plan , pp. 19-27.
Rubenstein, L. Z. (2006). Falls in older people: epidemiology, risk factors and strategies for
prevention. Age and Ageing , 35 (S2), ii37-ii41.
Runge, M., & Schact, E. (2005). Multifactorial pathogenesis of falls as a basis for multifactorial
interventions. Journal of Muscoloskeletal Neuronal Interact , 5 (2), 127-134.
Schillings, A. M., Mulder, T., & Duysens, J. (2005). Stumbling Over Obstacles in Older Adults
Compared to Young Adults. Journal of Neurophysiology , 94 (2), 1158-1168.
Services, U. D. (2007, October 31). HHS Strategic Plan Fiscal Years 2007-2012 (Strategic
Plan). Retrieved September 20, 2009, from United States Department of Health & Human
Services: http://aspe.hhs.gov/hhsplan/2007/HHSStrategicPlan0712.htm#content
Shumway-Cook, A., & Woollacott, M. H. (2007). Motor Control: translating research into
clinical practice. Philadelphia, PA: Lippincott Williams & Wilkins.
163
SparkFun Electronics. (2009). KinetaMap Product Info. Retrieved from SparkFun Electronics:
http://www.sparkfun.com/commerce/product_info.php?products_id=8725
Sparkfun Electronics. (2009). Sparkfun Electronics. Retrieved December 4, 2009, from Triple
Axis Accelerometer Breakout - ADXL345:
http://www.sparkfun.com/commerce/product_info.php?products_id=9156
Sparkfun Electronics. (2009). Sparkfun Electronics. Retrieved December 4, 2009, from Buzzer PC Mount 12mm 2.048kHz:
http://www.sparkfun.com/commerce/product_info.php?products_id=7950
Sparkfun Electronics. (2009). Sparkfun Electronics. Retrieved December 4 2009, from Arduino
ProtoShield Kit: http://www.sparkfun.com/commerce/product_info.php?products_id=7914
Stevens, J. A. (2005). Falls Among Older Adults-Risk Factors and Prevention Strategies. Falls
Free: Promoting a National Falls Prevention Action Plan , pp. 3-18.
Sturnieks, D. L., St George, R., & Lord, S. R. (2008). Balance disorders in the elderly. Clinical
Neurophysiology , 38 (6), 467-478.
The National Council on the Aging. (2005). Falls Free: Promoting a National Falls Prevention
Action Plan. Retrieved April 2, 2010, from Healthy Aging Programs:
http://www.healthyagingprograms.org/resources/FallsFree_ReviewPaper_Final.pdf
Tideiksaar, R. (2002). Falls in Older People: Prevention & Management. Baltimore: Health
Professionals Press, Inc.
Tinetti, M. E., Lui, W. L., & Claus, E. B. (1993). Predictors and Prognosis of Inability to Get Up
After Falls Among Elderly Persons. Journal of American Medical Association , 269 (1), 65-70.
Torrence, R. (2008, December 1). MEMS-based inertial sensor is not your grandfather's
gyroscope. Retrieved October 16, 2009, from Electronics Design, Strategy, News:
http://www.edn.com/article/CA6614434.html
Trafton, A. (2008, July 16). Balance problems? Step into the iShoe. Retrieved April 5, 2010,
from MIT News: http://web.mit.edu/newsoffice/2008/i-shoe-0716.html
Uwe Maurer, A. R. (2006). eWatch: A Wearable Sensor and Notification Platform. Pittsburgh,
PA: Carnegie Mellon University.
Voermans, N. C., Snijders, A. H., Schoon, Y., & Bloem, B. R. (2007). Why old people fall (and
how to stop them). Practical Neurology , 7 (3), 158-171.
164
Ward, D. S., Evenson, K. R., Vaughn, A., Rodgers, A. B., & Troiano, R. P. (2005).
Accelerometer Use in Physical Activity: Best Practices and Research Recommendations. Med
Sci Sports Exerc , 37 (11), S582-S588.
Ward, D. S., Evenson, K. R., Vaughn, A., Rodgers, A. B., & Troiano, R. P. (2005).
Accelerometer Use in Physical Activity: Best Practices and Research Recommendations.
Medicine & Science in Sport & Exercise , S582-S588.
Winter, D. A., Patla, A. E., Prince, F., Ishac, M., & Gielo-Perczak, K. (1998). Stiffness Control
of Balance in Quiet Standing. Journal of Neurophysiology , 80, 1211-1221.
Winter, D. (1995). A.B.C. of Balance during Standing and Walking. Waterloo: Canadian
Cataloguing in Publication Data.
Woolley, S. M., Czaja, S. J., & Drury, C. G. (1997). An assessment of falls in elderly men and
women. Journal of Gerontology: Biological Sciences , 52 (2), M80-M87.
Zheng, Y. (2006). Patent No. 6,984,208.
Zijlstra, W., Bisseling, R. W., Schlumbohm, S., & Baldus, H. (2010). A body-fixed-sensor-based
analysis of power during sit-to-stand movements. Gait and Posture , 31, 272-278.
165
Appendix A: ADXL 345 Data Sheet
A-1
A-2
A-3
A-4
A-5
A-6
A-7
A-8
A-9
A-10
A-11
APPENDIX B: KinetaMap User Manual
B-1
B-2
B-3
B-4
B-5
B-6
B-7
APPENDIX C: Client Interviews
1. The following is an interview conducted by team member, Liz Tuite. The interviewee is an 82
year-old female. Interview questions are bolded and interviewee comments are not bolded.
Yes I have, I hate to tell you, but I have. Twice two bad falls.
Can you explain?
Yes I can once I was very careless, Do you want a long story or short story?
Just as long as it needs to be, we can cut it out.
Well, I was up at Hampton Beach, had a nice seafood festival, I was going to meet Joe up there,
my son. I was calling him on my cellphone and I couldn‘t hear him, so I took a walk to get away
from the music. I‘m talking on the phone and walking and I walked right off the stage. Fell down
about two steps and I tore my rotator cuff, very painful. They put the ice on my knees because
that‘s where the blood was. I said, ‗no I‘ll get up myself‘ you know
And how did it effect you after?
I‘ve suffered with it for a few years. Because I went for PT and got pretty good strength and
pretty good range of motion. I went back a second time for PT, and I neglected doing exercises. I
know I‘m going to do them all my life, but now I‘m seriously considering having it repaired, but
now I‘m 82 years old and I wonder will I need rehab and how am I going to manage to get
dressed and take care of myself, so that‘s a problem.
C-1
What’s the biggest change you’ve had in your daily life after the fall?
One of the things I loved was once a month I‘d go to mustard seed and volunteer to cook for like
200 people with my church, and I liked being there and I liked being with the crowd and cooking
and doing the serving. I can‘t rotate that arm, I cannot like big bowls, I can‘t stir the things. They
asked me to just do the dishes, they wanted me there, and I said I can‘t even do that. I can‘t rotate
to dry or wash them. And that was one thing, now it‘s cooking and carrying bundles there‘s a lot
of things. I can‘t talk with my hands like I like to, I didn‘t know how much I did that. I have to
sometimes pick up a mug of beer with two hands, and at the end of the day <> can you bring me
a mug of beer? And my other fall was with the dog, I was standing talking with my son in law,
whatever, all a sudden he turns around to go out in the backyard and the dog goes to chase him, I
didn‘t realize the leash was behind me laying on the ground, picked me right up off the ground,
landed on my back, and I had two fractures which weren‘t found for quite a while by MRI finally
of my sacrum. Took so long to heal because I wasn‘t aware of the fracture, that‘s been painful.
How has that effected your daily life?
Well, I can‘t carry heavy things, weighty. When I‘m bringing in my bundles, grocery shopping,
which I always used to do, I could do it, but it causes pain in my lower back. Even today, I just
had 5 lbs of flour, 8 lbs of groceries, and I could feel it. So I tire more easily, and I was always
very active. I can‘t do as much as I used to, I like to be active.
What type of therapy or medicine or PT have you done or tried to do after your falls to
help you?
I went to therapy, they had me do exercises, leg exercises, laying down, picking up your butt off
the floor, with straight knees, leg raises, laying flat with bent knees. For my arms it was mainly
range of motion exercises, *stretches* you know, like rattle? I tried to do more, they‘d be like
‗no, you‘re burnt, you can‘t do any more‘, and it was like, once you‘re done, you knew you
could not. The hardest one was laying flat on my left side, raising that arm up, gravity working
against me. And now, waking up in the morning, I can‘t use that arm to get my blanket off me.
It‘s been really been debilitating, and it makes me angry. You know, my doctor‘s tell me how
healthy I am, my cholesterol is fine, my everything is fine, no liver problems, I‘m just so healthy,
I say ‗yeah, now if I could just learn to stand on my own two feet I‘d be fine.‘
C-2
Did you ever feel before your falls that you were off balance or you had balance issues?
No, I don‘t think I was off balance because I‘ve always been a walker. You know, I‘ve walked a
lot so I‘ve always been strong. I would have been fine if I hadn‘t been on the phone, and it was
noisy too, so I had to go away from the music.
So, do you think in your case the device I was describing would have helped at all?
In my case? Not really, I think as you use better sense. How many accidents do you think occur
from people using poor judgement? I always think about it now, I think I‘ll always be careful
where I walk, where I step.
Before either of your falls, did you know that falls caused so many problems in the elderly?
I did, but frankly, I don‘t always know I‘m as old as I am. But I work nursing homes so I‘ve
seen…
I am aware of slippery floors, I‘ve always been, because I‘ve known people who‘ve gotten hurt
that way, I‘ve always been aware of scatter rugs, I never have scatter rugs because you can get
hurt that way. I‘m kind of aware of hazards, even if I‘m in someone‘s grocery store and I see a
spill I‘ll say ―young man you‘d better get that picked up right away because someone could fall
and get hurt‖
Do you know of anyone who you think could benefit from the device?
Sure I do, personally… my sister. She complains of being lightheaded and unsteady in the
morning when she gets up. I‘ve told her you know, watch your posture and things. I think that‘s
something she could benefit from before she gets out of bed in the morning, you know see how
she could use it cautiously, getting out of bed because she‘s so unsteady.
C-3
So Why do you think it would help her, do you think she would use it?
Oh I think she would, you know… it‘s not troublesome, it‘s very easy to use, I think it would be
very good in nursing home use, you know the people who could use it to make themselves
aware. You know, people want to stay well, so it would be nice for them to know if they‘re
unsteady or have a chance of falling so maybe they sit until their head clears, you know, maybe
get some fluids in them, change their medicines, or tell the doctor‘s what times this happens so
they can adjust their medicine so they don‘t have drops in blood pressure or something.
Do you worked at St. Pat’s, right? How long did you work there for?
Oh I worked there for… I don‘t want to say too long. I really enjoyed the old people .No, I was
there for at least 5 years, and they‘ve improved a lot of things since then. They have all kinds of
sensors and alarms to watch people get out of bed.
Do you think this device would be more useful than anything currently used?
I think it would be, as long as they‘re well aware, for the old people. I think it would be good for
people who are recuperating, you know young people like me who have never had to deal with
an issue like this, and then something happens and they need a device like this just to remind
them that ‗oh maybe I need to sit for a while, maybe I need to slow down until I get my balance,‘
Sometimes people are medicated for pain to, when they‘re recuperating, and they‘re not as
steady as they think they are, and maybe it would be useful in that respect, postoperatively or
when they‘re home recuperating.
Do you think if they’re forgetful about other things they’d be forgetful about this?
I think they‘d forget to put it on, or if they‘re really confused they‘d forget what the buzz meant.
But I think if they had a person watching them who could remember to put it on overnight, so
that it could buzz in the morning, if it was comfortable enough to be worn all the time.
C-4
Do you think they’d remember to turn it on if they could wear it all day, and they sat down
would they remember to turn it on before they sat up?
It depends, on how alert they are, their minds. You know, myself, I wouldn‘t forget, and if I were
sick in bed I‘d be thankful for it… you know, my sister… people don‘t want to fall, because they
don‘t want to get fractures, and they know it might be the last straw for independence. If you
need this, then you probably need people around you anyway don‘t you think? I mean, like if
people are confused and they‘re on medicine, and they‘re home alone, and they might just forget
an move quick, and maybe it‘d be nice to have it on at night., can you have it on overnight?
Or maybe it could just be on when you‘re about to get up?
And would it be better if it was on overnight?
I think bedtime would be a good time to put it on, and then have it start working as soon as you
get up and get on the move.
Do you think we picked the best way to notify the person?
I think a noise would be best, some quick sound that would alert you to sit for a while.
I‘m trying to think of any other times, I think post-op patients, when they‘re on medication and
they‘re asleep, you get up and you try to do things automatically, you know, you just try to get
up, and I think a tone.
Do you think it would be helpful for otherwise healthy people?
Like, if they‘re mentally well, and physically well, but maybe not so physically well, I think of
my sister, you know, she‘s had a few falls, and I think she can be careless, so I think of Rose.
C-5
She can be careless, and get up without thinking. And with her recuperating I think it would be
helpful.
What’s she recuperating from?
She had a fall, she was up in the middle of the night on a bare floor, she has a fractured tibia.
She was feeding the cat in the middle of the night, she was in her bare feet because she has some
neuropathy of her feet, she was feeding the cat, she took a terrible fall on some water she spilled.
She had had her left knee replaced last year, and she was careful to protect that so she broke her
tibia right where it connects to the knee. She had a lot of issues, and MRIs. So she has a special
needs boy, so she needs to hurry around in the morning and get him off to school and she‘s
always hurrying. When we went on vacation with her she used to get up and blast around and
make the beds, that‘s Rose.
Do you think before this fall she would have used this device?
No, I think she wouldn‘t have… because she‘d say ―I don‘t do that,‖ you know, because we all
think different. I mean my sister would think that way, but not Rose, because we all think
different.
Do you think that maybe after her surgery on her knee she was unstable?
She was slower, it was painful walking but she was steady.
Do you think if a Dr. told her to use this she would have?
No, because she was steady.
C-6
But if she walks slower than she’s probably not steady, she probably had balance problems
before.
No, she had pain. I actually shouldn‘t say that, you know she probably did have some balance
problems
Yes, through our research we found that walking slowly is a sign of balance problems.
Rose does have some balance problems, but she‘s cautious and she‘s not unsteady, so I don‘t
think the alarm would have helped her. But that had nothing to do with the fall, she slipped on
water, you know. I think the alarm would help if she were going to recuperate, you know, just to
slow her down.
The purpose, in Rose’s case, was that she probably could have had balance problems, even
before the surgery to do strengthening and things like that.
Did she have PT after her surgery, she must have?
Yes, a while, and then she had people come to the house and do her exercises with her too.
Rose‘s main issue was that she‘s always moving too fast, and someone needs to slow her down.
You know, I guess that could be useful if you could just use it to help slow people down.
Do you think this would be helpful if we could incorporate it into a physical and have a
person just stand up 5 times and if it buzzed they could use that to do physical therapy to
improve their balance?
Yes, you know I think that could work. Because I don‘t think Doctors put enough time into
physical therapy in older people, you know, they really don‘t. The older you get, ―it‘s part of the
aging process,‖ that‘s what everyone says, you know, everything is part of the aging process. I
think Physical therapy should almost be something that the doctors do at a certain age or when
C-7
they see certain symptoms like instability or weakness. Physical therapists can pick up on a lot of
things, you know. And my friend, you know, she has M.S., she‘s going to start some PT because
she has a lot of weaknesses and she‘s having trouble walking, PT is wonderful for the elderly,
and for young people with problems. It‘s hard to keep it up when you get home though, doing the
same thing over and over.
It’s one thing we were thinking, you go to physical therapy and then you go home and it’s
all up to you, and if you had this device you could see how you improved and then keep
using it after and see if your balance started to get worse, do you think that’s useful?
That‘s a good point. I know, that‘s why my shoulder has gotten worse from not doing exercises, I
could always walk, I could do that forever, but those exercises just made me crazy. I know I need
the strength back for the summer, because raking and mowing the lawn and all those things I like
to do… they‘re going to hurt, you know, they‘re going to hurt.
Do you think doing those things is going to make it worse?
I do, because I was outside raking one day before vacation and I was trying to get done raking
before the sanders and a couple day later it hurt like a son of a gun and I remembered back and I
said ‗oh that must have hurt.‘ But now I‘m careful, when I rake, I rake with my left hand and the
other one just goes with the rake.
Okay, I’m done with the interview, thanks that was great.
2. The following are written responses to an e-mail interview. The interviewee is a physical
therapist from Fairlawn Rehabilitation Hospital. Questions are bolded and responses are not
bolded.
Would the device be useful in a clinical setting? Home setting? If so, how? If not, why?
yes, probably in a clinical rehab setting... we could use it in addition to balance scales that we use
during a PT eval (ie Berg or Tinetti scale) which all can help identify those who are a high fall
risk.
it may be too costly for home?! insurances may not buy into it?!
C-8
What type of patient do you think this would be used for?
patients who are in a fall risk catagory: Parkinson's, MS, post stroke, general medical elderly pts
over the age of 80
Would you change anything about this device?
it seems simple in terms of either off balance with 'sit-to-stand' or not. it is good that it is clear
cut.
How could this device benefit an elderly individual?
again, it could identify high fall risk patients; need for a person to get P.T. for balance training,
need for an assistive device such as cane or walker
C-9
APPENDIX D: Data from Preliminary Testing
Table 19: Time between maximum and minimum peaks of shoulder-width trials (SW: shoulder-width, AVG:
average, STDEV: standard deviation, CV: coefficient of variance)
Trial
SW
SW
SW
SW
SW
SW
SW
SW
SW
SW
SW
SW
SW
SW
SW
SW
SW
SW
SW
SW
SW
SW
SW
SW
SW
SW
SW
SW
SW
SW
SW
SW
Subject 1
Time (s)
0.75
0.8
0.8
0.9
0.95
0.9
0.85
1.15
0.9
0.9
0.95
0.95
0.55
0.8
0.5
0.1
1
0.85
0.65
1
0.8
0.95
0.8
0.75
0.95
0.85
0.9
0.95
1.3
0.75
0.85
0.9
Subject 2
Time (s)
0.85
0.7
0.8
0.9
0.2
0.3
0.85
0.95
0.9
0.65
Subject 3
Time (s)
0.6
0.1
0.25
0.6
0.45
0.48
0.9
0.5
0.6
0.4
Subject 4
Time (s)
0.6
0.1
0.35
0.3
0.2
0.55
0.15
0.25
0.1
0.5
Subject 5
Time (s)
0.55
0.5
0.1
0.4
0.5
0.2
0.55
0.5
0.1
0.4
0.5
Subject 6
Time (s)
0.6
0.65
0.6
0.4
0.5
Subject 7
Time (s)
0.7
0.65
0.55
0.65
0.7
Subject 8
Time (s)
0.35
0.15
0.25
0.1
0.45
SW
0.9
SW
0.85
AVG
0.85
0.71
0.71
0.59
0.55
0.75
0.74
0.35
STDEV
0.20
0.26
0.14
0.28
0.16
0.05
0.10
0.06
CV
0.23
0.37
0.19
0.48
0.29
0.07
0.13
0.17
D-1
Table 20: Time between maximum and minimum peaks of tandem trials (T: tandem, AVG:
average, STDEV: standard deviation, CV: coefficient of variance)
Trial
T
T
T
T
T
T
T
T
T
T
T
AVG
Subject 1 Subject 2 Subject 3 Subject 4 Subject 5 Subject 6 Subject 7 Subject 8
Time (s) Time (s) Time (s) Time (s) Time (s) Time (s) Time (s) Time (s)
0.3
0.3
0.6
0.6
0.55
0.6
0.7
0.35
0.7
0.55
0.1
0.1
0.5
0.65
0.65
0.15
0.6
0.65
0.25
0.35
0.1
0.6
0.55
0.25
0.55
0.45
0.6
0.3
0.4
0.4
0.65
0.1
0.4
0.2
0.45
0.2
0.5
0.5
0.7
0.45
0.7
0.35
0.48
0.55
0.2
0.4
0.35
0.9
0.15
0.45
0.7
0.5
0.25
0.3
0.2
0.6
0.1
0.3
0.25
0.4
0.5
0.3
0.40
0.49
0.31
0.41
0.55
0.65
0.26
0.45
STDEV
0.16
0.18
0.22
0.19
0.18
0.10
0.06
0.14
CV
0.35
0.45
0.44 0.597718
0.44
0.18
0.09
0.55
D-2
APPENDIX E: Center of Pressure Data from Preliminary Testing
The following shows a representative balanced and unbalanced sit-to-stand trial for subjects 1-4
labeled by a black and green circle, respectively.
Subject 1
Subject 2
E-1
Subject 3
Subject 4
E-2
APPENDIX F: Acceleration Plots from Preliminary Testing
The following show a representative balanced (black) and unbalanced (green) sit-to-stand trial
for subjects 1-8.
Subject 1
Subject 1- Balanced
2.5
2
Acceleration (m/s2)
1.5
1
0.5
0
0 0 1 2 3 4 4 5 6 7 8 8 9 101112121314151616171819202021222324242526
-0.5
-1
-1.5
Time (s)
Subject 1- Unbalanced
4
3
acceleration (m/s2)
2
1
0
-1
-2
-3
0
2
4
6
8
10
12
14
16
18
20
22
24
26
Time (s)
F-1
Subject 2
Subject 2-Balanced
2.5
2
acceleration (m/s2)
1.5
1
0.5
0
-0.5
-1
-1.5
-2
-2.5
0
1
2
3
4
5
6
7
8
9
10
11
12
13
Time (s)
Subject 2- Unbalanced
2
1.5
acceleration (m/s2)
1
0.5
0
-0.5
-1
-1.5
-2
-2.5
-3
0
1
2
3
4
5
6
7
8
9
10
11
12
13
14
15
16
17
Time (s)
F-2
Subject 3
Subject 3- Balanced
4
3
acceleration (m/s2)
2
1
0
-1
-2
-3
-4
0
1
2
3
4
5
6
7
8
9
10
11
12
13
14
15
16
17
18
Time (s)
Subject 3- Unbalanced
3
2
acceleration (m/s2)
1
0
-1
-2
-3
-4
0
1
2
3
4
5
6
7
8
9
10 11 12 13 14 15 16 17 18 19 20 21
Time (s)
F-3
Subject 4
Subject 4 - Balanced
2
1.5
Acceleration (m/s^2)
1
0.5
0
-0.5
-1
-1.5
-2
-2.5
0
2
4
6
8
10
12
14
16
10
12
14
16
Time (s)
Subject 4 - Unbalanced
4
3
Acceleration (m/s^2)
2
1
0
0
2
4
6
8
-1
-2
-3
-4
Time (s)
F-4
Subject 5
Subject 5- Balanced
3
acceleration (m/s2)
2
1
0
-1
-2
-3
0
1
2
3
4
5
6
7
8
9
10 11 12 13 14 15 16 17 18 19 20
Time (s)
Subject 5 - Unbalanced
3
2
acceleration (m/s2)
1
0
-1
-2
-3
-4
0
1
2
3
4
5
6
7
8
9
10 11 12 13 14 15 16 17 18 19 20
Time (s)
F-5
Subject 6
Subject 6 - Balanced
2
1.5
Axis Title
1
0.5
0
-0.5
-1
-1.5
-2
0
1
2
3
4
5
6
7
8
9
10 11 12 13 14 15 16 17 18 19 20 21
Time (s)
Subject 6 - Unbalanced
2
1.5
acceleration (m/s2)
1
0.5
0
-0.5
-1
-1.5
0
1
2
3
4
5
6
7
8
9
10
11
12
13
14
15
16
17
18
19
20
Time (s)
F-6
Subject 7
Subject 7 - Balanced
4
3
acceleration (m/s2)
2
1
0
-1
-2
-3
0
1
2
3
4
5
6
7
8
9 10 11 12 13 14 15 16 17 18 19 20 21 22 23 24 25 26
Time (s)
Subject 7 - Unbalanced
3
acceleration (m/s2)
2
1
0
-1
-2
-3
0
1
2
3
4
5
6
7
8
9
10 11 12 13 14 15 16 17 18 19 20
Time (s)
F-7
Subject 8
Subject 8- Balanced
4
3
acceleration (m/s2)
2
1
0
-1
-2
-3
-4
0
2
4
6
8
10
12
14
16
18
20
22
Time (s)
Subject 8- Unbalanced
4
3
acceleration (m/s2)
2
1
0
-1
-2
-3
-4
0
2
4
6
8
10
12
14
16
18
20
22
24
Time (s)
F-8
APPENDIX G: Data from Device Verification
Table 1: Time between positive and negative peaks of shoulder-width design verification
trials
Trial
SW
SW
SW
SW
SW
SW
SW
SW
SW
SW
Subject 1
Time (s)
0.80
0.90
1.10
0.80
0.70
0.70
0.80
1.10
0.55
0.95
Table 2: Time between positive negative peaks of tandem device verification trials
Trial
T
T
T
T
T
T
T
T
T
T
Subject 1
Time (s)
0.45
0.40
0.50
0.60
0.35
0.45
0.70
0.55
0.30
0.75
G-1
The following shows a representative center of pressure plots for balanced (black circle) and
unbalanced (green circle) sit-to-stand trials completed in design verification testing of subject 1.
G-2
The following show a representative balanced (black) and unbalanced (green) sit-to-stand trial
for subjects 1 design verification testing.
Subject 1 - Balanced
4
Acceleration (m/s2)
3
2
1
0
-1
-2
-3
-4
0
2
4
6
8
10
12
14
16
18
16
18
20
22
24
Time (s)
Subject 1- Unbalanced
4
3
Acceleration (m/s2)
2
1
0
-1
-2
-3
-4
0
2
4
6
8
10
12
Time (s)
14
20
22
24
G-3
APPENDIX H: Code for Device
Parts of code were adapted from (Arduino Forum, 2009) and (Faludi, 2007)
#include <Wire.h>
#define DEVICE (0x53) //ADXL345 device address
#define TO_READ (6)
axis)
//num of bytes we are going to read each time (two bytes for each
//------Values specific to user
#define StartMinA (0.5) //threshold acceleration
#define TE (0.6*1000) //expected time between peaks in milliseconds
#define RingDuration (3.0*1000) //time in milliseconds to ring buzzer
#define TestLength (2.5*1000) //total time in milliseconds for test
TestStarted = false;
TestFinished = false;
RingBuzzer = false;
BuzzerOff = 0;
TAA = 0; //time of max peak
TAD = 0; //time of min peak
AA = 0; //max acceleration
AD = 0; //min acceleration
//------------------------------------------byte buff[TO_READ] ;
char str[512];
//6 bytes buffer for saving data read from the device
//string buffer to transform data before sending it to the serial port
H-1
void setup()
{
Wire.begin();
// join i2c bus
Serial.begin(9600); // start serial for output
//Turning on the ADXL345
writeTo(DEVICE, 0x2D, 0);
writeTo(DEVICE, 0x2D, 16);
writeTo(DEVICE, 0x2D, 8);
}
void loop()
{
int regAddress = 0x32; //x-axis registers on the ADXL345
int regAddress = 0x33; //x-axis register
int regAddress = 0x34; // y-axis register
int regAddress = 0x35; //y-axis register
int regAddress = 0x36; //z-axis register
int regAddress = 0x37; //z-axis register
int x, y, z;
readFrom(DEVICE, regAddress, TO_READ, buff); //read the acceleration data from the
ADXL345
//each axis reading comes in 10 bit resolution, ie 2 bytes.
//thus we are converting both bytes in to one int
H-2
x = (((int)buff[1]) << 8) | buff[0];
y = (((int)buff[3])<< 8) | buff[2];
z = (((int)buff[5]) << 8) | buff[4];
//we send the x y z values as a string to the serial port
sprintf(str, "%d %d %d", x, y, z);
Serial.print(str);
Serial.print(10, BYTE);
//Delay is needed in order not to clog the port
delay(15);
int a = sqrt(sq(x)+sq(y)+sq(z)); //magnitude of acceleration
if (a > StartMinA && ! TestStarted){
TestStarted = true;
TimeStart = T;
}
if (T-TimeStart > TestLength && ! TestFinished) {
TestFinished = true;
if (TAD-TAA < TE) {
RingBuzzer = true;
BuzzerOff = T + RingDuration;
}
}
H-3
if (RingBuzzer) {
if (T>BuzzerOff) RingBuzzer = false;
:RingBuzzer
;
}
if (TestStarted && ! TestFinished) {
if (a>AA) {
AA = a;
TAA = T;
}
else if (a < AD) {
AD = a;
TAD = T;
}
}
void setup() {
pinMode(4, OUTPUT); // set a pin for buzzer output
}
void loop() {
RingBuzzer(4, 2048, RingDuration); // ring buzzer on pin 4 at 2048Hz for RingDuration
}
H-4
//---------------- Functions
//Writes val to address register on device
void writeTo(int device, byte address, byte val) {
Wire.beginTransmission(device); //start transmission to device
Wire.send(address);
Wire.send(val);
// send register address
// send value to write
Wire.endTransmission();
//end transmission
}
//reads num bytes starting from address register on device in to buff array
void readFrom(int device, byte address, int num, byte buff[]) {
Wire.beginTransmission(device);
Wire.send(address);
Wire.endTransmission();
//start transmission to device
//sends address to read from
//end transmission
Wire.beginTransmission(device); //start transmission to device
Wire.requestFrom(device, num);
// request 6 bytes from device
int i = 0;
while(Wire.available())
//device may send less than requested (abnormal)
{
buff[i] = Wire.receive(); // receive a byte
i++;
}
Wire.endTransmission(); //end transmission
H-5
APPENDIX I: Abstract Accepted to Northeast Bioengineering Conference
J1
J2
APPENDIX J: Conversions of Acceleration Data
Raw data from the accelerometer was output into a comma-separated variable file type,
with columns for acceleration in the X, Y, and Z axis. This file type was opened in Microsoft
Excel in order to process and analyze the data. First, magnitude was calculated via a root-sumof-squares method. This can be seen below.
𝑀𝑎𝑔𝑎𝑐𝑐𝑒𝑙𝑒𝑟𝑎𝑡𝑖𝑜𝑛 =
𝑥2 + 𝑦2 + 𝑧2
Next, Because the data from the accelerometer was outputted on a scale of -128 to 128,
𝑚
rather than 𝑠 2 , it was necessary to convert the measured value to a more traditional acceleration
measurement. In order to do this, the team implemented the function
𝐴𝑐𝑐𝑒𝑙𝑒𝑟𝑎𝑡𝑖𝑜𝑛𝑚 = ((𝑀𝑎𝑔𝑎𝑐𝑐𝑒𝑙𝑒𝑟𝑎𝑡𝑖𝑜𝑛 ∗ 18)/1000) *9.8
𝑠2
𝑚
In order to calculate the acceleration in 𝑠 2 . Then, in order to eliminate the gravitational offset
𝑚
𝑚
value which was generally within a ±1𝑠 2 range of 9.81𝑠 2 , the team calculated the average of all
the values preceding the STS motion (e.g. the pre-motion baseline), and then subtracted this
value throughout the range of the values.
Finally, because the accelerometer was collecting data at 20Hz, we calculated that each
datapoint was collected at a 0.05 second interval, and associated each data point with its
𝑚
respective time in seconds. The data was then plotted in magnitude of acceleration in 𝑠 2 versus
time in seconds. The curve was then analyzed for minimum value, maximum value, and time
duration between minimum and maximum values using built-in excel functionality.
For each subject, the three parameters collected for each plot were statistically analyzed
using an unpaired t-test, and the significance in time duration between balanced and unbalanced
trials was assessed.
In order to assess the sensitivity of device attachment angle, a similar sit-to-stand test was
conducted, and a similar means for data processing was implemented. The minimum, maximum
and time duration values were assessed for similarity between the offset trials and the control (0°
offset) for significant difference.
J1
APPENDIX K: IRB APPROVAL
K1
K2
K3
K4
Participant Email:
Dear ____________,
We are recruiting subjects to participate in a research study for our Major Qualifying Project (MQP). In
our study, we are investigating how the hip moves while sitting down and rising from a chair. This data
will be collected in order to identify a movement pattern that is indicative of an unbalanced situation.
This information will be used to develop a device that will detect when a user is off balance.
In our experiment, you will be asked to wear a belt with an attached accelerometer device, and sit and
rise from a chair with your feet on a force platform (a device similar to a bathroom scale). You will be
asked to rise from a chair several times. There is a minimal risk of falling during the experiment, but we
will be holding the chair and standing next to you in order to catch you if you do lose balance. The
benefit for participating in our study is you will become more aware of balance control difficulty, and
gain awareness about your body and mobility. This will also help with our project and lead to the design
of a balance control indicator device for the elderly community.
If you are interesting in participating in our study and helping with our MQP, please reply to this email
and we can schedule a time for testing.
Thank you,
Amanda Martori, Liz Tuite and Kevin Goggins
Fall Detection MQP Team
K5