1
Report Generator
User Manual
By Motion Lab Systems, Inc.
Printed November 14, 2002
Motion Lab Systems, Inc.
15045 Old Hammond Highway • Baton Rouge, LA 70816 • U.S.A.
Phone +1 225 272-7364
http:\\www.motion-labs.com
Printed in the United States of America
© Motion Lab Systems, Inc.
ii • Contents
Report Generator User Manual
Contents
INSTALLATION ...............................................................................................................................................................1
INSTALLATION INSTRUCTIONS ...........................................................................................................................................1
EVALUATION MODE ..........................................................................................................................................................2
FROM HERE….. .................................................................................................................................................................3
PROGRAM ESSENTIALS ...............................................................................................................................................5
OVERVIEW.........................................................................................................................................................................5
THE USER INTERFACE .......................................................................................................................................................6
APPLICATION WORKSPACE................................................................................................................................................6
QUICK RESULTS .............................................................................................................................................................8
SET DISPLAYED REPORT TO USER’S CHOICE .....................................................................................................................8
CREATE A NEW REPORT (MODIFY EXISTING REPORT) ......................................................................................................9
Create a Report Page ...................................................................................................................................................9
Define a Report Page .................................................................................................................................................10
Define Kinematic and Kinetic Graphs........................................................................................................................12
Define Key Tables.......................................................................................................................................................14
DISPLAY A DATA FILE IN A REPORT ................................................................................................................................17
SAVE A DATA-FILLED REPORT (SESSION) FOR FUTURE REFERENCE ...............................................................................18
RETRIEVE A REPORT THAT WAS SAVED AS A SESSION .....................................................................................................18
MODIFY A GRAPH............................................................................................................................................................19
PLACE REPORT GRAPHICS INTO A WORD PROCESSING DOCUMENT ................................................................................21
DISPLAY FILE SPECIFIC GCD VARIABLES .......................................................................................................................22
DISPLAY TEMPORAL DATA FROM SELECTED GCD FILES (KEY TABLE)..........................................................................23
DISPLAY STANDARD DEVIATION DATA...........................................................................................................................23
APPLY A DIFFERENT REPORT (RPT) FORMAT TO DISPLAYED DATA ...............................................................................25
DISPLAY KINEMATIC DATA OVER AN EMG PLOT ...........................................................................................................25
CREATE EVENT-SPECIFIC REPORTS .................................................................................................................................28
Edit the GCD files to contain event specific labels. ...................................................................................................28
Create an event-specific report. .................................................................................................................................28
Display the GCD files in each event-specific report. .................................................................................................30
MENU COMMAND DESCRIPTIONS..........................................................................................................................32
FILE MENU ......................................................................................................................................................................32
New .............................................................................................................................................................................32
Repeat .........................................................................................................................................................................32
Open GCD Files .........................................................................................................................................................32
Close ...........................................................................................................................................................................35
Save ............................................................................................................................................................................35
Save As........................................................................................................................................................................35
Export .........................................................................................................................................................................35
Print............................................................................................................................................................................37
Print Preview..............................................................................................................................................................38
Print Setup ..................................................................................................................................................................38
Page Setup ..................................................................................................................................................................39
Exit..............................................................................................................................................................................40
EDIT MENU ......................................................................................................................................................................40
GCD Variables ...........................................................................................................................................................41
Source .........................................................................................................................................................................42
Report Generator User Manual
Contents • iii
Session ........................................................................................................................................................................42
Report .........................................................................................................................................................................43
General Page..............................................................................................................................................................47
Specific Report Pages.................................................................................................................................................50
Key Table dialog box..................................................................................................................................................55
VIEW MENU .....................................................................................................................................................................57
Toolbars......................................................................................................................................................................57
Status Bar ...................................................................................................................................................................58
Refresh command .......................................................................................................................................................58
Next Page....................................................................................................................................................................58
Previous Page.............................................................................................................................................................58
Specific Page Names ..................................................................................................................................................59
TOOLS MENU ..................................................................................................................................................................59
Format ........................................................................................................................................................................59
Data Source ................................................................................................................................................................59
Options .......................................................................................................................................................................60
Interpolate between Samples ......................................................................................................................................61
Use Shading to Indicate SD........................................................................................................................................61
Use Data Line style for SD .........................................................................................................................................61
WINDOW MENU ...............................................................................................................................................................61
Cascade ......................................................................................................................................................................61
Tile..............................................................................................................................................................................62
Arrange Icons .............................................................................................................................................................62
1,2, … command .........................................................................................................................................................62
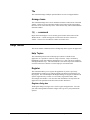
HELP MENU .....................................................................................................................................................................62
Help Topics.................................................................................................................................................................62
Register.......................................................................................................................................................................62
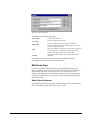
MLS Home Page.........................................................................................................................................................63
FILE FORMATS..............................................................................................................................................................65
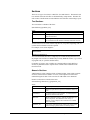
DST (OR GCD) FILES .....................................................................................................................................................65
File Type Line.............................................................................................................................................................65
Sections.......................................................................................................................................................................66
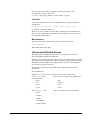
REPORT FILES..................................................................................................................................................................68
The Header Group......................................................................................................................................................69
[Footer] Group...........................................................................................................................................................70
[Screen] and [Printer] Groups ..................................................................................................................................72
Graphs Group.............................................................................................................................................................73
[<page>] Groups.......................................................................................................................................................74
Graphs ........................................................................................................................................................................75
Overlays......................................................................................................................................................................76
Key Tables (also known as G-Tables) ........................................................................................................................76
Mathematics with GCD Variables within the RPT.....................................................................................................77
Parameter References.................................................................................................................................................78
MUSCLE FILE...................................................................................................................................................................79
DATA SOURCES.............................................................................................................................................................81
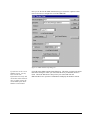
SELECTING AN EXISTING DATA SOURCE .........................................................................................................................81
CREATING A NEW DATA SOURCE ....................................................................................................................................82
VCM Paradox Driver Setup Instructions ...................................................................................................................84
REFERENCE MATERIAL.............................................................................................................................................87
APPLICATION GENERAL USAGE INSTRUCTIONS ...............................................................................................................87
Title Bar......................................................................................................................................................................87
Scroll Bars ..................................................................................................................................................................87
iv • Contents
Report Generator User Manual
FONT COLORS AND CORRESPONDING VALUES ................................................................................................................87
ACRONYMS ....................................................................................................................................................................88
GLOSSARY OF TERMS ................................................................................................................................................89
INDEX ...............................................................................................................................................................................91
Report Generator User Manual
Contents • v
Installation
Installation Instructions
All Motion Lab Systems (MLS) software is available from the corporate FTP web
site (ftp.emgsrus.com) or on the software distribution CD-ROM. The software may
be installed under any 32-bit Window™ operating system using the Windows
Add/Remove Programs option in Control Panel. Refer to the following steps for
guidance.
1.0 Close all programs.
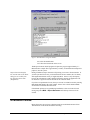
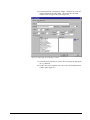
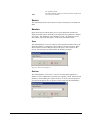
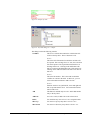
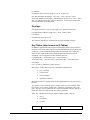
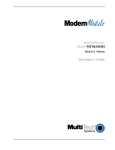
2.0 Left-click on the Windows Start button, point to Settings, and then leftclick on Control Panel. The Control Panel window (Figure 1) will
open.
Figure 1: MS Control Panel Window – view set to small icons.
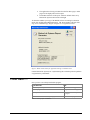
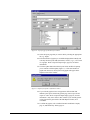
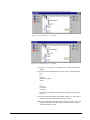
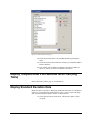
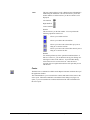
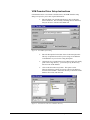
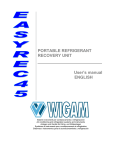
3.0 Double-click on the Add/Remove Programs icon. The Add/Remove
Programs window (Figure 2) will open.
Report Generator User Manual
Installation • 1
Figure 2: MS Add/Remove Programs Window.
4.0 Select the Install button.
5.0 Follow the instructions on the screen.
The Report Generator install program will place the program (approximately 5.7
Mb) and some example files (approximately 3.2 Mb), for demonstration and practice
purposes, onto the system.
Report Generator displays
the entered name in the About
dialog box accessible from
the help drop-down menu
(Help|About).
During installation, Report Generator will prompt you to enter a license number. If
you have purchased a license, you should enter the license number, the User Name,
and Organization details exactly as supplied by MLS. If there is any discrepancy
between the information by MLS and the information entered, the application will
not install as a registered version and will run in evaluation mode.
If you have not purchased a license, then you can run in evaluation mode by entering
0000-0000-0000-0000 as the serial number. Please refer to the Evaluation Mode
section below for details about this mode.
If the default options are accepted during installation, a short cut in the Gait Lab
menu group called MLS – Report Generator and a desktop short cut will be
created.
Evaluation Mode
Report Generator can run in an evaluation mode for an unlimited amount of time.
The limitations of this mode include the following:
2 • Installation
Report Generator User Manual
•
The application will only print data from the first three pages. Other
pages will be displayed but will not print
•
The header and footer of the report will show default values set by
Motion Lab Systems and can not be changed
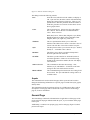
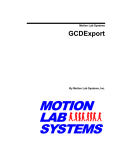
To determine whether your copy of the RGEN software is running in evaluation
mode, click on Help|About ReportGenerator. The About window will state if the
copy is an “evaluation copy” (Figure 3) Figure 3or a “registered version.”
Figure 3: RGEN About window for application running in evaluation mode
Contact Motion Lab Systems, Inc. anytime during this evaluation period to purchase
a registration key and manual.
From Here…..
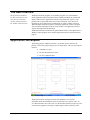
Once you have successfully installed the program,
If you want to:
See:
Get started processing data
Quick Results on page 8
View the program basics
Program Essentials on page 5
View specific information about menu commands
Menu Command Descriptions
on page 31
Learn about file formats used by the program
File Formats on page 65
Table 1: Next steps after installation
Installation • 3
Program Essentials
Overview
GCD files are ASCII
formatted text files using the
GCD lexicon defined by
CAMARC. CAMARC stands
for computer aided movement
analysis in a rehabilitation
context
The primary purpose of the Motion Lab System (MLS) Report Generator (RGEN)
software is to read data from GCD files – text files that provide gait cycle
descriptions, hence the GCD acronym – and generate graphical reports. The Report
Generator software is unique in that it can read data from up to one hundred and
twenty (120) GCD files and plot as many data sets in a graphical report. Secondary
functions of the software include controlling the presentation of data through
standard report (RPT) files, providing access to data from various sources using
open database connectivity (ODBC), and generating graphic files of the entire report
or individual plots.
Report Generator provides the tools in a graphical report editor to create and easily
edit standard RPT files. Through this tool, the user has complete control over all
aspects of the report, including fonts, text colors, and a multitude of graph line
attributes (16 colors, 5 line types, 10 line styles, and 5 line thickness - 4,000 unique
combinations). This makes it easy to generate legible reports for both color and
black-and-white (B&W) printers, as well as color reports that can be photo copied
into legible reports. In addition, any graph can be enhanced with a "normal" activity
bar drawn from a user-defined database.
Report Generator can access any data source that has an ODBC driver (e.g. Paradox,
Microsoft Access and Excel etc) and display and perform calculations based on
information obtained from these external sources. Thus, any report can read and
display data items from existing databases (VICON Clinical Manager (VCM),
Othotrack etc.) as well as any other custom database supported by ODBC.
Report Generator can export either an entire report or specific graphs to Windows
bitmap files. These files may be used to interject graphs into a written report, or to
enhance a presentation. Currently, the individual plots are saved in a 640 X 480
bitmap, while the whole page is saved in a 1024 X 768 bitmap.
Program Essentials • 5
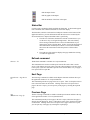
The User Interface
The application remembers
the state in which it was last
used: the size of the main
window and the position of
the Toolbar will be the same.
The Report Generator program, as are all MLS programs, is a 32-bit Windows
95/NT application and will respond to all the standard commands for position and
display control (refer to Application General Usage Instructions, page 87). The
program can be represented on the screen in one of the three ways: full screen
(maximized), as an application icon (minimized), or within a window (restored).
When the Report Generator program is started the application window will appear
with a menu bar and Toolbar at the top of the window. The application will try to
open the last Report that had been used.
Additional information pertinent to the general characteristics of the application as a
Window’s based program can be found in Application General Usage Instructions,
page 87.
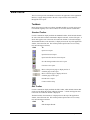
Application Workspace
The primary purpose of Report Generator is to produce reports; therefore, the
primary screen of the program (Figure 4) is an empty report. This view provides the
means to:
•
Add data to a report.
•
Review data plotted in a report.
•
Review a modified report.
Figure 4: RGEN application window.
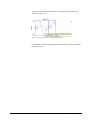
The Report Generator workspace provides the capability to view specific
information about the plotted data, such as its data source or a specific value. To
view this information, move the cursor over the data line and click on a precise point
of the line; the application will open a window (Figure 5) that will show you the
6 • Program Essentials
Report Generator User Manual
source file for the data, the selected point’s value, and the position of the value
within the % Gait Cycle.
Figure 5: Tool tip showing the selected file and data values.
For additional information regarding specific commands, refer to Menu Command
Descriptions, page 31.
Program Essentials • 7
Quick Results
This section provides detailed instructions to guide you through the required steps
for frequently used MLS RGEN activities. Unless a starting point is otherwise
stated, each activity assumes that you are starting with a report open on your screen.
Note that the first time RGEN is run, a report may not be automatically displayed.
During subsequent use, RGEN will automatically open with the last used Report.
Set Displayed Report to User’s Choice
Report Generator automatically opens displaying the last used report. If this report
is not the one you want to use for graphing, follow the instructions below.
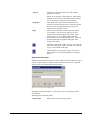
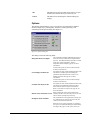
1.0 Select Format from the Tools Menu. The standard MS Windows Open
dialog box (Figure 6) will open to search for RPT files.
Figure 6: RGEN opens the File Open window to search for RPT files
2.0 Select the desired report (RPT file) and click on the Open button. You
will then return to the RGEN application window.
3.0 Select Refresh from the View menu (or press F5) to display the new
report format. If data files are open, the data will be displayed in the
new format.
8 • Quick Results
Report Generator User Manual
Create a New Report (Modify Existing Report)
Report Generator can only create reports based on existing report files, i.e. this
program does not create report files from non-existence to existence. The
instructions included herein guide you through modifying an existing report file to
meet your site-specific needs.
Create a Report Page
1.0 Select a data file using the Open GCD Files button. This will allow
you to select file specific variable names using the drop down
selection, rather than typing the names in manually.
2.0 Open the report file that you want to edit by selecting Format from the
Tools menu.
3.0 From the Edit menu, select Report | Graphs. (Alternatively, select the
Graphs button from the Edit Toolbar.) This opens the report Edit
window to the first page of the report (Figure 7).
Figure 7: Default page of the Edit report window.
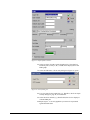
4.0 Select the General Tab. This opens the Edit report section that contains
general information about the report (Figure 8).
Quick Results • 9
Figure 8: General section of the Edit report window.
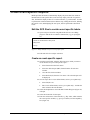
5.0 Click the Add button. This opens the Page Selection dialog box
(Figure 9).
Figure 9: Page Selection dialog box.
6.0 Enter the appropriate page name, e.g. Kinetics, into the Page Selection
dialog box and close the window. The entered name will appear in the
Pages list.
7.0 To add graphs to the newly created page, refer to Define a Report Page,
page 10.
Define a Report Page
1.0 Open the report file that you want to edit by selecting Format from the
Tools menu.
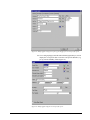
2.0 From the Edit menu, select Report | Graphs. (Alternatively, select the
Graphs button from the Edit Toolbar.) This opens the report Edit
window to the first page of the report (Figure 10).
10 • Quick Results
Report Generator User Manual
Figure 10: A specific page of the Edit report window.
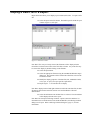
3.0 Select the report page that you want to edit by selecting the appropriate
tab, e.g. Angles.
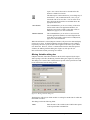
4.0 Enter the number of graphs you would like displayed horizontally and
vertically into the layout fields (horizontal, vertical), e.g. 4, 3 for a total
of 12 graphs. Refer to Specific Report Pages, page 49, for further
information.
5.0 Click the Update button beside the layout fields. RGEN will prompt
you to continue with the update (Figure 11). If the total number of
graphs was increased, a list of [Not Used] graphs will appear in the
Graphs section of the window.
Figure 11: Graph layout update confirmation window.
6.0 If you wish the graphs to have an appearance different than that
defined by the aspect fields in the general page, enter Aspect X and
Aspect Y values. Refer to Specific Report Pages, page 49, for more
information. Only enter values in this window if you want the general
values (listed in the general tab of the Edit Report window) to be
overridden.
7.0 To define the graphs, refer to Define Kinematic and Kinetic Graphs,
page 12, and Define Key Tables, page 14.
Quick Results • 11
Define Kinematic and Kinetic Graphs
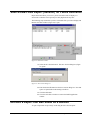
1.0 Open the report’s specific page (Figure 12) that requires graph
definition.
Figure 12: Edit report window, specific page.
2.0 Double click on the [Not Used] graph that you wish to define. The
Graph definition window (Figure 13) opens.
12 • Quick Results
Report Generator User Manual
Figure 13: Graphs definition window.
3.0 Edit the graph information to produce the desired plot. Refer to Graph
dialog box, page 52, for further information regarding each field in the
window. Refer to Figure 14 for a completed definition.
Figure 14: Graph definition window – completed definition.
Quick Results • 13
Define Key Tables
Key tables may be called Gtables in information
distributed with VICON
Clinical Manager.
Key tables provide the means for you to enter text information, i.e.
comments and database variables, into a space allotted for a graph.
This function allows pertinent trial information to appear in the body of
the report amongst other graphs (Figure 15), rather than in a footer or
text document associated with a graphical report.
Figure 15: Key table information plotted in a report.
1.0 Open the report’s specific page (Figure 16) that requires graph
definition.
Figure 16: Edit report window, specific page.
2.0 Select the graph number that you wish to define as a key table and
press the Change Style button. RGEN will prompt you (Figure 17) to
confirm that you wish to change the style of the graph. Note that once
you change the style of a graph, the graph will no longer display [Not
Used].
14 • Quick Results
Report Generator User Manual
Figure 17: Graph style change confirmation window.
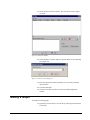
3.0 Double click on the key table graph number. The Key Table dialog
box (Figure 18) opens.
Figure 18: Key Table dialog box – blank for fresh data entry.
4.0 Select the Add button. A red “#” appears with a zero beside it (Figure
19) for you organize the presentation of the text information in
conjunction with the presentation of the GCD files.
Figure 19: Key Table dialog box – line data entry.
5.0 Change the number by the red # to match the number of the display
GCD file (i.e., if you wish to display temporal data for the first GCD
file displayed, enter the number 1).
Quick Results • 15
Highlight the organization line (#) and select the Add Line button
(
Figure 20: Key table dialog box – an example.
).
Figure 20: Key table dialog box – an example.
7.0 Click the “+” by the Line 1 to display spaces to enter information for
display.
8.0 Enter the desired information into the left, center, and right justified
lines.
E.g.:
{Name}
{PatientNo},{Side}
{Date}
or
Cadence
leave blank
{Cadence}
The results of information entered into this example are displayed in
Figure 15.
9.0 Select the Add Line button to add another variable, e.g. step length, to
display for the selected GCD file in the same text box.
10.0Select the Add button to display data for another GCD file. Be sure to
change the number by the red # to match the number of the order in
which the GCD file is listed.
16 • Quick Results
Report Generator User Manual
Display a Data File in a Report
Report Generator allows you to display up to 120 data (GCD) files. To open a GCD
file:
1.0 Select the Open GCD Files button. The RGEN-specific GCD file open
window (Figure 21) will open.
Figure 21: GCD Files window.
Note that if files were previously selected, the filenames will be displayed in the
GCD Files Used in Session section of the GCD Files window. Any of the files may
be selected for display by double-clicking on the filename.
2.0 Select the Open button.
3.0 Select the appropriate filename using the standard MS Windows Open
dialog box. The filename will be listed in the GCD Files section of the
GCD Files window.
4.0 Modify the display properties of the data file (side, standard deviation,
color, style, ex style)) for report-specific requirements.
5.0 Repeat steps 2 – 4 for each data file to display.
Note that to display both left and right side data stored in the same data file, the data
file must be listed in the GCD Files section twice and modified to reflect the
different data.
6.0 Select the OK button when all data files are selected. The selected data
will be displayed in the active report.
Note that if the “Prompt for Missing Variables” option is turned on and there is a
mismatch between variable names in the GCD and RPT files, the Missing Variables
dialog box will open. Refer to Missing Variables dialog box, page 33, for more
information.
Quick Results • 17
Save a Data-Filled Report (Session) for Future Reference
Report Generator allows you to save a precise list and its order of display to a
Session file so that the exact report may be easily duplicated at any time.
The following steps assume that you have selected the files you wish to display and
that the GCD Files window (Figure 22) is open.
Figure 22: GCD Files window.
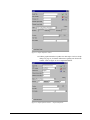
1.0 Select the Save Session button. The Save Session dialog box (Figure
23) opens.
Figure 23: Save Session dialog box
2.0 Enter the desired filename into the Save Session dialog box. Note that
spaces are permissible in the naming convention.
3.0 Click the OK button.
4.0 Close the GCD Files window to return to the RGEN application
window.
Retrieve a Report that was Saved as a Session
To open a report that was previously saved using the Save Session option:
18 • Quick Results
Report Generator User Manual
1.0 Select the Open GCD Files button. The GCD Files window (Figure
24) opens.
Figure 24: GCD Files Window.
2.0 Select the Retrieve Session button to open the Retrieve Session dialog
box (Figure 25).
Figure 25: Retrieve Session dialog box.
3.0 Enter the appropriate filename manually or by selecting it from the
drop down list.
4.0 Click the OK button.
5.0 Close the GCD Files window to return to the RGEN application
window.
Modify a Graph
To modify an existing graph:
1.0 Open the report file that you want to edit by selecting Format from the
Tools menu.
Quick Results • 19
2.0 From the Edit menu, select Report | Graphs. (Alternatively, select the
Graphs button from the Edit Toolbar.) This opens the report Edit
window to the first page of the report (Figure 26).
Figure 26: Default page of the Edit Report window.
3.0 Select the report page that you want to edit by selecting the appropriate
tab, e.g. Moments.
4.0 Double click on the graph that you wish to edit. The Graph definition
window opens (Figure 27).
20 • Quick Results
Report Generator User Manual
Figure 27: Graph definition window – completed definition.
5.0 Edit the component of the graph, such as Minimum and Maximum
values, as needed.
6.0 Select the OK button to close the Graph definition window.
7.0 Select the Close button. Your changes will be automatically applied.
8.0 If you wish to save these changes to the report format permanently,
select either File | Save or File | Save As.
Place Report Graphics into a Word Processing
Document
These steps begin after the user has displayed the desired data in a report.
1.0 Select the Export option on the File Menu. The Export to Bitmap
window (Figure 28) opens.
Quick Results • 21
Figure 28: Export to Bitmap window.
2.0 Select the graphs to export to a bitmap file and click on the OK button.
A standard MS Windows file selection dialog box opens.
3.0 Select the folder in which to place the bitmap files. RGEN
automatically assigns graph specific names, e.g.,
JointRotationAngles_AnkleDorsiPlantar, to the graphics files.
4.0 Place the graphic files (.BMP) into the desired document using the
package-specific steps, e.g., Insert|File.
Display File Specific GCD variables
RGEN provides the option to add file specific GCD variables to the database of
variables maintained by the program. To invoke this option:
1.0 Select the GCD Variables option from the Edit menu. When this
command is selected, the GCD Variables dialog box (Figure 29) is
opened.
22 • Quick Results
Report Generator User Manual
Figure 29: GCD Variables dialog box.
2.0 Select the GCD file button. The standard MS File Open dialog box
opens.
3.0 Select the GCD file that contains the variables you would like added to
RGEN’s database.
4.0 The variables will be added to the database and will be available for
future use, unless you choose to manually remove them.
Display Temporal Data from Selected GCD Files (Key
Table)
Refer to Define Key Tables, page 14, for information.
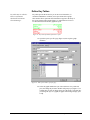
Display Standard Deviation Data
RGEN provides two options for displaying standard deviation data: as a shaded area
(Figure 32) or a data line that encompasses the region. You may make and change
your selection through the Options window, as directed below:
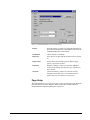
1.0 Select Options from the Tools menu. The Options window (Figure
30) opens.
Quick Results • 23
Figure 30: Options dialog box.
The standard deviation
display option may also be
selected from the Tools Menu.
2.0 Select either the box for shading or data line style. As this is not an
automatic toggle, deselect the option that you do not wish to use.
3.0 Apply your changes by selecting the Apply button, if any were made,
and close the Options window by selecting the OK button.
4.0 Open the GCD Files Window (Figure 31) and select the desired data
files. Refer to Display a Data File in a Report, page 17, for more
information.
5.0 For those files that contain standard deviation data that you would like
displayed, highlight the filename by selecting the line and then click on
the “No” option under the “Std. Dev” column. This will change the
response to “Yes.” Selecting the “Yes” response will change it to
“No.”
Figure 31: GCD Files window – select “Yes” to display standard deviation data
6.0 Close the Open GCD Files window. The report will display the
standard deviation data as either a shaded region (Figure 32) or an
encompassing line, as setup by the program’s options.
24 • Quick Results
Report Generator User Manual
Figure 32: Graph with a shaded area representing the standard deviation
Apply a Different Report (RPT) Format to Displayed Data
RGEN provides the means to change a format of data displayed without having to
recreate an entire report.
1.0 Select Format from the Tools menu.
2.0 Select the desired report (RPT) format from the file selection window.
3.0 Close the file selection window.
4.0 Select Refresh (F5) from the View menu. The selected report will be
displayed.
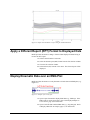
Display Kinematic Data over an EMG Plot
RGEN provides the means to overlay kinematic or kinetic data with EMG plots, e.g.
(Figure 33).
Figure 33: Example of an overlay plot.
1.0 Open a report formatted to display EMG data (e.g., EMG.rpt). If the
EMG report is not the open report, refer to Set Displayed Report to
User’s Choice, page 8, for instructions.
2.0 Open a GCD file that contains EMG data (e.g., emg data.gcd). Refer
to Display a Data File in a Report, page 17, for instructions.
Quick Results • 25
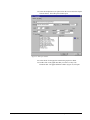
3.0 Select the Graphs button (or right-click on the screen and select Graphs
from the menu). The Edit report window opens.
Figure 34: Edit report window.
4.0 Select the tab for the page that contains the graph to be edited.
5.0 Double-click on the graph name that you wish to overlay with
kinematic data. The graph definition window (Figure 35) will open.
26 • Quick Results
Report Generator User Manual
Figure 35: Graph definition window.
6.0 Select OverlayA from the Overlay dropdown list. Note that four
kinematic plots (overlay A, B, C, and D) can be displayed for each
EMG graph.
7.0 Select the Edit button. The Overlay dialog box (Figure 36) opens.
Figure 36: Overlay dialog box.
8.0 Type in a name for the Graph Title (e.g., KneeFlex). Refer to Graph
Overlay dialog box, page 54, for instructions.
9.0 Select the GCD variable (e.g., KneeFlexExt) that is to be displayed
with the EMG plot.
10.0Repeat steps 6 - 9 for each graph that you want to be represented
against kinematic data.
Quick Results • 27
Create Event-Specific Reports
RGEN provides the means to automatically display only those data files which are
labeled with an event specific label, so the user may simply select all of a patient’s
files, but limit the display to those of a certain constraint, e.g. with crutches. In order
to perform this advanced function, three distinct steps, editing the GCD file, defining
the specific event, and displaying the new report, must be performed as described
below.
Edit the GCD files to contain event specific labels.
1.0 Open a subject’s GCD file using MLS Edit GCD or a text-editing
program. Edit the file to contain a comment line, e.g. pre-op (Figure
37).
#!DST-2.0 GCD Motion Lab Systems
$KeyValue
Pre-op
Figure 37: Sample GCD file text for an event-specific report
2.0 Edit each GCD for a subject as desired.
Create an event-specific report.
3.0 Open the report format, using the following steps, which you want to
use as the basis for your event-specific report.
•
Select Format from the Tools menu.
•
Select the desired report (RPT) format from the file selection
window.
•
Close the file selection window.
•
Select Refresh (F5) from the View menu. The selected report will
be displayed.
4.0 Save the report file to a user-defined name, such as “pre-op data only.”
•
Select File|Save As
•
Enter a user-defined name, such as “pre-op data only.” Include the
.RPT extension after the filename.
5.0 Select the Graphs button - the Edit: RPT Format dialog box (Figure 38)
will open.
6.0 Select the General tab for the report.
7.0 Enter the section name of the GCD file, e.g. Key Value, which contains
the event-specific variables, e.g. pre-op or crutches, into the Graph Key
box (Figure 38).
28 • Quick Results
Report Generator User Manual
Figure 38: Sample graphs setup, for a report’s general page, for an event-specific report.
8.0 Go to each graph page and edit each individual graph that you want to
display the event-specific data. Enter the event-specific identifier, e.g.
pre-op, into the field Key Value (Figure 39).
Figure 39: Sample graph setup for an event-specific report
Quick Results • 29
9.0 Close the Edit window.
10.0Save the changes to the new report, using File|Save.
11.0Repeat these steps for each event specific report that may be used.
Display the GCD files in each event-specific report.
12.0Select the appropriate report format, such as pre-op or crutches.
13.0Open all of a subject’s GCD files using the Open GCD Files dialog
box (Figure 40). Be sure to select the files twice if they include data
for both left and right sides.
30 • Quick Results
Report Generator User Manual
Figure 40: GCD Files (plots) dialog box.
14.0Close the Open GCD Files dialog box.
Quick Results • 31
Menu Command Descriptions
File Menu
The File Menu can always be selected from the left side of the Menu Bar. This
menu contains commands that open, print, save, and export reports. Additionally,
data files may be opened from this menu.
New
Shortcut – C TRL+N
To select data for display,
refer to the Open GCD Files
command on the File menu.
The New Report command is available on the Report Generator toolbar at the top of
the application window or via a keyboard shortcut.
This command allows you to choose a report to open, using the standard MS
Windows File Open dialog box. The selected report will be opened in a new
window
Repeat
Shortcut – C TRL+R
To select data for display,
refer to the Open GCD Files
command on the File menu.
The Repeat report command is available on the Report Generator toolbar at the top
of the application window or via a keyboard shortcut.
This command opens a new copy of the last report file that was opened. This blank
report will be opened in a new window.
Open GCD Files
Shortcut – C TRL+O
You can display up to 120
data sets (GCD files) in one
report.
The Open GCD Files command is available on the Report Generator toolbar at the
top of the application window or via a keyboard shortcut.
This command is used to open GCD files and to add the data within to the active
report via the GCD Files dialog box (Figure 41). If all data within the GCD file
matches up to the variables requested by the active report, the data will be applied to
the active report without user interaction.
However, if there is a mismatch between the data and requested variables, the
Missing Variables dialog box (Figure 42) will open for user intervention before
processing can continue. Refer to Missing Variables dialog box, page 33, for further
information.
32 • Menu Command Descriptions
Report Generator User Manual
GCD Files dialog box
You can open GCD files
stored in many different
locations, such as your
computer hard disk or a
network drive to which you
are connected.
This dialog box (Figure 41) allows you to choose the GCD files, up to 120 files, to
be plotted on a report. Additionally, this box provides the ability to select the
specific data contained in the GCD file (left versus right and standard deviation
data) and formats the plotting style.
Figure 41: GCD Files (plots) dialog box.
This dialog box has the following controls:
GCD Files
This window section shows a list of GCD files that are
presently being plotted in the active report. Additionally,
this box shows you and allows you to select the side for
plotting, if standard deviation data is to be plotted, and the
color, style and extended line styles for each plot.
You can change the order of the files by dragging and
dropping the filename.
Note that Report Generator will only open 120 GCD files.
Once 120 files are selected, Report Generator will gray the
data displayed in the GCD Files Used in Session and the
Open button will not be available for selection.
GCD files used in
Session
This box contains a list of all the GCD files that have been
opened during a session. Any file from this list can be
added to the GCD Files box by double clicking on the
filename.
Open
This command allows you to choose a new GCD file to
plot in a report. It opens the standard MS Windows File
Open dialog box from where you can choose the GCD
files. The application allows you to choose multiple GCD
files by using a combination of the SHIFT and CTRL
keys.
Remove
This command removes a GCD file from the plotted
Menu Command Descriptions • 33
report. One or more files must be selected before this
button is available for selection.
This button opens a menu that allows you to change any of
the attributes – side, standard deviation, color, or style –
associated with one or more files. You can select one or
more files from the GCD Files box and then choose the
appropriate menu item.
Save Session
This command allows you to save a history of the GCD
file list and its order to the application database, so a
duplicate report can be created at a later date. Refer to
Edit|Session, page 41, for more information.
Retrieve Session
This command allows you to retrieve a session record
from the application’s database in order to duplicate the
report that was originally created. Refer to Edit|Session,
page 41, for more information.
When the OK button is selected, Report Generator will process the data and display
it in the active report. If all data within the GCD file matches up to the variables
requested by the active report, the data will be applied to the active report without
user interaction. However, if there is a mismatch between the data and requested
variables, the Missing Variables dialog box (Figure 42) will open for user
intervention before further processing can continue.
Missing Variables dialog box
If Report Generator cannot find variables in the GCD file requested by the report
while opening a GCD file, the Missing Variables dialog box (Figure 42) will open.
This dialog box is used to enter variables that are present in the report file but could
not be found in the GCD file being plotted.
Figure 42: Missing Variables dialog box.
The dialog box will tell you which variable it is asking for and the side for which the
information is needed.
This dialog box has the following fields:
Data
34 • Menu Command Descriptions
Enter the name of the variable in the GCD file that equates
to the requested data in the RPT file.
Report Generator User Manual
Data Type
This is a drop list that you can use to describe the type of
data you are entering.
Left and Right side
same
Clicking on this check box ensures that the application
will assume that the value of the variable requested is the
same on both sides. This box should be checked for
variables like Mass, Height and Date while is should be
left unchecked for variables like Cadence.
Do not prompt me
anymore for ANY
variables
Selecting this box ensures that you will not be prompted
for missing variables anymore.
Do not prompt me
anymore for THIS
variable
Selecting this box ensures that you will not be prompted
for the particular variable anymore.
Close
The Close command is available on the Report Generator toolbar at the top of the
application window. Additionally, you can close a report by using the Close icon on
the document's window.
This command closes the active report. If changes were made to a report during a
session, Report Generator will automatically prompt you to save changes to your
report before you close it. If you close a report without saving, you will lose all
changes made to that report since the last time the document was saved.
Save
Shortcut – CTRL+S
The Save command is available on the Report Generator toolbar at the top of the
application window or via a keyboard shortcut.
This command opens the standard MS Windows dialog box for saving; through this
box, the active report can be saved to its current name and location. To change the
filename of the report or its location use the Save As command.
Save As
This command opens the standard Windows dialog box for saving a file to a custom
name and location; through this box, you may save the open report to a user-defined
name and location. Report Generator displays the Save As dialog so you can name
your report.
To save a document with its existing name and directory, use the Save command.
Export
Individual plots are saved in
a 640 X 480 bitmap, while the
whole page is saved in a 1024
X 768 bitmap.
This command allows you the save the active page or select plots from the page to a
bitmap. You can specify the location where the images should be saved, but the
program will automatically name the files with graph specific names:
•
The whole page will be saved with the page title as the name of the file.
•
If you selected to save individual plots, one file will be generated per
individual plot and its name will be the same as the title of the plot.
Menu Command Descriptions • 35
Upon selection, this command opens the Export to Bitmap dialog (Figure 43) box
where you can make your selections and complete this operation.
Export to Bitmap dialog box
The Export to Bitmap dialog box (Figure 43) allows you to choose whether to export
the whole page or specific plots to a bitmap.
Figure 43: Export to Bitmap dialog box.
This dialog has the following controls:
Full Page
Select this button to export the whole page to a bitmap.
Selected Graphs
If this button is selected, only the graphs that have been
selected in the Graphs box will be saved as individual
bitmap files.
Graphs
This list control shows you all the graphs on the active
page. You can select or deselect the graphs that you want
to export.
Help
This button opens help text pertinent to the Export
command.
OK
This button closes the dialog box and asks you to choose a
location where the bitmap files can be saved.
Cancel
This button closes the dialog box without creating bitmap
files.
36 • Menu Command Descriptions
Report Generator User Manual
Print
This command is used to print the report to the selected printer. This command
opens the standard MS Windows Print dialog box where you may specify the range
of pages to be printed, the number of copies, the destination printer, and other printer
setup options.
Print Dialog box
The following options within the standard MS Windows Print dialog box (Figure
44) allow you to specify how the report should be printed by the application.
Figure 44: Print dialog box
Printer
This is the system’s name for the active printer and printer
connection. Select the appropriate printer from the dropdown
list.
Setup
Displays a Print Setup dialog box (Figure 45), so you can
select the appropriate print options, e.g. orientation. Refer to
Print Setup, page 37, for more information.
Print Range
Specify the pages you want to print:
All
Prints the entire document.
Selection
Prints the currently selected text.
Pages
Prints the range of pages you specify in the From and To
boxes.
Copies
Specify the number of copies you want to print for the above
page range.
Collate Copies
Prints copies in page number order, instead of separated
multiple copies of each page.
Menu Command Descriptions • 37
Print Quality
Select the quality of the printing. Generally, lower quality
printing takes less time to produce.
Print Preview
Use this command to display the report, as it would appear when printed. When you
choose this command, the main window will be replaced with a print preview
window in which one or two pages will be displayed in their printed format. The
print preview toolbar offers you options to view either one or two pages at a time,
move back and forth through the document, zoom in and out of pages, and initiate a
print job.
Print Preview toolbar
The print preview toolbar offers you the following options:
Print
Bring up the print dialog box, to start a print job.
Next Page
Preview the next printed page.
Prev Page
Preview the previous printed page.
One Page / Two
Page
Preview one or two printed pages at a time.
Zoom In
Take a closer look at the printed page.
Zoom Out
Take a larger look at the printed page.
Close
Return from print preview to the editing window.
Print Setup
The Print Setup command can be used to select a printer and a printer connection.
This command opens the standard Windows Print Setup dialog box (Figure 45),
where you can select the printer and its connection and select the appropriate print
options, e.g. orientation.
Print Setup dialog box
The following options within the standard MS Windows print setup dialog box
(Figure 45) allow you to select the destination printer and its connection.
38 • Menu Command Descriptions
Report Generator User Manual
Figure 45: Standard MS Windows print setup dialog box
Printer
Select the printer you want to use using the dropdown list.
Note that you install printers and configure ports using the
standard MS Windows Control Panel.
Orientation
Choose Portrait or Landscape.
Paper Size
Select the size of paper that the document is to be printed
on.
Paper Source
Some printers offer multiple trays for different paper
sources. Specify the tray here.
Properties
Displays a dialog box where you can make additional
choices about printing, specific to the type of printer you
have selected.
Network...
Choose this button to connect to a network location,
assigning it a new drive letter. Note that this option
appears only if your computer is on a network.
Page Setup
This command allows you to specify the type of paper to which the report should be
printed and choose the paper margins. When selected this command opens the
standard Windows Page Setup dialog box (Figure 46).
Menu Command Descriptions • 39
Figure 46: Standard MS Windows page setup dialog box
This box has the following controls:
Size
This is the size of the paper that is present in the printer
Source
This is the tray in the printer from which the paper should
be used.
Orientation
You can choose Portrait or Landscape for the orientation
of the paper.
Margins (inches)
There are four boxes where you can specify the top,
bottom, left and right margins -all in inches.
Printer
The Printer option takes you to a secondary Page Setup
screen where you can select the printer that will be used.
Exit
Use this command to end your Report Generator session. You can also use the
Close command on the application Control menu. Report Generator prompts you to
save reports with unsaved changes.
Edit menu
The Edit menu provides commands to edit a report’s format and to control automatic
data processing, specifically means to automatically call GCD variables and
duplicate data processing steps.
40 • Menu Command Descriptions
Report Generator User Manual
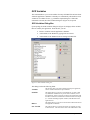
GCD Variables
This command allows you to read variables from any GCD/DST file and store them
within the application’s database so that they are automatically called when a GCD
variable list is available for use, e.g. within the Graphs dialog box. When this
command is selected, the GCD Variables dialog box (Figure 47) is opened.
GCD Variables Dialog Box
Upon opening, the GCD Variables dialog box (Figure 47) displays all the variables
that are stored by the application. From this box you can:
•
Remove variables from the application’s database.
•
Add variables to the database by typing in the new names.
•
Add variables to the database from an existing GCD/DST file.
Figure 47: GCD Variables dialog box.
This dialog box has the following fields:
Variables
This list box shows you all the variables stored by the application,
not the variables found in the open GCD files.
GCD File
This button allows you to select a GCD/DST file, in order to add
any additional variables that are present in the GCD file, but not
the application. When a GCD file is selected, the application reads
the name of numerical variables that contain more than one sample
(i.e. variables excluding temporal variables) and adds them to the
application list.
Remove
This button allows you to remove the selected variable from the list
and application’s database.
New Variable
This edit box allows you to enter the name of a variable you want
to add to the list. You then need to click on the Add button to add
Menu Command Descriptions • 41
this variable to the list.
Add
This button adds the variable you entered in the New Variable edit
box to the list of variables.
Source
This command opens the code for the active report in Notepad or your default text
editor.
Session
Report Generator provides the ability to save report information, the data files
displayed, and the order in which they were displayed to the application’s database
as a session. This enables the user to duplicate a report - the format, the specific
data, and the order of the data display - in the future with minimal effort.
Save
This command allows you to save a history of the GCD file list and its order to the
application database, so a duplicate report could be created at a later date. When
selected, the Save Session dialog box (Figure 48) opens. Enter a name for the
session. Note that spaces are permissible in the naming convention.
Figure 48: Save Session dialog box
Retrieve
This command allows you to retrieve a session, record from the application’s
database in order to duplicate the report that was originally created. When selected,
the Retrieve Session dialog box (Figure 49) opens. You may select the preferred
session from the drop list box, or type the session’s name into the command line.
Figure 49: Retrieve Session dialog box.
42 • Menu Command Descriptions
Report Generator User Manual
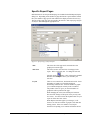
Report
This command provides several options for editing the active report format: Header,
Footer, Line Attributes, and Graphs. These options provide the means to customize
every aspect of a report to meet the specific needs of an individual report.
Header
The Edit: Header command is available on the Report Generator toolbar at the top of
the application window.
The size of the header will
vary with contents.
This command allows you to create a header section within a report and edit its
contents. When this command is selected the Header dialog box (Figure 50) opens,
so you can customize the contents and format of the header information for the
active report.
Figure 50: Edit Report Header dialog box.
This page has the following controls:
Title
This control allows you to set the title for the report.
Title Font
This control shows you the font name, style, size, and color with
which the title of the header/footer is written. This is a read only
button. This
box. To change the selected font click on the
will open the standard Windows Font dialog box where you can
make your choices.
Lines Font
This control shows you the font name, style, size, and color with
which the lines of the header/footer of the report are written.
This is a read only box. To change the selected font click on the
button. This will open the Font dialog box where you can
make your choices.
Box On
If this box is checked, a box is drawn around the header/footer.
Menu Command Descriptions • 43
Data
This tree control with two levels is displayed once information is
added using the Add button. The first level shows you the line
number and the second level shows you the text which is to be
displayed
Left Justified
Right Justified
Center Justified
Level 1
This level shows you the line number. You can perform the
following operations at this level.
Allows you to add a new line.
Allows you to delete the selected line.
Allows you to move the selected line up by one as
along as it is not the first line.
Allows you to move the selected line down by one as
along as it is not the last line.
Level 2
You cannot perform any of the operations mentioned above at
this level. However, you can edit the items by just clicking on it
entering new values in the edit box. To perform this editing,
click on the text once to select the item. Once the item is
selected, click on it again and an edit box will open and you can
edit the item.
Footer
The Edit: Footer command is available on the Report Generator toolbar at the top of
the application window.
This command allows you to customize the contents and format of the footer in the
active report. When this command is selected the Footer dialog box (Figure 51)
opens, so you can customize the contents and format of the footer information for
the active report.
44 • Menu Command Descriptions
Report Generator User Manual
Figure 51: Edit Report Footer dialog box.
This page has the following controls:
Title
This control allows you to set the title for the report.
Title Font
This control shows you the font name, style, size, and color with
which the title of the header/footer is written. This is a read only
button. This
box. To change the selected font click on the
will open the standard Windows Font dialog box where you can
make your choices.
Lines Font
This control shows you the font name, style, size, and color with
which the lines of the header/footer of the report are written.
This is a read only box. To change the selected font click on the
button. This will open the Font dialog box where you can
make your choices.
Box On
If this box is checked, a box is drawn around the header/footer.
Data
This is a tree control with two levels that displays information
added using the Add button. The first level shows you the line
number and the second level shows you the text which is to be
displayed
Left Justified
Right Justified
Center Justified
Menu Command Descriptions • 45
Level 1
This level shows you the line number. You can perform the
following operations at this level.
Allows you to add a new line.
Allows you to delete the selected line.
Allows you to move the selected line up by one as
along as it is not the first line.
Allows you to move the selected line down by one as
along as it is not the last line.
Level 2
You cannot perform any of the operations mentioned above at
this level. However, you can edit the items by just clicking on it
entering new values in the edit box. To perform this editing,
click on the text once to select the item. Once the item is
selected, click on it again and an edit box will open and you can
edit the item.
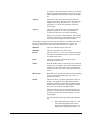
Line Attributes
The Edit: Line Attributes command is available on the Report Generator toolbar at
the top of the application window. Note that if you access this command by right
clicking on a plotted line, the elements displayed in the dialog box (Figure 52) will
belong to that of the selected line.
This command provides the means to change the Line Attributes of the printer or the
screen. When selected, this command opens the Line Attributes dialog box (Figure
52), which allows you to make the required changes.
The Line Attributes dialog box allows you to customize how the lines are drawn on
the Screen or Printer. There are two columns of controls, one for Printer and one for
Screen. The controls in both columns behave in similar manners. However, the
Printer settings include options for automatically matching the screen settings or for
preparing a black and white report.
46 • Menu Command Descriptions
Report Generator User Manual
Figure 52: Edit Line Attributes dialog box.
This dialog box has the following controls.
Line
Select the Line (called a Pen in the window) to display or
edit. Upon selection, the other controls will automatically
display the current properties of this line. There are 120
possible Pens to draw the permitted maximum number of
GCD files, plus there is a selection for box that is used to
draw a graph’s frame.
Color
This is a drop list box. It shows the color with which a
line is drawn. This list has the 16 standard Windows
colors. These colors are:
Black, Red, Green, Yellow, Blue, Magenta, Cyan, White,
Dark Red, Dark Green, Dark Yellow, Dark Blue, Dark
Magenta, Dark Cyan, Light Grey, Dark Grey.
Thickness
This is a spin button that allows you to choose the
thickness with which a line is drawn. Note that a value of
0 and 1 both will draw a line with a width of one pixel.
Style
This drop list box allows you to choose the style – dashed,
dotted, etc. – with which a line is drawn.
Identifier
This allows you to choose a geometrical shape that is
drawn at equal intervals on the line.
GCD File
This shows you the GCD file for which the line that is
selected is applicable. If there are no GCD files being
plotted for the selected line number, this box will display
“No GCD File”.
Same As Screen
This command sets all Printer Pen settings - color,
thickness, style, and identifier - for all Pens to the same
settings as those selected for the Screen Pens.
Black & White
This command changes the Printer Pen color setting for all
Pens to black. The style and identifier settings will be set
to default values.
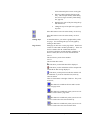
Graphs
This command can be used to edit all the pages in the report and can be used to
change all the defining information on a specific page to include font styles, graphs,
and key tables.
This command opens the General Page (Figure 53) of Edit Property Sheet, which
encompasses several pages that are used to edit a report. Refer to General Page,
page 46, for more information.
General Page
The General Page contains the information that is applicable to all the pages of the
report and it lists all pages defined within the report, so you can add or delete pages
to the report.
Additionally, it contains a one-property page (tab for each page (Figure 55) that is
present in the report.
Menu Command Descriptions • 47
Figure 53: General Page of Report Graphs.
The controls within this dialog box include the following:
Title Font
This font is used to write the Title of each page in the
report. This is a read only box. To change the selected
button beside the Title Font line.
font click on the
This will open the standard MS Windows Font dialog box
where you can make your selection.
Axis Font
This font is used to write on the axes of each graph that is
present in the report. This is a read only box. To change
button beside the Axis
the selected font click on the
Font line. This will open the standard MS Windows Font
dialog box where you can make your selection.
Bar File
This is a read only control that allows you to select a text
file (extension .INI) which contains details about the ON
and OFF state of included variables. Each file may
contain several sections; each section may contain a
various number of variables with the associated ON and
OFF data. Refer to Muscle File, page 79, for more
information about the file and its format.
Click on the
to change the selected file.
Bar Section
This drop list box displays the sections present in the
chosen Bar file. Choose the section from which the
variable should be read.
Aspect X
This is the X value of the aspect ratio with which the
graphs will be plotted.
48 • Menu Command Descriptions
Report Generator User Manual
Aspect Y
This is the Y value of the aspect ratio with which the
graphs will be plotted.
NOTE: To use the Aspect X and Aspect Y, both controls
should have valid values: whole numbers between 0 and
255. Note that this excludes the values 0 and 255.
Graph Key
This variable is the name of the user-defined section
created in a GCD file used to create event-specific reports.
Refer to Create Event-Specific Reports, page 28, for
instructions for using this variable.
Pages
This is a list box that shows you the titles (also called
section names – refer to Sections, page 66, for more
information) of all defined pages in the report. These
names are unique - no two pages can have the same
section names. You can add and delete pages. These can
be done with the following buttons that appear at the
bottom of this control.
This button can be used to add a new page. This opens the
Page Section dialog box (Figure 54), where you will need
to give a section name for this page.
This button allows you to Delete a page. This action is
unrecoverable. You will be prompted before the page is
deleted.
Page Section dialog box
The Page Section dialog box (Figure 54) opens when you select to add a new page to
a report. This box allows you choose a name for the section for the new page that
will be created. The section name should be unique.
Figure 54: New Page Section Dialog Box.
This dialog box should be unique. If you do not want to create the page, hit the
Cancel button.
The dialog has the following fields:
Section Name
Enter the title for the new page (section).
Menu Command Descriptions • 49
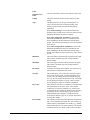
Specific Report Pages
Individual tabs for each report-defined page are included in the Edit Report|Graphs
dialog box. Depending on the number of pages defined in a report and their related
titles, the number of page specific tabs and the titles displayed in the tabs will vary.
The title of the report page will correspond to the tab title. Each report page (Figure
55) may be edited through the appropriate tab.
Figure 55: Specific Page of Report Graphs.
Title
This is the title of the page and is centered above the
graphs present on the page.
Title Font
This font is used to write the Title of each page in the
report. This is a read only box. To change the selected
button. This will open the standard
font click on the
Windows Font dialog box where you can make your
selection.
Layout
There are two controls here, horizontal and vertical. Enter
the number of graphs you would like displayed
horizontally in the first box. Enter the number of graphs
you would like displayed vertically in the second box.
The product of the two gives you the total number of
graphs that will be printed on the page.
When changing the values, note that Report Generator
does not make changes to the report when you only enter
new values. You must click on the Update button for your
report to reflect these new values.
When Report Generator applies your changes, it will
check to see if the new number of graphs is less than that
already present. If the new number is less, Report
Generator will prompt you to continue and delete the last
50 • Menu Command Descriptions
Report Generator User Manual
few graphs or cancel the operation. Otherwise, if the new
number of graphs is more than those present, new graphs
will be added and identified as [Not Used] in the Graphs
list.
Aspect X
This is the X-value of the aspect ratio with which the
graphs will be plotted. The aspect ratio is the ratio of the
length of the X-axis to that of the Y-axis. If a value is
entered here, it overrides the value that is used in the
General Page.
Aspect Y
This is the Y-value of the aspect ratio with which the
graphs will be plotted. If a value is entered here, it
overrides the value that is used in the General Page.
NOTE: To use the Aspect X and Aspect Y, both controls
should have valid values: whole numbers between 0 and
255. Note that this excludes the values 0 and 255.
All the graphs on a page use the same X-axis definition. The labels and values of
this axis are annotated on only those graphs at the bottom of a column. The
following controls in the X Axis box are used to define this “common” axis.
Minimum
This is the minimum value on the X-axis.
Maximum
This is the maximum value on the X-axis.
Interval
This is the interval, e.g. every 25% of distance defined by
the maximum and minimum values, at which tick marks
are placed on the X-axis.
Label
This is the X-axis label, which shows the unit of
measurement on the X-axis.
Update
When the Update button is selected, the values in the four
controls above are updated. Note that the minimum value
should be less than the maximum value; the application
will notify the user if the values entered do not meet this
criteria.
Show Events
When this box is selected, tick marks will be placed along
the top of each graph indicating gait cycle events, e.g.
opposite foot contact.
Graphs
This list box shows you all the graphs and key tables on
the page. The graphs have the graph number and the
graph title, while the key tables have the graphs number
and the entire key table string. Graphs that are not used
have Not Used written after the graph number.
Each graph can also have four plots, numbered as G1A,
G1B, G1C, and G1D, that are overlaid on the main plot.
Note that the A plot will be positioned at the top of the
original graph.
You can perform the following actions from within this
box:
•
Edit a graph by double clicking on it. This
will open the Graph dialog box (refer to
Figure 56 in Graph dialog box, page. The
dialog opened will depend on whether you
Menu Command Descriptions • 51
click on the main plot or on an overlay plot.
•
Edit a key table by double clicking on the
entry. This will open the Key Table dialog
box (refer to Figure 59 in Key Table dialog
box, page 54).
•
Rearrange the order of the plots using the up
and down arrows.
•
Change the style of the plot from a graph to a
key table.
Select this button to move the selected entry one level up.
Select this button to move the selected entry one level
down.
Change Style
As mentioned above, you can have graphs and key tables
on a page. You can change the style of each graph by
clicking on this button.
Page Footers
Each page can have one or more page footers. Each footer
consists of a label and a variable separated by \. There can
also be a number after the variable that shows the
precision to which the variable should be calculated. In
the tree control, there are two levels described below:
Level 1
This level shows you the footer number.
Level 2
This level has three entries:
This shows you the label that will be displayed.
This shows you the variable that will be computed for
each GCD file that is being displayed.
This shows you the precision to this the variable will
be calculated. If you do not want this used, enter any
value less than 0.
There are four buttons to the right of this box. They work
as follows;
This button is available at all times and is used to
add a new page footer.
This button is available only when you are at Level
1 and it is used to delete a page footer.
This button is available only when you are at Level
1 and it is used to move the selected footer up.
This button is available only when you are at Level
1 and it is used to move the selected footer down.
52 • Menu Command Descriptions
Report Generator User Manual
Graph dialog box
This dialog box is used only
for those graphs that chart
data.
This is the dialog box that opens when you double click on a graph name displayed
in the Graphs box of report’s specific page. This box (Figure 56) allows you to
change the presentation of the graph that is plotted.
Figure 56: Dialog Box for graph specific Information.
This dialog box has the following fields:
Graph Title
This is the title of the Graph. It appears at the top of the
graph.
Graph Variable
This is the variable that is selected for plotting. Variables
may be selected using the drop list box, or may be typed in
directly if known. Note that if a specific file’s variable is
not available from the list, you can add the variable to the
list using Edit|GCD Variables (page 40).
Note that if you enter MLSLegend as the variable name,
then the application will print out the file name, data in the
COMMENTS section of the GCD file or the
trial.comments variable and the line style used for the
GCD file. As many entries as will fit into the box will be
printed. You can enter a title if you want into the Graph
Title box. All other fields are not used in this case.
Ordinate Unit
This is the unit of the X-axis and is written to the left of
the graph.
Ordinate Upper
This is the label which is present at the top of the X-axis.
Menu Command Descriptions • 53
Label
Ordinate Lower
Label
This is the label that is present at the bottom of the X-axis.
Scaling
This is the frame that encloses all the controls for data
scaling.
Type
This drop list shows you the type of scaling that is in
effect. The possible types are Normal Scaling, Auto
Scaling with Annotation, and Auto Scaling without
Annotation:
When Normal Scaling is selected, the maximum and
minimum values and the interval values are taken from the
Maximum, Minimum, and Interval Controls.
When Auto Scaling with Annotation is selected, the
Maximum and Minimum values are determined at run
times depending on the data within the GCD file being
plotted. The maximum and minimum values are annotated
on the X-axis.
When Auto Scaling without Annotation is selected, the
Maximum and Minimum values are determined at run
times depending on the data within the GCD file being
plotted. The ordinate axis does not have the values written
next to it.
Minimum
This is the smallest value that will be plotted on the graph.
This control is available only if the scaling method is
Normal Scaling.
Maximum
This is the largest value that will be plotted on the graph.
This control is available only if the scaling method is
Normal Scaling.
Increment
Tick marks are placed on the ordinate axis at this interval.
Annotations are made at these tick marks.
Overlays
This control allows you to select up to four plots to place
on top of an existing graph. To enter information for an
overlay, select an overlay plot option using the drop list
box (e.g., OverlayA [Not Used] and click edit. The Graph
Overlay dialog box (Figure 57) opens. Refer to Graph
Overlay dialog box, page 54, for further information.
Key Value
This variable is only active if a Graph key was entered into
the General Page for the active report. This variable
contains the event-specific identifier, e.g. crutches, that
you entered into the GCD file to define specific GCD files
for plotting. Refer to General Page, page 46, for more
information about the Graph Key variable and Create
Event-Specific Reports, page 28, for specific instructions
for using this variable.
Bar Variable
This variable contains information about the ON/OFF state
that is to be called from the BarIni file. This variable (e.g.,
Tibialis Anterior) should match the variable (e.g., Tibialis
Anterior) that has been selected for plotting. Note that the
variable names may not match, but the source of the data
54 • Menu Command Descriptions
Report Generator User Manual
should.
The data for this variable will be drawn at the bottom of
the graph.
Bar Color
This is a drop list box where you can set the color with
which the bar is drawn.
Bar Thickness
This is a spin button that allows you to control the
thickness with which the bar is drawn.
Make Blank Graph
If this check box is marked, all the data in this graph
structure will be removed, as a result of which the graph
will not be plotted on the page.
Graph Overlay dialog box
The Graph Overlay dialog box (Figure 57) allows you to select the overlay graphs
for an existing plot; specifically this feature is used to primarily overlay EMG graphs
with kinematic data. This dialog box is opened using the following steps:
1.0 From the Graph dialog box, select an Overlay plot (e.g., OverlayA [Not
Used] from the Overlay drop list box.
2.0 Click the Edit button.
Figure 57: Graph Overlay Dialog Box.
This dialog box has the following fields:
Graph Title
This is the title of the Graph. It appears at the baseline of
the plot on the right side of the bounding rectangle. The
title that is shown is derived from what you enter here by
taking all the uppercase characters and numbers in the
title. If that results in a blank name, the first three
characters are taken.
Graph Variable
This is the variable that is plotted.
Key Table dialog box
A graph may be redefined as a key table (Figure 58) by changing its style within the
Graphs list section of Edit Graph window. The Key Table dialog box (Figure 59) is
is used to edit a key table. Refer to Define Key Tables, page 14, for specific
instructions for creating a key table.
Menu Command Descriptions • 55
Figure 58: Example key table.
Figure 59: Key Table dialog box – example.
This dialog box has the following controls:
Variables
This is a tree control that contains the variables that will
written to the key table. The tree has three levels.
Level 1:
This is the GCD file number for which the variables will
be reported. This can range from 1 to 120, since 120 GCD
files can be plotted. The Up and Down buttons have no
meaning at this level. Clicking on the Add button with
this level selected will add another entry of the same level.
Clicking on the Add Line button will create a new line for
this level.
Level 2:
This is the line number. This is the order in which the
variables are written in the table. At this level, you can
click on the Add Line button to add a new line.
Level 3:
Each line can have text justified left, center and right and
this is represented at this level. You cannot add or delete
entries at this level.
Add
This button is enabled only at Level 1 and it adds another
entry to the key label.
Add Line
At Levels 1 and 2, it adds a line to the selected level.
Delete
You can delete any item at Level 1 or 2 using this button.
Move Up
You can move up any entry that is at Level 1 or 2.
Move Down
You can move down any entry that is at Level 1 or 2.
56 • Menu Command Descriptions
Report Generator User Manual
View menu
The View menu provides commands to customize the appearance of the application
interface, to apply changes made to the active report format, and to maneuver
through the active report.
Toolbars
Report Generator provides two toolbars, Standard and Edit, to provide quick access
to commands regularly used. These toolbars are moveable, but not customizable.
Standard Toolbar
Use this command to display and hide the Standard Toolbar, which includes buttons
for some of the most common commands in Report Generator, such as File Open. A
check mark appears next to the menu item when the Toolbar is selected for display.
The Standard Toolbar, when turned on, is displayed across the top of the application
window, below the menu bar. The toolbar provides quick mouse access to many
tools used in Report Generator,
Click
To
Open a new report.
Open the last used report.
Open GCD files into the selected report.
Save the changes made to the active report
Close the active report.
Move to the previous page or display the list of
available pages in the report.
Move to the next page or display the list of
available pages in the report.
Print the active report.
Context sensitive help
Edit Toolbar
Use this command to display and hide the Edit Toolbar, which includes buttons that
can be used to editing the reports in Report Generator. A check mark appears next
to the menu item when the Toolbar is displayed.
The Edit Toolbar, when turned on, is displayed across the top of the application
window, below the menu bar. The toolbar provides quick mouse access to many
tools used in Report Generator.
Click
To
Edit the Report Header.
Menu Command Descriptions • 57
Edit the Report Footer.
Edit the graphs in the Report.
Edit the attributes of the lines in the report
Status Bar
Use this toggle command to display and hide the Status Bar. A check mark appears
next to the menu item when the Status Bar is selected for display.
The Status Bar, which is a horizontal area in Report Generator at the bottom of the
application interface, provides information about the action to be executed by the
selected menu item or depressed toolbar button. Specifically,
•
The left area of the status bar describes actions of menu items as you
use the arrow keys to navigate through menus. This area similarly
shows messages that describe the actions of toolbar buttons as you
depress them, before releasing them. If after viewing the description of
the toolbar button command you wish not to execute the command,
then release the mouse button while the pointer is off the toolbar
button.
•
The right area of the status bar displays the page number that is being
viewed in the application.
Refresh command
Shortcut – F5
The Refresh command is available via a keyboard shortcut.
This command can be used to read the report from the file and re-draw it on the
screen. This might be necessary when you want to discard changes you have made
to the report, if you have edited the report file in an external editor, or if you apply a
new report format to open data.
Next Page
Shortcut – Page Down
The Next Page command is available on the Report Generator toolbar at the top of
the application window or via a keyboard shortcut.
This command opens the next page in the active report. There is a drop down arrow
next to the Next button on the toolbar. Clicking on the arrow will open a list of
pages in the active report; you can open any of the pages by selecting the required
page.
Previous Page
Shortcut– Page Up
The Previous Page command is available on the Report Generator toolbar at the top
of the application window or via a keyboard shortcut.
This command opens the previous page in the active report, unless the first page is
already currently displayed. There is a drop down arrow next to the Previous button
on the toolbar. Clicking on the arrow will open a list of pages in the active report;
you can open any of the pages by selecting the required page.
58 • Menu Command Descriptions
Report Generator User Manual
Specific Page Names
The Title of each page for an active report is displayed under the View Menu. You
can click on the appropriate Title to open that page.
Tools Menu
This menu provides commands to apply a different report format to any open GCD
files, to select a database with which to connect for advanced data input, and to set
options for advanced functions.
Format
This command allows you to change the format of the active report. This command
opens the standard MS Windows File Open command for you to choose the new
report format.
Data Source
This command allows you to select a data source, such as the Vicon Clinical
Manager (VCM) database, from which you can call data to display in the active
report. Note that this connection must be made if you want the information present
in the database to be used in your reports.
This command opens the Database dialog box (Figure 60) where you can make the
selection of your data source.
See Data Sources, page 81, for more information on creating and selecting data
sources.
Database dialog box
The Database dialog box (Figure 60) shows you the name of the data source that is
in use and allows you to choose a new data source.
Figure 60: Database dialog box.
This box has the following controls:
ODBC Datasource
This control shows you the name of the selected data
source.
Change
This button allows you to select the new data source.
Selecting this button opens the MS Select Data Source
window. Refer to Data Sources on page 81 for more
information.
Help
This button brings you to the Help screen specific to the
database dialog box.
Menu Command Descriptions • 59
OK
This button closes the open data source and tries to open
the data source that has been just selected by you.
Cancel
This button closes the dialog box without making any
changes.
Options
The Options command allows you to set preferences for interpolation, standard
deviation display style, printed quality, and GCD variable processing. This
command opens the Options dialog box (Figure 61).
Figure 61: Options dialog box.
This dialog box has the following fields:
Interpolate between samples
This command will supply additional data points to
those data sets that contain fewer samples than the
plot area. The additional data points will be created
using cubic spline interpolation. Refer to
Interpolate between Samples, page 60, for more
information.
Note that this option can also be selected directly
from the Tools menu bar.
Use shading to indicate SD
For all data sets that contain standard deviation (SD)
information, a shaded region surrounding the
plotted data will indicate the SD. Refer to Use
Shading to Indicate SD, page 60, for more
information.
Note that this option can also be selected directly
from the Tools menu bar.
Use Data Line Style for SD
For all data sets that contain standard deviation (SD)
information, the standard deviation lines will be
drawn with the same line style as the data lines.
Refer to Use Data Line style for SD, page 60, for
more information.
Printer always looks like Screen
When selected, this option ensures that the line
attributes that have been selected for the screen will
also be used for printing and previewing.
Prompt for GCD Variables
This command forces the application to prompt you
for variables that are present in the report file, but
could not be found in the GCD file.
When the report is being generated, if a variable in
the report is not found, the Missing Variables dialog
box (Figure 42), page 33, will open in which you
60 • Menu Command Descriptions
Report Generator User Manual
can enter the data for the variable.
Add variables to GCD file
This command saves new variables, which were
added during a session, to the GCD file. If new
GCD variables are added when first prompted,
Report Generator will not request these variables
when they are needed at a later date. Note that the
new variables will not be added to the GCD file
until the application is closed
Apply
This command will apply all changes made to all
open reports.
Interpolate between Samples
If the number of sample points is less than the number of horizontal pixels used to
display a graph, rather then automatically joining the samples directly, you can
choose to interpolate between the samples. This command will create data points, so
that the number of sample points equals the number of horizontal pixels, through a
cubic spline interpolation. Note that if the number of sample points available,
however, is more than the number of horizontal pixels, then this operation is not
carried out, although the option may be selected.
This command affects only the active report. Use the Tools: Options command to
change this option for all reports.
Use Shading to Indicate SD
This command will shade the standard deviation (SD) area for those plots that
contain SD information and were marked with a “Yes” in the Standard Deviation
column of the GCD Files dialog box (refer to example figure, page 32). The color
used for shading is a lighter version of the pen color that is used to draw the line; for
a monochrome printer, the shading is done with various levels of gray.
When standard deviation data is plotted, it is interpolated using a cubic spline to
achieve a smooth shaded region.
This command affects only the active report. Use the Tools: Options command to
change this option for all reports.
Use Data Line style for SD
If this command is selected, the line style used to draw the standard deviation lines
will be the same as that of the data lines.
This command affects only the active report. Use the Tools: Options command to
change this option for all reports.
Window menu
This menu contains commands that are useful in arranging the open windows in the
application workspace.
Cascade
This command arranges multiple opened windows in an overlapped fashion.
Menu Command Descriptions • 61
Tile
This command arranges multiple opened windows in a non-overlapped fashion.
Arrange Icons
This command arranges the icons for minimized windows at the bottom of the main
window. If there is an open document window at the bottom of the main window,
then some or all of the icons may not be visible because they will be underneath this
document window.
1,2, … command
Report Generator displays a list of currently open windows at the bottom of the
Window menu. A check mark appears in front of the file name of the active
window. Choose a file from this list to make its window active.
Help menu
This menu contains commands useful in finding Help and to register the application.
Help Topics
This command opens an index of the help topics that are available for the
application. It is possible to search for a topic of interest. Help is available by
highlighting a menu item and then clicking the F1 key. Help can also be sought by
clicking the Shift-F1 keys. This transforms the cursor into a help cursor and the user
can click on the item of interest to see the help topic associated with it.
Register
This command enables you to register this application if you have previously
downloaded an evaluation copy and subsequently purchased a registration key for
the program. This command opens the Register dialog box (Figure 62) Motion Lab
Systems registration keys consist of a User Name, Organization Name, and a
sixteen-digit serial number. You must enter this information correctly before the
application will export data from files with more than 100 frames.
Register dialog box
The Register dialog box (Figure 62) is used to register the application. You enter
your name and organization and the 16-digit code as given to you by Motion Lab
Systems.
62 • Menu Command Descriptions
Report Generator User Manual
Figure 62: Register dialog box.
This dialog box has the following fields:
User Name
Enter the name of the User.
User Org
Enter the Organization of the user.
Reg. Num.
Enter the 16-digit code provided to you by Motion Lab
Systems. If Report Generator is already registered, “Licensed
Copy” will appear in this field.
OK
Click on this button to validate the changes you have made and
close the dialog box. The modifications you made will be
written to the registry and the code will be checked.
Cancel
Click on this button to ignore all you changes and close the
dialog box.
Note that if you enter invalid registration information, RGEN will install
successfully, but it will run as an EVALUATION COPY.
MLS Home Page
If you have an Internet connection and use the World Wide Web then you can
launch your Internet Web browser directly from this item and visit the Motion Lab
Systems Home Page, http://www.emgsrus.com. You can check here for new
updates to this application as well as download evaluation copies of other Motion
Lab Systems software products. You can also contact Technical Support directly
from this Web Page.
About Report Generator
The About Report Generator dialog box provides information about the application
and some information about the resources on your system.
Menu Command Descriptions • 63
Figure 63: The Help:About window.
Specific information displayed includes the following information:
64 • Menu Command Descriptions
•
The Name of the Application with the Application Icon.
•
The Name and Organization of the registered user.
•
The Version Number of the Application.
•
Whether you are using an Evaluation Copy or a Registered Copy of the
Application.
Report Generator User Manual
File Formats
This section describes the different file formats that are used by Report Generator.
DST (or GCD) Files
GCD files are text files written under the specifications for DST formatted files.
GCD files are the files from which Report Generator plots data.
A DST file consists of a string of 7-bit ASCII codes, divided into a series of lines.
Each line is delimited by any number of Carriage Return, Line Feed, or Form Feed
characters [ASCII codes 13, 10, and 12, respectively]. Lines can be of any length.
Each line is either a Header, a Data Line, or may be part of a Comment. The file
consists of a number of sections. Each section begins with a one-line header,
followed by an arbitrary number of data lines. A section continues until the start of
the next section, or the end of the file.
File Type Line
The first line of a DST file, known as the File Type Line, is a unique header, without
subsequent data lines. It must always have the form:
#!DST[-version_number] [creator information]
where:
[]
Indicates optional items
-version_number
Identifies a DST version, currently -1.0
creator information
Is a DST type qualifier
For example, a DST file might begin with the DST File Type line:
#!DST-0.1 EXP Ancona
This identifies the file as conforming to the DST-1.0 protocol (this document), and
to be of type EXP Ancona. The DST type qualifier generally, but not necessarily,
defines the DST lexicon for the contents of the file.
As the DST file type identification is always contained in the first line of the file,
programs can very quickly locate a DST file and determine its contents, whatever its
name or extension.
File Formats • 65
Sections
There are two types of sections in a DST file: Text and Numeric. The numeric and
text variables stored in GCD files are all identified by unique names. The RPT file
calls on these variable names stored within the GCD file when constructing a report.
Text Sections
Text sections have a header of the form:
$SectionName [population_size]
where:
[]
Indicates an optional item
SectionName
Is a unique text section identifier. A text and a numeric section can
share the same name.
population_size
is an integer, indicating that the text lines in the section result from
the concatenation of that number of similarly named text sections.
The data lines in a text section contain only the text, except lines beginning with ! or
$, where the first character must be repeated.
For example, a text section might be:
$PartnerName
Professor Tommaso Leo
Text sections in DST files have a completely free format and may therefore be of
any length, from one line (text header only) to many hundreds of lines (e.g. a section
of program code, or a patient's medical notes).
If a number of "string" (text) variables are contained within a single DST text
section, any delimiters used to separate these variables must be defined in the
relevant lexicon.
Numeric Sections
A DST numeric section contains a block of numerical data. Data within a numeric
section is structured into a number of vectors, each component of which must
contain homogeneous data. Each vector has an individual vector dimension.
Numeric sections have a header of the form:
!SectionName[[-dimension]...] [population_size]
where:
66 • File Formats
[]
Indicates optional item(s)
...
Indicates an optional item repeated an indefinite number of
times.
SectionName
Is a unique numeric section identifier. A numeric and text
section can share the same name.
-dimension
(Hyphen followed by integer), indicates the dimension of a
vector component. The dimension of the "only" or
"highest" vector is implicit, and no dimension is included
for it in the header.
population_size
Is an integer, indicating that the values in the section result
from the averaging of that number of similarly named
Report Generator User Manual
numeric sections.
Values in the data lines of DST numeric section are delimited by white space
characters [space (ASCII 32) or tab (ASCII 9)] and by the permitted DST line
separators [carriage return, line feed, or form feed].
Values in the data lines of a DST numeric section can be integer or floating point,
both with optional sign.
Integers are, by default, decimal. Decimal integers must not use an initial zero.
Octal and hexadecimal integers are permitted with the prefixes 0 (zero) and 0x (zerox or zero-X), respectively.
Floating-point numbers are always decimal with a "decimal point" (ASCII 46) used
as the integer-fraction delimiter. Exponent forms of floating point numbers are not
permitted.
The values in a numeric section form a tensor (multi-vectorial) array in which the
components of the "lowest" vector change most rapidly, and the components of the
"highest", implicitly dimensioned, vector change least rapidly.
If a variable has more than one vector, line breaks must occur immediately following
each occurrence of the highest component of the "highest" vector. They may also
occur immediately following each occurrence of the highest component of any
vector. If present, line breaks must occur uniformly through the array.
Averaged GCD Files
Averaged GCD files also contain two numeric values wherever the corresponding
unaveraged GCD file contains one. The first value is a mean and the second is a
standard deviation.
In an RPT file, the following variable references can be made.
For a non-averaged GCD file:
{SampleMean.variable}
Is the mean value of the samples in a variable
{SampleSize.variable}
Is the number of samples in a variable
For an averaged GCD file:
{StandardDeviation.variable}
{PopuLation.variable}
Is the standard deviation(s) of a variable
Is the population size of a variable
$Reference section
All GCD files generated by VICON Clinical Manager include a text section with the
name $Reference, containing one or more lines of text. In averaged files, this
provides a cross-reference to a list of those trials that are included in the average.
Only trials included in the $Reference section can be removed from an averaged file.
This section also states the link from the GCD file to the VCM database.
File Formats • 67
Report Files
The MLS RPT file is similar
to the RPT format used by
VICON Clinical Manager
(VCM), but it is not identical.
RGEN can read RPT files
generated by VCM, but VCM
cannot read those files that
are generated by RGEN.
The Motion Lab Systems Report (RPT) file is a text file that contains information
describing the content, layout, and fonts of graphical Report Generator reports.
Report Generator reads and opens a selected RPT file before further report
processing continues. The RPT file format is written in ASCII text as described in
this document. Each file is divided into groups of parameter assignments; each
group is prefixed by a header enclosed in square brackets. The order of groups
within a file, and of assignments within a group, is not critical.
The Report Generator program searches for each parameter within a group by name.
The parameters of the search include:
•
A variable name appears at the start of a new line.
•
The assigned value is separated from the parameter by an equals
character “=”.
•
Spaces and tabs are ignored and are stripped from the beginning and
end of all strings.
•
Text case is not significant and is used for readability only.
•
A Carriage Return ends each entry.
•
Comments all start with a semi-colon “;” - any portion of a line
following a semi-colon is ignored.
An RPT file can contain the following groups with fixed names:
•
[Header]
•
[Footer]
•
[Screen]
•
[Printer]
•
[Graphs]
Additionally, the RPT file can contain an unlimited number of groups with userselectable names:
[<page>]
where <page> means a graphical report page name corresponding to a page in the
report.
68 • File Formats
Report Generator User Manual
The Header Group
The [Header] group in an RPT file is optional and defines the content and fonts of
the header to appear at the top of every page of the report. The header group can
contain four types of assignment:
•
Title
•
Font
•
Line
•
Line font
Note that unregistered (or evaluation) copies of the software will always display the
header “Motion Lab Systems Report Generator” which cannot be modified. When
the software is registered, the default header will be replaced by the header defined
in the RPT file.
Title
The title is optional and, if present, appears centered at the top of every page. It is
intended to be used to display the name of the lab or hospital that generates and
distributes the reports. The title has the form:
Title = <text string>
e.g. Title = The Children’s Hospital Motion Lab EMG Report
Note that any character, except a semi-colon, may appear in the Title string. The
string will have all leading and trailing white spaces removed before centering and
display.
Title Font
The title font assignment sets the font used for the title. If the title font assignment is
missing then 20pt Times New Roman Bold will be used. The font assignment has
the form:
Font = <valid font>, <point size>, <font color>
e.g. Font = Times New Roman Bold, 20,0
There are 16 (0-15) available font colors that correspond to the 16 standard colors.
Refer to the list of font colors and their appropriate assignment in Font Colors and
Corresponding Values, page 87.
Line
Up to ten lines of text may be included in a page header. This text may include data
items from the GCD file. Data is specified by enclosing the entry in {} brackets.
The line assignment form is:
Line<line number> = entry \ entry \ entry
e.g. Line1 = \ \ Name: {name} Hospital # {PatientNo}
<line number> is optional (1-10) and determines the order of the line below the
header title with the lines being displayed in order 1-10 with Line1 closest to the
header and Line10 closest to the center of the page. If no line numbers are used then
the lines will be displayed in the order in which they appear in the RPT file. Lines
are justified, using backslash delimiters (\), as left, center, and right.
File Formats • 69
e.g. Line = Left Edge of Page \ Center of Page \ Right Edge of Page
Each line assignment "entry" can be any concatenated combination of
•
ASCII Text characters
•
{GCD variables}
Line Font
A line font is defined where lines are included in the header. If the line font is not
defined then 12 point Times New Roman font will be used. The line font uses an
assignment of the form:
Linefont = <valid font>, <point size>, <font color>
e.g. Linefont = Times New Roman, 12, 5
There are 16 (0-15) available font colors that correspond to the 16 standard colors.
Refer to the list of font colors and their appropriate assignment in Font Colors and
Corresponding Values, page 87.
Miscellaneous
The header of the report can be enclosed in a box using the assignment:
Box = <Status>
Where status can be ON or OFF
Unregistered (or evaluation) copies of the software will always display the following
header that cannot be modified. When the software is registered, the default header
(Figure 64) will be replaced by the header defined in the RPT file.
Title = Motion Lab Systems Software
Font = Times New Roman Bold,20,0
Line0 = \ This is an evaluation copy of the Report Generator Software \
Line1 = \ Please contact Motion Lab System, Inc to obtain a registered
copy
Linefont = Time New Roman,14,0
Figure 64: The default Header group in the reports for unregistered RGEN copies.
[Footer] Group
The [Footer] group in an RPT file is optional and defines the content and fonts of the
footer to appear at the bottom of every page of the report. The general structure of
the footer group is very similar to the header group with some minor differences in
the defaults. The group can contain four types of assignment:
70 • File Formats
•
Title
•
Font
•
Line
•
Linefont
Report Generator User Manual
Note that unregistered (or evaluation) copies of the software will always display the
following footer that cannot be modified. When the software is registered, the
default footer will be replaced by the footer defined in the RPT file.
Title = Motion Lab Systems, Inc.
Font = Arial Bold,12,0
Line1 = \15045 Old Hammond Hwy, Baton Rouge, LA 70816 USA\
Line2 =
Line3 = Phone: (225) 272-7364\Email: [email protected]\Fax: (225)
272-7336
Linefont = Arial Italic,10,0
Figure 65: The default Footer group in the reports for unregistered RGEN copies.
Title
The title appears centered at the top of the footer area of every page and is intended
to display the address or contact information for the hospital or lab generating the
reports. The title assignment has the form:
Title = <text string>
e.g. Title = 15045 Old Hammond Highway, Baton Rouge, LA 70809
Title Font
The title font assignment has the form:
Font = <valid font>, <point size>, <font color>
e.g. Font = Times New Roman, 20, 6
There are 16 (0-15) available font colors that correspond to the 16 standard colors.
Refer to the list of font colors and their appropriate assignment in Font Colors and
Corresponding Values, page 87.
Line
Up to 10 lines may be included in footer. The general line assignment form is:
Line<line number>=entry\entry\entry
e.g. Line1=\\Name: {name} Hospital # {PatientNo}
<line number> is optional (1-10) and determines the order of the lines below the
footer title with Line1 appearing above Line2. If no line numbers are used then lines
are displayed in the order in which they appear in the file. Lines are justified, using
backslash delimiters (\), as left, center, and right.
e.g. Line = Left Edge of Page \ Center of Page \ Right Edge of Page
Each line assignment "entry" can be any concatenated combination of:
•
ASCII Text characters
•
{GCD variables}
In addition to the variables present in the GCD file or the VCM database, the
application allows you to print the present page number and the number of pages in
File Formats • 71
the report. This can be done by using the variables "page_number" and
"total_number_of_pages" respectively.
e.g. Line1 = \\Page {page_number} of {total_number_of_pages}
Line Font
A line font is defined where lines are included in the footer, using an assignment
with the form:
Linefont = <valid font>, <point size>, <font color>
e.g. Linefont = Times New Roman, 12
There are 16 (0-15) available font colors that correspond to the 16 standard colors.
Refer to the list of font colors and their appropriate assignment in Font Colors and
Corresponding Values, page 87.
Miscellaneous
The footer of the report can be enclosed in a box using the assignment:
Box = <Status>
Where status can be ON or OFF.
[Screen] and [Printer] Groups
The characteristics of graphic lines in a report can be controlled by use of the
[Screen] and [Printer] groups in the RPT file.
Thickness, color, and style and extended style can be set for each of the files selected
for the report, and for graph borders. There are separate settings/groups for [Screen]
and [Printer] so that the output can be optimized for each device. The assignments
for each of these groups are the same.
Each assignment sets the relevant attribute for the Graph Border, Plot1, Plot2, …
and Plot120.
The assignments are:
Thickness=t1, t2, t3, t120 tn is 0-10 points (1/72") or device pixel width.
Color=c1, c2, c3, c120
as described below.
where cn is the 0-7 red-green-blue (RGB) color
0 Black
4 Blue
1 Red
5 Magenta
2 Green
6 Cyan
3 Yellow
7 White
Style=s1, s2, s3, … s120
where sn is 0-4 line style as described below.
0 solid
1 dashed
2 dotted
3 dot-dashed
4 dot-dot-dashed
72 • File Formats
Report Generator User Manual
StyleEx=s1,s2,s3, … s120
below.
where sn is 0-9 extended line style as described
0 normal
5 filled triangle
1 star
6 circle
2 square
7 filled circle
3 filled square
8 diamond
4 triangle
9 filled diamond
For example:
[Printer]
Thickness = 1,1,1,1,1,1,1,1,1,1,1,1,1,1,1,1,1,1,1,1,1,1
Color = 0,1,1,2,2,3,3,4,4,5,5,0,1,1,2,2,3,3,4,4,5,5
Style = 0,1,2,1,2,1,2,1,2,1,2,0,1,2,1,2,1,2,1,2,1,2
StyleEx=0,1,3,0,0,0,0,0,1,2,0,1,3,0,0,0,0,0,1,2
[Screen]
Thickness = 2,1,1,1,1,1,1,1,1,1,1,2,1,1,1,1,1,1,1,1,1,1
Color = 0,1,2,3,4,5,1,2,3,4,5,0,1,2,3,4,5,1,2,3,4,5
Style = 0,1,1,1,1,1,2,2,2,2,2,0,1,1,1,1,1,2,2,2,2,2
StyleEx=0,1,3,0,4,0,5,0,1,2,0,1,3,0,0,9,0,0,1,2
Figure 66: Example of the [Screen] and [Printer] groups in an RPT file.
Graphs Group
The [Graphs] group must be present in all RPT files and must contain, at a
minimum, a list of the names of pages in the report. In addition, the [Graphs] group
may contain:
•
The font size and name for all graph titles and axes;
•
The default aspect ratio of all graphs;
•
The name of the GCD data file to be plotted against subject plots.
Page Names
Each page must have a unique name, which is used to reference a [<page>] group
and is displayed and/or printed in the report as a title at the top of the relevant page.
This is also displayed and used by the Report Generator program to identify the
graph pages for display and printing. The Pages assignment has the form:
Pages = <Page1name>, <Page2name>, ...
e.g. Pages = Overview, RMS vs. Raw, Powers, EMG Levels
Title Font
Each graph may optionally have a title, which appears immediately above it. The
Title Font assignment has the form:
Titlefont = <valid font>,<point size><font color>
File Formats • 73
e.g. Titlefont = Arial,12,2
There are 16 (0-15) available font colors that correspond to the 16 standard colors.
Refer to the list of font colors and their appropriate assignment in Font Colors and
Corresponding Values, page 87.
Axis Font
Each graph may optionally have two ordinate labels and an ordinate unit, which
appear to its left. The AxisFont assignment has the form:
AxisFont = <valid font>,<point size>, <font color>
e.g. Axisfont = Arial,8, 15
When displaying a report on the video monitor the program will use the size of the
report window and the resolution of the display, to determine when to selectively
reduce the size of, and finally omit, text to maximize the space available for graph
plotting.
Plot Aspect
All graphs in a report can be plotted with a fixed aspect ratio. The Aspect
assignment has the form:
Aspect =
<horizontal>: <vertical>
e.g. Aspect = 4:3
If an Aspect assignment is not made, then the aspect ratio is automatically adjusted
to fill the available space. The report program also scales the size of graphs
independently for printer or screen window plotting. In general, it is a good idea to
specify an aspect ratio since this enables the user to compare graphs with some
confidence that the results have been plotted to similar scales.
EMG Activity Bar
The application allows you to display a single bar at the bottom of the graph. The
data used to plot this is taken from the muscle file. Refer to Muscle File, page 79,
for information about this file.
The most common use of a bar graph is the indication of normal phasic EMG
activity for a muscle. A 'Normal EMG' bar is useful for comparison with an EMG
activity envelope plotted in the same graph.
This is done using the BarIni assignment, which has the form
BarIni= <FileName>, <Section>
e.g. BarIni=D:\Apps\Report Generator\sammuscle.ini, Adult - Rancho
[<page>] Groups
Each [<page>] group in an RPT file has the name, for example [Angles], of one of
the pages defined in the [Graphs] group.
There are seven possible assignment types in a [<page>] group:
74 • File Formats
•
Title
•
Font
•
Aspect (optional)
Report Generator User Manual
•
Layout
•
X-axis definition (optional)
•
G
•
Footer
Title
The page title appears as a subtitle, below the Header, at the top of the page. The
Title assignment has the form:
Title = <text string>
e.g. Title = Joint Rotation Angles
Title Font
The page title font and size is individually controlled. The Font assignment has the
form:
Font = <valid printer font>,<point size>, <font color>
e.g. Font = Times New Roman,18, 4
There are 16 (0-15) available font colors that correspond to the 16 standard colors.
Refer to the list of font colors and their appropriate assignment in Font Colors and
Corresponding Values, page 87.
Layout
Graphs and key tables on the page are plotted in cells in a matrix. The Layout
assignment has the form:
Layout= <horizontal>,<vertical>,<orientation>
For example:
Layout=3,4,Landscape
{generates space for 12 graphs in Landscape mode}
X-axis
All the graphs on a page have a common horizontal (X) axis. The lowest graph in
each column of graphs has its horizontal axis annotated and labeled. The X-axis
assignment has the form:
Xaxis = <min>,<max>,<increment>,<axis label>
e.g. Xaxis = 0,100,25,% Gait Cycle
Graph (G) Assignments
An individual definition must be made for each graph on the page. The definition
number determines the placement (left-to-right, then down) of a graph or key table
within the matrix defined by the Layout assignment.
Graphs
The 'G' assignment for graphs has the form:
G<graph number>=<graph title>, <GCD variable name>, <ordinate main label>,
<min>, <max>, <increment>, <ordinate upper label>, <ordinate lower label>
File Formats • 75
For example:
G6=PELVIC TILT, PelvicTilt, Degrees, -10, 30, 10, Dwn, Up
Note that substituting the character * for <max>, <min>, and <inc> causes
autoscaling without axis annotation. Substituting the character # for <max>, <min>,
and <inc> indicates autoscaling with axis annotation. A minus sign in front of the
GCD variable name inverts the graph.
Overlays
Each graph can also have four overlay graphs on it. These are of the form:
G<graph number>A|B|C|D=<graph title>, <GCD variable name>
For example:
G6A=PELVIC TILT, PelvicTilt,
The variable in definition A is plotted at the top of the bounding rectangle.
Key Tables (also known as G-Tables)
In addition to graphical data the program can also display numeric and text data in
the form of a key table which each have an individual definition just like the Graphs
on the page. The definition number determines the placement (left-to-right, then
down) of both Graph and Key tables within the matrix defined by the Layout
assignment. The 'G' assignment for Key tables has the form:
G<graph number>={1(entry\entry\entry,..,entry\entry\entry),
2(entry\entry\entry,..,entry\entry\entry), 3(entry\entry\entry,..,entry\entry\entry)}
For example:
G13={1({name}\\{PatientNo},{Side}\\{Date})}
Each "entry" in a Key table can be any concatenated combination of:
•
{'key' variables}
•
text characters
•
{GCD variables}
•
{parameter variables}
Note that variables in key table entries are distinguished from text by enclosure in {}
brackets.
Any number of rows, within the space available, can be used for each table. Each
row can have up to 3 entries, separated by '\' characters; justified left, center, and
right. Any entry can be omitted, but the \ separators must then remain to indicate a
blank entry field. Key tables use the same font as graph axes.
Three ‘key’ variables are used in key tables to identify graphs. They are:
•
{side}
•
{motionfile}
•
{gcdfile}
Variable
76 • File Formats
Description
Details
Report Generator User Manual
{side}
The side (left/right) of the patient
to which the plot applies
The value is determined by the
Left/Right selection made for each
plot in the Plot Selection box.
{motionfile}
The file (C3D) which was
processed to produce the report
This is the filename-only portion of
{filespec}, the path plus filename
stored in the trial parameters and
written to the GCD and C3D files.
{gcdfile}
The file (GCD) within which the
results are stored
This is the filename of the GCD file
for each plot.
Table 2: Key table variable descriptions.
When any variables other than these three are specified in a key table, the program
obtains them from the selected GCD file.
Note When the program accesses a GCD file for variables to be printed in a key
table, according to what is specified in the Plots Selection box, it searches for both
text and numeric variable names with the prefix Left or Right, such as
!LeftHipFlexExtMoment. However, certain GCD text variables, such as the two
optionally written into the GCD file during averaging, $Name and $Comments, have
no Left or Right prefix.
Any RPT reference to a GCD variable, whether text or numeric, which will never
have the prefix Left or Right should start with the character ! This applies wherever
variable references are made in an RPT file.
For example:
!Name
!Comments
Footer
An optional set of page footer assignments creates a page footer table, divided into 4
columns of fixed width. Each page footer assignment, creating a single line of the
footer, has the form:
Footer<footer line number> = <text string>\entry
e.g. Footer2 = Double Support (%)\{DoubleSupport}
In each page footer row, the left hand column contains the text string. The three
remaining columns contain entries for each of the GCD files selected for the report.
Entries are taken from the same set as for a key table (see Table 2):
•
'key' variables
•
GCD variables
•
Parameter variables
Note that Page Footers, which appear only on the page for which they are defined,
should not be confused with Report Footers, which appear on every page. Page
Footers use the same font as graph axes.
Mathematics with GCD Variables within the RPT
Any numerical variable from a GCD file, whether single- or multi-valued, which is
plotted or printed in a report, can be multiplied or divided by a constant or by
another variable from the same GCD file. Addition and subtraction is also allowed.
File Formats • 77
The operator syntax in graphs (multi-value), Key tables (single-value), or page
footers (single-value) definitions in the RPT file takes the form:
{variable * Q [#n]}
{variable / Q [#n]}
{variable – Q [#n]}
{variable + Q[#n]}
where Q can be either a numeric constant or another variable in {} brackets. #n is an
optional indicator, inserted immediately before the closing } bracket, of the number
of decimal places of the result.
For example {Cadence*120#0} calculates cadence in steps per minute from the
stored units of strides per second
In addition, operations may be nested {variable1*{variable2*{variable3/{variable4}}}}
Parameter References
The full form for reference to a parameter field is:
<group>.<parameter>
For example:
•
physician.city
•
patient.name
•
session.AnkleWidthR
The program searches backwards up the group-parameter hierarchy (starting with
report, then trial, session, patient, and finally physician) until it locates a parameter
with the required name. Parameter names that are shared by two or more groups,
such as street, phone, and comments, are always picked up from the 'lowest' group,
so the reference phone locates to a patient's phone number, not a physicians.
78 • File Formats
Report Generator User Manual
Muscle File
The muscle file is a text file that contains ON/OFF timing information for included
muscles. The file’s format is like that of configuration files (INI files) used by MS
Windows. There can be multiple sections within each file that could be used, for
example, to document information for different age groups. Each section contains
entries for all the muscles for which you have ON/OFF data. A specific entry should
be written in the following format:
MuscleName=Value1Start, Value1End, Value2Start, Value2End
...
where ValuenStart and ValuenEnd are normally stated in percentage of gait cycle.
For example:
Adductor Longus=47,68.0,88.6,96.0
Adductor Brevis=48.0,62.0e
Note that there should be an even number of values within each entry. This is
because every start value should have an end value.
In addition to the muscle name entries, there are two entries that are present in each
section. They are:
Stance = Value
Stretch = Value
These additional entries are used by the MLS EMG Application and, although they
are not used, have been retained in this file for future reference.
File Formats • 79
Data Sources
This chapter deals with choosing a Data Source and creating new Data Sources to
enable you to directly access the information contained in the VCM database.
Setting up the data source can be a little tricky if you are not familiar with the
Microsoft Open Database Connectivity (ODBC) feature. However, a little effort to
get this working will pay off as you will then be able to browse through the VCM
database and extract the necessary information into the GCD files without having to
know what any of the files are called. Instead, you simply process data that is
associated with a particular subject trial and then view the results in C3d Editor.
These instructions assume that you are using the current 32-bit ODBC application
available directly from Microsoft. If you are not, then you may need to obtain an
update from Microsoft. All the operations described in this chapter are accessible
through the 32-bit ODBC option in the Windows95 (or Windows 98) Control Panel.
Selecting an Existing Data Source
The Database command should be chosen from the File menu. However, note that a
data source will have to be created before it can be selected. You may create as
many Data Sources as you have VCM databases and then switch between them
instantly by using this command.
The Database dialog box opens. This box shows you the currently selected data
source. To change it click on the Change button. This opens the Select Data Source
dialog box. This box has two tabs. Choose the Machine Data Source tab. This tab
has a multiple column list box that lists the following,
•
Names of the Data Source.
•
Type of data source, which can be User or System.
•
Description of Data Source.
Choose the Data Source in the list box by clicking on it and then click the OK
button. C3dExport will now use this Data Source and display the contents of the
selected database.
Data Sources • 81
Creating a new Data Source
The Database command should be chosen from the File menu. The Database dialog
box opens. This box shows you the currently selected data source. To change it or
to create a new data source click on the Change button.
The Select Data Source dialog box opens. This box has two tabs. Choose the
Machine Data Source tab. This tab has a multiple column list box as shown below
and which lists the following,
•
Names of the Data Source.
•
Type of data source, which can be User or System.
•
Description of Data Source.
Figure 67 - Selecting the Data Source
Click on the New button to create a new Data Source.
This opens a dialog box that contains two radio buttons User Data Source and
System Data Source.
82 • Data Sources
•
Choosing User Data Source will mean that the Data Source created will
be available only to the user who creates it.
•
Choosing System Data Source means that the Data Source will be
available to all users on the machine.
Report Generator User Manual
Figure 68 - Selecting a Data Source Type
After choosing one of the above, click on the Next button. Choose System Data
Source unless you have a good reason for selecting User Data Source. In most
cases, it will not make any difference which option you select at this point unless
several different people use your computer.
Select the Microsoft Paradox
Driver (*.db) to connect to
the VCM database.
This opens the Create New Data Source dialog, which will give you a list of drivers
present. Select the appropriate source and click on the Next button.
Figure 69 - Selecting the Driver
This opens a page that displays a little information about the choices. Click on the
Finish button to finish the process.
Data Sources • 83
VCM Paradox Driver Setup Instructions
If the Paradox Driver was selected as the data source, the ODBC Paradox Setup
dialog box opens for you to enter required information:
•
Enter the Name you want the Data Source to have in the Data
Source Name box. This is usually something short (8 characters)
that you will use to reference this ODBC link.
Figure 70 - The ODBC options dialog
•
Enter the Description for the Data Source in the Description box.
This step is optional but useful if you are using several different
VCM databases as you can enter a long description.
•
Uncheck the Use Current Directory box otherwise this will usually
point to the wrong directory - you need to specify the directory
that stores the VCM database.
•
Click on the Select Directory button. This opens a Select
Directory dialog box, which you can use to browse the directory
structure of the machine. Choose the directory in which the VCM
database files reside, and click OK.
Figure 71 - You must select the correct database directory
84 • Data Sources
Report Generator User Manual
Once you are back at the ODBC Paradox Setup you can use the "Options" button
(lower left corner) to configure the rest of the ODBC link.
Figure 72: ODBC Paradox Setup dialog box.
If you do not see the correct
database entries, you may
have entered some
information incorrectly and
will need to either delete the
entry or modify it using the
32-bit ODBC option in the
Windows Control Panel.
Click OK in the ODBC Paradox Setup dialog box. This takes you back to the Select
Data Source dialog box where you will see that the newly created Data Source is
listed. Choose the Data Source that you have just created and click OK.
EMG4VCM will now open the VCM database and display the database contents.
Data Sources • 85
Reference Material
Application General Usage Instructions
This section lists some general information about the Application.
Title Bar
The title bar is located along the top of a window. It contains the name of the
application and document.
To move the window, drag the title bar. Note: You can also move dialog boxes by
dragging their title bars.
The RGEN title bar also contains the following elements:
•
Maximize button
•
Minimize button
•
Name of the application
•
Name of the document
•
Restore button
Scroll Bars
Scroll bars are displayed at the right and bottom edges of the document window. If
the size of the window is smaller than what it should be to display the contents of the
window. The scroll boxes inside the scroll bars indicate your vertical and horizontal
location in the document. You can use the mouse to scroll to other parts of the
document.
Font Colors and Corresponding Values
The font colors that can be used are:
0 Black
8 Maroon (Dark Red)
1 Red
9 Dark Green
2 Green (Lime)
10 Dark Yellow (Olive)
3 Yellow
11 Dark Blue (Navy)
Reference Material • 87
4 Blue
12 Dark Magenta (Purple)
5 Magenta (Fuchsia)
13 Dark Cyan (Teal)
6 Cyan (Aqua)
14 Light Gray (Silver)
7 White
15 Dark Gray (Gray)
Acronyms
B&W
CAMARC
DST
GCD
MAC
MLS
MS
ODBC
RPT
SD
VCM
88 • Acronyms
black-and-white
computer aided movement analysis in a rehabilitation context
data storage and transfer
gait cycle description file format
Motion Analysis Corporation
Motion Lab Systems
Microsoft
open database connectivity
report file format
standard deviation
VICON Clinical Manager
Report Generator User Manual
Glossary of Terms
aspect ratio
The ratio of the length of a graph's x-axis to that of the y-axis, e.g. 4:3. The results
of adjusting this ratio is that it adjusts the perspective of the graph from square, e.g.
2:2, to rectangular.
Aspect X
This is the X value of the aspect ratio with which the graphs will be plotted. The
aspect ratio is the ratio of the length of the X axis to that of the Y axis. If a value is
entered here, it overrides the value that is used in the General Page.
Aspect Y
This is the Y value of the aspect ratio with which the graphs will be plotted.
graph key
Report Generator provides the ability to define items in a GCD files as keys. These
keys may be later used to determine the eligibility of the data for plotting.
key table
A text box that is generated in the space allotted for a graph. Text entered into the
box may include comments and data from the GCD file.
overlay plot
Report Generator provides the ability to place four graphs on top of an defined plot.
This functionality is focused on placing analog graphs on a kinematic or kinetic plot.
However, analog, kinematic, and kinetic plots may be combined. Note that the
values of the overlay plots will lose their meaning.
session
A period defined by the opening and closing of the RGEN application normally.
Glossary of Terms • 89
E
Index
A
About Report Generator command 61
About Report Generator dialog box 61
add variables to GCD file 59
Arrange Icons command 60
averaged GCD files 65
B
bitmap 35
how to create 35
C
Cascade windows command 60
Close command 34
create a new report page 47
create a report 9
D
Data Source command 57
data sources 79
database 57
select a source 57
Database dialog box 57
default display 8
define a graph 51
define a key table 14
define a report 10, 46, 47, 48, 51
create a new page 47
general information 46
specific page 48
specify a graph 51
define graphs 12
dialog box 45
Line Attributes 45
display data files 31
display data in a report 17
Report Generator User Manual
Edit dialog box 46, 48
general page 46
specific pages 48
Edit Footer command 43
Edit Graphs command 46
Edit Header command 41
Edit Line Attributes command 44
Edit menu 39
edit RPT format 41, 43, 44, 46
footer 43
graphs 46
header 41
line attributes 44
Edit toolbar 56
EMG activity bar 72
evaluation mode 2
event-specific reports 28
Exit command 39
Export command 34
export graphics 21, 34
Export to Bitmap dialog box 21, 35
F
File menu 31
Footer dialog box 43
Format command 57
G
GCD file 59
adding variables 59
GCD file format 63
GCD Files dialog box 32
GCD variables 22, 39, 75
display file specific information 22
mathematics with 75
GCD variables dialog box 22, 39
General page 46
graph 19
how to modify 19
Graph dialog box 51
graph key field 28
Graph Overlay dialog box 53
graphs 12
how to define 12
G-table 74
H
Header dialog box 41
Help menu 60
Help Topics command 60
Index • 91
I
installation 1, 2
evaluation mode 2
interpolate between samples 59
K
key table 14, 16, 54
define 14
example 16
how to define 14
Key Table dialog box 54
key value field 29
L
Line Attributes dialog box 44, 45
line style for SD 59
M
mathematics with GCD variables 75
Missing Variables dialog box 33
MLS Home Page 61
MLSLegend 52
modify a graph 19
muscle file format 77
N
New report command 31
Next Page command 56
O
open a data file 17
open a new report 31
open GCD file 17
open GCD files 31
Options command 58
Options dialog box 23, 58
Overlay dialog box 27
overlay graph 53
overlay graphs 25, 74
P
Page Section dialog box 47
Page Setup command 38
Previous page command 57
Print command 35
Print dialog box 36
Print Preview command 36
print preview toolbar 37
Print Setup command 37
92 • Index
Print Setup dialog box 37
printing options 36
program componenets 6
workspace 6
program components 5, 6
user interface 6
program defaults 8
display 8
program description 5
program instructions 8
program options 23, 58, 59
interpolation 59
standard deviation display 23
standard deviation line 59
standard deviation shading 59
R
Refresh command 56
Register command 60
registration key 60
Regsiter dialog box 60
Repeat report command 31
report 9, 10, 28, 31
create event-specific 28
how to create 9
how to define 10
repeat last one used 31
Report command 41
report format 25, 57
change file 57
how to change 25
report page 48
report source code 40
display 40
retrieve a session 18
Retrieve Session dialog box 41
RPT file format 66, 73, 74
graph assignments 73
key table 74
S
save a session 18
Save As 34
Save command 34
Save Session dialog box 41
scroll bars 85
select active report 60
session 18, 41
how to retrieve 18
how to save 18
retrieve 41
save 41
Session command 40
Report Generator User Manual
shading in average plots 59
Source command 40
standard deviation data 23
how to display 23
standard deviation line 59
standard deviation shading 59
Standard toolbar 55
Status Bar 56
T
Tile windows command 60
title bar 85
toolbars 55, 56
edit 56
standard 55
status 56
Tools menu 57
V
View menu 55
W
Window menu 60
Report Generator User Manual
Index • 93