1
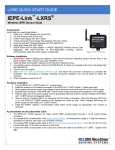
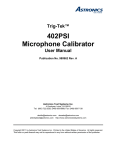
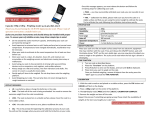
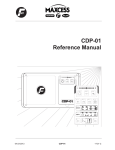
APPLICATION NOTE:
DAC Analog I/O Applications
APN‐1001
Mars Labs, LLC
29 C Street
Laurel, Maryland 20707
301.470.3278
www.marslabs.com
APN‐1001 ‐ DAC Analog I/O Applications
TABLE OF CONTENTS
TITAN SYSTEM OVERVIEW ……………………………………...….
TEST CONFIGURATIONS WITH DACS ………………….….……
CABLES AND CONNECTIONS …………………….……….….…….
POWER‐UP SEQUENCE ……………………………………..….…….
CONFIGURING TCS
1. Create or Load a Test ……………………..……………..….
2. Configure the Connected Device
a. Titan Pod/DAC pair over USB …………………...…
b. Titan CPU ………………..……..……………….…….……
3. Configure Sensors ……………..…..……………..………….
4. Assign Sensors to Channels …..……………..……….…..
CALIBRATION …………………………………………………………..…
RUNTIME MODES
Sample screens …………………………………………..…….…
Capture Function ………………………………………..…...….
EXPORT …………………………………………………………….….…...
Reviewing Data …………………………………………..…....…
Exporting Data Files ………………………………….…...……
CSV/TSV Options ………………………………………..…....…
DAC OPERATION
Relating the DAC Output to a Given Input .…………...
Delay …………………………………………………….……..….….
DAC Reconstruction Filter Attenuation ………….…….
ADDITIONAL RESOURCES ………………………………….….……
Mars Labs | 29 C Street | Laurel, Maryland 20707
3
4
6
6
7
9
10
13
15
16
20
21
23
24
25
26
27
29
29
30
2
APN‐1001 ‐ DAC Analog I/O Applications
SUMMARY
This applications note focuses on DAC Analog Input/Output applications, but also includes basic setup
and connection information on the Titan System. This document is not intended to replace the Titan
Control System (TCS) or Titan Hardware User Manuals. Please consult these manuals for additional
specific information.
TITAN SYSTEM OVERVIEW
A Titan System may consist of up to eight Pods or Mini‐Recorders, and a CPU. The System may also
include one or more DACs and/or Digital Pods as shown:
Mars Labs | 29 C Street | Laurel, Maryland 20707
3
APN‐1001 ‐ DAC Analog I/O Applications
TEST CONFIGURATIONS WITH DACS
The Titan system allows great flexibility in setting up various test configurations. Using a simplified
Titan system of just a few Pods and DACs to serve as examples, some common system configurations
are shown below.
Configuration 1 – Two Pod/DAC pairs into a Titan CPU
Configuration 1 shows each Pod/DAC pair powered from a single power adapter. Short lengths of CAT
5 cable connect the Pods to the DACs. Longer lengths of CAT5 cable connect the DACs to CPU ports 1
and 2; this configuration allows the CPU to be located some distance away. An Ethernet connection on
the CPU provides network connectivity for remote data acquisition.
Mars Labs | 29 C Street | Laurel, Maryland 20707
4
APN‐1001 ‐ DAC Analog I/O Applications
Configuration 2 – One Pod/DAC pair into a Titan CPU, one Pod/DAC pair into a PC running TCS
Configuration 2 shows each Pod/DAC pair powered from a single power adapter. As with the first
configuration, short lengths of CAT 5 cable connect the Pods to the DACs. A long length of CAT5 cable
connects the first DAC to the CPU. Another length of CAT5 cable connects second DAC to an RS422‐to‐
USB converter, and a USB cable connects to the PC.
Configuration 3 – One Pod/DAC pair into a PC running TCS
Configuration 3 shows the Pod/DAC pair powered from a single power adapter. A short length of CAT 5
cable connects the Pod to the DAC, and a USB cable connects the DAC to the PC. For this configuration,
the PC must be located reasonably close to the DAC (within the 15 ft distance limit of USB).
Mars Labs | 29 C Street | Laurel, Maryland 20707
5
APN‐1001 ‐ DAC Analog I/O Applications
CABLES & CONNECTIONS
Data connections in the Titan System are made using standard CAT5 Ethernet ‘straight‐through’ cable
for connections between the Pod and DAC, and between the DAC and CPU. Connections are made
according to the configuration diagrams 1 & 2 as shown above. The maximum recommended Ethernet
cable length between devices is 100 feet.
Standard USB cable is used for data connections between a single Pod or Pod/DAC pair and a PC, as
shown in configuration 3 above.
RECOMMENDED POWER‐UP SEQUENCE
After all connections have been made, the recommended startup sequence is as follows:
1. Apply power to the Pod/DAC pair and wait for them to initialize
2. Apply power to the CPU
Note: When the CPU powers‐up, it automatically performs a check to detect all connected devices as
a part of its initialization sequence. If a Pod is not powered and active during this time, it will not be
detected. In this case, you will need to perform a manual query by clicking on the ‘ReQuery Devices’
button in TCS. The Titan CPU will then rescan the ports. All connected Titan devices should be
detected and appear in the device list in TCS.
Mars Labs | 29 C Street | Laurel, Maryland 20707
6
APN‐1001 ‐ DAC Analog I/O Applications
CONFIGURING TCS
After system connections are made, the next step is configuring TCS. This is a four‐step process:
1. Create or Load a Test
2. Configure the Titan Device
3. Configure the Sensors
4. Assign Sensors to Channels
Note: If TCS has not been installed on the PC that will be used, follow the installation
instructions in the TCS User Manual.
1. Create or Load a Test
Launch TCS. In the start‐up screen you will be prompted either to create a new test or load an existing
test. When you create a new test, you must specify the Device Type (explained below). When you load
an existing test, the Device Type is already specified.
a. Create a Test
For new tests, TCS defaults to assigning a test name based on the selected device type and the current
date. There are three devices types to choose from:
Mini‐Recorder: Choose this type when using a single Titan Mini‐Recorder or Titan Pod
CPU: Choose this type when using a Titan CPU with 2 or more Mini‐Recorders/Pods with or
Without DACs
DAC: Choose this type when using a Mini‐Recorder or Pod with a DAC over a USB connection
Note: A Mini‐Recorder is a Pod with built‐in recording capability. For consistency, the
term ‘Pod’ will be used throughout this document to refer to either device.
For new tests, you will need to select the desired device type in the start‐up screen:
Mars Labs | 29 C Street | Laurel, Maryland 20707
7
APN‐1001 ‐ DAC Analog I/O Applications
Note that new tests will always use a default name of the type <device type>_<date>. To change the
name, click in the test field and enter an alternate test name, keeping in mind that test names cannot
contain spaces. All data taken during this session will be exported using this test name. When finished,
click ‘Create’
b. Load a Test
To load an existing test, click on the ‘Browse’ button and navigate to the location of the test (test files
always have a .tcf extension).
After locating and selecting the desired test, clicking ‘Open’ (or simply double‐clicking on the test file)
will load the test into TCS.
Note: TCS includes a built‐in help feature, available on any screen in TCS simply by
pressing ‘CTRL H’. You can also access Help through the HELP menu.
When help is activated, TCS launches the TCS User Manual and displays the information
related to the current screen. Note that for the Help function to work, you must have the
Adobe Reader application installed.
Mars Labs | 29 C Street | Laurel, Maryland 20707
8
APN‐1001 ‐ DAC Analog I/O Applications
2. Configure the Connected Device
a. Titan Pod/DAC pair over USB
For test configurations where a DAC is used, the Device Settings in TCS should be set to ‘Low Speed’
with a Scan Rate of ‘1200 Hz’. These settings are automatically established when ‘Mini‐Recorder + DAC’
is selected as the device type in TCS:
When ‘DAC’ is selected as the device type, TCS will launch with a Device Configuration screen that is
configured for a single Pod/DAC pair, in Low Speed Mode with a 1200 Hz Scan Rate. For this
configuration, TCS also adds a DAC Information field in the lower part of the window.
Mars Labs | 29 C Street | Laurel, Maryland 20707
9
APN‐1001 ‐ DAC Analog I/O Applications
b. Titan CPU
To create a test for a Titan CPU, select ‘Titan CPU’ as the device type:
For the CPU test, TCS will display a ‘Device Configuration’ screen like the one below.
Begin by selecting the network address of the connected Titan CPU device. The address is listed on a
label on the top of the CPU hardware; this address should appear in the ‘Select Port’ field in TCS. If the
address does not appear, click on ‘Query for CPU’. After the ‘Select Port’ field updates, select the
correct device address and then click ‘Connect’ (function key F1) to connect to the Titan CPU
Note: The Titan CPU runs with a fixed IP address – it does not support DHCP protocols.
Note: The ‘CPU Settings’ pane in the example above is used to set the power‐up condition of
the CPU. The three checkboxes function as follows:
Mars Labs | 29 C Street | Laurel, Maryland 20707
10
APN‐1001 ‐ DAC Analog I/O Applications
Auto Start: When checked, this enables the Auto Start feature. ‘Auto Start’ commands all
connected Titan hardware to begin scanning when the CPU powers up.
Auto Record: When checked, this enables the Auto Record feature. When enabled, the CPU will
begin recording a dataset upon power‐up.
Monitor Mode: When checked, Monitor Mode is enabled. Monitor Mode prevents the CPU from
altering device configurations. When Monitor Mode is enabled, the CPU will not query devices
and will not send any commands to connected devices. Instead, it will load the configuration it
used for the previous run and assume it is connecting to the same devices already running.
After connections are established, the ‘Device Information’ fields will be filled with information about
the connected Titan hardware, as shown below. To complete the Titan Device configuration, select the
desired scan rate and the filter frequency of the Titan CPU from the drop‐down menus. The speed,
scan rate and filter frequency for the Titan CPU will be applied to all connected Titan devices.
NOTES:
1. When a CPU configuration includes a DAC, you must select Low Speed mode with a 1200Hz
scan rate.
2. If the Titan CPU is configured for High Speed operation when Low Speed Titan Pods or
Mini‐Recorders are connected, an error will result.
3. For complete information on all CPU Device Configuration screen options, see
‘Advanced Settings’ in the TCS User manual.
Mars Labs | 29 C Street | Laurel, Maryland 20707
11
APN‐1001 ‐ DAC Analog I/O Applications
The Titan CPU supports up to 8 Titan Pods. Titan devices can be added or removed from the Titan CPU
as needed, but any new devices are not automatically detected. If you wish to add additional Titan
Pods after the initial configuration (the Titan CPU auto‐detects devices only upon power‐up), make the
connections and then click on the ‘Re‐Query Devices’ button. The Titan CPU will scan all ports for new
devices, and TCS will display a status message during the process:
All connected Titan devices should be detected and appear in the device list in TCS.
Mars Labs | 29 C Street | Laurel, Maryland 20707
12
APN‐1001 ‐ DAC Analog I/O Applications
3. Configure the Sensors
Configure the Sensors by clicking on the ‘Sensors’ tab. The Sensors screen allows you to enter and
configure the various sensors that will be used in the test (Accelerometers, Strain Gauges, etc).
To add a sensor, click on the ‘New Sensor’ button [F5]. In the new window, type in the desired name of
the sensor. Select the sensor type from the ‘Type’ drop‐down menu, and then click ‘OK’. Note that
once you click ‘OK’ the sensor name cannot be changed.
NOTE: You can also create a new sensor simply by double‐clicking on the desired sensor type in
the Sensor Tree. Any sensors created in this manner will be named automatically ‐ you will not be
able to specify the sensor name.
Mars Labs | 29 C Street | Laurel, Maryland 20707
13
APN‐1001 ‐ DAC Analog I/O Applications
As sensors are added, each name will appear in the Sensor Tree on the left side of the window. You can
enter additional information about each new sensor (description, manufacturer, model, etc.) in the
editable fields. A table at the bottom of the window provides an overview of all of the sensors available
in the test. Note that the table is for display only; it cannot be used for editing.
Continue adding sensors in this manner until you have defined all of the sensors used in the test.
Mars Labs | 29 C Street | Laurel, Maryland 20707
14
APN‐1001 ‐ DAC Analog I/O Applications
4. Assign Sensors to Channels
The next step is to assign sensors to channels, and configure basic parameters for each sensor in TCS
by setting the Gain, Balance type, and Calibration type. This is accomplished in the ‘Tags and Channels’
screen.
To assign a sensor to a channel, highlight the desired channel in the Channel Tree on the left and then
select the sensor from the Sensor drop‐down. As each sensor is assigned to a channel, the assignment
will appear in the table at the bottom of the window. This table provides a detailed overview of all
channel assignments and is for display only; it cannot be used for editing.
NOTE: In the Tags and Channels screen, all channels are initially assigned to a default voltage sensor type.
Continue assigning sensors to channels until all sensors have been assigned for all of the channels of all
connected devices, then select ‘SAVE’ in the TEST menu to save your test configuration. TCS is now
configured for calibration and testing.
Mars Labs | 29 C Street | Laurel, Maryland 20707
15
APN‐1001 ‐ DAC Analog I/O Applications
CALIBRATION
With the system now configured in TCS, the next step is to perform a Calibration on the sensors. To
illustrate the process, we will use an example of a calibration using a Dytran accelerometer.
Background
Due to the design of the calibration circuitry, resistive calibration (RCAL) values in TCS are valid only for
an excitation voltage of 2.048V. Since Dytran accelerometers are calibrated using a much higher
excitation voltage (7 volts), the RCAL values will have to be determined manually in order to calibrate
the sensors. The following example will illustrate the process.
Procedure
Beginning at the Sensors screen, a Dytran accelerometer sensor is configured for a 7 volt excitation as
shown below. At this point, however, the displayed Shunt Calibration values are not correct for the
chosen excitation voltage. We will need to determine what the calibration values are supposed to be
and manually enter them.
NOTE: For more information on RCAL, see the TCS User Manual
Mars Labs | 29 C Street | Laurel, Maryland 20707
16
APN‐1001 ‐ DAC Analog I/O Applications
Switching to the Tags and Channels screen, configure the sensor for Cal Type = ‘RCAL’ and
Bal Type = ‘Yes’.
Now we can check the resistive calibration (RCAL) values for the sensor.
Connect to the Titan device by clicking ‘Connect’ [F1]. Switch to the Single Pod Monitor screen (under
the Runtime tab) and click ‘Scan’ to begin scanning. Perform a Balance operation by clicking on
‘Balance’ [F10] and responding YES to the prompt.
Now click on ‘Toggle Cal –‘ [F8]. Record the value that is displayed (“‐1.065” in the example below).
Mars Labs | 29 C Street | Laurel, Maryland 20707
17
APN‐1001 ‐ DAC Analog I/O Applications
Click on ‘Toggle Cal +‘ [F7]. Record the value that is displayed (“‐0.466” in the example below).
Stop the scan by clicking on [F3], and then switch back to the Sensors screen. In the Shunt Calibration
pane, enable the checkboxes for Manual entry and then enter the recorded CAL+ and CAL‐ values into
the appropriate ‘RCal+ Target’ and ‘RCal‐ Target’ fields:
Mars Labs | 29 C Street | Laurel, Maryland 20707
18
APN‐1001 ‐ DAC Analog I/O Applications
To check the calibration, return to the Single Pod Monitor screen and begin scanning. With the sensor
oriented right‐side up, observe a value of ~1g:
Mars Labs | 29 C Street | Laurel, Maryland 20707
19
APN‐1001 ‐ DAC Analog I/O Applications
RUNTIME MODES
TCS offers a number of data display options in the Runtime environment. A few example screens are
shown below.
Runtime Plot:
A scrolling data display
Single Pod Monitor:
Numerical display of data from a single Pod
Multiple Pod Monitor:
Numerical display of data from multiple Pods
Multiple Plots:
Individual user‐selectable channel displays
Min/Max Display:
X/Y Plot:
Two channels plotted against each other
Minimum and maximum channel values
Mars Labs | 29 C Street | Laurel, Maryland 20707
20
APN‐1001 ‐ DAC Analog I/O Applications
Capture
A ‘Capture’ function available in the Runtime environment allows you to acquire and display a pre‐
defined amount of sensor data from a single channel.
When you press ‘Capture’ (F2), a dedicated capture window appears. Within the window are fields to
select the channel and the amount of data to acquire in seconds.
Each time you press the ‘Re‐acquire Data’ button, TCS will capture and display the data from the
selected channel. The example below shows a two‐second capture of data from a ‘sprung’ strain
gauge:
The Capture window controls related to the display:
‘Show Points’ checkbox ‐ Toggles the sample points ON/OFF
Average ‐ Displays the average value of all data points in Engineering Units
‘Plot FFT’ checkbox – Replaces the XY plot with an FFT of the sampled data
FFT Window Size ‐ Sets the size of the FFT window
Plot Power Spectrum – Replaces the XY plot with a Power Spectrum plot
NOTE: The ‘Plot FFT’ and ‘Plot Power Spectrum’ checkboxes operate like radio buttons ‐
only one box can be selected at a time.
Mars Labs | 29 C Street | Laurel, Maryland 20707
21
APN‐1001 ‐ DAC Analog I/O Applications
The Strain Gauge data displayed as an FFT:
The Strain Gauge data displayed as a Power Spectrum Plot:
NOTE: Right‐clicking in the plot window will produce a list of options, including saving or
printing the screen for post review of the data.
Mars Labs | 29 C Street | Laurel, Maryland 20707
22
APN‐1001 ‐ DAC Analog I/O Applications
EXPORT
To export recorded data sets, access the exporter function by clicking on the ‘Export’ tab.
The Export window displays all of the locally recorded files created under the current test name. To
view files that were recorded remotely on the connected Titan device, click the ‘Browse Remote Files’
tab at the top, then click the Browse Device button to view the files stored on the device. Data test files
stored in alternate locations can be accessed by clicking the Browse SD button.
To transfer remote files, select the desired files from the list and then click Transfer Files. To view
newly transferred files, switch back to the ‘Export and Review’ tab and select any of the standard
viewing options. Note that you may have to change the test selected under the ‘View Test’ drop down
in order to see the transferred files.
NOTES:
1. Test files that are recorded remotely will always have a ‘‐r’ appended to the file name:
Sample_Test_0002‐r.tdf
2. Test files that are imported from alternate locations will have an ‘‐ i’ appended to the file name:
Imported_Test_003‐i.tdf
Mars Labs | 29 C Street | Laurel, Maryland 20707
23
APN‐1001 ‐ DAC Analog I/O Applications
Reviewing Data
Any test file can be reviewed prior to export by clicking on the ‘Review Data’ button (F4). This brings
up a separate window that displays two views of the data: a thumbnail display of the entire test file (at
the top) and a larger display that offers zoom and pan capability (at the bottom). In either display, you
can drag across a portion of the data to get a magnified view of that section. Holding down the CTRL
key in a magnified view allows you to pan left or right, or up and down. The ‘Show Points’ button will
toggle the sample points on and off, while the ‘Fit X’ and ‘Fit Y’ buttons will fit the data into the
respective axis.
When finished reviewing the data, click on the CLOSE box to dismiss the window and return to the
Export window.
NOTE: Only one Review window can be open at a time. Attempting to review another test while the
Review window is open will result in an error.
Mars Labs | 29 C Street | Laurel, Maryland 20707
24
APN‐1001 ‐ DAC Analog I/O Applications
Exporting Data Files
Test data can be exported in seven file formats:
WAV ‐ PC sound file format. Permits viewing the data graphically using standard PC sound
applications.
CSV ‐ ‘Comma Separated Value’, a plain text data file with fields separated by commas.
TSV ‐ ‘Tab Separated Value’, a plain text data file with fields separated by tabs.
RPCIII ‐ Standard data format used in noise and vibration measurement/analysis systems.
MATLAB ‐ Data format compatible with MATLAB
HDF5 ‐ Portable data format for managing very large data collections
BLOb ‐ ‘Binary Large Object’, DBMS files in a binary format
Use the ‘Export Format’ drop‐down to select the desired file format:
Several of the file formats offer additional exporting options that are accessed by selecting the
‘Export Options’ button:
Mars Labs | 29 C Street | Laurel, Maryland 20707
25
APN‐1001 ‐ DAC Analog I/O Applications
CSV / TSV Options:
Include Timestamp ‐ When checked, the Timestamp will be included with the exported CSV or TSV
data. An example is shown below.
Exported ‘CSV’ data file with timestamp
(viewed in Microsoft Excel)
An example of an exported ‘CSV’ file might look like this:
Sample_test_0002.csv
where:
‘Sample_test’ is the test name
‘0002’ indicates the second recorded dataset (indices)
‘.csv’ is the file format
Enable Decimation ‐ When this is checked, exported data will decimated by the value in the ‘Decimate
By’ field. Valid decimation values are in the range of 1 ‐ 1000. Entries can be made by using the
increment/decrement button, or by manually entering a value in this field.
Mars Labs | 29 C Street | Laurel, Maryland 20707
26
APN‐1001 ‐ DAC Analog I/O Applications
DAC OPERATION
The Titan DAC outputs a voltage based on the input voltage for a given Titan Pod channel. For any
Pod/DAC pair, Pod channel 1 corresponds to DAC channel 1, Pod channel 2 corresponds to DAC
channel 2, etc.
For any test configuration where a DAC is used, the Device Settings in TCS should be set to ‘Low Speed’
with a Scan Rate of ‘1200 Hz’. These settings are automatically established when ‘Mini‐Recorder + DAC’
is selected as the device type in TCS, but they may have to be selected for other device types (‘Mini‐
Recorder’ or ‘CPU’).
Relating DAC Output to a Given Input
When the system is running, the DAC translates the input sensor units (e.g. “g” for accelerometers) to
an output voltage. Calculating the output voltage based on the sensor input requires an understanding
of the relationship between the full‐scale input range and the full‐scale output range (+/‐ 10 Volts). The
following example explains this.
Example: A Dytran Accelerometer is set up as shown below. In the Sensitivity pane, observe the
Sensitivity figure of 20.2 mV/g
Mars Labs | 29 C Street | Laurel, Maryland 20707
27
APN‐1001 ‐ DAC Analog I/O Applications
In the Tags and Channels screen shown below, this sensor is assigned to Channel 1, “Accel Channel 1”.
The input Gain is set to 16, which affects the Accelerometer sensitivity. For this Gain value, the
highlighted row in the table below shows a series of related properties. Notice the Range value of
+/‐ 6.3364g. This range is the maximum number of g’s this channel can have from the accelerometer.
How does this relate to the DAC output voltage?
To convert the reading in ‘g’ to ‘Volts’ at the DAC output for this channel, consider that the DAC output
can range from ‐10 Volts to +10 Volts, while the input can accept from ‐6.3364g to +6.3364g. This gives
the relationship:
10V = 6.3364g
‐ or –
10V/6.3364g = 1.578V / g
This says that if the accelerometer is reading 1g, the DAC will have an output of 1.578 Volts. If the
accelerometer changes to 2g, the DAC will put out a voltage of 2 X 1.578 Volts = 3.156 Volts.
Mars Labs | 29 C Street | Laurel, Maryland 20707
28
APN‐1001 ‐ DAC Analog I/O Applications
Delay
There is a small time delay between the input signal (into the Pod) and the output of the DAC. When
measuring the time delay, one would see a signal at the input of the Pod, and then when looking at the
actual output of that same signal out of the DAC for that channel, the signal will be delayed by a small
amount of time (measured in msec). This delay is a function of the TCS Filter Frequency (configured in
the ‘Device Configuration’ tab).
The time delays for different filter settings are shown below. For all filter settings shown, the Scan Rate
is always 1200 Hz.
Scan Rate = 1200 Hz
TCS Filter Frequency
200
150
100
80
50
40
20
Delay Time (1 / Source HZ)
(Calculated)
38.9 msec
40.3 msec
43.1 msec
45.2 msec
51.5 msec
55.9 msec
78.1 msec
DAC Reconstruction Filter Attenuation
The DAC features a fixed 150 Hz, 3‐pole reconstruction filter in the DAC output stage. The filter is
enabled or disabled using jumpers on the DAC printed circuit board (configured at the factory). When
enabled, the filter will gradually attenuate the DAC output signal as the input frequency is raised.
The table below shows the reconstruction filter characteristic as a percentage of attenuation for
specific frequencies. An expanded view of the filter attenuation that occurs at and around the 1% point
is shown at right.
Mars Labs | 29 C Street | Laurel, Maryland 20707
29
APN‐1001 ‐ DAC Analog I/O Applications
ADDITIONAL RESOURCES
Addition information regarding the equipment covered in this document can be found in the following
Titan Device User Manuals:
MNL‐1001 – TCS User Manual
MNL‐1003 – Titan CPU User Manual
MNL‐1006 – Titan DAC User Manual
MNL‐1009 – Titan BMS User Manual
© Copyright 2015 Mars Labs, LLC
www.marslabs.com
Mars Labs | 29 C Street | Laurel, Maryland 20707
30