1
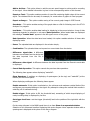
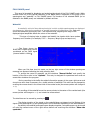
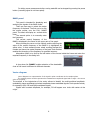
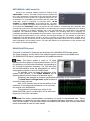
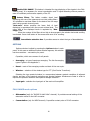
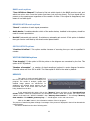
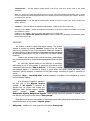
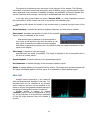
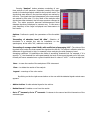
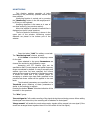
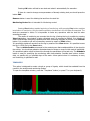
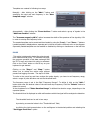
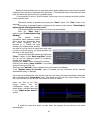
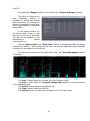
ST131 Analyzer Pro Version 1.0.7 User’s Manual 1 PURPOSE ........................................................................................................................................................ 3 SYSTEM REQUIREMENTS ................................................................................................................................ 3 PROGRAM INSTALLATION ............................................................................................................................... 3 CONNECTION .................................................................................................................................................. 3 INTERFACE ....................................................................................................................................................... 3 OPERATIONS WITH DIAGRAMS ...................................................................................................................... 4 CONTROL BUTTONS ........................................................................................................................................ 5 RIGHT MOUSE BUTTON .................................................................................................................................. 5 FULL RANGE panel ........................................................................................................................................... 7 WATERFALL .................................................................................................................................................. 7 BAND panel ...................................................................................................................................................... 8 VECTOR DIAGRAM ....................................................................................................................................... 8 RECORDING a WAV audio file ...................................................................................................................... 9 DEMODULATION panel ................................................................................................................................... 9 OPTIONS ......................................................................................................................................................... 10 FULL RANGE mode options ........................................................................................................................ 10 BAND mode options................................................................................................................................... 11 DEMODULATOR mode options .................................................................................................................. 11 OSCILLOSCOPE options .............................................................................................................................. 11 VECTOR DIAGRAM options ........................................................................................................................ 11 MEMORY ........................................................................................................................................................ 11 ARCHIVE ......................................................................................................................................................... 12 ANALYSIS ........................................................................................................................................................ 13 MONITORING ................................................................................................................................................. 15 TEMPLATES .................................................................................................................................................... 16 PULSE ............................................................................................................................................................ 17 RANGES .......................................................................................................................................................... 18 APPENDIX 1. The list of measurements ........................................................................................................ 20 APPENDIX 2. The list of the averaging modes ............................................................................................... 21 2 PURPOSE ST131 Analyzer Pro software is designed for operation as a part of ST131 “PIRANHA II” device and it provides PC analyzing of the signals received from the main unit through the USB cable. SYSTEM REQUIREMENTS Processor: dual core processor with CPU operating frequency of 2000 MHz or more; RAM: 1024 MB or more; Display: 1024х768 at least, a wide screen type monitor is recommended; Ports: USB 2.0 x 1; Operating system: Windows 8, Windows 7, Windows Vista, Windows XP (including 64-bit releases). PROGRAM INSTALLATION To install the program you should run ST131AnalyzerProSetup-х_х_х.exe file where х_х_х – number of the version. After start the program will display a language selection dialog box. Press ОК. Then installation wizard welcome window appears. Press Next. In the next window it is possible to select a folder where the program will be installed. Select a folder or use a folder by default. Press Next. Then a folder in Start menu selection window appears. Select a folder or use a folder by default. Press Install. The program will be installed and installation wizard complete window appears. A checkbox Run ST131 Analyzer Pro enables starting of the program after completion of operation of the installation wizard. A checkbox Install driver will enable to install the USB driver for the device, if it is not installed. Press Finish. The program has been installed. CONNECTION Connect the main unit of ST 131 to USB port of the PC by the connection cable. In case of loss of the connection with the device the program automatically offers to switch over to demo mode. It is possible to switch over to this mode manually – in menu File -> Demo mode. There is no data exchange when using demo mode and diagrams display synthetic demo data. INTERFACE Channel list box similar to the list in the ST131 main unit is displayed when starting the program. Then selection of channels is also available in drop-up menu in the right bottom corner of the main program window. 3 The main program window is divided into three panels – for three operating modes of the ST131 device correspondingly. FULL RANGE mode data is displayed at the top. Lower left panel is used for BAND mode data. DEMODULATION mode indication is displayed below on the right. Name of the program, its version and current channel are indicated in the header of the main window of the program. The program supports Russian and English languages for interface. Russian language is selected by default if the language of the operating system is Russian, in other cases English language is selected. Forcible select a language is possible through menu View -> Language. Color pattern of the program diagrams can be changed by the dialog box Tools -> Preferences. The “Apply” button enables see new colors of the diagrams promptly without closing this box. Menu Help provides access to the present manual and information about version of the program. OPERATIONS WITH DIAGRAMS The diagrams in all panels and modes operate similarly. Scales are placed at the left and below. The diagram itself as well as the scales is sensitive to tracking and to mouse wheel. Horizontal scale (X scale) is divided into two parts. When pointing the cursor the corresponding area is highlighted and the cursor changes its form accordingly. A left part is responsible for left border of the image while a right part is responsible for the right one. Vertical scale (Y scale) is divided into three parts. A lower part controls the lower border, a middle part controls both borders synchronously, and an upper part controls the upper border. Image borders can be changed by four methods: • Use of the mouse cursor. For this you should set the cursor on the scale, press a left button of the mouse and while holding the button move the mouse in required direction. Move to the right results in decrease of the initial (if the cursor is placed in the left part) or end (the cursor in the right) of the visible frequency range. Move to the right results in increase of initial or end of the visible frequency range vice versa. • In case of pointing the cursor on the diagram and pressing and holding the left button of the mouse move the mouse in required direction a visible part will be moved together with the cursor within the full range. • Use of the mouse wheel. For this you should set the cursor on the scale and scroll the wheel of the mouse. Use of the mouse wheel results in prompt changing of the width of the displayed section of the range as to selected central frequency. This is so called an electronic magnifier. Place a cursor of the mouse on the desired section of the diagram and increase or decrease displayed frequency range by scrolling the wheel. • Use of the dialog box. This box is called by double click on any place of the scale. 4 In the oscillogram the middle part of the vertical scale is responsible for vertical shift of the diagram without changing the scale. The middle zone in the BAND panel is divided by a dotted line. The upper part shifts the first diagram (I component of the IQ signal) while the lower part shifts the second diagram (Q component of the IQ signal). It allows separating of the graphs for more convenient analysis. CONTROL BUTTONS The control buttons common for all panels are listed below: Pause/Resume. It stops new data displaying. It enables viewing of the graph in details and carrying out of cursor measurements. Repeated pressing on the button resumes displaying of incoming data. One Step Update. Pressing on the button results in single refreshing of the graph. Spectrum. The signal spectrogram is shown on this panel. Waterfall. The colored spectrograms in real time are shown on this panel. Oscilloscope. The signal in time domain is shown on this panel. Reset. It returns of the graph settings by default (maximal dynamic and frequency ranges). Adjust to the level of noise Auto-detection of the range by Y axis. It sets up a visible range by vertical in such way that a maximal peak in the spectrogram occupies the whole height of the window. RIGHT MOUSE BUTTON Clicking the right mouse button on the diagram calls a context menu. A concrete set of commands of this menu depends on panel, channel and displaying mode. The following options are possible: Enable Delta Cursor. This option enables relative measurement on the graph. Cursor measurements can be carried out by horizontal line and vertical line as well. In oscilloscope mode a frequency is computed also on the basis of the measured period of time. Set Max Freq As Band Window Center. In this option the maximum frequency in current range is determined and set up as a central frequency in the BAND panel. It is necessary to point out that for the channel “RADIO 30-4400 MHz” only visible range is taken into account while the full range is used for all other channels. View measurements... This option displays a window with the results of the measurements of the signals in various interpretations. There is a button Select in the window intended for selection of necessary measurements. A set of measurements depends on the panel and displaying mode. A complete list of the measurements including comments is given in the Appendix 1. 5 Add to Archive... This option allows to add the current panel image to archive and/or recording of the signal. More detailed information is given in the corresponding section of this manual. Export as Text... This option enables creation of a text file containing digital values of the current signal. The obtained file can be used, for example, for construction of graphs in Excel program. Export as Image... This option enables saving of the current graph image in JPEG format. Save data... This option enables saving of the graph data as a file for following use in the ST131 Analyzer Pro program. Load data... This option enables data loading for displaying in the current window. A way of data displaying depends on selection in sub-menu Data Operation. When loaded data are displayed the message “Loaded data” appears in the left upper corner of the graph. Data Operation. When the data have been loaded, this option enables selection of these data displaying mode: • Pause. The uploaded data are displayed in the window simply. • Combination. The uploaded data are imposed on current data from the device. • Difference: signal-data. A difference between current data from the device and the data imported from the file is displayed. • Difference: data-signal. A difference between the data imported from the file and current data is displayed. • Cancel Data Operation. This option cancels the previous data operations. The following item appears when displaying “waterfall”: Show Spectrum. It switches on displaying of spectrogram (at the top) and “waterfall” (at the bottom) on the current panel. When displaying oscillogram the following items appear: Enable autoscale. If this option is switched on, the minimum and maximum vertical limits of the oscillogram are computed basing on the signal. Any attempt to change the vertical limits results in switching off of automatic tuning. Enable trigger. If this option is ON, the threshold level, exceeding of which stops displaying of newly incoming data, is displayed by red line. Set trigger level here – set the trigger (threshold) level to the position of the right-click with the mouse. On the vector diagram in the BAND panel there is an item Show in a separated window. Selection of this command transfers displaying this vector diagram into a separate window while a spectrogram is displayed at the place of the vector diagram. 6 FULL RANGE panel This panel is intended for displaying and analyzing the signals of the FULL RANGE mode. White vertical cursor line of the central frequency of the BAND panel is displayed on the graph of the spectrogram and “waterfall” in FULL RANGE panel. The borders of the selected BAND (to be selected in the BAND panel) are indicated by dotted red lines. Waterfall A waterfall is a kind of three-dimensional plot in which multiple spectrograms are displayed simultaneously. Wherein the amplitude of spectral harmonics is looked as a color. Red color shows the maximum signal level, blue – the minimum level. Adjusting the range of the displayed signal amplitude affects the colors of the waterfall. This type of viewing helps to detect and identify the signals which have random frequency and duration (for example, FHSS — frequency-hopping spread spectrum). The figure shows the BLUETOOTH signal which can be considered as the FHSS signal (channel width is 1MHz). When you first time turn this mode, on the top right corner of the window spectrogram message box appears indicating the total recording time. To ensure the record of waterfall, set the checkbox "Record Buffer" and specify the location of the file on disc in the "Options". This entry is designed for operational work and not saved after shutdown the program. During recording to the buffer the added information appears in the upper right corner and shows how much time is necessary for a visible window of waterfall. This value can be changed by scrolling the mouse wheel in the lower third of the vertical scale (the mouse pointer will change to <->). For scrolling of the waterfall move the mouse pointer to the center of the vertical scale (the mouse pointer will change to <->) and rotate the mouse wheel. The total time can be zeroed by pressing on . The display duration of the signal on the waterfall does not depend on the lifetime of the signal on the spectrogram (on the spectrogram it can be different depending on the used detector). By default, the waterfall and spectrogram displays together, but spectrogram can be turned off using the context menu of the right mouse button and removing the checkbox "Show the spectrum." 7 For taking cursor measurements the running waterfall can be stopped by pressing the pause button (recording signal is not interrupted). BAND panel This panel is intended for displaying and analyzing the signals of the BAND mode. There are two ways to select the center frequency of the band. The first one is to click the mouse pointer over the FULL RANGE panel. The band will display as vertical white lines. The second option is to manually enter the frequency. The current central frequency of the BAND is displayed in the frame in the upper part of the graph. When pointing the cursor on the number position marking the value of the central frequency of the BAND it is highlighted by yellow color. In that moment mouse wheel scrolling changes the number and hence the central frequency of the band. Such method enables fast changing of the frequency at specified accuracy. Alternative option is to click by the left button of the mouse inside the frame and enter the required frequency in the dialog box. A drop-down list “BAND” enables selection of the bandwidth. A set of the bands is different in different channels. Vector diagram Vector diagram is a representation of the signal in polar coordinates in the complex plane. The resulting vector module represents the instantaneous amplitude signal and an angle - the current value of the phase. The analysis of the trajectories of the vector allows to identify the multi-positional amplitudemodulated, phase-modulated and mixed-amplitude-phase-modulated signals. Such species include, for example, ASM, PSK and QAM modulated signals. Signals with constant amplitude, for example, FM will appear as a circle with center at the origin. 8 RECORDING a WAV audio file Access to the recording window provides by clicking on the "Write WAV…" button. The band IQ signal will be recorded with the I and Q quadrature components as the right and left channel of the WAV file in stereo format. The original IQ signal has a 24bit resolution. For compatibility with software that only works with 16-bit data there is a selection of recording mode: “24-bit samples” or “16-bit samples”. If you select 16 bits, the upper 16 bits of the original 24-bit data will be recorded in the WAV file. If you select the “Normalize” option, the system will work similar to a system with AGC (Automatic Gain Control) and it will convert the signal amplitude in recording WAV file so that the available bit (16 or 24 bits) is used as efficiently as possible. Sampling rate of the recorded WAV file corresponds to the selected bandwidth. The maximum possible sampling rate is 6.8MHz. The recording data can be dropping out periodically depending on the bandwidth and performance of the computer. The lower the selected bandwidth and the higher the performance of your computer, the less likely dropping-out. For example, a signal with a bandwidth of 100 kHz and below should be no loss of recording on all modern computers. A signal with a bandwidth of 300 kHz and above can be recorded with gaps. Information about the current number of lost data is indicated in the recording process. This value will depend on the performance of the computer and the number of launched applications. DEMODULATION panel This panel is intended for displaying and analyzing of the DEMODULATION mode signals. The center frequency and the band of the analyzed signals correspond to the BAND panel. The DEMODULATION panel is equipped with few additional buttons: Video. This button enables a mode of TV signal decoding and it's displaying in the separate window. For this it is necessary to set the central frequency corresponding to the TV signal transmission frequency. The 5100 kHz band and AM demodulation mode set automatically as well as stop displaying signals in the FULL RANGE panel . For example, when you select the frequency of the wireless video camera, in the Video Window will be displayed black and white image of a television signal. Refreshing rate depends on computer performance and quality of the received signal. The Dark level and Bright level regulators allow to correct the image contrast. Also, in this window, there is the information on the resolution of the image and the features of the horizontal and vertical sync identification. The presence of horizontal sync pulses in the DEMODULATION panel is a confirmation of the well-tuned frequency of the video transmitter. Sound This button enables/disables reproduction of sound for demodulated data. Sound reproduction is possible for the band values not exceeding digitization frequency of your sound card (192 kHz usually). If several sound cards are installed in the system then you may select what sound card should be used for audio output. 9 Disable FULL RANGE. This button is intended for stop displaying of the signals in the FULL RANGE panel. It is necessary for sound reproduction and TV signal decoding without pauses in case of insufficient performance capacity of the PC. Octave filters. This button enables signal level displaying with use of the octave and one third octave filters. It is possible to use these filters for the data of the full range when using acoustic channel mode. “Auto-zero” button specifies the lower limit of level displaying in accordance with the current minimal level. The upper limit of the displayed levels is regulated by “Max. range” field. When the number of the filters is too high to be arranged in the window horizontal scrolling is activated. Press a left button of the mouse and move it for scrolling. Demodulator selection box. It provides access to select the type of demodulation. OPTIONS Options window is called by pressing the Options button in each panel. In this case an additional options window appears; this window has three sections – one section per panel. Capacities, which are common for all panels: Averaging – a type of spectrum averaging. The list of averaging types is given in the Appendix 2. Reset – reset of the averaging results and start of the new cycle. Window – selection of the window type for FFT (Fast Fourier Transform). Selecting the type spectral window is a compromise between spectral resolution of adjacent signals, accuracy of the spectral resolution and spectral leakage. Windows are listed in order to improve the spectral resolution and spectral leakage reduction. Input gain - selection the input gain of the main unit's amplifier. FULL RANGE mode options Attenuator (only for “RADIO 30-4400 MHz” channel). It provides manual setting of the attenuator value for the UHF converter. Commutation (only for WIRE channel). It specifies contact pairs of RJ-45 connector. 10 BAND mode options "Tune Off Mirror Channel". It allows to find out which signals in the BAND panel are real, and which are mirror ones. Press the button few times (not more ten times). The true signal will be present on the spectrogram regardless of the number of clicks. If the signal is disappeared, that means it is a false signal. DEMODULATOR mode options "Sound" – selection of audio signal parameters: • Audio device. It enables selection which of the audio devices, installed in the system, should be used for sound reproduction. • Use AGC (automatic gain control). It switches on automatic gain control. If this option is disabled then gain can be controlled by the wheel control placed below. OSCILLOSCOPE options “Combine N buffers”. This option enables increase of scanning time pro rata to specified N number. VECTOR DIAGRAM options “Line drawing”. If this option is ON the points on the diagram are connected by the line. This option is OFF by default. “Number of samples” – a number of signal samplings involved in vector diagram formation. Potential values are from 256 to 4096. The value equal to 4096 is the value by default. MEMORY This option is used to transfer data from the ST131 main unit to the ST131 Analyzer Pro program. The results of analysis, graphs and detailed image pattern are transferred. In additional, the detailed image pattern can be transferred back to the ST131 main unit after being loaded from the disc. To get started with this option, click on the "Memory" button and then on the "Download from ST131» button. Follow the instructions in the information window. Select and confirm your choice in the "MENU" of the main unit: "SELECT CHANNEL:" then "Memory data transfer...". The message "Memory data transfer... To CANCEL, press any key... " should appear on the main unit screen. Click on the «OK» button in the information window of the PC program. The process of transferring data will begin. Percentage of the process is displayed in the info bar beneath the control buttons. The data is divided into the three following tabs: 11 "Analysis List" - This tab gathers signals stored in the ST131 main unit, as the result of the option "Analysis". When you click on the right mouse button over the string, a sub-menu appears that allows you to do two actions: integrate the selected signal directly to the archive system of this program (the window "Archive") or delete it from the list. "Spectrograms" - This tab gathers spectrograms stored in the ST131 main unit, as the result of the option "Memory". "Pattern" - This tab obtains the detailed image pattern created in the ST131 main unit. Clicking on the "Save…" button provides the preservation of the entire volume of the data in a file with the extension «.mem». Clicking on the "Load..." button provides the loading of the saved data. Clicking on the «Upload the pattern to ST131» button provides the uploading of the detailed image pattern stored in the PC ARCHIVE An archive is used for signal information storing. The Archive window is opened by clicking “Archive” button in the full range panel or by pressing F2 key on the keyboard. When this window is opened receiving of data is disabled. Archive data include the results of real-time measurement and use of ANALYSIS and MONITORING functions. Data for the archive is the result of real-time, used analysis and monitoring functions, as well as downloaded data from the main unit. For real time, signals adding to the archive it is necessary while being in any of three panels to press the right button of the mouse and select an item “Add to Archive”. In this case, a dialog box appears where it is possible to specify a group where the signal should be added, give comment, specify necessity of attaching of the graph image, recording of signal or recording of sound. A checkbox “Stop … recording after” enables limitation of duration of the recording by a time period indicated nearby. A list Groups of signals is placed in the left part of the Signals Archive window. If “All signals” is selected, all signals from all groups and modes are displayed. Main groups section includes inbuilt groups: Legal signals, Dangerous signals, Suspicious signals. These groups cannot be renamed or deleted. User can add his own groups in the section “User groups”. Operations with groups are possible in the context menu after pressing the right button of the mouse while being in the section “Signals group”: • Add group – addition of a new group into the section User group. 12 The signals from selected groups are shown in the right part of the window. The following information is contained concerning each signal: date of addition, group, signal frequency, signal band, signal peak level, comment, availability of images, and availability of records, channel and sources (real-time mode, analysis, monitoring or downloaded data from the main unit). In the right part of the window is a button "Save as HTML ...», which intended to preserve the archive data in HTML format, and a list of signals from the selected group. Operations with signals are possible in the context menu by pressing the right button of the mouse: • Go to Frequency. It retunes the device to assigned frequency and close archive window. • View record. It enables reproduction of video of the recorded signal (in case of availability of the record). Reproduced signal is displayed in all three panels in such a way as the signal incomes from the device in real time. When reproducing an additional window appears that shows a reproducing progress, and it is possible to stop and repeat reproduction of the signal in this window. • View image. It enables to view the images associated with the signal (if available). The image is displayed in the corresponding box in the form of a static picture. • Sound Playback. It enables listening of the demodulated signal. • Set Comments. It enables changing of the comments related to signal. • Delete. It enables deleting of the signal from the archive. The images and record associated with this signal are deleted together with the signal. It is impossible to restore deleted signal. ANALYSIS Analysis means comparison of the spectrum with the threshold level specified by the user. The threshold level can be specified as an absolute value in dBm as well as it can be specified as an excess in dB over the template computed basing on averaging of the specified number of spectrum. Analysis window is opened by clicking “Analysis” button in the full range panel or by F5 key on the keyboard. A threshold line is displayed on the full range spectrum when the window is opened. 13 Pressing “Analyze” button actuates conducting of onetime analysis of the spectrum. Repeated pressing the button results in conducting analysis related to the previous result. The signals that were absent in the previous analysis are marked by red color. The signals that have disappeared in the new analysis are marked by blue color. If in the result of the analysis some signals have been detected, the full range spectrum changes its form. The whole spectrum becomes semitransparent while detected signals are displayed in common way. In this case a peak frequency of the range is displayed over these sectors in the frames. Options. It allows to specify the parameters of the threshold line. “Exceeding of absolute level XX dBm”. Selection of thresholds is a straight line with its installation on the spectrogram, at the value "XX", relative to noise level. “Exceeding of average value XX dB, with coefficient of averaging YYY”. The choice of the threshold as a broken line that exceeds the signals at the XX dB. This variant is effective when the difference of signal levels is high, for example, when analyzing the wide frequency band. Averaging coefficient YYY determines the value of smoothing threshold line. For example, if it is equal to “1”, the threshold line will repeat exactly the level of the current signals and in this case, formally will never exceeded over a given threshold level. A value of “1000” - it will a straight line. Save – to save the results of the analysis as HTML document. Clear – to delete the results of the analysis. Legend – meanings of the color marks. By clicking on the the right mouse button on the row with the detected signal context menu appears: • Add to Archive. It adds selected signal to the archive. • Delete Record. It deletes a row from the results. • Go to 2nd harmonic, Go to 3rd harmonic. It retunes to the second and third harmonics of the selected signal. 14 MONITORING This function enables execution of tasks according to the preliminary specified criteria and time schedule. Monitoring function is carried out by pressing the “Monitoring” button in the full range panel or by F6 key on the keyboard. Analyzing algorithm is the same as in case of one-time analyzing (see previous section). When the window is opened a threshold line is displayed on the full range spectrum. The list of tasks for monitoring is shown in the upper part of the window. Monitoring control elements are placed in the bottom part of the window. Press the button “Add” for adding a new task. The “Monitoring task” window appears. A field Name is intended for assigning a name for the task. Items selected in the group Parameters are channel for monitoring and frequency range. Averaging and FFT window type can be specified as well. Current channel and whole frequency range are selected by default. In case if averaging and window type have not been specified, the current values at the moment of execution of the task are used. It should be noted that if any specific values for averaging or window type have been specified in the previous task these values will be applied in the next tasks. The threshold parameters are specified in the Threshold group. Meaning of these parameters is similar to the meaning in analysis. Pressing the button “Show” refreshes indication of the threshold in the spectrum. The “Misc” group: “Record signal to” will enable recording of the signal during the monitoring process. When adding found signal into the archive, the recording will be attached to that signals. “Merge events” will enable the mode when nearby signals will be merged into one signal (if the events are arranged closer together than 10% of the width of the first signal). 15 Pressing OK button will add a new task and select it automatically for execution. If there is a need to change some parameters of already existing task you should press the button Edit. Remove button is used for deleting the task from the task list. Monitoring Control box is intended for Monitoring control. Pressing Start button enables beginning of monitoring, while pressing Stop button enables termination of monitoring. Only the tasks marked by checkboxes in the left side are executed. The tasks are executed in series. It is impossible to make any operations with the task list when executing the task. The results of monitoring are recorded into the log. Viewing the log is possible by pressing View Log button. Log window is being refreshed every 10 seconds by default. It is possible to switch off automatic refreshing capability and make refreshing manually by means of the Refresh button. It is possible to sift out unnecessary records by means of Filter button. It is possible to delete all records from the log by means of the Clear button. It is possible to save the log in HTML file by the Save button. There is Add to Archive command in the context menu that enables addition of the signal to the archive. You should pay attention that attachment of image or record in this mode is impossible. It is possible to add a record to the archive through the parameters of the task only. The Schedule button is used for specifying the monitoring start time-schedule. Possible start options include: daily, on specific day, on specified days of the week. A time period when it is necessary to carry out monitoring is specified as well. TEMPLATES This option is designed to create a single or group of signals, which should be excluded from the results in the analysis and monitoring modes. To open the templates window, press the "Templates" button (or press F7 on your keyboard). 16 Templates are created in following two ways: Manually - after clicking on the "Add..." button and specifying the start and end frequency in the "New template range" window. Automatically - after clicking the "From Archive..." button and select a group of signals in the "Add From Archive" window. The "Increase ranges by 10%" option increases the width of the spectrum of the signal by 10% in order to overlap the frequency band. The created template can be saved and then loaded by using the "Load ..." and "Save …" buttons. Loaded template is displayed as a separate part in the list and with a different color on the diagram. Separately loaded templates can be enabled or disabled by clicking on checkboxes on the left side. PULSE This option is designed to detect the pulse signals, both individual and group. To minimize the gaps, the program operates in fast data exchange with the ST131 main unit when this option is activated. Click on the "Pulse" button or the F8 key on your keyboard to get started. Clicking on the "Step+" and "Step-" button allows you to review the entire range without presets and logging of events . The step is 64 MHz. To write to the event log and then analyze the pulse signals, you have to set frequency range, select a range of pulse duration and set the threshold level. The frequency range is set in the field "Frequency Ranges". To define it, click on the "Add..." button and enter the desired value of the start and stop frequency. Click the "Delete" button to delete this record. In the dropdown list of "Pulse Duration Range" is defined the duration range, depending on the expected pulses. The threshold level is displayed as solid red line above which the signal will be a subject to detection. The threshold level can be set in two ways: by entering a numerical value in the "Threshold level" field; by clicking the right mouse button on the oscillogram in the desired position and selecting the "Set trigger level here" option. 17 Setting of the threshold level is an important action, largely affecting the result of search signals (detection and recording of unwanted noise pulses etc.). The threshold must be set above the noise level and below the upper level of the possible pulses. It recommends to set the "Show Envelope" option when you are seeking the better position of the threshold level. The search process is activated by pressing the "Start" button. The "Stop" button is for stopping. The number of detected signals is displayed at the bottom of the window: "Searching for digital signals. XXX signals found so far." The detected signals are recorded in the event log automatically. Press the "View Log..." button to open “Pulse Detector Log Window”. This window contains information about detected signals. Every signal has information about the center frequency with an accuracy of +/- 32MHz, the pulse duration (the measurement accuracy can differ a lot from the true value when duty cycle of pulse is 100 and above), the signal duration and the value of the signal level. You can set some filter options by clicking the "Filter..." button. In this “Pulse Log Filter” window can be set the displayed signals by frequency, duration and amplitude. Pressing the "Clear" button erases all log entries. Clicking on the button «Save as HTML ...» provides saving of the log in HTML file. Clicking on the "Refresh" button updates the log information immediately. If the "Refresh every 10 seconds" option is enabled, the log information will be updated automatically every 10 seconds. If you click the mouse pointer over the event log entry you want, the stored associated oscillogram will be displayed with “Saved data” label. Also, when you click the right mouse button on that entry you can add it to the archive, save as an HTML file or delete. When you click on the right mouse button over the oscillographic image you can make variety activities described in the "Right mouse button" section. It should be noted that when you shut down the program the log data are not saved automatically. 18 RANGES By pressing the "Ranges" button you can activate the “Frequency Ranges” window. This option is a quick way to view frequencies relating to standards for cellular and wireless data transmission. The averaging of signals is optimized for each band. The multiple indication of standards are provided. In the opened window you can choose region, country or city, that has its own list of standards. The lists can be updated on the manufacturer's website «www.signal-t.ru». Use the "Select mobile" and "Select base" buttons to automatically select the strings with the word 'mobile' or 'base' at the end of its name. You can also select each band individually by clicking on the checkbox on the left side. The figure below shows the FULL RANGE panel when the “Frequency Ranges” window is activated. The "Add..." button allows you to create your own frequency range. The "Edit..." button opens the “Frequency Range Edit” window to change parameters of the highlighted range. The "Delete" button deletes a highlighted string. The "Clear" button erases the whole list. The "Default" button provides reset the whole list to a “first start” state. 19 APPENDIX 1. The list of measurements The measurement box shows some numerical parameters of the signal under study. To open the measurement box you may select View measurements line in the context menu of the corresponding panel. The following measurements are possible: • Maximal frequency – a value of the frequency of the maximal amplitude harmonic within the total frequency range. • Maximal frequency level – a value of the maximal amplitude harmonic within the total frequency range. • Integral level – an averaged value of the harmonic amplitudes within the total frequency range except amplitude peaks. • • • RMS level – a root mean square (RMS) level of the signal at the input. • Maximal level – a maximal level of the signal at the input. • Mean level – arithmetical mean value of the maximal and minimal levels of the signal at the input. • Maximal cursor frequency – a value of the frequency of the maximal amplitude harmonic within the selected frequency interval. • Maximal cursor frequency level – a value of the maximal amplitude harmonic within the selected frequency interval. • Cursor integral level – an averaged value of the harmonic amplitudes within selected frequency range except amplitude peaks Peak-peak level – a difference between the maximal and minimal levels of the signal at the input. The measurements of the levels for the BAND panel are displayed for in-phased (denoted by I) and quadrature (denoted by Q) components. 20 APPENDIX 2. The list of the averaging modes A mechanism of spectrum averaging makes possible detection of the stationary processes at the background of disturbances and noise as well as detection of short spectral peaks. The following types of “averaging” parameter are possible: • Instant. Instantaneous spectrum that is without averaging. Information about all previous spectra is lost. • x2, x4, x8, x16, x32, x64. Linear averaging of the spectrum. An arithmetical mean spectrum is computed by N last implementations, where N = 2, 4, 8, 16, 32, 64. The bigger N results in longer accumulation of the changes and stronger decrease of the random harmonics in the spectrum. N instantaneous spectra participate in creation of the resulting spectrum. • Peak. Peak averaging. It represents continuous memorizing of the harmonic maximal levels. Unlimited number of the instantaneous spectra is involved in creation of the resulting spectra until reset of the averaging results has been done. Such averaging allows detecting of the rare spectral peaks during a long time period. • Peak х8, х16, х32. Quasi-peak averaging of the spectrum. Signals newly appeared are displayed as peak ones while disappearing signals are averaged. 21