1
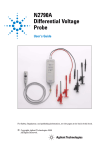
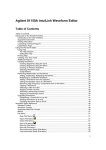
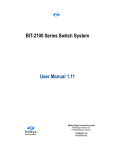
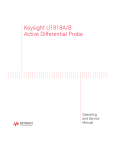
DisplayPort Getting Started Guide – V1.01
ValiFrame „Getting started“ DisplayPort
Installation
If this is the first installation on this PC ValiFrame needs some Prerequisites:
• Microsoft Windows XP SP 2 or later
• Agilent VISA IO Library 14.1 or higher
• Microsoft Excel 2003 or higher
• Microsoft .Net Framework Redistributable 2.0
The most of them can be found on the Installation CD except Windows and the Office
package from Microsoft.
If you already have installed a previous version of ValiFrame please uninstall it first.
Now execute the new installer.
Setup
Setup Guide – ParBERT 7G based config
First, you need to have all necessary equipment for the Display Port setup. Therefore, you
require the following hardware components.
• ParBERT System:
o VXI Frame
o 1 Slot-0-Commander (Firewire connector)
o 2 Clock modules
o 2 (3) 7G Generator modules or 1 7G and 1 3.4G Generator module
• 3 matched Pairs SMA Cables 1 m (6 cables)
• 5 additional SMA Cables
• 1 Shortcut
• 1 DP Fixture Plug, 1 DP Fixture Receptacle (BIT-DP-RTF-0001, see www.bitifeye.com)
• 1 Cable Emulator
• 1 Aux Channel Controller
• 81150A Pulse Function Arbitrary Generator
• For Calibration
o 1 DSO with E7232A
o 1 differential Probe Head N5380A
o 1 differential Probe 1169A
• Controller PC with LAN, USB and Firewire connectors
• Power cords for each instrument
• LAN switch or router
• 3 LAN Cables
• 6 Blocking Capacitors (11742A)
• 8x Adapter 2.4mm (m) to 3.5mm (f) (11901C)
1
DisplayPort Getting Started Guide – V1.01
Note: The equipment list shows basic requirements however you might need additional
accessories for testing, see the actual version of the DisplayPort config list.
Setup Guide – J-BERT based config
The J-BERT based configuration also requires a couple of items. The most important ones are
listed below!
• 1 N4903A J-BERT with ISI and Internal Jitter Sources option
• 3 matched Pairs SMA Cables 1 m (6 cables)
• 5 additional SMA Cables
• 1 DP Fixture Plug, 1 DP Fixture Receptacle (BIT-DP-RTF-0001, see www.bitifeye.com)
• 1 Cable Emulator
• 1 Aux Channel Controller
• For Calibration
o 1 DSO with E7232A
o 1 differential Probe Head N5380A
o 1 differential Probe 1169A
• Controller PC with LAN and Firewire connectors
• Power cords for each instrument
• LAN switch or router
• 3 LAN Cables
• 4 Blocking Capacitors (11742A)
• 2 power divider
• 4x Adapter 2.4mm (m) to 3.5mm (f) (11901C)
2
DisplayPort Getting Started Guide – V1.01
Setup Guide further details
Figure 1 Connection Setup for Display Port
Check if you have all necessary components available. Afterwards, connect all instruments to
a power source. Connect the RF output of the SG to the clock input of the ParBERT system
with one generator (left one in Figure 1) and the output of the 81150A to the Delay Control
3
DisplayPort Getting Started Guide – V1.01
Input of the ParBERT generator module of the left ParBERT system. Connect the differential
probe to the oscilloscope and the differential probe head to the differential probe.
Terminate the differential probe with a shortcut. The Blocking Capacitors have to be
connected to the ParBERT entries and the SMA cables to the Blocking Capacitors. Switch on
all instruments.
Note: The setup doesn’t show the required TTCs as well as the ISI traces required for
compliance testing.
Connect all instruments to the controller PC.
- The DSO, the SG and the 81150A have to be connected via LAN.
- The ParBERT has to be connected via Firewire.
- All LAN instruments need either a fixed IP address, or a DHCP server in the network.
First Setup
After the installation you will find two new icons on your desktop and in the start menu:
and “ValiFrame Station Configuration”
.
“ValiFrame”
The “ValiFrame Station Configuration” is necessary for setting up the instrument connection.
For DisplayPort, 3 different Station Settings are possible, one with a ParBERT 7G, one with a
ParBERT 7G/3.4G combination and one based on the N4903A J-BERT that is also
recommended.
Figure 3 Selection of the Station Setup
4
DisplayPort Getting Started Guide – V1.01
Figure 4 Station Configuration Dialog
After the installation, all instruments are configured in the “Offline” mode, which is a mode
where ValiFrame doesn’t connect to an instrument (see figure 4). This mode can be used for
demo purposes, but if you want to control a real instrument, you have to setup the
connection to this instrument. The most instruments are using a VISA connection except the
ParBERT (81200A) and the DisplayPort Test Controller. For the VISA connection, you have to
setup the instruments first with the VISA Connection Expert (Right click on the VISA icon
in the task bar, and then select first entry “Agilent Connection Expert”). After setting up the
instruments with the connection expert, you can get the right connection string for the
instrument from the VISA address field.
Select an instrument in the instrument list. The address will be shown in the instrument
address text field of the Configuration Dialog and can be edited there. The easiest way is to
copy and paste the connection string from the Connection Expert into the instrument
address field of the Station Configuration and hit the “Apply Address” button afterwards.
The setup of the ParBERT firmware connection is not done by VISA. ParBERT uses a TCPIP
socket connection. Here the address field contains the IP address of the host or the
hostname followed by a colon followed by the system name (i.e. “localhost:DSRA”). The
DisplayPort Test Controller also uses a socket connection and only requires the IP address.
After editing the address flag and removing the ‘Offline’ flag of the instrument, ValiFrame
will use the connection string for connecting to the instrument.
You can verify the instrument addresses as well as the proper connection by using the
“Check Connections!” button.
5
DisplayPort Getting Started Guide – V1.01
Registration
Figure 5 Registration dialog
If you start ValiFrame without a valid registration key, you will get a dialog like this.
ValiFrame can be used for 30 days without registration. You get the registration key by
sending a mail to [email protected] with the following information:
Customer Name: <company>
Certificate Number: XXXX-XXXX-XXXX-XXXX (from your purchased delivery of
ValiFrame)
Site code: <from the dialog above>
Machine ID (MID): <from the dialog above>
Within 3 working days after sending the mail to BitifEye, you will get the activation code,
which has to be filled in the dialog.
6
DisplayPort Getting Started Guide – V1.01
Use
Figure 6 ValiFrame GUI before configure
Start ValiFrame by double clicking on the ValiFrame icon on the desktop or selecting
Programs->BitifEye->ValiFrame in the start menu of Windows.
ValiFrame will connect to all instruments that are not in the Offline mode and is ready for
use, if all connections can be initialized successfully.
In the next step the DUT has to be configured by clicking on the “Configure DUT” button in
the upper tool bar (leftmost button). After that, a configure dialog will appear (Figure 7).
7
DisplayPort Getting Started Guide – V1.01
Figure 7 Display Port Product Configure Dialog
Fill out the product number, serial number and optionally other fields required for your
desired test mode and setup. This information will then be visible in the measurement
reports. If a data base is connected the product number and serial number are used to find
the DUT later in the database.
Note
In most cases you also will find a selection for Compliance and Expert Mode to set
the test mode. In Compliance Mode the tests will be run according to the test
specification. In the Expert Mode the DUT can be characterized. It is possible that
additional test procedures are visible in this mode and that also the tests itself will
work in another way.
Press the “Ok” button and then ValiFrame is ready to use.
8
DisplayPort Getting Started Guide – V1.01
Run Tests
Figure 8 Test Procedure Tree (section)
After the configuration of the DUT, you will see on the left side the test procedure tree
(Figure 8). It contains the list of test procedures grouped by the procedure type. In most
cases, you will have a group of tests for calibration and another one for tests. The calibration
tests are necessary to calibrate the station and they have to be executed before the other
tests are running. If you’ve run the calibration in the past, the results of the last calibration
will be used for doing the tests with the DUT. The other group contains the tests itself.
Figure 9 This illustrates the possibilities to select the tests. – (a) all tests selected – (b) only some of the tests
selected
For the DUT tests, you can select the complete group by clicking on the check box at the
complete group or by clicking on all single tests (Figure 9 (a)). But you can select each single
test on the other hand (Figure 9 (b)). A selected test will be indicated by a checked checkbox
in front of the name of the procedure.
Figure 10 Properties
9
DisplayPort Getting Started Guide – V1.01
If you selected the expert mode, there is also the freedom for the user to change some test
parameters. The available parameters can be seen in the properties tree on the right side of
the user interface (Figure 10) (if not, press the “Properties” button in the toolbar).
If you click on the name of a test procedure, the properties of this procedure will be
automatically shown in the properties tree. In the expert mode, you have also the
opportunity to change the values of the properties.
To run the selected tests, press the start button. The tests will be run in the order of the
tree. There may be still some manual interactions necessary by the user (i.e. change
connections) but this will be requested by dialogs, which pop up at the moment the test
requires the interaction. Many tests produce direct data output, which can be seen “online”
in a separately opened Excel Worksheet. Once the test is run this Excel Worksheet is closed,
but you can open it again by double-clicking on the test item.
Figure 11 Test Results
If the test succeeds, the test icon is a green smiley , if it fails it is a red smiley
test is aborted, there is a question mark in the icon .
and if the
Note
The test output can be opened again by double clicking on the procedure name: The
Excel will be opened again and you can store the result by Excel directly. If a
procedure was run more than once, after expanding the tree below of this
procedure, the results are visible as a list (Figure 9).
After all tests are run, a report can be generated and printed out by the print entry in the file
menu. You can also use the “Save as workbook” functionality to create an Excel worksheet
with multiple sheets, one for each test result as well a summary sheet and a instrument list.
You’ll find more detailed information about the system in the User Manual.
10