1
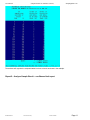
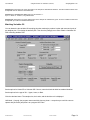
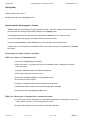
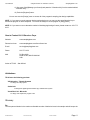
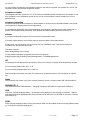
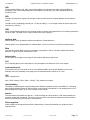
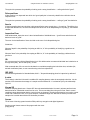
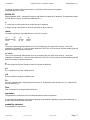
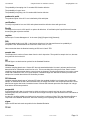
User Manual
Sample Planner for Attributes (TP105)
SamplingPlans.com
Sample Planner for Attributes (TP105)
User Manual
About TP105 -- Sample Planner for Attributes...............................................................2
What does TP105 do?.................................................................................... 2
Quick Start......................................................................................................2
Menu Bar........................................................................................................4
How to use TP105........................................................................................................... 6
Tab1 -- Application Description.....................................................................7
Tab2 -- Design a Sampling Plan.....................................................................8
Tab3 -- Make Tables of Performance Curves................................................ 9
Tab4 -- Make Graphs of Performance Curves............................................. 10
Tab5 -- Make Decision Rule Reports...........................................................11
Tab6 -- Make a Confidence Limit Analysis................................................. 12
Producing Output Reports............................................................................................. 13
Report3a -- Table of Performance Curves....................................................13
Report4a -- Graphs of performance curves.................................................. 15
Report4b -- Performance Graphs with the Excel Chart Wizard................... 16
Report4c -- Performance Graphs with Excel - Step by Step........................ 16
Report5a -- Fixed-n Decision Rule Report...................................................18
Report5b -- Tables of a Sequential Decision Rule....................................... 20
Report5c -- Graph of Sequential Decision Rules......................................... 22
Report5d -- Sequential Graphs with Chart Wizard...................................... 24
Report5e -- Sequential Graphs with Excel - Step by Step............................24
Report6 -- Analyze Sample Result -- confidence limit report...................... 25
Additional Information.................................................................................................. 26
The Producer's and Consumer's Points.........................................................26
Understanding the OC Curve....................................................................... 26
Possible Fractions Defective........................................................................ 27
How to account for the effect of Inspection Error........................................27
Matching Variables ISL............................................................................... 29
Terms and Symbols...................................................................................... 30
Assumptions and Limitations....................................................................... 31
Getting Help................................................................................................. 31
How to activate this program's license:....................................................... 31
How to Contact H & H Servicco Corp.........................................................33
Attributions:..................................................................................................33
Glossary.........................................................................................................................33
File: Manual02.doc
H & H Servicco Corp
Printed: 01/02/06
Page: 1
User Manual
Sample Planner for Attributes (TP105)
SamplingPlans.com
About TP105 -- Sample Planner for Attributes
What does TP105 do?
TP105 calculates and/or evaluates the sample size (n) and acceptance number (Ac) for acceptance sampling
plans for attribute data. The user specifies the sampling requirement by entering the Consumer's Point
and a Producer's Point of the desired oc curve.
Decision Rules:
TP105 performs the calculations for fixed-n and sequential decision rules.
Performance Curves:
TP105 evaluates the performance of Fixed-n and Sequential sampling plans with performance curves:
OC, ARL, AOQ, ASN, and AFI curves.
Example of Input:
Names that specify the project, process, and lot definition and disposition.
OC curve points like: Alpha=0.05, Beta=0.05, AQL=0.01, RQL=0.91.
(OC curve points can be input or output.)
Fixed-n decision rule like: n=98, Ac=4
(The decision rule can be input or output.)
Sample results to evaluate with confidence limits, like: n=98, X=4.
Examples of types of output reports:
Performance curve tables containing OC, ARL, AOQ, ASN, and AFI curves.
Performance graphs of OC, ARL, AOQ, ASN, and AFI curves..
Fixed-n decision rule report.
Sequential decision rule table.
Sequential decision rule graph.
Confidence limit report (one-sided and two-sided limits).
Quick Start
For the latest information about the most recent version, see the ReadMe.txt file that was distributed with TP105
V3
How to Install TP105 v3:
Save the Zip file. Extract the .EXE file from the Zip file. Double click the .EXE in Windows Explorer to start the
install wizard. Follow the instructions.
How to manage your license:
If the [Design] menu does not open then you will need to activate a license that you can obtain from H & H
Servicco Corp. Your license's current status is shown in the [Help] [About] menu.
How to Uninstall TP105 v3:
Click [Start][Settings][Control Panel][Add/Remove Programs] Uninstall TP105 3.0
How to Use TP105 v3 -- 8 usage tips:
Design a sampling plan
1) Start TP105. To start designing a sampling plan, select [Design] from the main menu. Then "Attribute
Binomial".
File: Manual02.doc
H & H Servicco Corp
Printed: 01/02/06
Page: 2
User Manual
Sample Planner for Attributes (TP105)
SamplingPlans.com
A window will open with six Tabs across the top. Select Tab "2=Design Plan". You will see that the program has
automatically added default input data -- for you to modify in order to design your own sampling plans.
Input your consumer's and producer's points (AQL, RQL, Alpha, Beta) or your decision rule (n, Ac). Push the
appropriate "Calculate" button.
Generate performance reports:
2) Make reports of the sampling plan performance curves from tabs 3 and 4. (OC, AOQ, ARL, ASN, AFI curves)
Generate fixed-n and sequential decision rules:
3) Make reports of the sampling plan decision-rules from tab 5. (Fixed-n, Sequential)
Generate a confidence limit report for a lot:
4) Enter values for sample data into tab 6 to make a confidence limit report. (one sided or two-sided limits)
Handling multiple reports on the screen
5) When you have multiple reports on screen, you can arrange them for easy examination:
[Window][Arrange].
(For simplicity, the right mouse button over a report will invoke the Window menu.)
6) Toggle any individual report between full size and normal size by double clicking on it.
File: Manual02.doc
H & H Servicco Corp
Printed: 01/02/06
Page: 3
User Manual
Sample Planner for Attributes (TP105)
SamplingPlans.com
7) For easier viewing, increase the viewing area to full screen by maximizing the overall program to full screen.
(Use/click the upper right "full screen" symbol on the title bar)
Save time with user-defaults
8) You can replace the startup default values such as Alpha, Beta, AQL, RQL with your own values by [Tools]
[Defaults]. Save.
Updates to TP105 v3 will be free.
The main unfinished tasks are:
1) Graphs are drawn with text characters -- to be replaced with line graphs or Excel charts.
2) The help file is not finished.
3) To add -- sampling plans for defects based on the poisson distribution.
How to get help or to inform us of problems or bugs:
Email -- [email protected]
Telephone -- 651-777-0152
Website -- www.samplingplans.com
Menu Bar
TP105 menu bar .
The File menu will print a copy of the report that has the focus to the default printer, copy it to the Windows
clipboard, or exit the program.
The edit menu will modify reports.
Cut will remove the selected area and store it on the Windows clipboard for further processing with other
software such as word processors.
File: Manual02.doc
H & H Servicco Corp
Printed: 01/02/06
Page: 4
User Manual
Sample Planner for Attributes (TP105)
SamplingPlans.com
Copy will copy the selected area to the Windows clipboard but will not remove it from the report.
Copy Columns: Use this option to transfer data to other software to make graphs/charts. It will copy selected
columns of data from performance tables and sequential decision tables to the Windows clipboard.
For further details, see the instructions on making use of the Excel chart wizard for performance graphs and
sequential decision graphs.
Delete will delete (remove) one or more report.
The View menu controls the menu bar and the status bar.
The Design menu is the main starting point to design a sampling plan. You typically choose the sub-menu:
"Attribute Binomial"
The feature -- "Attribute with Inspection Error" is explained here.
The feature -- "Match a Variables ISL Plan to the Existing Attribute Plan" is explained here.
The Tools menu provide control of user defaults.
The Document menu creates a new note document.
The Window menu controls the windows on the interface.
The "Show" option will display reports if they are hidden under the design form window.
The "Close" option remove all reports from the screen, or will remove the design form.
File: Manual02.doc
H & H Servicco Corp
Printed: 01/02/06
Page: 5
User Manual
Sample Planner for Attributes (TP105)
SamplingPlans.com
Right Click menu -- you can also invoke the Windows menu and sub-menus by right-clicking report or on the
design form.
The Help menu provides help in using TP105.
The Internet sub-menu of [Help]
The Right mouse button pop-up menu is the same as the Window menu. You can right click over any sampling
plan report window or over the design window.
File: Manual02.doc
H & H Servicco Corp
Printed: 01/02/06
Page: 6
User Manual
Sample Planner for Attributes (TP105)
SamplingPlans.com
How to use TP105
Tab1 -- Application Description
You start to design or analyze a sampling plan by bringing up the tabbed planning/design window. You do this by choosing
[Design] from the top menu.
The screen-shot below shows that the planning window contains six tabs across the top. Each tab gives you access to one
aspect of the planning process. You can develop a sampling plan by selecting the tabs in sequence: 1,2,3,4,5,6
The "Application" tab is currently shown.
On the "Application" tab you can identify the sampling plan that you are developing by naming the company,
product, item, and characteristic. This information does not have any effect on the decision rules that you will
make the program calculate, but it will be used to make the reports more meaningful.
You also can define what a lot is and specify what is to be done with a lot when it is accepted and when it is
rejected.
The program will add default data to the "Application" tab at startup, so you have the option to skip Tab1 until you
finish designing the sampling plan and are ready to refine the documentation for printing.
You can add and save your own default data in the menu [Tools][Defaults]. Then, whenever you open the design
window, the "Application" tab will be like the following:
File: Manual02.doc
H & H Servicco Corp
Printed: 01/02/06
Page: 7
User Manual
Sample Planner for Attributes (TP105)
SamplingPlans.com
This "Application" tab opened containing user defaults.
Tab2 -- Design a Sampling Plan
The "Design Plan" tab is where you design the sampling plan. This is where you relate the producer's point, the
consumer's point, and the fixed-n decision rule.
File: Manual02.doc
H & H Servicco Corp
Printed: 01/02/06
Page: 8
User Manual
Sample Planner for Attributes (TP105)
SamplingPlans.com
Sampling Plan Calculations:
Depending on what information you start with, you can perform three types of calculation with the "Design Plan" tab:
• You specify the two-points on the oc curve: AQL, Alpha, RQL and Beta.
Then calculate the decision rule: [Calculate n and Ac]
• You specify the fixed-n decision rule (n, Ac) and the AQL & RQL.
Then calculate the risks: [Calculate Alpha and Beta risks]
• You specify the fixed-n decision rule (n, Ac) and the Alpha & Beta risks.
Then calculate AQL & RQL: [Calculate AQL and RQL]
Additional information displayed:
• The "Design Plan" tab also displays the maximum fraction defective of the sample that allows
acceptance of the lot. (Ac/n)
• The "Design Plan" tab also displays the actual Alpha and Beta risks -- which may differ from your chosen
values due to the necessity to round n and Ac to whole numbers.
• The "Design Plan" tab also transfers its sampling plan to tabs 3,4, and 5.
Tab3 -- Make Tables of Performance Curves
This "Performance Tables" tab (Tab3) makes tables of performance curves for the sampling plan that you
designed on Tab2 . TP105 calculates and displays up to five kinds of performance curves in the performance
tables: OC, AOQ, ASN, ARL, and AFI.
File: Manual02.doc
H & H Servicco Corp
Printed: 01/02/06
Page: 9
User Manual
Sample Planner for Attributes (TP105)
SamplingPlans.com
The sampling plan itself is always displayed at the top of Tab3. (and Tab4, and Tab5).
To make a table with this Tab3, check the performance curves that you want to be in the table for the sampling
plan that you have designed. In addition to the OC curve, you may include the ASN , ARL , AOQ , AND AFI
curves.
Here is an example of the performance curve report.
Curves that require additional information or restrictions:
The AOQ curve reflects the results of rectification when you check "Rectify Rejected Lots" . For non-rectification
plans the AOQ table will show that AOQ=p'.
The AFI curve requires that you specify a finite lot size. The lot is the population, (N), from which the sample is to
be drawn.
Effects of decision rule type on the performance curves:
The sequential / fixed-n choice effects the ASN and AFI curves, but not the OC, ARL, or AOQ curve.
Tab4 -- Make Graphs of Performance Curves
The "Performance Graph" tab (Tab4) is where you make graphs of the performance curves.
File: Manual02.doc
H & H Servicco Corp
Printed: 01/02/06
Page: 10
User Manual
Sample Planner for Attributes (TP105)
SamplingPlans.com
Select a type of graph.
Choose one curve type at a time: OC, ASN , ARL , AOQ, or AFI.
Select whether the decision rule is sequential or fixed-n
Choose whether rejected lots are to be rectified
Enter the lot size.
Specify the limits of the Xaxis and Y-axis.
Maximum Y-axis (the performance measure)
Minimum and maximum fraction defective (p')
Step size of p' along the Xaxis.
Recommended: for most cases, the program default limits scale the graph well.
Tab5 -- Make Decision Rule Reports
This "Decision Rule" tab is where you make the decision rule reports. The fixed-n and sequential plans have matched oc
curves -- that is, both have the same producer's and consumer's points.
File: Manual02.doc
H & H Servicco Corp
Printed: 01/02/06
Page: 11
User Manual
Sample Planner for Attributes (TP105)
SamplingPlans.com
Make a fixed-n sampling plan report.
The fixed-n decision rule consists of a sample size, n, and acceptance number, Ac.
You can include the slope, intercepts, and other properties of the sequential plan that matches the oc curve of the
fixed-n plan by checking "Include Extra Statistical Details." For this example, compare the matched fixed-n and
sequential plans by comparint the n=98 of the fixed plan to the sequential's:
Minimum n to Reject = 2
Minimum n to Accept = 40
Maximum ASN = 76
Truncate a sequential sampling plan report.
The sample size of sequential plans do not have a maximum -- even though random sampling variability causes
the plans to always stop and accept or reject. The program offers three ways to truncate a plan.
• Truncate n at 3 times the maximum of the average sample number (ASN) curve.
• Truncate n at 1.2 time fixed-n
• Manually enter the truncation n.
Make a table of the sequential decision rule.
The program can organize the table by sample number or defect number.
Make a graph of the sequential decision rule.
The program calculates the maximum Y-axis and Xaxis, but you can change them manually
Tab6 -- Make a Confidence Limit Analysis
Tab6 is wher you analyze a sample result to make a confidence statement.
File: Manual02.doc
H & H Servicco Corp
Printed: 01/02/06
Page: 12
User Manual
Sample Planner for Attributes (TP105)
SamplingPlans.com
• Enter the sample data: n and X
• Choose the type of confidence limit(s): one sided (upper or lower) or two sided.
• Choose the confidence coefficient. (percent confidence)
File: Manual02.doc
H & H Servicco Corp
Printed: 01/02/06
Page: 13
User Manual
Sample Planner for Attributes (TP105)
SamplingPlans.com
Producing Output Reports
Report3a -- Table of Performance Curves
The "Performance Table" report shows the effect of the true lot fraction defective (p') on the five performance
characteristics curves: OC, AOQ , ASN , ARL , AFI .
File: Manual02.doc
H & H Servicco Corp
Printed: 01/02/06
Page: 14
User Manual
Sample Planner for Attributes (TP105)
SamplingPlans.com
The stepping variable always appears as the leftmost column -- in this case p'
The AOQL can be observed as the maximum of the AOQ curve. In this case, AOQL=0.02604 fraction defective.
Below the curves is an explanation of the assumptions and relationships that are affecting the performance
characteristic curves.
The footer of the report documents the program version and run date.
Report4a -- Graphs of performance curves
Tab4 enables you to view, print, or save text graphs of the OC , AOQ , ASN , ARL , AFI curves.
File: Manual02.doc
H & H Servicco Corp
Printed: 01/02/06
Page: 15
User Manual
Sample Planner for Attributes (TP105)
SamplingPlans.com
Here is more information about how this graph was made: graphs of performance curves.
You can make a better looking graph by selecting the rows of a performance table that contains p', Pa, etc.
columns. Then [Edit][Copy columns] to the Windows clipboard and paste them in to a graphic program. Most
spreadsheet programs do can make graphs, like MS Excel, or the spreadsheet in Open Office, etc. Their Chart
wizards enable you to tailor-make graphs:
Report4b -- Performance Graphs with the Excel Chart Wizard
If you have Microsoft Excel or equivalent, you can copy a performance table into an Excel spreadsheet and use
Excel's chart wizard to make a graph containing one or more curves.
See the step by step details:
Report4c -- Performance Graphs with Excel - Step by Step
These steps will produce a performance curve graph using TP105 and the Excel chart wizard.
Produce the curve with TP105:
Make a performance table containing the desired columns.
Example: Use the program default sampling plan: n=98, c=4.
On tab3 of TP105, select an OC curve, p' stepping, default Maximum p', Minimum p', and step size.
File: Manual02.doc
H & H Servicco Corp
Printed: 01/02/06
Page: 16
User Manual
Sample Planner for Attributes (TP105)
SamplingPlans.com
Make the table with TP105. (Not the graph.)
Transfer the table to Excel:
With the mouse cursor, select the rows of the table that contain curves in columns.
On the TP105 menu select: [Edit][Copy Columns]
In an empty Excel sheet, select the sheet by clicking on the square where the row headings and the column
headings join.
On the Excel menu select: [edit][paste] or control-V
Create an OC graph with Chart Wizard:
Select the data.
example A1:B20
Select the chart wizard from the tool bar.
Step 1 of Chart Wizard:
Select: Chart Type: XY(Scatter)
Select: Chart sub-type:
"Scatter with data point connected by smoothed Lines without markers"
Note: For sequential decision charts, you would use chart sub-type: "Scatter with data points connected by
lines without markers."
[Next>]
File: Manual02.doc
H & H Servicco Corp
Printed: 01/02/06
Page: 17
User Manual
Sample Planner for Attributes (TP105)
SamplingPlans.com
Step 2 of Chart Wizard:
Option series in columns (default) [Next>]
Step 3 of Chart Wizard:
Chart Title Tab:
example: "OC-Curve for: n=98, C=4"
Value (X) axis:
example: True Lot Fraction Defective (p')
Value (Y) axis:
example: Probability of Acceptance (Pa)
Gridlines Tab
Example: Value (X) axis: check "Minor Gridlines"
Example: Value (Y) axis: check "Minor Gridlines"
Legend Tab
uncheck "Show legend" (Unless you are plotting more than one curve."
[Next>]
Step 4 of Chart Wizard:
Place Chart
example: "As object in sheet"
[Finish] View the chart. It should look pretty good.
Refinement - change the scale of the Pa axis of the chart:
The Pa axis is 0 to 1.2. Change it to 0 to 1.0.
Select the Pa axis.
Right-click, select "Format Axis", Scale Tab.
Change Maximum from 1.2 to 1.0.
Change Major unit from 0.2 to 0.1
Change Minor unit from 0.04 to 0.05
Refinement - change the scale of the p' axis of the chart:
The p' axis has increments of 0.02. Change them to 0.01.
Select the p' axis.
Right-click, select "Format Axis", Scale Tab.
Change Major unit from 0.02 to 0.01
Change Minor unit from 0.004 to 0.005
Refinement - change the the backgroound color of the chart.
Select Plot Area, Right-click, Format Plot Area.
example:
Border: Select "None"
Area color: select white.
Use the mouse to change the width and height of the chart to your liking. The chart should look like this.
File: Manual02.doc
H & H Servicco Corp
Printed: 01/02/06
Page: 18
User Manual
Sample Planner for Attributes (TP105)
SamplingPlans.com
Report5a -- Fixed-n Decision Rule Report
This fixed-n decision rule report was made from the tab "5=Decision Rule".
The decision rule matches those of standards Mil-Std-105 and ANSI/ASQ Z1.4.
This report completely documents the sampling plan: the producer's point and the consumer's point, the fixed-n
decision rule, the date that it was designed, and the software used and its version number.
If you check "Include Extra Statistical Details" on tab "5=Decision Rule" the report would also display properties
of the sequential plan whose oc curve matches this fixed-n plan.
File: Manual02.doc
H & H Servicco Corp
Printed: 01/02/06
Page: 19
User Manual
Sample Planner for Attributes (TP105)
SamplingPlans.com
The slope and intersept of the lines of the sequential chart match with those in the standard ISO 8422.
Report5b -- Tables of a Sequential Decision Rule
From the "5=Decision Rules" tab you have the option of organizing tables of a sequential decision rule in two
ways. The two kinds of table are equivalent -- they are just organized differently.
The ntable is appropriate for most applications. The first two columns are the beginning and end of groups of
sample numbers: n - as you take them sequentially.
File: Manual02.doc
H & H Servicco Corp
Printed: 01/02/06
Page: 20
User Manual
Sample Planner for Attributes (TP105)
SamplingPlans.com
In the Xtable below, the first column is X, the number of defectives in the sample so far.
File: Manual02.doc
H & H Servicco Corp
Printed: 01/02/06
Page: 21
User Manual
Sample Planner for Attributes (TP105)
SamplingPlans.com
Report5c -- Graph of Sequential Decision Rules
From the tab "5=Decision Rules" you can make graphs of sequential decision rules.
File: Manual02.doc
H & H Servicco Corp
Printed: 01/02/06
Page: 22
User Manual
File: Manual02.doc
Sample Planner for Attributes (TP105)
H & H Servicco Corp
Printed: 01/02/06
SamplingPlans.com
Page: 23
User Manual
Sample Planner for Attributes (TP105)
SamplingPlans.com
You can make a better looking graph by selecting the rows of an ntable that contain just the columns of data.
Then [Edit][Copy columns] to the Windows clipboard and paste them in to a graphic program. Most spreadsheet
programs can make graphs, like MS Excel, or the spreadsheet in Open Office, etc. Their Chart wizards enable
you to tailor-make graphs:
Report5d -- Sequential Graphs with Chart Wizard
This sequential decision chart was made by exporting columns to Excel. Then using the Excel chart wizard.
Report5e -- Sequential Graphs with Excel - Step by Step
File: Manual02.doc
H & H Servicco Corp
Printed: 01/02/06
Page: 24
User Manual
Sample Planner for Attributes (TP105)
SamplingPlans.com
The software will organize the sequential table into three columns as shown in the example.
Report6 -- Analyze Sample Result -- confidence limit report
File: Manual02.doc
H & H Servicco Corp
Printed: 01/02/06
Page: 25
User Manual
File: Manual02.doc
Sample Planner for Attributes (TP105)
H & H Servicco Corp
Printed: 01/02/06
SamplingPlans.com
Page: 26
User Manual
Sample Planner for Attributes (TP105)
SamplingPlans.com
Additional Information
The Producer's and Consumer's Points.
The producer's and consumer's points on an oc curve are:
Producer's point: ( AQL, Alpha)
The producers point protects against rejecting good ( p' = AQL) lots.
Consumer's point: ( RQL, Beta)
The consumer's point protects against accepting off-grade ( p' = RQL) lots.
TP105 calculates from tab3 and tab4 all the points on the (one and only) oc curve that goes through those two
points.
TP105 calculates from tab2 the (one and only) fixed-n decision rule that has its oc curve going through those two
points.
Understanding the OC Curve
Using the OC Curve -- Plot of Pa versus p'
This oc curve describes the performance of a decision rule. For this example, the decision rule is n=98, Ac=4.
This example decision rule (n=98, Ac=4) was designed by specifying two points of the oc curve (four numbers)
on the Design tab:
Producer's point: AQL=0.02, Alpha=0.05
Consumer's point: RQL=0.091, Beta=0.05
Every decision rule ( n , Ac ) has its own oc curve which describes the sampling plan's probability of accepting
lots having various fractions defective.
File: Manual02.doc
H & H Servicco Corp
Printed: 01/02/06
Page: 27
User Manual
Sample Planner for Attributes (TP105)
SamplingPlans.com
Possible Fractions Defective
TP105 does not use lot size to relate AQL and RQL to n and Ac. So it can not automatically make AQL or RQL
to any specific value of lot p'. For example, with lot containing N items, the possible fractions defective are:
p': 0, 1/N, 2/N, 3/N ....
Specifically, if N=100, the possible numbers of defective items are:
defectives = 0, 1, 2, 3 ...
So the true values of p' are limited to:
p' = 0/N = 0.00, 1/N = 0.01, 2/N = 0.02, 3/N = 0.03 ...
Consequently, it is possible to specify AQL and RQl that cannot be attained exactly.
How to account for the effect of Inspection Error
To account for inspection error, open the [Design] window with "Attribute Binomial with Inspection Error".
On Tab2 the program can adjust the sample size and acceptance number for inspection error.
On Tab6 the program can adjust confidence limits for inspection error. See later of this page.
On Tab2:
You have to check the checkbox: "Make allowance for inspection error" to make the rest of the inspection error
area appear.
(1) Definitions
(1a) False positives = "good" items that are incorrectly classified as defective.
a =fraction false positives = probability that a "good" item will be classified as defective.
(1b) False negatives = defective items that are incorrectly classified as good.
b =fraction false "goods" = the probability that a defective item will be classified as "good"
(2) The relative magnitude of the effects of a and b:
(2a) The effect of a
There are usually so many good items in the first place that a high percentage of them mis-classified as defective has a
large effect.
(2b) The effect of b
File: Manual02.doc
H & H Servicco Corp
Printed: 01/02/06
Page: 28
User Manual
Sample Planner for Attributes (TP105)
SamplingPlans.com
There are usually so few defectives in the first place that a high percentage of them mis-classified as good doesn't have as
large an effect.
(3) Example of manual calculations (the program does this.)
(3a) Example of the effect of a=0.1 when b=0.
(10% of goods are classified as bad.)
a=0.1
p'=0.02 true fraction defective.
1.0-p' = 1.0-0.02 =0.98 true fraction good
0.1 X 0.98 = 0.098 fraction that are mis-classified as bad.
Apparent p' = 0.02 + 0.098 = 0.118 (a relatively large effect)
(3b)Example of the effect of b=0.1 when a=0.
(10% of defectives are classified as good.)
b=.1
p'=0.02 true fraction defective.
0.1 X 0.02 = 0.002 fraction that are mis-classified as good.
apparent p' = 0.02 - 0.002 = 0.018 (a relatively small effect)
(4) The need to compensate for the effect of inspection error on the OC curve.
When n=constant, increasing a moves the oc curve to the left.
That is, the false positives make the sample appear to have more defectives than it actually does. So the additional apparent
defectives make it less likely to accept a lot. The program compensates for this when you calculate the n and Ac with
inspection error.
When n=constant, increasing b moves the oc curve to the right.
That is, the false "good" items make the sample appear to have fewer defectives than it actually does. So the fewer apparent
defectives make it more likely to accept a lot. The program compensates for this when you calculate the n and Ac with
inspection error.
(5) Effects of a & b on confidence limits:
You can account for inspection error in Tab6 -- which will cause an adjustment to the sample confidence limits so that they
reflect the fraction of items that are truly defective.
On Tab6:
You have to check the checkbox: "Make allowance for inspection error" to make the rest of the inspection error
area appear.
Increasing "a" decreases p'L, Pbar, p'U. They can become negative.
If p'L <0 reduce the confidence coefficient: CC . If Pbar < 0 , beyond detection.
File: Manual02.doc
H & H Servicco Corp
Printed: 01/02/06
Page: 29
User Manual
Sample Planner for Attributes (TP105)
SamplingPlans.com
Increasing a means that more of the good items in the sample are classified as defective. Thus the confidence limits must
be adjusted down to reflect the fewer defectives.
Increasing "b" increases p'L, Pbar, p'U. They can become > 1.
If p'U >1 reduce cc. If Pbar>1 , beyond detection.
Increasing b means that more of the defective item in the sample are classified as "good". Thus the confidence limits must
be adjusted up to reflect the additional defectives.
Matching Variables ISL
You can determine the variables ISL sampling plan that matches the producer's point and consumer's point of
any attribute plan. First design the attribute plan. Then from the [Design] menu select "Match a Variables ISL
Plan to Existing Attribute Plan"
Set the options for Known SD or Unknown SD. If known, enter the historical within-lot standard deviation.
Set the options for the type of ISL -- Upper, Lower, or Both.
Click the calculate button. The sample size, the k-value, and the decision rule is displayed.
Unfinished - Currently, the program cannot send this plan to a printer -- except that you could do a screen
capture with [Alt-PrtScr] and paste it to a program like "Paint".
File: Manual02.doc
H & H Servicco Corp
Printed: 01/02/06
Page: 30
User Manual
Sample Planner for Attributes (TP105)
SamplingPlans.com
Terms and Symbols
Nomenclature
Acceptance Sampling Terms and Symbols used by TP105
SYMBOL
NAME
Pa
probability of acceptance of a lot.
p'
fraction defective of a lot.
AQL
Acceptable Quality Level.
RQL
Rejectable Quality Level.
Alpha
risk of rejecting a lot if p'=AQL.
Beta
risk of accepting a lot if p'=RQL.
n
Sample Size
Exact-n
Sample Size before rounding to whole
number
N
Lot Size
Ac
Acceptance Number, Same as C
C
Acceptance number, same as Ac
X
The number of defective items in a
sample.
Assumptions and Limitations
Range of Input variables
RQL: 0.000001 to 0.999999 (decimal fractions)
Beta: 0.000001 to 0.999999 (decimal fractions)
For Ac>0 option. Ac: 0 to 700
Binomial Distribution
TP105 calculates the sample size using the binomial distribution. The binomial does not use the lot size in
calculating n. As such, the binomial is an approximation to the true distribution, the hypergeometric. It is a very
accurate approximation and is commonly used when small samples are taken from large lots. As a Rule of
Thumb, the binomial distribution is very accurate when N / n =>10. That is, when the lot is 10 times larger than
the sample.
File: Manual02.doc
H & H Servicco Corp
Printed: 01/02/06
Page: 31
User Manual
Sample Planner for Attributes (TP105)
SamplingPlans.com
Getting Help
Context sensitive help: help F1
Sampling plan help: www.samplingplans.com
How to activate this program's license:
TP105 will startup by presenting a form with drop-down menus -- much like a word processor would. All of
the menus will work except for the possible exception of the [Design] menu.
If the [Design] menu does not open then you need to obtain a license from H & H Servicco Corp.
If you have purchased the program you need to obtain a permanent license.
If you have a beta version or a trial version then you need to obtain a time-limited license.
In either case, you must send us an "Installation Code". Then we will send you a "Liberation Key" to activate
the license.
The procedure to activate a license is as follows:
STEP 1 of 2 - Send us an "Installation Code":
1) Use menu: [Help][Manage your license]
2) Enter your name. As you type your name, an "Installation Code" will display in the textbox
below your name.
3) Copy the "Installation Code" to the Windows clipboard.
4) Push the [Close] button to close the form.
5) Use menu: [Help][Internet][Email - to samplingplans.com]
This will start your email program.
6) Paste the "Installation Code" into the message area of the email.
7) Add the title "Send Liberation Key" and add any appropriate message.
8) Send the email to [email protected].
STEP 2 of 2 - We send you a "Liberation Key" to activate the license.
9) You will receive back a "Liberation Key". We prepare the liberation key manually, so if you are in
a hurry, phone us at 651-777-0152 to expedite the service.
10) Copy the liberation key from our email to the Windows clipboard.
File: Manual02.doc
H & H Servicco Corp
Printed: 01/02/06
Page: 32
User Manual
Sample Planner for Attributes (TP105)
SamplingPlans.com
11) Use menu [Help][Manage your license] and paste the "Liberation Key" into the textbox labeled
"Liberation Key".
12) Push the [Register] button.
You can now use the [Design] menu to access all of the program's sampling plan design capabilities.
NOTE 1 - If you want to use the program both at work and at home, you may use the same liberation key to
activate the program on both computers. You name will always be on the program in [Help] [About]
NOTE 2 - If you want to use an alternative method of obtaining/registering a license, please contact us. 651-7770152
How to Contact H & H Servicco Corp.
Website:
www.samplingplans.com
Discussion forum:
www.samplingplans.com/forum/forum.htm
E-mail
[email protected]
Phone:
651-777-0152
Mail:
PO Box 9340
North St Paul, MN 55109-0340
USA
Author of TP105: Stan Hilliard
Attributions:
TP105 uses the following products:
VB Helpwriter - Teletech Systems
To design this Help system.
ActiveLock
To design the digital signature based copy authentication system
Visual Basic V6 - Microsoft
To design and compile the program code.
Glossary
Ac
The Acceptance Number is the maximum allowable number of defective items in the sample and still accept the
File: Manual02.doc
H & H Servicco Corp
Printed: 01/02/06
Page: 33
User Manual
Sample Planner for Attributes (TP105)
SamplingPlans.com
lot. If the number of defectives in the sample exceeds Ac, then the lot is rejected. The symbols "Ac" and "C" are
commonly used to represent the acceptance number..
acceptance number
The acceptance number, symbol=Ac,or C, is the maximum allowable number of defectives in the sample for a lot
to be accepted. For the acceptance number of zero, the lot is rejected when a sample contains one or more
defective items.
acceptance sampling
Acceptance sampling has as its purpose to decide whether to accept or reject a population based on the results
of the inspection of samples taken from that population.
In manufacturing applications of acceptance sampling, the population is typically incoming raw material lots, inprocess sublots, and finished product lots. Other areas involve administrative processes, inventory, etc.
activate
If you have purchased the program you need to activate a permanent license.
If you have a beta version or a trial version then you need to activate a time-limited license.
In either case, you must send us (H & H Servicco Corp) an "Installation Code". Then we will send you a
"Liberation Key" that activates the license.
To activate a license:
Menu: [Help] [Manage Your License]
For see detailed instructions in activating a license for this program:
[Help] [Program Help] [Contents] [License Management] LicenseManagement.txt
AFI
AFI (Average Fraction Inspected) is the fraction of items out of a series of lots that will be inspected by the plan.
For non-rectifying fixed-n plans, AFI = n / N
For non-rectifying sequential plans, AFI = ASN / N
Plans that rectify rejected lots can make AFI increase as p' increases because of 100% inspection of rejected
lots.
Alpha
The Producer's Risk, Alpha. is the risk of rejecting a good lot, that is, a lot that contains AQL fraction defective.
ANSI/ASQ Z1.4
This is the current AQL based standard -- "Sampling Procedures and Tables for Inspection by Attributes".
AOQ
AOQ is the Average Outgoing Quality -- the average fraction defective of lots outgoing to customers . Useful to
evaluate sampling plan applications that rectify rejected lots.The AOQ-Curve is the AOQ as a function of various
fixed values of p'.
AOQL
AOQL (Average Outgoing Quality Limit) is the maximum AOQ over all possible values of incoming product quality
(p'), for a given acceptance sampling plan.
File: Manual02.doc
H & H Servicco Corp
Printed: 01/02/06
Page: 34
User Manual
Sample Planner for Attributes (TP105)
SamplingPlans.com
AQL
The Acceptable Quality Level, AQL, is the fraction defective of a lot that would have a high probability of
acceptance. AQL is often associated with 0.95 probability of acceptance ( Pa). AQL and Alpha define the
Producer's Point.
ARL
The ARL (Average Run Length) is the average number of lots that will be accepted between until a rejection
occurs.
The ARL curve of a sampling plan tells you -- for any lot quality, p' -- the average number of lots accepted until
until there is a rejection.
ASN
ASN ( Average Sample Number) is the average number of sample units inspected per lot in reaching decisions to
accept or reject. The ASN curve is a plot of ASN versus true lot quality, p'.
attribute data
Attribute data is go/no-go data like defective/nondefective, broken/whole etc.
Attribute data is to be distinguished from variables data -- which is in the form of numerical measurements.
Beta
The Consumer's Risk, Beta, is the risk of accepting a rejectable lot, that is, a lot that contains RQL fraction
defective. A typical value for the Beta risk is 0.05.
beta version
A beta version of a program is for testing of some feature and has a timed license.
C=0
A C=0 sampling plan is one in which the lot is only accepted if zero defectives occur in the sample.
consumer's point
The Consumer's Point is the point on the oc curve defined by RQL on the X-axis and Beta on the Y-axis.
Example: beta=0.05 probability of accepting a lot if its fraction defective is RQL=0.10. (10%)
Cpk
Cpk is a quality index.
Cpk = (UISL- Xbar)/(3* SD) or (Xbar - LISL)/(3 * SD), whichever is smaller.
discriminating
The ability of a sampling plan to discriminate (tell the difference) between an AQL lot and RQL lot. A sampling
plan can discriminate well when its AQL and RQL are sufficiently close together. If one sampling plan is more
discriminating than another, its oc curve is steeper (more verticle).
exact-n
The exact sample size shows the value of n -- before rounding to a whole number -- that exactly satisfies the
consumer's point that you entered. The exact n can be useful to know when the sample size is small and the
direction of rounding can have economic consequences.
False negatives
A false negative is an inspected item which is defective but is incorrectly classified as a good item due to
inspection error.
File: Manual02.doc
H & H Servicco Corp
Printed: 01/02/06
Page: 35
User Manual
Sample Planner for Attributes (TP105)
SamplingPlans.com
The symbol b represents the probability of making such a wrong classification. -- calling a defective "good".
False positives
A false positive is an inspected item which is of good quality but is incorrectly classified as a defective due to
inspection error.
The symbol a represents the probability of making such a wrong classification. -- calling a "good" item defective.
fixed-n
A fixed-n sampling plan has a decision rule that specifies the same sample size, n, for each lot. This differs from
a sequential decision rule, for which the sample size varies from lot to lotdepending on lot qualtiy, p', and random
variation..
Inspection Error
With attribute data, inspection error is the misclassification of individual items -- "good" items as defective and
defective items as "good".
The error of misclassification of items is similar to the error of mis-dispositioning lots:
Similarities:
Whereas "alpha" is the probability of rejecting an AQL lot, "a" is the probability of classifying a good item as
defective.
Whereas "beta" is the probability of accepting an RQL lot, "b" is the probability of classifying a defective as a
good item.
ISL
ISL is an acronym for Individual Specification Limit. ISLs defines when a measured individual item is defective on
the high side (UISL), the low side (LISL), of both.
With measured data, ISLs are used to calculate the a variables sampling plan's decision rules, calculate Cpk,
and with rectification plans, to sort nonconforming units from rejected lots.
ISO 8422
International Organization for Standardization, 8422 -- "Sequential sampling plans for inspection by attributes"
k-value
The k-value is a decision limit used in variables ISL sampling plans to make the accept/reject decision. k is the
number of SD s between the average of a sample and the nearest ISL. k is related to Cpk by the relationship
Cpk=k/3.
Known SD
Variables sampling plans have a "known SD" when the standard deviation is known in advance and has been
determined to be in statistical control from lot to lot. This as concluded from using an S Chart. Past in-control
conditions cannot demonstrate that the current lot has not changed. Therefore good practice is to test the current
lot SD with a statistical F-test, or for small samples, a statistical range test. With the SD Known procedure the
sample size is smaller than with the SD Unknown procedure.
license
TP105 uses a licensing system based on RSA public key encryption and digital signatures.
See the current license status of this program with the menu:
[Help] [About]
File: Manual02.doc
H & H Servicco Corp
Printed: 01/02/06
Page: 36
User Manual
Sample Planner for Attributes (TP105)
SamplingPlans.com
To change the status of the current license or to activate a new license for this program:
[Help] [Manage your License]
Mil-Std-105
Military Standard 105E -- "Sampling Procedures and Tables for Inspection by Attributes". This standard is based
on AQL. Now out of print, it replaced by ANSI/ASQ Z1.4.
n
n: Lower case n is the symbol for the sample size to be inspected.
N: Upper case N is the symbol for the lot size (Number of items in the lot.)
ntable
The ntable organizes a sequential decision rule into four columns.
(1)
(2)
Sample Size (n)
From
To
(3)
Accept
on Ac
(4)
Reject
on Re
OC
The oc curve (Operating Characteristic Curve) of a sampling plan is a graph of Pa versus p', where Pa =
probability of acceptance, p' = true lot fraction defective of a lot. The oc curve tells you how the sampling plan will
perform in making accept/reject decisions.
oc curve
The oc curve (Operating Characteristic Curve) of a sampling plan is a graph of Pa versus p', where Pa =
probability of acceptance, p' = true lot fraction defective of a lot. The oc curve tells you how the sampling plan will
perform in making accept/reject decisions.
p'
p' is the symbol for the (true) fraction of items in a lot that are defective.
p'L
p'L is a symbol for the lower confidence limit.
p'U
p'U is a symbol for the upper confidence limit.
Pa
Pa is the probability that a sampling plan will accept a lot. Pa depends on the decision rule (n, C) and the lot's
fraction defective.( p').
Pbar
Pbar is a symbol for the sample fraction defective.
population
The population is the decision-unit from which samples are taken for inspection.
In manufacturing applications of acceptance sampling, the population is typically incoming raw material lots, inprocess sublots, and finished product lots.
probability statement
The probability of a type II error:
File: Manual02.doc
H & H Servicco Corp
Printed: 01/02/06
Page: 37
User Manual
Sample Planner for Attributes (TP105)
SamplingPlans.com
The probability of accepting a lot if it contains RQL fraction defective
The probability of a type I error:
The probability of rejecting a lot if it contains AQL fraction defective.
producer's point
The producers point of the OC Curve is defined by AQL and Alpha.
rectification
To rectify a rejected lot is to sort 100% and replace/rework the defective items with good ones.
Rectify
To rectify a lot is to sort it 100% and fix or replace all defectives. A "rectification plan" specifies that all lots that
the sampling plan rejects be rectified.
register
See the topic "License Management" in the menu [Help] [Program Help] [Contents]
RQL
The Rejectable Quality Level, RQL, is the fraction defective of a lot that would have a low probability of
acceptance. RQL and Beta define the consumer's Point of the oc curve.
Other names that have the identical meaning as RQL are LQ and LTPD.
sample size
The sample size is number of items drawn from the lot for inspection. The symbol for sample size is n, whereas
the symbol for the lot size is N.
SD
SD and Sigma are both used as symbols for the Standard Deviation.
SD Known
Variables sampling plans have a "known SD" when the standard deviation is known in advance and has been
determined to be in statistical control from lot to lot. This as concluded from using an S Chart. Past in-control
conditions cannot demonstrate that the current lot has not changed. Therefore good practice is to test the current
lot SD with a statistical F-test, or for small samples, a statistical range test. With the SD Known procedure the
sample size is smaller than with the SD Unknown procedure.
SD Unknown
Variables sampling plans have an "unknown SD" when the standard deviation is not known prior to taking the
sample. An estimate of the SD is then calculated from the sample and used in the accept/reject decision. These
plans do not require that lots be in statistical control. With the SD Unknown procedure the sample size is larger
than with the SD Known procedure.
sequential
A sequential sampling plan is a technique by which we build up our sample one item at a time, and after
inspecting each item, ask ourselves: "Can we be sure enough to accept or reject this batch on the information so
far collected?"
Its value is in enabling reliable conclusions to be wrung from a minimum of data. This was deemed sufficient to
require that it be classified "Restricted " within the meaning of the Espionage Act during the war of 1939-45.
sigma
Sigma and SD are both used as symbols for the Standard Deviation.
TP105
File: Manual02.doc
H & H Servicco Corp
Printed: 01/02/06
Page: 38
User Manual
Sample Planner for Attributes (TP105)
SamplingPlans.com
TP105 is the short name of this software program: "Sample Planner for Attributes"
TP105 allows input of both consumer's point and producer's point, or (n, Ac) to calculate the Alpha and Beta risk,
or to calculate AQL and RQL.
TP105 also calculates, in addition to the complete OC curve, the AOQ, ARL, ASN, and AFI curves.
TP105 also calculates, for any (n,Ac), the matched sequential sampling plan. Or, from two points on the oc
curve, both fixed-n and sequential sampling plans.
trial version
A trial version of the program is a means for a potential user to evaluate its sutibility for his/her application. A trial
version is a full version but has a timed license.
Unknown SD
Variables sampling plans have an "unknown SD" when the standard deviation is not known prior to taking the
sample. An estimate of the SD is then calculated from the sample and used in the accept/reject decision. These
plans do not require that lots be in statistical control. With the SD Unknown procedure the sample size is larger
than with the SD Known procedure.
variables ISL sampling plan
A variables sampling plan uses a decision rule calculated from numerical measurements of items in a sample.
An ISL variables sampling plan has specifications that define the conformance of the individual items.
X
X is a symbol for the actual number of defectives in a sample. You would reject a lot if X is greater than Ac, and
accept the lot if X is equal to or less than Ac.
Xtable
The Xtable organizes a sequential decision rule into three columns.
Number of
Defectives
Reject if Accept if
n <= Rn n >= An
[Design] menu
The [Design] menu opens the window where you to design sampling plans.
File: Manual02.doc
H & H Servicco Corp
Printed: 01/02/06
Page: 39
User Manual
File: Manual02.doc
Sample Planner for Attributes (TP105)
H & H Servicco Corp
Printed: 01/02/06
SamplingPlans.com
Page: 40