1
Vi-Cell XR Cell Viability Analyzer
User Instructions
Written by CMCresson 15-Feb-06
The Vi-Cell XR Cell Viability Analyzer is a video imaging system used to analyze yeast, insect
and mammalian cells. It automates the trypan blue exclusion protocol, in which dead cells take
up the dye while live cells do not, and provides data on percent viability and cell counts.
Essentially, the Vi-Cell system is an automated hemocytometer unlike the multisizer, which was
simply a particle counter. The Vi-Cell takes up the sample and delivers it to a flow cell and
camera for imaging where differences in the grey scale between live and dead cells is determined
by the software. For every sample you run, the instrument requires 500 µL of sample volume,
which is mixed 1:1 with trypan blue, and takes 50 images to determine the cell concentration and
viability. All of this data is output on the computer screen and can also be sent to a printer or
excel spreadsheet for further analysis.
System Specs
Cell Diameter Range = 3 to 70 µm
Cell Concentration Range = 5 x 10⁴ to 1 x 10⁷ cells/mL
Viability Range = 0% - 100%
Counting Accuracy = ±6%
Sample Volume = 0.5 mL to 2.0 mL
Acquisition Time = 2 minutes
Getting Started with the Vi-Cell
Everyone who will be using the Vi-Cell system must be trained by the system administrator. In
addition, everyone will be given a user account and password to log on to the instrument.
There will be a main system log in which user activity will be recorded. So, if you allow
someone else to use your account, then you will be the responsibility party in the use log if
something happens to the instrument. UROPs will not be given user accounts and will be the
responsibility of their lab advisor.
The Vi-Cell system default cell type may work for some cell lines in the lab and it is really the
best place to start. However, since trypan blue uptake, cell size, and appearance are unique to
each cell type you should run some tests to determine the best parameters with your particular
cell line. For cell lines that are used by many lab members and that need changes to the default
parameters, we will create a cell type that will be specific for those cells. The cell types will
appear in every user’s menu. The software contains a tutorial for creating your cell lines so this
may be a helpful feature for more difficult cell lines. In addition, you can email cell images to
Beckman Coulter and they can assist you in determining the best parameters for your particular
cell line.
It is also important to be aware of the amount of time your samples will be sitting at room
temperature waiting on the carousel. Each sample takes 2 minutes to run and the carousel holds
12 samples. You may not want to prepare more than 12 samples to run at any give time as the
waiting could affect viability counts. However, as sensitivity to temperature and pH will vary
for each cell line you may want to run controls before making a large number of samples.
The Vi-Cell user manual will be located on the shelf above the instrument at all times. Please
consult the manual or the software help function if you have any questions. If these sources do
not provide the info you need, then please contact Catherine ([email protected] or 8-9488).
This is a very expensive instrument and it will be heavily used by many different lab members so
please take good care of the Vi-Cell and follow all of the operating procedures
The Software
Click on the Vi-Cell icon on the desktop to begin the software.
You will then need to login to the program with your user ID and password provided by the
system administrator.
Use the Navigation Bar on the left side to determine what is displayed in the main window.
Camera Image – allows for the viewing of sample images during and after
a run
Autosampler Queue – shows the completed samples along with the list of
samples in the queue, this is where you can modify/remove samples that are
already in the queue
Cell Types – displays windows with the information for each specific cell
type; this is where you create or remove new cell types
Bioprocess – the last icon represents a bioprocess; there can be many of
these icons that each represents an ongoing experiment in which data is
collected over days or months (for more details of setting up bioprocesses
see pg. 49 in the user manual.
Running a Sample
All reagents including the trypan blue are internal to the instrument so all you need is your cell
solution to get started. Sample cups are located on the shelf above the instrument.
Cell samples can be suspended in any of the following solutions: PBS, isoton (liquid used
with old cell counter), or media (even if it contains phenol red). See system specs to ensure
you will be within the necessary volume and cell concentration ranges.
1. Sample Prep
a. Prepare samples in the TC hood and bring to bench in ependorf or conical tubes.
b. Make the necessary dilutions to keep your cell concentration within the correct
range.
2. At the lab bench, add 600 µL of solution to sample cup. Exact volume does NOT
matter as the instrument sucks up entire solution and only uses 500 µL.
3. Place sample cup in next available carousel position.
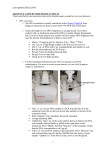
4. Log in sample on the computer by clicking on the Log in sample button: (log in window
shown below)
a. Select cup position on carousel
b. Enter your Sample ID (the software is smart and will increment for you with
multiple samples)
c. Choose a Cell type (*first time choose default)
d. Select a dilution factor
e. Click OK or Next sample to enter additional sample data (*once you start the
queue you can continue to enter samples, so it saves time to start the queue first)
5. From the navigation menu, choose Autosampler queue to see your samples in the queue.
From this screen, you can also edit/remove samples in the queue while a run is in
progress.
6. Click on Start queue to begin sample analysis. Once the run begins, your sample will
disappear from the queue and you will only see it on the main screen. The bottom of the
screen will tell you exactly what the instrument is doing (i.e. mixing trypan blue, loading
flow cell, etc) and right side displays the run data (i.e. image #, % viable, cell count).
Indicates which position in the carousel
you are putting your sample in. NOTE:
the current three positions at the back of
the carousel do NOT appear in the menu
Each user will be able to set their preferences
for the default setting. Also, we will create
new cell types for common lab cell lines.
The dilution factor will automatically be
added into the result calculation by the
instrument. Choices are 1.0 to 20.0
7. Click on Camera view in the navigation bar to see images as they are collected. Cells
outlined in green are counted as live and cell outlined in red are counted as dead.
8. On the right side of the screen, data is displayed for each image as it is collected and the
overall average is updated as the run progresses. There is also a graph that displays
detailed data from each parameter such as size distribution, % viability per image, etc.
9. To add additional samples to the queue, click on Log in Sample and repeat the process in
Step 4 above. You can only add 9 samples to the queue at any given time. But, you can
continually add samples as carousel positions become available.
10. When the sample run is complete, the instrument will clean itself. (Note: You cannot
review data images until this process is complete and there are no more samples to be
counted.)
11. The carousel will then rotate to check for additional samples. At this time, empty sample
cups will be knocked into an internal waster container.
12. Read general system information below to ensure that you follow proper waste
guidelines.
Analyzing the Sample Run
When the cell analysis is complete, you can flip through the images to check the accuracy of the
instrument in identifying live/dead cells. You will also want to look at the size distribution graph
to ensure that the correct minimum size value was used.
If you would like to change any of the cell type parameters, choose instrument from the top tool
bar and scroll down to click on reanalyze. At this point, the default cell type window will open
up and you can adjust the necessary parameters and click ok. The cell images will then be
analyzed using the new parameter values and the data will be displayed on the right side of the
screen. Reanalyzing a sample does not overwrite the original data and the new data is not
automatically saved. So you need to choose save run from the main menu in the top tool bar to
save data before closing.
If you would like to reanalyze a previous run, then you can reload the data by clicking open run
from the main menu. Then, select the text file from your data folder and the corresponding
images will be automatically loaded as well.
Saving Data
In the user preferences, everyone will have their own directory in which data is automatically
saved. All image files appear as file folders containing tiff files of the individual images and the
data is saved as a text file. If selected during the sample log in process, your data will also be
output to an excel spreadsheet. There is an example excel sheet with explanations in the Vi-Cell
user manual for your reference. It is recommend that all images are saved during the setup
period so that data can easily be reanalyzed to determine the best cell type parameters.
However, as the hard drive will quickly fill up you will need to alter your preferences at a
later date NOT to automatically save the images. Please be respectful of how much space you
taking up on the computer and remove any unnecessary files. The computer is not currently
connected to the internet so data will have to be transferred by floppy disk, CD, or USB memory
stick at this time.
General System Information
It is recommended that the Vi-Cell instrument remains ON at all times. Do NOT turn off the
instrument.
At the end of a run, the sample cup is dumped into a bin inside the machine. The software will
alert you when the bin has become full. To empty the bin, open the side door, remove the metal
tray, and dispose of the cups in a biohazard waste container.
Also, all of the liquid waste is collected by the instrument. When the waste container inside the
instrument is full, the software will alert you. First add 50% bleach to the waste, and then you
should dispose of the waste in the proper hazardous waste container in the hood. If there is no
waste container please fill out a new waste disposal card by following the example that is taped
inside the door of the Vi-Cell. The waste percentages listed on the card should be the same for
all samples: 0.2% trypan blue + 1% sodium hypochlorite + 15% isopropanol. If you are
suspending your cells in a solution that is also hazardous, you need to write that information on
the waste card as well – every time you use the cell counter.
As for the instrument reagents, these will be ordered from Beckman Coulter by the lab manager
and stocked near the instrument. Only the Beckman Coulter reagents are compatible with this
instrument. Do NOT use any other brand of trypan blue. If we are running low on reagents, you
will need to place them on the order board in the lab. The instrument contains a reagent fuel
tank that displays the relative amount of reagents in the machine and also the remaining number
of runs at all times. When the reagents do run out, once again the software will give you an
alert. Do NOT attempt to change the reagents on your own. This is the most common
problem that occurs with the instrument so you will need to locate Catherine to change the
reagents for you. If Catherine is not around, then please see Christina, HD, or Lisa to change the
reagents.
The instrument will be decontaminated once a month by a 50% bleach cleaning and the person in
charge of the Vi-Cell will take care of this process.
Vi-CellXR Cell Image Analysis Scheme
Separate Cells
from Background
Based on brightness
& sharpness
Debris
Dead
Cell
Reject
Non-Circular
Objects
Meets Min
Circularity
Decluster
Cells
Not Viable
Size
Exclusion
Determine Viability
Based on spot brightness
& spot area
Viable
Live
Cell
CMCresson
15-March-06
Creating and Modifying Vi-Cell Cell Types
When you begin using the instrument, it is best to select the Default Cell Type
to analyze your sample. Then, you can adjust these parameters to fit the
specific cell line you are measuring and create a unique cell type. These cell
types will show up in everyone’s user account and there should be only one cell
type for each cell line that we use in the lab. Please talk with other lab
members to set the parameters for a given cell line so that everyone can use
the same cell type for a given cell line.
For additional details, please see the Vi-Cell User Manual or the cell type power
point tutorial, which is saved on the desktop of the Vi-Cell computer with the
extension pps.
To access the cell types:
1. choose File from toolbar then click on Cell Type and you will be given
the option to add, modify, or delete a cell type.
2. choose File from toolbar then click on Image-Reanalyze and you will be
given the option to add, modify, or delete a cell type.
3. choose Instrument-Reanalyze from toolbar then you will be given the
option to add, modify, or delete a cell type.
Sample Prep Options
Parameter
Range
Default
Aspiration
Cycles
1 to 7
3
Trypan Blue
Mixing
1 to 7
3
Details
# of times sample is mixed in
syringe; set according to cell
sensitivity & clumpiness
# of times sample and trypan blue
are mixed in syringe
Image Analysis Parameters
The ranges given below are the normal recommended ranges for each
parameter and default value refers to the parameter value in the Default Cell
Type. The default values are a good starting place and you should tweak
individual parameters to determine their effects on the output values.
For the cell brightness parameter, you will need to observe the image in binary
mode to see the difference between parameter values. Right click on the
image, then turn off annotation and then choose Binary Mode. Return to
normal view for all other parameters.
CMCresson
Parameter
Images
Size
15-March-06
Range
1 – 100
3 - 70 µm
Brightness
75 – 90
Sharpness
60 – 200
Spot
Brightness
Spot Area
1 – 20 %
Minimum
Circularity
0–0.5
Decluster
None, low,
med, high
Default
50
Details
Increase value for very low concentration samples
If a particular cell is being problematic, place
10 -40
cursor over cell and size is displayed below
µm
image
Picks out objects from background
85
Increase includes more objects
Decrease includes less objects
Picks out objects from background
100
Decrease to include more objects
Increase to include less objects
Determines cell viability
75 %
Increase value more cells counted as dead
Decrease value more cells counted as live
Ratio of the bright spot to total area
Determines cell viability
5%
Increase value more cells counted as dead
Decrease value more cells counted as live
Excludes dead cells so they are considered debris
0
0 excludes no dead cells
1 excludes all dead cells
Ability of software to pick individual cells from a
medium cluster of multiple cells
None counts a cluster as 1 cell