1
3
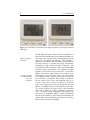
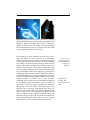
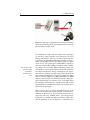
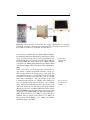
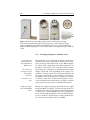
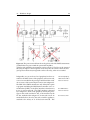
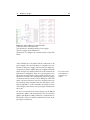
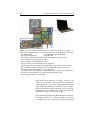
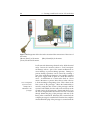
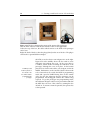
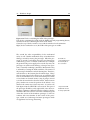
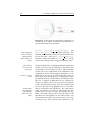
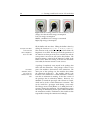
Figure 1.2: Left, the Power-Aware-Cord shows a glowing
pattern which indicates a certain energy consumption of an
appliance. Right, the Energy-Aware-Clock, is showing a
pattern of energy usage. The length of the dial represents
the household energy usage at a certain point in time. Both
avoid using kWh or Watt as an indicator.
User studies have been conducted with the above prototypes, but there is no study with any of the prototypes,
which statistically proves that the introduced indicator for
energy usage increases the awareness of energy consumption. Taking a closer look at the prototypes which are used
during user studies, some flaws can be discovered in the
design of the prototype. These flaws could make a large
scale user study, needed to prove increased energy awareness, much harder. In this work I propose a prototype for
conducting a large scale user study to address the question,
if a different indicator for energy consumption, in contrast
to the conventional indicators kWh and Watt, leads to more
energy awareness. I will start to do a review of studies
conducted with prototypes that use an alternative indicator
for visualizing energy consumption. Then I will hint to
some flaws of these prototypes regarding the usefulness
during large scale user studies. From these flaws, some
properties for a prototype used during large scale user
studies can be constructed. From these properties I then
choose whether I use a measuring device which measures
only one appliance or the complete household. Afterwards
I introduce the prototype itself. The hardware and software
design will be discussed. Afterwards a user test assessing
the performance of the chosen animation is discussed.
there is no user
study, which proves
increased awareness
by using such
prototypes
I will introduce a
prototype, that
should enable such a
study