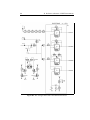
1
PowerSocket:
Implementation of a
Small-Scale Power
Consumption
Measurement
Platform
Bachelor’s Thesis at the
Media Computing Group
Prof. Dr. Jan Borchers
Computer Science Department
RWTH Aachen University
by
Pierre Schoonbrood
Thesis advisor:
Prof. Dr. Jan Borchers
Second examiner:
Prof. Dr.-Ing. Stefan Kowalewski
Registration date: June 26, 2013
Submission date: October 28, 2013
iii
I hereby declare that I have created this work completely on
my own and used no other sources or tools than the ones
listed, and that I have marked any citations accordingly.
Hiermit versichere ich, dass ich die vorliegende Arbeit
selbständig verfasst und keine anderen als die angegebenen Quellen und Hilfsmittel benutzt sowie Zitate kenntlich
gemacht habe.
Aachen, October2013
Pierre Schoonbrood
v
Contents
Abstract
xi
Acknowledgements
xiii
Conventions
xv
1
Introduction
1
2
Related work
5
3
Creating a small-scale version of PowerSocket
13
3.1
Hardware design . . . . . . . . . . . . . . . .
13
3.1.1
Existing prototypes or solutions used
14
3.1.2
Hardware design of the prototype . .
16
3.1.3
First version of the prototype . . . . .
24
3.1.4
Benefits of the first version of the prototype . . . . . . . . . . . . . . . . . .
32
Software design . . . . . . . . . . . . . . . . .
32
3.2.1
33
3.2
Software architecture . . . . . . . . . .
Contents
vi
3.2.2
3.2.3
Programming and debugging the
prototype . . . . . . . . . . . . . . . .
41
Benefits of the software design . . . .
41
4
Evaluation
43
5
Summary and future work
51
5.1
Summary and contributions . . . . . . . . . .
51
5.2
Future work . . . . . . . . . . . . . . . . . . .
52
A The development environment of the prototype
55
B Reference schematic of EM773 smartmeter
57
C Schematics of the prototype
63
C.1 Schematics . . . . . . . . . . . . . . . . . . . .
63
C.2 Bill of material . . . . . . . . . . . . . . . . . .
69
C.2.1 Power supply . . . . . . . . . . . . . .
69
C.2.2 Mainboard . . . . . . . . . . . . . . . .
70
C.2.3 Led PCB . . . . . . . . . . . . . . . . .
71
D Software architecture of the prototype
73
E Programming and debugging the prototype
75
F Results of the first step of the user study
77
Bibliography
79
Contents
Index
vii
83
ix
List of Figures
1.1
The Reichelt on socket meter . . . . . . . . . .
2
1.2
The Power-Aware-Cord and Energy-AwareClock . . . . . . . . . . . . . . . . . . . . . . .
3
2.1
Appliance level energy measuring . . . . . .
8
2.2
Domestic level energy measuring . . . . . . .
9
3.1
Used prototypes and commercial products .
14
3.2
The Arduino Duemilanove . . . . . . . . . .
15
3.3
Breakdown of power supply . . . . . . . . . .
17
3.4
The deleted parts from the EM773 smartmeter analogue front end . . . . . . . . . . .
19
The removed components around the microcontroller of the EM773 smartmeter . . . . . .
20
3.6
Breakdown of the circuit around the MCU . .
21
3.7
Breakdown of the LED PCB of the prototype
23
3.8
Modular arrangement of the first prototype. .
26
3.9
MCU bonded to an adapter . . . . . . . . . .
27
3.5
List of Figures
x
3.10 Fuse and wiring of the mains in the prototype 28
3.11 Box containing mains circuitry . . . . . . . .
30
3.12 Box containing PCBs of the prototype . . . .
31
3.13 The ring buffer of the driver of the LED driver 36
3.14 The rotating animation of PowerSocket . . .
38
3.15 Animation of the prototype . . . . . . . . . .
40
4.1
Chart of the result of the user study . . . . .
44
B.1 Analogue front end of EM773 smartmeter . .
58
B.2 Power supply of EM773 smartmeter . . . . .
59
B.3 The EM773 microcontroller with some periphery . . . . . . . . . . . . . . . . . . . . . .
60
B.4 The wireless transmitter of EM773 smartmeter 61
C.1 Schematic of the power supply of the prototype 65
C.2 Schematic of analogue front end of the prototype . . . . . . . . . . . . . . . . . . . . . . .
66
C.3 Schematic of MCU and the periphery around
it of the prototype . . . . . . . . . . . . . . . .
67
C.4 The LED PCB of the prototype . . . . . . . .
68
D.1 Module diagram of the software architecture
74
E.1 Setting for flash magic . . . . . . . . . . . . .
76
E.2 Setting for flash magic . . . . . . . . . . . . .
76
xi
List of Tables
2.1
A comparison of strengths and weaknesses
of both classes. . . . . . . . . . . . . . . . . . .
10
C.1 The bill of material for the power supply of
the proposed prototype. . . . . . . . . . . . .
69
C.2 The bill of material for the analog front end
of the proposed prototype. . . . . . . . . . . .
70
C.3 The bill of material for the circuit containing the MCU and some periphery of the proposed prototype. . . . . . . . . . . . . . . . .
70
C.4 The bill of material for the circuit of the LED
PCB of the proposed prototype. . . . . . . . .
71
F.1
F.2
The coarse energy consumption classes I
have found in initial testing. . . . . . . . . . .
77
The result of the first part of the user study. .
78
xiii
Abstract
A lot of thought has been put in how effective feedback is on energy consumption. There is a broad consensus that providing direct and immediate feedback
has a positive effect on energy consumption behavior. The type of feedback does
not seem to be the only problem with feedback on energy consumption. The way
energy consumption is indicated seems to be too vague for a lot of people. Most
meters only showed kWh or Watt. Therefore, other visualization that try to avoid
using kWh or Watt, have been introduced. Although some user studies are done
with the prototype that contain alternative visualization, none of the conducted
user studies was powerful enough to prove that the introduced visualization led
to more awareness then just displaying Watt or kWh. One of the reasons, such a
user study was hardly realizable, could be the way the prototypes, used during the
studies, were constructed.
In this work, I present a prototype, that encompasses some advantageous properties for a large scale user study. The circuit of the prototype is based on the EM773
smartmeter and the animation is based on PowerSocket. Two versions of the prototype are envisioned. The first is used to test functionality. To make experimenting
with functionality easier, the first version of the prototype is designed modularly.
This allows to exchange the visualization unit. With the modularity and because
the experimenter does not need to care about the measurement unit, the first version of the prototype can be regarded as prototype platform for energy consumption visualization. The second version of the prototype will be a minimized version
of the first. In this work the first version is introduced.
Lastly, an user study is performed, to asses the performance of the animation of
PowerSocket. In this study, suitable energy consumption classes, by using the just
noticeable distance of the animation, are tried to be found. The result is a classification, which give some insight what JNDs are suitable for certain energy usage
classes.
xv
Acknowledgements
Firstly, I would like to thank Prof. Jan Borchers for hosting excellent lectures Designing Interactive Systems I, Designing Interactive Systems II and Current Topics in
HCI. Those lectures inspired me to perform my bachelor thesis in this field.
Secondly, I want to thank those, who sponsored me some materials and crafting
tools with which the exterior of the prototype is constructed. In this context I would
like to thank Jo Meens of Electro Meens for sponsoring me a fuse, socket and moveable ground fault interrupter. Mainly, I would like to give thanks to my dad for all
of his tools and material I was allowed to use.
Of course, I would like to thank all of those who advised and helped me, which
brings me to my last but not least acknowledgement. I would like to thank my
supervisor Florian Heller for supporting me. I am especially grateful for his willingness to help me, even when no meeting was scheduled.
xvii
Conventions
Throughout this thesis we use the following conventions.
Text conventions
Definitions of technical terms or short excursus are set off
in coloured boxes.
E XCURSUS :
Excursus are detailed discussions of a particular point in
a book, usually in an appendix, or digressions in a written text.
Source code and implementation symbols are written in
typewriter-style text.
myClass
The whole thesis is written in American English.
Download links are set off in coloured boxes.
File: myFilea
a
http://hci.rwth-aachen.de/public/folder/file number.file
Definition:
Excursus
1
Chapter 1
Introduction
Electricity is a ubiquitous source of energy. A lot of people
do not think about the consequences of using an electric
device. After a month or a year they get their electricity
bill and are upset because they have to pay a lot of money.
Studies show that this indirect type of feedback is not
sufficient to draw the peoples attention towards their
energy consumption [Abrahamse et al., 2005], [Fischer,
2008].
Although indirect feedback is not successful, it is stated by
[Darby, 2006], that by providing detailed and immediate
feedback, between 5% and 15% of a households energy
consumption can be saved. There are commercial products
available for direct feedback, for example, the Kill-A-Watt
by [P3-international] and the Wattson by [DIY-Kyoto]. The
Kill-A-Watt is an on-outlet measuring device, whereas
the Wattson measures the energy use of the complete
household.
One thing most commercial systems have in common is
that the unit used for energy usage which is kWh or Watt,
like the Reichelt measurement unit shown in figure 1.1. In
[Broms et al., 2010] there is mentioned, that the concept of
kWh or Watt is hard to understand for users, as it is just a
number. This is confirmed by the literature studies from
[Darby, 2006] and [Abrahamse et al., 2005]. In [Parker et al.,
2008], it is stated that the energy usage of a household is
indirect feedback is
not sufficient
detailed and
immediate feedback
is needed
commercials
systems use Watt
and kWh
Watt and kWh are
hard to understand
1
2
Introduction
Figure 1.1: A Reichelt measurement unit displaying Watt usage (right) and used
kWh (left).
indication should be
understood
prototypes avoid the
use of Watt and kWh
have been
constructed
directly influenced by the behaviour of the inhabitants of
the household. If inhabitants cannot understand indicators
for energy usage, negative energy consumption behaviour
will not be recognised and changed. This problem is
addressed in the HCI community. Mostly by introducing
prototypes that try to visualize the energy consumption
avoiding the usage of Watt and kWh as indicator. The
Power-Aware-Cord [Gustafsson and Gyllenswärd, 2005]
visualizes energy consumption of an appliance by light
patterns in an electrical cord, see figure 1.2. Powersocket
[Heller and Borchers, 2011] mimics the movement of an
electrical meter on an electrical outlet. The Ténéré [Kim
et al., 2009a] visualizes energy consumption by using the
Tree of Ténéré as a metaphor. When energy is consumed,
the tree starts to loose leaves and ultimately ends up as
a statue. This statue is the tree of Ténéré in its present
form, as the original tree died. The Energy-Aware-Clock
[Broms et al., 2010], which is seen in figure 1.2, uses the dial
of a clock to indicate the energy usage of the household
at that time. With low energy consumption, the dial is
short. For higher energy consumption, the length of the
dial increases. In [Holmes, 2007], a system is introduced
that shows the number of oaks needed for neutralizing the
carbon oxide, emitted during the production of the energy
that is used in one day by a building.
3
Figure 1.2: Left, the Power-Aware-Cord shows a glowing
pattern which indicates a certain energy consumption of an
appliance. Right, the Energy-Aware-Clock, is showing a
pattern of energy usage. The length of the dial represents
the household energy usage at a certain point in time. Both
avoid using kWh or Watt as an indicator.
User studies have been conducted with the above prototypes, but there is no study with any of the prototypes,
which statistically proves that the introduced indicator for
energy usage increases the awareness of energy consumption. Taking a closer look at the prototypes which are used
during user studies, some flaws can be discovered in the
design of the prototype. These flaws could make a large
scale user study, needed to prove increased energy awareness, much harder. In this work I propose a prototype for
conducting a large scale user study to address the question,
if a different indicator for energy consumption, in contrast
to the conventional indicators kWh and Watt, leads to more
energy awareness. I will start to do a review of studies
conducted with prototypes that use an alternative indicator
for visualizing energy consumption. Then I will hint to
some flaws of these prototypes regarding the usefulness
during large scale user studies. From these flaws, some
properties for a prototype used during large scale user
studies can be constructed. From these properties I then
choose whether I use a measuring device which measures
only one appliance or the complete household. Afterwards
I introduce the prototype itself. The hardware and software
design will be discussed. Afterwards a user test assessing
the performance of the chosen animation is discussed.
there is no user
study, which proves
increased awareness
by using such
prototypes
I will introduce a
prototype, that
should enable such a
study
4
1
Introduction
5
Chapter 2
Related work
In this section, I will first give a motivation why I built
a small scale (cheap) prototype, based on a literature
study of publications in which user studies with energy
measuring prototypes, which have a different visualization
then displaying kWh or Watt only (conventional energy
measuring). I will argue about how the user studies were
conducted and what kind of problems the prototypes
used during the studies, had during the realization. This
results in criteria for prototypes to be used in a large scale
user study. In the second part I will argue about, the
advantages and disadvantages of appliance level metering
and residential level metering. I conclude the second part
by reasoning about the choice I made, which is to construct
an appliance level meter.
In this first part I will start by giving a broad overview of
how user studies with prototypes are conducted and what
kind of results are obtained. Considering the first aspect
of the user studies I will discuss the size and length of the
user studies. The size of the user studies conducted by
[Gustafsson and Gyllenswärd, 2005], [Broms et al., 2010],
[Heller and Borchers, 2012] range from 9 participants to 15
participants. The duration of the mentioned user studies
range from a day to three months. From the duration of
the studies we can see that long term affects have not been
studied and with the number of participants the strength
of the results are questionable.
the sample size of
the user studies were
too small
the length of the user
studies were too
short
2
6
proving the
increased awareness
has been avoided
a reason could be
the prototype
a lot of replicas are
needed
a prototype should
be able to be built
fast
Related work
During the conducted user studies the question: ”Does
this prototype lead too more energy awareness (then
conventional systems)?”, has never been addressed. In
[Gustafsson and Gyllenswärd, 2005], [Heller and Borchers,
2011] and Petersen et al. [2009] animations and or interfaces
are tested on how appealing they are to the user and how
well they are understood. In the study from Heller and
Borchers [2012] the prototype is passed for a week to users
to experiment with it. In [Holmes, 2007], [Kim et al., 2009a]
and [Weiss et al., 2009], prototypes are constructed but
no user study has been done at all. [Broms et al., 2010]
draw a similar conclusion as in [Darby, 2001] and [Darby,
2006], that providing direct feedback leads to an increased
awareness of energy consumption.
Apparently, the conducted user studies were too small and
too short and did not address the issue that the proposed
concept leads to an improved awareness in contrast to
conventional systems. It is interesting why this issue has
never been addressed accordingly. One of the reasons
could be how the prototype has been built. In the next
section I will describe problems with prototypes that are
constructed and what kind of prototype is needed to
perform a large scale user study.
First of all, the prototype must be able to be built in a large
quantity. For a result to be significant, a large number of
samples must be available. In the case of a user study these
samples are participants. Depending on the type of the
study, all or a part of the participants need a prototype.
The first factor greatly influencing the ability to reproduce
the prototype is the construction time of the prototype. The
person or team conducting the study usually cannot spend
the time needed to construct the prototype themselves.
So, an external company should mass construct these
prototypes partly. The cord used in [Gustafsson and Gyllenswärd, 2005] is probably not suitable to be reproduced
effectively.
If the production of the prototype can be done by an
external company, this will reduce the costs to construct
7
the prototype. Costs of the prototype is another important
factor to consider when conducting a user study with use
of a prototype. The version of PowerSocket introduced in
[Heller and Borchers, 2011] uses a Arduino prototyping
board, which in contrast to a integrated solution, costs
almost four times as much. In [Petersen et al., 2009] the
user needed a wireless network and an iPod touch or
iPhone, this would lead to rejection when users do not
have them at hand.
Obviously, a prototype should be usable when used during
a study. Usable in a sense that it is functional, reliable
and is not too obtrusive in its use. If a prototype is not
reliable, for example the Power-Aware Cord [Gustafsson
and Gyllenswärd, 2005] had loose contacts during the user
study, the users will have a hard time using the prototype.
This can result in that the users will not use the prototype
at all. This is also true for the size of an prototype, for
an on-outlet power measuring device, the dimensions of
PowerSocket [Heller and Borchers, 2011] was large. A
prototype which is too big, (often prototypes are bigger
then is needed, because this makes prototyping easier),
probably leads to a higher usage barrier. Nobody probably
would like a box standing in the room for a while, just to
measure energy consumption. Furthermore, depending on
the location of the wall socket, a big box can get in the way
of other appliances. Another aspect of obtrusiveness is,
how easy is a prototype installable, which is mentioned by
[Kim et al., 2009b], too. The Energy-Aware Clock [Broms
et al., 2010] obtains the energy usage data from the main
fuse. When such a system needs to be installed in an older
house, then some alterations need to be made to the circuit
around the main fuse. Alternations to existing circuits
should be avoided, as it brings in additional risk and
possible rejection of the prototype by the potential user.
the costs of the
prototype should not
be too high
a prototype should
be reliable
it should not be
bigger than needed
the prototype should
be easily installable
2
8
Related work
Figure 2.1: The idea of appliance level energy measuring:
the energy measuring device is put directly between the appliance and the energy outlet.
there are two scales
on which energy
consumption
metering can be
done
For conducting a large scale user study with a prototype
we now have some properties for a prototype to be used
during such studies. We have seen that a prototype has
to be able to be reproduced efficiently, should not cost too
much, and should be functional, reliable, and not to obtrusive in its use. The prototypes I studied did not comply to
these criteria, probably leading to problems when conducting a large scale user study. When conducting a large scale
user study to answer the question of increased awareness
by using a metaphor for energy consumption, one important choice is on which scale the energy is measured. In the
next section I distinguish two classes of energy measuring
devices, analog to [Weiss et al., 2009], [Froehlich et al., 2009]
and give some examples of commercial systems and prototypes which belong to a respective class. I will argue about
the strengths and weaknesses of both classes and use this
argumentation to strengthen my choice for the class I have
chosen for my prototype.
There are two classes of energy measuring devices available on the market and used in research. The first one is
feedback on device level. These systems measure the energy usage for every attached device. The energy metering devices are usually situated between the energy outlet
and the appliance as seen in figure 2.1. Commercial sys-
9
Figure 2.2: The main idea of measuring the energy consumption of a complete
household. A sensor is integrated near the main fuse. The usage data is then collected and accessible over a terminal or mobile device.
tems already available in this class include Kill-A-Watt [P3international], SmartLinc [SmartLabs], and Plugwise [Plugwise]. Several prototypes have been constructed as well,
which include the Power-Aware cord [Gustafsson and Gyllenswärd, 2005], the Ténére [Kim et al., 2009a], ViridiScope [Kim et al., 2009b], Web-enabled Power Outlets [Weiss
and Guinard, 2010], and PowerSocket [Heller and Borchers,
2011].
In the second class are the devices that measure the energy which a complete household consumes. These systems usually measure the energy usage at the main fuse
and communicate this to a central hub. Usage data is then
accessible at a central access point like a PC or a mobile
device like a smartphone. The general idea of this class
is demonstrated in figure 2.2. Another more detailed option is to measure each circuit secured by a fuse individually. Numerous commercial products are already available on the market in this class. These include the Wattson
[DIY-Kyoto], Power Cost Monitor [Blue-Line-Innovations],
and TED-5000 [Energy-Inc]. Prototypes which can be classified in this class include 7000 oaks and counting [Holmes,
2007], Wattbot [Petersen et al., 2009], a systems that gives
feedback using a mobile phone [Weiss et al., 2009], the
Energy-Aware Clock [Broms et al., 2010], and Dehems
[Sundramoorthy et al., 2010].
the first one is
appliance level
metering
the second one is
household level
metering
2
10
an appliance level
meter is easier to
install
Related work
I will now list the strengths and weaknesses of both classes,
summarized in table 2.1. First of all is the ease of installation. The advantage of application level energy measuring
is that it is easy to install. The meter only needs to be placed
between the outlet and the application as shown in figure
2.1. In contrast, for domestic level energy measuring, alteration or additions around the main fuse need to be made,
when no smartmeter is available. According to [Weiss and
Guinard, 2010] this leads to high adaptation barriers.
Appliance level
+
Easy to install,
Detailed per device measurement
Not every device can be measured,
No overview of household consumption
Domestic level
+
Overview of household energy consumption,
Every device is measured
Not so easy to install,
No detailed usage of specific devices
Table 2.1: A comparison of strengths and weaknesses of both classes.
some devices are not
plugged into an
outlet
household level
energy metering
provides a complete
overview
energy usage of a
device can be related
to this overview
A weakness of appliance level measurement is that some
devices cannot be measured as they are not plugged in into
a energy outlet. In [Kim et al., 2009b] this problem is mentioned and ceiling lights, heating and ventilation systems
are given as example. In contrast, domestic level measurement measures the complete household, the devices that
cannot be measured by appliance level measurement, are
measured as well.
With residential level energy measuring, the users have
a complete overview of the energy consumption of the
household. This has the advantage of identifying the impact of one device on the energy consumption of the household. This enables users to identify the biggest consumers
in their homes, by relating the energy consumption of one
device to that of the complete household. This can contribute to determine whether a device has a low or high
consumption. Appliance level measurement in contrast,
can only show the difference in energy usage between single devices. A complete overview of the energy consumption of the complete household is hard or not possible to
11
achieve. Appliance level measuring therefore lacks the ability to determine the amount of power consumption by comparing it to a overall household consumption. Regarding
energy awareness this gives rise to the question: ”How to
make users aware if a device uses not so much or a lot of
energy?”. An important part of this question is, when does
a device use a lot or not so much energy.
appliance level
metering lacks an
overview to which
consumption can be
related to
Both [Darby, 2006] and [Fischer, 2008] argue that, to adept
behaviour more efficiently, the user needs to be aware of
the energy usage of different appliances. Furthermore, according to [Kim et al., 2009b], direct feedback reveals the
link between actions and their impacts. Because the information provided by appliance level feedback is direct and
application specific, both arguments of this paragraph supports that appliance level metering increases awareness. In
contrast, [Froehlich et al., 2009] state that appliance specific
breakdown is not possible with domestic level measuring.
This is caused by the arrangement of circuits in a home. To
get an idea of how much a specific appliance uses, the user
needs to observe the changes the appliance causes to the
overall household consumption. This requires additional
effort from the user.
awareness of energy
The main idea wherefore the prototype presented in this
work is constructed, is a large scale user study to show that
by providing a different, more clear way of showing energy consumption then conventional meters (using Watt as
primary indication), contributes to more awareness of energy consumption. The easiness of installation of appliance
level measuring directly complies with the properties for
prototypes used for large scale user studies. [Darby, 2006],
[Fischer, 2008] and [Chetty et al., 2008] argue for the importance of awareness of energy usage of different applications. This would suggest that it is sufficient to increase
the awareness per device to increase the awareness overall.
As the awareness per device is a strength of appliance level
measuring as well as the easy of installation, I have chosen
to construct an appliance level meter. In the next section I
will introduce a prototype, that tries to encompass all of the
above mentioned properties for a large scale user study.
appliance level
usage of different
appliances is
important
household level
metering cannot be
application specific
metering shows
energy consumption
of different
appliances and is
easily installable
I have chosen to
construct an
appliance level meter
13
Chapter 3
Creating a small-scale
version of PowerSocket
In this section I will introduce a prototype which has the
purpose to be used during a large scale user study. As mentioned before, I will therefore try to encompass the properties mentioned in chapter 2 into the prototype. I will start
with illustrating the hardware design. In the following, the
software architecture will be explained in detail.
3.1
Hardware design
In this section, the hardware design is explained. I will start
with clarifying why I used existing prototypes and solutions and explain the prototyping phases I had in mind. Afterwards, the broad hardware design of the circuits of the
prototype and the first version of the prototype will be introduced. The second version (the minimalistic prototype)
is not introduced in this work, as I was not able to construct
it before this work was written. I will conclude this part
by bringing up other possibilities the introduced prototype
has.
3
14
Creating a small-scale version of PowerSocket
Figure 3.1: The prototypes and products used to construct the prototype.
Left, the Powersocket prototype in its present state, a rather large prototype.
Center, the EM773 smartmeter from NXP. This device has no power indication.
Right, an IKEA night light. It is very small, and has a transparent ring around the
socket.
3.1.1
PowerSocket, the
EM773 smartmeter
and a night light from
IKEA are used
the circuits of the
prototype are based
on the EM773
smartmeter
PowerSocket is too
large
ideally, the prototype
fit into the IKEA night
lamps
Existing prototypes or solutions used
The initial idea was to combine the animation of the PowerSocket prototype (3.1 left), with the circuits of the smartmeter prototype from NXP based on the EM773 (figure
3.1 center), and a night lamp from IKEA (figure 3.1 on
the right). Powersocket serves as the basis for the animation of the power consumption (a rotating animation which
changes speed and color depending on the energy consumption). Another aspect of PowerSocket influences the
prototype I constructed, as well. Namely, PowerSocket is
an appliance level measuring device, which I have chosen
to construct. This choice is motivated in chapter 2. However, PowerSocket in its current state is too large to conduct
a large scale user study with, so it should be downsized.
Ideally, the complete prototype should fit into the night
lamp from IKEA, see figure 3.1. If this succeeds, the device
will then meet some of the properties discussed in chapter
2. Namely, it is easily installable as it can be plugged between an outlet and an appliance. The size of the prototype
is not too obtrusive. The prototype is easily constructed, as
the exterior can be bought at low cost at IKEA.
3.1
Hardware design
15
Figure 3.2: The Arduino Duemilanove prototyping board,
which is too large and expensive to be integrated in a small
scale prototype.
To reduce costs more and because of advantages I will mention later, the EM773 from [NXP] is used in the prototype I
constructed. The current implementation of PowerSocket
uses an [Arduino] Duemilanove, which is more expensive
then an integrated solution based on the EM773. One further advantage is the integrated metrology engine of the
EM773. Only a small analog circuit is needed for twochannel measurement. Another important aspect of this
design choice is that it reduces the size of the PCB, as the
size of the Arduino Duemilanova is already quite large (see
figure 3.2).. Size and costs are properties already mentioned
in the first part of chapter 2 that influence the ability of a
prototype to be used during a large scale user study mentioned.
to reduce costs, the
EM773 is used in
contrast to a
prototyping board
the EM773 has an
integrated metrology
engine
by using the EM773
the size of PCB is
reduced
3
16
the prototype can be
constructed on one
PCB with hard wired
connections
this reduces the risk
of loose connections
The EM773
smartmeter comes
with an extensive
SDK
The EM773 is a one chip SMD solution. As such, the complete prototype can be constructed on one PCB, which has
advantages regarding prototype size. All the connection on
the PCB are hard wired (this is planned in the second version of the prototype, in the first version, the circuit is separated on several PCBs), which eliminates the risk of loose
connections. A smaller risk of loose connections improves
the reliability of the prototype. As the complete prototype
can be constructed on one PCB, production of large quantities is enabled. The PCB can be made by external companies which construct the complete PCB. This reduces construction time and cost.
Another big advantage is that the EM773 comes with an
extensive SDK1 (this will be used in the software section
of this work). Within this SDK, a documentation for the
EM773 microcontroller can be found, as well as the reference schematic of the EM773 smartmeter pictured in figure
3.1 in the middle. I took this reference schematic as a basis
for the design of the circuit of the prototype presented in
this work.
3.1.2
the prototype
introduced focuses
on functionality
Creating a small-scale version of PowerSocket
Hardware design of the prototype
First of all, the prototype is designed in two iterations.
The first iteration is focused on getting the hardware and
software to work. This is necessary, because the reference
schematic, provided by the SDK from the EM773 smartmeter, has to be modified. The second iteration then focuses
on getting the prototype as small as possible, so that it eventually fits in the exterior of the night lamp from IKEA, seen
in figure 3.1 on the right. This has the benefit, that I can
first focus on functionality and reliability of the prototype,
which, as mentioned in chapter 2, are both properties a prototype should have for conducting large scale user studies
with it. During this phase I mainly use tools available in
the [FabLab-Aachen].
1
http://www.nxp.com/documents/other/EM773 SDK Setup.exe
3.1
Hardware design
17
Figure 3.3: The breakdown of the power supply of the prototype.
(1) SMPS circuit, this part transforms 230VAC down to 12VDC.
(2) Linear regulator, 12VDC is regulated to 3.3VDC.
(3) Input and output section of the power supply.
In the first step, I analyzed which components of the reference schematic have to be used and which one could be
removed. As the goal is to construct a small scale prototype, only the necessarly parts remain. As such, the
wireless transmitter in the reference schematic, which can
be seen in figure B.4 has been removed. Furthermore,
the power supply, which the EM773 smartmeter uses, depicted in figure B.2, was too weak to power the LEDs used
for the animation introduced in PowerSocket. Hence this
power supply has been replaced. The schematic of the circuit that replaced the power supply, can be seen in figure
C.1. The power supply is based on the SMPS (switching
mode power supply) Viper22A-E and the linear regulator
LD1117S33. The datasheets of both devices can be found
in Appendix C.1. Furthermore, as reference design for the
SMPS circuit, I used the STEVAL-ISA035V1. The application notes of this reference design can be found in Appendix C.1 as well.
The power supply consists of three parts, as depicted in
figure 3.3. The first part, labelled with 1 in figure 3.3,
transforms the voltage from the mains (230VAC) to 12VDC.
The transformation from 230VAC to 12VDC is done by an
SMPS. The SMPS circuit of the power supply is a copy from
the reference design of the STEVAL-ISA035V1. The current
Unneeded parts of
the EM773
smartmeter are
removed
the wireless
transmitter has been
removed
the power supply
was too weak and
has been replaced
3
18
the power supply can
be extended by
adding another linear
regulator
from the analog front
end, the shield is
removed
as well as a relay
that could switch off
the appliance
Creating a small-scale version of PowerSocket
that can be drawn from the SMPS circuit is about 350mA
and the voltage is about 12VDC. The second part, denoted
with 2 in figure 3.3, transforms 12VDC to the voltage that
is needed by the circuit of the prototype. In the case of the
prototype introduced in this work, this is 3.3V. This transformation is done by using a linear regulator, that is coupled on the output of the circuit of the SMPS circuit. When
another voltage is needed for a prototype, the power supply can easily be extended by coupling another linear regulator on the output of the SMPS circuit on which the linear
regulator, depicted with 2 in figure 3.3, is attached. The
third part in figure 3.3, denoted by 3, is the input/output
part of the power supply. The input is the neutral(N) and
the line(L) of the mains. Output is the ground and the output of the linear regulator, in case of the prototype proposed here, 3.3V. When, as mentioned earlier another linear regulator is coupled for an additional voltage, one more
output is necessary.
In the analog front end of the EM773 smartmeter, which can
be seen in figure B.1, some parts can be found, that are not
needed in the prototype. The parts that I deem superfluous
can be seen in figure 3.4. The shield around the operational
amplifier of the analog front end, seen in figure 3.4 indicated with 1, is removed. This is done, to decrease the size
of the prototype. It is necessary to evaluate if problems occur after removing the shield, with the part of this circuit
which was protected by the shield. The relay of the analog front end, that can be seen in figure B.1, is a rather big
part. There is no additional need to switch the appliance,
connected to the meter, off. Users can plug out the appliance from the meter, therefore the relay has been removed.
The resistor and capacitor, denoted by 3 in figure 3.4, are
rather big components as well. Their function is to relieve
the removed relay, when it switched. This makes both components superfluous and which is why they have been removed. In the end, the result is the schematic which can
be seen in figure C.2. Although the analog front end used
in the prototype introduced in this work is a copy from the
original schematic from the EM773 smartmeter, it did not
work in the prototype proposed in this work.
3.1
Hardware design
19
Figure 3.4: The parts removed from the analog front end of the EM773 smartmeter.
(1) Shield that was put around the operational amplifier.
(2) Relay with which the measurement can be switch of. The left 2 is the circuit of
the relay, the right 2 is the integration of the relay into the circuit of the front end.
(3) Capacitor and resistor, integrated to relieve the relay, when it is switched.
In figure B.3, we can see that a lot of periphery has been attached to the MCU. Some of the periphery can be removed,
as it was not needed in the prototype introduced this work.
An overview of the removed parts can be seen in figure 3.5.
The SDK of the EM773 smartmeter only offered the option
to program and debug the EM773 microcontroller over a serial interface (UART). As the JTAG interface is therefore not
in use, it can be removed. The JTAG interface is denoted
by 1 in figure 3.5. None of the periphery used by the prototypes in this work used the I2 C bus, so the interface for the
I2 C bus, marked with 2 in figure 3.5, is removed as well. As
mentioned before, the relay that can switch the appliance,
attached to the meter, on or off has been removed. This
unneeded periphery
attached to the MCU
has been removed
the JTAG interface
has been removed
the I2 C bus as well
3
20
Creating a small-scale version of PowerSocket
Figure 3.5: The removed parts from the circuit around the MCU of the EM773
smartmeter.
(1) JTAG debug and program interface.
(2) I2 C bus.
(3.1) Switch which can turn the appliance, connected to the meter, off.
(3.2) Ports to the relay and an LED that shows which channel for measurement is
in use.
(4) Ports used to communicate with the wireless transmitter.
the ports that were
connected to the
relay are freed and a
switch controlling the
relay removed
lastly, an LED
signalling the
measurement signal
is removed
makes the switch, 3.1 in figure 3.5, and the ports to the relay,
3.2 in figure 3.5, superfluous. Consequently, they have not
been integrated in the prototype introduced in this work.
Another part I deem unnecessary was the LED that signals
which current measurement channel is in use. This was
due to that this information could be printed on the UART
interface. Hence this LED was left out of the prototype I
constructed. As mentioned in the beginning of this chapter,
the wireless transmitter unit was left out, this means that
the connections denoted by 4 in figure 3.5 are not present
in my prototype.
3.1
Hardware design
21
Figure 3.6: The MCU with some ports and connections, depicted is the breakdown
of this part of the circuit.
(1) Power supply for the MCU
(2) XTAL for the MCU unit
(3.1) UART port isolated by an opto coupler
(3.2) Switch to get the MCU in programming mode.
(4) I/O block of the MCU circuit.
The result of the component removal can be found in
figure C.3. In contrast to removed parts, one crucial part
has been added. This is an opto-coupler. Adding this part
enables debugging over UART even when the power supply of the circuit has different voltage levels then the device
that debugs/programs it. The metering unit requires the
power supply, which should be non isolated for operation.
Therefore, adding the opto-coupler is especially important
for debugging the metering unit.
In figure 3.6 a breakdown of the circuit around the MCU
can be seen. The core of this part of the circuit is the
EM773 microcontroller. A user manual and datasheet of
the EM773 can be found in Appendix C.1. Furthermore the
power supply (1 in figure 3.6) and the clock source (2 in figure 3.6) of the MCU can be seen. Although the EM773 has
an internal oscillator, I used an external clock source because the accuracy of an external oscillator is much higher.
This leads to more precision in timing functions of the MCU
an opto coupler is
added for debugging
purposes
an external clock
source is used to
increase accuracy
3
22
the MCU is
programmed and
debugged with the
UART port
a 24 channel
constant current sink
LED driver is used to
control the LEDs
combined red/green
LEDs are used for
the LED circle
Creating a small-scale version of PowerSocket
and the energy measurement. As already mentioned, the
MCU is debugged and programmed with the UART port.
The UART port, isolated by an opto coupler, can be seen in
figure 3.6 denoted with number 3.1. In figure 3.6 a switch
that is used to bring the MCU in programming mode is denoted by 3.2. Getting the MCU in programming mode is
done by making a connection between ground and pin 1 of
port 0 of the MCU, and resetting the MCU. Number 4 in figure 3.6 depicts the I/O block of the microcontroller. Here all
ports of the MCU, that are not in use to fulfil its basic functions, are combined. The basic functions consist of energy
measuring and being able to program and debug the MCU.
The I/O block is the interface to connect the MCU with, for
example, the LED PCB used in the prototype introduced in
this work or a display. This concludes the part, in which
the adjustments to the schematic of the EM773 smartmeter
are made.
In this section, I will discuss the design of the LED PCB that
will show the rotation animation of PowerSocket [Heller
and Borchers, 2011]. The resulting schematic of the LED
PCB circuit can be found in figure C.4. The heart of this
PCB is the LED driver TLC5947 from Texas instruments.
This is a 24 channel, constant current sink LED driver. The
datasheet of this part can be found in Appendix C.1. The
animation of PowerSocket [Heller and Borchers, 2011] uses
the colors green,orange,red. This means a combined LED
with a red and green LED suffices to show the colors of the
animation. As the LED driver is a constant current sink
driver, the combined LED needs a common anode. I used
the L59EGW-CA LED from Kingbright. The datasheet of
the LED can be found in Appendix C.1 as well.
As the TLC5947 is a 24 channel driver and the LEDs require two ports per combined LED (one for red and one for
green), the LED PCB has 12 LEDs. In figure 3.7 this part is
denoted by 1. In this figure we can further see which port
of the LED driver corresponds to which LED and which
color of the LED. The colors of a combined LED are coupled on a consecutive port of the LED driver. This makes
programming the driver easier. How the LED driver is programmed will be further explained in the software section.
Number 2 of figure 3.7 shows the connections to the rest of
the PCB of the prototype. This consists of the connection
3.1
Hardware design
23
Figure 3.7: The breakdown of the LED PCB.
(1) Twelve LEDs of the LED PCB.
(2) Connection to the MCU and the power supply.
(3) Power supply of the LED driver.
(4) Resistors to configure the constant current of the LED
driver.
of the LED driver to the MCU and the connection to the
power supply. How the LED driver is coupled to the connections to the power supply is denoted by 3 in figure 3.7.
A capacitor is used to stabilize the power supply to the LED
driver. In figure 3.7, number 4 shows how the current of the
LED driver is configured. There are several options possible for the constant current value possible, therefore a configuration is needed. The configuration consists of putting
a certain amount of resistance on the IREF port of the LED
driver. The exact resistance value for a constant current can
be looked up in the datasheet from the LED driver, available in Appendix C.1. This concludes the broad overview
of the design of the circuits of the prototype introduced in
this work.
We have seen that the basis for this design are the EM773
smartmeter (MCU and measurement) and PowerSocket
[Heller and Borchers, 2011] (animation, requirements for
LED PCB). I will now continue with the first version of the
prototype I constructed.
the constant current
of the LED driver is
configured using
resistors
3
24
3.1.3
the prototype can be
debugged even when
the power supply is
used
the prototype is build
modularly
it consists of four
PCBs
a main board which
connects all other
PCBs
the prototype can be
powered with the
power supply and the
UART port
Creating a small-scale version of PowerSocket
First version of the prototype
As already mentioned at the start of section 3.1.2, the first
version of the prototype is focused on functionality, regarding both the hardware and the software. Therefore, this version of the prototype is a debug platform. For software,
this is realized by providing a UART port which can be
used even when the prototype is coupled on the mains. As
already mentioned, this is done by an opto coupler. The
schematics for this part of the prototype is denoted 3.1 of
figure 3.6. For programming when power is provided by
mains, both jumpers in the circuit of 3.1 in figure 3.6 need
to be cleared. When power is provided by the UART port,
both jumpers have to be set. When the mains is coupled,
the jumpers may never be set. For the second version of
the prototype the opto coupler and the jumpers will be removed. This removes the possibility to debug the prototype when mains is coupled.
The possibility to experiment with the functionality of the
hardware is mainly provided by the modular arrangement
of the first version of the prototype. This modular arrangement was made because, if an error occurred in a part of the
circuit, then only that part (for example the power supply)
needs to be reconstructed. The modules of this arrangement can be seen in figure 3.8.
The first version of the prototype consists of four PCBs. The
first one is the main board (1.1 in figure 3.8), which connects
all the other PCBs. First of all, the main board contains the
socket for the adapter of the MCU (2 in figure 3.8). Furthermore, the programming and debug interface (parts denoted by 6 in figure 3.8) is located on the main board. This
includes connections for the button to put the MCU into
programming mode (6.3 in figure 3.8) and the jumpers to
enable programming the MCU with power over the UART
port (6.2 in figure 3.8). This results in two options to power
the prototype. The first one is to use the power of the programming device via the UART port (6 in figure 3.8). The
second option is to connect a power supply PCB to the main
board using the socket for a power supply (4 in figure 3.8).
3.1 in figure 3.8 is a connection to the Line(L) of the mains,
3.1
Hardware design
which is needed for measurement. Another two connections are needed for measurement. These are the connection to the neutral(N) of the application (3.3 in figure 3.8)
and the connection to the Neutral of the mains (3.2 in figure
3.8), which is ground if mains is connected. The I/O blocks
for the MCU are also located on the main board. 5.1 and 5.2
in figure 3.8 depicts these. Lastly, the analog front end (7 in
figure 3.8) is also situated on the main board. The analog
front end has not been put on a separate PCB as this circuit is the EM773 smartmeter circuit, except for some parts
which are deleted. Therefore it should be possible to be put
to work, without the need to replace a complete PCB.
The second PCB of the first version of the prototype is the
adapter of the MCU (1.2 in figure 3.8). I used an adapter as
I soldered the first version of the prototype completely by
hand. As mentioned before, this was due to that I needed
to experiment with the hardware functionality first, since it
was not completely clear if the changes made to the original circuit of the EM773 would work. The hand soldering
led to some problems with the MCU, due to the package
of the MCU, namely HVQFN33, which has no leads. As I
did not have the possibility to reflow solder at that time, I
used the bonding methodology to connect the MCU to an
adapter. The result can be seen in figure 3.9 on the left. Another advantage of this adapter is that it allows to measure
whether a signal arrives at a pin of the MCU. To connect
the adapter to the main board I used two rows of double
pin headers as seen in figure 3.9 on the right. An advantage
of a removable MCU is that, if other parts of the circuit are
tested, the MCU is safe, if it is removed. Furthermore, it
is of advantage that, if the MCU is broken, the main board
does not suffer from the attempt to solder a new one with
bonding. Circuit paths on a PCB tend to suffer when a joint
on a patch is desoldered.
The third PCB is the PCB of the power supply (1.3 in figure 3.8). This PCB is connected to the main board with pin
headers (4 in figure 3.8). Connections to the main board
are the 3.3V wire and ground. As the main purpose of
the power supply is to transform 230VAC of the mains
to 3.3VDC, on the power supply PCB a connector for the
line(L) of the mains (3.1 in figure 3.8) and the neutral(N)
25
the analog front end
is situated on the
main board
the second PCB is
an adapter for the
MCU
the MCU is bonded
to the adapter
the adapter can be
removed from the
main board for
testing purposes
the third PCB is the
power supply, which
transforms 230VAC
to 3.3VDC
26
3
Creating a small-scale version of PowerSocket
Figure 3.8: The modular arrangement of the first version of the prototype. A
dashed line symbolizes parts of the prototype that are occluded by other parts.
(1.1) Main board.
(1.2) Adapter for the EM773 MCU.
(1.3) Power supply PCB.
(1.4) LED PCB.
(2) Connection of the main board and the MCU adapter, using a socket.
(3.1) Connection for the Line(L) of mains.
(3.2) Connection for Neutral(N) of mains.
(3.3) Connection to the Neutral(N) of the appliance.
(4) Connection between the power supply and the main board, using a socket.
(5.1) Connection using a socket, between the LED PCB and the main board.
(5.2) Free I/O block of the MCU. (6.1) UART port.
(6.2) Pinheaders to put jumpers on when running the prototype on UART power.
(6.3) Pins to put a jumper on to set MCU in programming mode.
(7) Analog front end (on main board).
of the mains (3.2 in figure 3.8), is needed. As can be seen
in figure 3.8, the line(L) and neutral(N) are redundantly
connected, namely, to the power supply PCB and the main
board. With this redundant connection, the power supply
can be tested without being connected to the main board,
eliminating the risk to damage the main board during the
construction and tests of the power supply.
The fourth and last PCB is the LED PCB (depicted in figure
3.8 with the number 1.4). This board needs a connection
to the MCU using the I/O block of the MCU on the main
3.1
Hardware design
27
Figure 3.9: A HVQFN33 MCU bonded on an adapter.
board (depicted by 5.1 in figure 3.8). The connection, between the main board and the LED PCB, is established by
the pin headers on the LED PCB (5.2 in figure 3.8). Furthermore, connections to the 3.3V wire of the power supply and
ground are needed. Both connections are also provided by
the main board, as the main board itself is connected to the
3.3V wire and the ground of the power supply. This concludes the part about the four PCBs of the modular design.
The PCBs need a mechanical and an electrical safe casing.
This is what the next section is about. I will introduce the
casing and illustrate how I ensured mechanical and electrical safety, which are both needed as a small user study
will be conducted with the first version of the prototype.
Furthermore, electrical safety is an important factor when I
experiment with the PCBs of the prototype.
The last PCB is the
LED PCB, which will
show the animation
the PCBs of the
prototype need a
casing, for safety
reasons
3
28
Creating a small-scale version of PowerSocket
Figure 3.10: Integration of the fuse in the circuit and the connections of the wires of
the mains.
(Brown) Line(L) of the mains.
(Blue) Neutral(N) of the mains.
(Green) Ground of the mains.
a fuse is integrated
to prevent serious
damage after a
malfunction of the
prototype
I will start with discussing electrical safety. With electrical
safety I mean the measures taken to avoid consequential damage when a part of the circuit malfunctions or
causes damage to persons during operation. Damage to
persons during operations can be caused by touching a
part of the circuit that is dangerous, for example, touching
the power supply PCB on parts on which the mains is
active. A malfunction of a circuit often leads to a short
circuit. Measures to protect other devices when a device
is short-circuiting is integrating a fuse. This is done in the
first version of the prototype. When the functionality is
tested by using the first version of the prototype and the
system works reliable, the fuse will not be necessary in the
second version of the prototype. Figure 3.10 shows, how
the fuse is integrated into the circuit. The fuse is situated
directly behind the plug of the prototype and cuts of the
line(L) when switched off. When the fuse is turned off, the
complete prototype is switched off. Therefore the complete
circuit behind the plug of the prototype is secured with the
3.1
Hardware design
29
fuse. Afterwards the line(L) branches to the PCBs of the
prototype and the socket of the prototype. The PCBs of
the prototype need the line(L) for measurement and as an
energy supply.
To isolate the circuit of the mains in the prototype, I
constructed a box, in which the fuse, socket and plug of
the prototype are integrated. In figure 3.10 the circuit of
the mains in the box of the prototype can also be seen. As
can be derived from the figure, the neutral(N) is cut of by
the PCBs of the prototype. This is where the current measurement of the appliance connected to the socket of the
prototype is done. Figure 3.11 shows the box containing
the mains circuit of the prototype. On the left side of figure
3.11, you can see the front with the fuse and the socket for
the application. From the appliances plugged in into the
socket the energy consumption will be displayed. In the
middle of figure 3.11, the top side of the box can be seen.
The connections to be PCBs of the prototype are visible,
namely the line(L, brown), the neutral(N, blue), and one
black wire, which connects the neutral(N) of the socket
to the PCBs of the prototype. On the right side of figure
3.11 we can see the back of the box of the prototype. The
plug of the prototype is situated on the back (white plug
with white cable). Furthermore, another electrical security
measure can be seen in this part of the picture, namely, a
ground fault interrupter (black device with two buttons).
This device is coupled between the prototype and the wall
socket. It offers another layer of protection, when a person
touches a wire of the mains in the prototype. When more
then 10mA leak, for example when a person touches a part
of the circuit, this device will terminate the mains to the
prototype.
As we can see from figure 3.11 and know from the above
part of own work, wires and circuits on a PCB containing
high voltages can still be touched by persons. In the
next part I introduce a box that encloses the PCBs of
the prototype. This second box is mounted on the box
containing the mains circuit of the prototype, see figure
3.12 on the left. The cover of this second box is detachable,
therefore experimentation with the PCBs of the prototype
is still possible. It is advised, when experimenting with
the mains circuit of
the prototype is
isolated by a box
a ground fault
interrupter is used as
another layer of
protection against
electric shock
The PCBs of the
prototype are
isolated by another
box
the second box is
mounted on top of
the first
3
30
Creating a small-scale version of PowerSocket
Figure 3.11: The box containing the circuit of the mains of the prototype.
Left, the front of the box with the fuse and the socket for the application.
Center, the top of the box, the cables which connect to the PCBs of the prototype
can be seen.
Right, the back of the box, there the plug (white) breaks out of the box. The plug is
connected to a ground fault interrupter.
A UART port and
button is placed on
the outside of the
box, which enables
programming the
prototype
the PCBs, to use the device seen in figure 3.11 on the right.
Figure 3.12 in the middle, shows the box with its cover
and figure 3.12 without the cover. In the cover there is
a window, which enables watching the animation of the
prototype, although the cover is in place. In the bottom
plate, there is a hole for the cables, seen in figure 3.11 in the
middle. Furthermore, on the outside of the box there needs
to be a button that can switch the MCU in programming
mode and a port for UART. Having these on the outside
of the box has the advantage that the prototype can be
programmed and debugged without the circuit being
exposed. To get the prototype into programming mode,
the red button in figure 3.12 has to be pressed first and then
the MCU has to be reset. This is done by turning the fuse
off and on. To return to normal operation, this process has
to bre repeated.
3.1
Hardware design
31
Figure 3.12: The box containing the PCBs of the prototype.
Left, the box containing the PCBs, with the UART port and programming button,
mounted on the box containing the circuit of the mains.
Center, the top of the box with its cover with the windows for the animation.
Right, the box without the cover, the PCBs of the protoype are visible.
The second box takes responsibility for the mechanical
safety as well. I define mechanical safety as freedom from
damage, caused by moving the prototype. When the prototype is moved it can happen that parts are damaged or
connections get loose. If certain connections (for example
the ground of the power supply) do not work any more, the
prototype can suffer serious damage, when put into operation, eventually rendering it unusable. Mechanical safety
is attained by securing the PCBs with bolts. The circuits of
the prototype should not touch the bottom plate. Therefore,
some distance to the bottom plate should be kept. This is
done by using longer bolts and one nut, on which the PCB
rests on, and another one to secure the PCB in place. When
a nut touches an electrical circuit, a ring of perspex is used
to isolate the nut from the electrical circuit. On the bottom
plate, another nut secures the position of the bolt in a way
that the bolt cannot move down any more. As can be seen
from figure 3.10, the LED PCB is not screwed. This part of
the prototype should be easily replaceable, since other animations, requiring a different PCB, for example a display,
should be able to be tested as well. This concludes the part
of the first version of the hardware prototype. I will now
continue with some benefits of this version of the prototype, which are of advantage for future prototypes which
use appliance level energy measuring.
the PCBs are
secured with bolts on
the bottom plate of
the second box
except for the LED
PCB, which should
be easily replaceable
3
32
3.1.4
the modularity of the
prototype is its
biggest advantage
dangerous voltages
are covered
Creating a small-scale version of PowerSocket
Benefits of the first version of the prototype
In this section I describe other purposes the first version of
my prototype can be used for and what benefits it has. One
first benefit comes from the modularity of the first version
of the prototype. The visualization unit can be replaced and
there are a lot of ports of the MCU yet unused, see figure
C.3. Therefore, this prototype provides a platform to try
out different animations, for example using a display. This
can be done without worrying about the energy measurement unit. Because the power supply is on a separate PCB,
the design of this PCB can easily be altered without influencing the rest of the circuit too much. When a display for
an animation uses 5V, this wire can easily be added to the
design. Another advantage of the first version of the prototype is that most parts of the circuit on which dangerous
voltages can be found are covered and do not need to be
altered, except for the power supply, which might need to
be extended or replaced. The biggest advantage is the use
of SMD parts. This enabled to create a small, low cost PCB
of the complete circuit of the prototype. The small form factor and the low price are both properties that are of benefit
for large scale user studies. This was the last section of the
hardware design, in the next section I will talk about the
software design.
3.2
Software design
In this part of own work, I will describe the software design
of the prototype. The software between the two intended
versions of the prototype does not vary. In this section I
first describe the software architecture and what it is based
on. Afterwards I explain how to configure programs to program and debug the prototype. This includes how to set up
the programming environment. Lastly I will indicate some
advantages this software architecture has.
3.2
3.2.1
Software design
33
Software architecture
As basis for the software architecture the software on the
EM773 smartmeter is used and the animation of PowerSocket [Heller and Borchers, 2011] is used as a reference for
the animation of this prototype. I will start with describing
what part of the software of the EM773 smartmeter I use.
This can be seen in figure D.1, which is a module diagram.
The modules that have been painted red, belong to the
EM773 smartmeter SDK. The EM773 SDK can be found in
Appendix A.
As basis for the
The modules from the EM773 SDK, that I have used
includes the system files for the EM773. The system
files are contained in the packages CMSIS and SYSTEM.
CMSIS is a package that contains general defines and
operations for a cortex M0 core. In SYSTEM, the interrupt
vector and EM773 specific defines are contained. Using
the system EM7xxx module, the clock of the MCU can
be configured. The most prominent properties of the
clock, are its source and its frequency. As I have used
an external oscillator, this has to be set in a define in
the system EM7xxx module. The clock frequency can be
configured in the app config module, which is situated
in the APP package. These clock settings can then be put
to work by calling the SystemInit() function of the
system EM773 module. This sets up the basics of the MCU.
the cortex M0 system
As we want some devices attached and to be able to use the
ports of the MCU, it would be convenient to have drivers
for them. The devices used for the prototype are the ports
of the MCU, UART and the LED driver. The drivers for
these devices are situated in the package DRIVERS. As
can be seen from figure D.1, the EM773 SDK contains the
drivers for UART and the drivers for the ports of the MCU.
The drivers for the ports of the MCU are provided in a sub
package called GPIO. As the LED animations stem from
PowerSocket, the EM773 SDK did not have support for an
LED driver. Furthermore, there was no driver available for
the TLC5947 I have used. Therefore, I have constructed the
driver for the LED driver myself. Details concerning this
driver of the LED driver will follow later.
animation, the
animation of
PowerSocket is used
modules from the
EM773 SDK are
used
modules are used
from the SDK
it takes care of the
clock settings of the
MCU
the SDK contains the
drivers for UART and
the GPI/O ports
3
34
the UART driver is
used by calling an
init function first and
calling the
corresponding
functions for sending
and receiving
two modules are
used to control the
GPI/O pins
from both modules
the init method
should be called
with the module pcb,
the function of a pin
can be set
the module gpio
takes care of
handling the GPI/O
pins
Creating a small-scale version of PowerSocket
When the UART is used, it first has to be configured.
This is done by calling Ser Init(config). In this
function, config is a parameter that is a struct of type
uart config t. How config looks like this can be seen
in figure D.1. The parameter config passes the UART
configuration, containing information about the baud rate,
data bits, stop bits and parity bits. Once the UART is
initialized, the functions Ser WrStr(tx str) to send and
Ser RdStr(rx str, count, stop char) to receive,
can be used. The parameter tx str is a pointer to a
uint8 t. This is the string to be sent. The first parameter
for receiving, rx str is of the same type. The data received
is stored in the variable that the pointer points to. Data is
being read from the UART port until count-1 characters
are received or the stop character, which is defined by the
parameter stop char, is received.
To control the pins of the MCU, two modules are available.
The module pcb allocates a pin and sets its function. Before
any allocation is done, it is advised to run pcb init(),
which sets all pins to unallocated. When initialization
is done, the function pcb alloc(portpin, func,
mode) can be called to allocate a port and set its function.
The parameter portpin is the pin of the MCU to be
allocated, func defines the function to be set and mode
passes the pullup resistor mode. To free a pin of a port,
pcb free(portpin) can be called. The pin denoted by
portpin is then unallocated. The module gpio enables
pins of the MCU to be used as GPI/O pins. Again, before
any pin can be used as GPI/O pin, an initialization function
needs to be called, this is gpio init(). If a pin should be
used as GPI/O pin, it first needs to be allocated as such.
This is done by gpio alloc(portpin, mode, dir).
The pin to be allocated is defined by portpin, mode sets
the pullup resistor mode and dir sets the pin to be either
an input or output. By calling gpio chdir(portpin,
dir), the function of the pin denoted by portpin can
either be switched to input or an output. If a pin is an
output, gpio set(portpin) can be used to set the pin, to
a logical one and gpio clr(portpin) sets it to a logical
zero. The function gpio getval(portpin) can be used
to read the value at the pin expressed by portpin. When
3.2
Software design
35
a GPI/O pin is not needed anymore, it can be unallocated
with the function gpio free(portpin).
To make use of the metrology engine of the EM773,
the EM773 SDK contains a module that controls
this engine.
Before using the metrology engine, it
first needs to be configured. This is done by calling
metrology init(AHBClkFrequency, Fmains),
which needs the clock frequency (AHBClkFrequency)
and the frequency of the mains (Fmains). If Fmains is
set to EM AUTO, the mains frequency is detected automatically and returned as the result of the initialization
function. The second step of the configuration is to call
metrology set ranges(ranges). How the parameter
ranges is used, is extensively explained in the user
manual of the EM773. Before any metering data becomes
available, the metrology engine has to be started. This is
done with metrology start(). To stop the metering,
metrology stop() can be called. To obtain metering
data from the metrology engine the function metrology read data(metrology result) has to be used. This
function writes the metering data into the variable pointed
at by the pointer parameter metrology result, if metering data is available. The function returns whether reading
metering data was successful or not. This concludes the
part, in which I describe the modules I used from the
EM773 SDK. In the next part I will talk about the modules
I have added myself.
To refresh the data from the metrology engine in a certain
time interval and to make it available, I added the module
metering to the package METROLOGY. The functionality
of the refreshing is based on a timer. The used timer is
configured to count milliseconds. An interrupt is fired
and the counter resets, when the counter reaches the value
of the define METERING INTERRUPT FREQUENCY. The
corresponding ISR reads out the data using the function
metrology read data(&metering result).
The metering data is then available in the
The
function
variable
metering result.
Initialise Metering() handles the configuration
of the complete metering system. This includes calling the
functions metrology init(AHBClkFrequency,
the module
metrology can be
used to control the
metrology engine
init functions must
first be called before
use
after starting the
metrology engine, its
data can be read
with a read method
I wrote a module that
makes sure update
metering data is
available
the init function of
this module, takes
care of the complete
initialization of the
metrology engine
3
36
Creating a small-scale version of PowerSocket
Figure 3.13: In this figure the ring buffer of the driver of
the LED driver is shown. Noticeable is the difference of
movement between the two pointers.
After calling the init
method, constantly
updated metering
data is available in a
variable
I had to write the
driver of the LED
driver myself
the driver uses a ring
buffer
the write pointer
moves with bigger
steps through the
buffer as the send
pointer
and
Fmains),
metrology set ranges(ranges)
metrology start() from the module metrology. Furthermore, the initialization function calls the function that
sets up the timer. After the Initialise Metering()
function is called, the variable metering result can be
used to access the up to date energy measurement values.
Another module I have, as already mentioned, constructed
myself, is the driver for the LED driver. This driver uses
a ring buffer to store the data to be sent. This ring buffer
has the size of one configuration of the LED driver. One
configuration means the information (brightness of the
LEDs) for every port of the LED driver that drives an
LED. This has the advantage that a configuration cannot
be distorted before it is being used by the LED driver and
data for a complete configuration can be calculated in
advance. In figure 3.13 we can see how this ring buffer
works. The ring buffer consists of 24 cells, which contain
the twelve bits that set the brightness level of the LEDs,
that are connected to the LED driver. The write pointer
marks the cell that is written last. This means the write
pointer moves in steps of twelve bits through the ring
buffer. The main reason for this is that the driver of the
LED driver has the brightness of one LED as input. The
send pointer, in contrast to the write pointer, moves only
one bit per step. This is because the connection to the
3.2
Software design
LED driver is a serial connection, and therefore only one
bit can be sent at a time. The last bit sent to the LED
driver is denoted by the send pointer. To start using the
driver of the LED driver it has to be initialized. Which is
done by setting the define UPDATES PER SECOND, which
sets the number of complete new configurations the LED
driver can achieved per second, and calling the function
Initialise LED Driver(). This function first sets the
pins of the MCU accordingly. Four total pins are needed.
One pin provides a clock signal, one pin the data signal,
another pin disables the LEDs and the last pin accepts a
received configuration. After the pin allocation is done,
the initialization function clears the ring buffer by filling
it with zeros. Afterwards a timer, that fires an interrupt
on two matches, is configured. One interrupt is used to
toggle the clock pin, the next one sends a bit or applies a
configuration to the LED driver. The driver of the LED
driver keeps sending one bit at a time until the last bit of
the cell, that was lastly written, has been send. If the last
bit of the last of the ring buffer is sent, the then received
configuration at the LED driver is applied. After the timer
is activated, the initial content of the ring buffer is sent to
the LED driver and applied. This sets all brightness levels
of the LEDs to zero.
The core part of the LED driver is sending single bits, this is
done automatically, as already mentioned, by using a timer
interrupt. The LED driver keeps sending until the send
pointer reaches the write pointer of the ring buffer. When
the write pointer is reached, the sending is paused, as there
is no more data available. When the last bit of the last cell
of the ring buffer is sent, which means that a full configuration is received at the LED driver, the configuration
is latched and put in use. This is done by first disabling
the LEDs, by setting the corresponding pin to high, which
reduces flickering in the animation. Afterwards the pin
that accepts the received configuration (latch) is set to
high. Then both pins are set to low in reversed order. The
reverse order ensures that the LEDs are activated after the
received configuration is put to use. As can be concluded
from the last paragraph, the driver deals with all necessary
communication to the LED driver. Therefore, the programmer does not need to worry about it. He only needs to
37
an init method should
be called to initialize
the driver
3
38
Creating a small-scale version of PowerSocket
Figure 3.14: The rotating animation of PowerSocket, which
change color based on the energy consumption.
Left, low energy consumption.
Middle, a medium level of energy is consumed.
Right, high energy consumption.
the input of the driver
are the bits that
define a brightness
level of one LED
the module
animations, makes
sure exactly one
animation runs at a
time
fill the buffer with new data. Filling the buffer is done by
calling the function Write LED To Buffer(ledbits).
This function needs twelve bit as input, which define the
brightness of one LED. The bits passed in the parameter of
the function are then put in the next available slot and the
write pointer is moved one cell (twelve bits) further. The
function returns a write fail if the function is called, if the
buffer is full. When the writing of the bits into the buffer
succeeded, the function returns a write success.
A package I completely wrote myself is the package that
deals with the animations. This package consists of two
parts. One module is the interface of the animations. The
other part of this package are the modules that define
the animations themselves. The module which is the
interface to the animations is called animations. It makes
sure that an animation is running. In the first version of
the prototype this is realized by defines. However, it is
thinkable to extend the prototype with a button or switch,
which can be used to switch animations at runtime. This
can be useful for a prototype used during a user study.
The Energy Aware Clock [Broms et al., 2010], had such a
system to change the animation. The interrupt that causes
the change of animation by button press will be handled in
the animations module. Furthermore, this module is then
responsible to change the animation accordingly.
3.2
Software design
The other part of the package ANIMATIONS, are the animations themselves. For the first version of the prototype,
I have decided to mimic the animation of PowerSocket
[Heller and Borchers, 2011]. The animation of PowerSocket
can be seen in figure 3.14. It shows the consumption at low,
medium and high consumption levels. The animation is a
rotating animation, which increases speed once the energy
consumption increases. Furthermore, it changes the color
at certain consumption thresholds from green to orange
to red, to indicate whether low, medium or high energy
consumption is at hand. In my implementation, the update
rate remains constant. I define the update rate as the rate
a complete configuration is activated per second at the
LED driver. In other words, the update rate is the rate of
which the brightness of all LEDs change per second. I have
achieved the speed variation by changing the number of
phases. The main idea is that one LED in the LED ring has
a full brightness level. This specific LED rotates around
the LED ring. The configurations activated between the
brightest level being at a specific LED and moves to the
next LED are the phases. I define the movement of the
brightest LED to the next LED as a period. At low RPM
(rotations per minute), more phases are needed then a
high RPM, because a lower RPM has a longer period
then a higher RPM. This helps making the animation
smoother. At higher RPM, less phases are used, but this is
not noticeable, as the rotation speed is higher. The color of
the animation changes at certain thresholds, set by defines.
The animation reads out the energy usage from the metering module, and decides which color to use, depending on
the thresholds. Furthermore, the module then calculates
which RPM corresponds to the energy usage at hand.
This is done with the formula rpm = rpm Per Watt
* metering result.P;. rpm Per Watt depends on
defines and is defined as const float rpm Per Watt
= ((float)(MAXRPM)-MINRPM)/
(float)(POWERMAXTRESHOLD-POWEROFFSET);.
RPM range
Coarse, the formula looks like energy usage range (Watt) .
When the RPM has been calculated, the phases
needed per period to achieve this RPM can
be calculated.
This is done by phases =
(int)((float)(UPDATES PER SECOND*60)/
((float)(rpm*(LED OUTPUTS/OUPUTS PER LED))));.
39
the animation shown
by the prototype is
an imitation of the
animation of
PowerSocket
in every iteration of
the main loop of the
animation, the RPM
is determined
depending on the
current energy
consumption in Watt
furthermore, the
color of the
animation changes
depending on energy
consumption
thresholds
3
40
Creating a small-scale version of PowerSocket
Figure 3.15: The animation of the prototype, mimicking the
animation of PowerSocket shown in figure 3.14.
The defines used in this formula are from the modThis means a phase is defined as
ule led driver.
Updates per minute
Afterwards the brightness level of
RPM * number of LEDs .
every LED used in the animation can be calculated for
a phase. Figure 3.15 shows the result of the prototype
mimicking the animation of PowerSocket shown in figure
3.14.
the rotating
animation can be
configured by setting
defines
by calling the Metering Animation Rotation()
function, the
animation gets in its
main loop
Before using the rotating animation it can be configured.
This is done by setting certain defines. MINRPM and
MAXRMP determine the RPM range, by setting its minimum and maximum value. The define POWEROFFSET
determines from which energy usage the animation starts.
This define can be used to make sure no animation is
shown, when no appliance is plugged in. The defines
POWERMEDIUMTRESHOLD and POWERHIGHTRESHOLD can
be used, to determine on which energy usage level the
animation switches its color from green to orange and from
orange to red. POWERMAXTRESHOLD defines the energy
usage level on which the animation shows the highest
consumption. More energy usage than defined by this
threshold will not result in a change of the animation.
The animation is started after configuration by calling
Metering Animation Rotation(), which should be
done in the module animations. This function starts the
main method of the animation. In this main method the
RPM, phases and brightness of the LEDs are calculated as
described in the previous paragraph. When the brightness
of A LED is calculated it is send to the driver of the LED
driver by the main method of the animation. With the
description of the animation, the end of the software
3.2
Software design
41
architecture part of this work is reached.
3.2.2
Programming and debugging the prototype
I will now give a short guide on how to program and debug the prototype. First of all an UART cable has to be
connected to the prototype and the computer, which will
program the prototype. The ground of the UART cable is
mounted on the left side of the UART port of the prototype, visible in figure 3.12 on the left. Afterwards Flash
Magic2 has to be downloaded and run. Figure E.1, shows
a screen shot on how to configure flash magic for programming the prototype. In step 3, a path to a hex file should be
defined. The hex file is found in project/debug/exe. Opening the program in IAR EMbedded Workbench3 is done by
opening the work space file in the root folder of the project.
This file is Energy-meter.eww. For debugging, Terminal4 is
used. A screen shot containing the setting to configure terminal to communicate with the prototype can be found in
figure E.2. ReScan can be used to discover the COM(UART)
ports of the computer. This COM port should correspond to
the COM port assigned to the UART cable. Before anything
can be received, the connect button needs to be pressed.
3.2.3
Benefits of the software design
Like during the hardware design, the programmer does not
need to worry about the metering part, as the metering results, that become available in the metering module and get
updated automatically, can be used. Hence the programmer only has to worry about the app, in this case, usually
an animation, the programmer wants to program. Furthermore, as the hardware design is modular, the prototype can
be extended by a wireless unit. The design of the PCB for
a wireless unit is already available from the EM773 SDK.
The driver for the wireless unit is available in the SDK too.
2
as drivers are
already available,
only an application in
most of the cases
needs to be written
http://www.flashmagictool.com/download.html&d=FlashMagic.exe
http://supp.iar.com/Common/ProtectedDownload.asp?key=7WIBVKVG6Q%2C4681686&protocol=HTTP
4
https://sites.google.com/site/terminalbpp/Terminal20130116.zip?attredirects=0
3
42
3
Creating a small-scale version of PowerSocket
By extending the prototype, with a wireless unit, a combination between the two classes mentioned in chapter 2 can
be made. The unit on the socket displays the current energy usage, the data from the wireless unit and from the
main fuse can be used to make a detailed breakdown of the
energy usage of the devices.
43
Chapter 4
Evaluation
In this section, I will describe a user study that tries to asses
the performance of the animation of PowerSocket. With
performance is meant, how well a user is able to estimate
energy consumption based on the animation. This user
study was intended to be conducted in two steps. In the
first step, the just notable difference (JND) of several ranges
of the prototype will be assessed. In the second step, I will
create energy consumption classes based on the results in
step one. In the user study associated with the second step,
the user then has to classify in which class a certain energy
consumption belongs to. In this way, the accuracy of the
energy usage classes and the animation will be measured.
In this work, only the result of the first step is presented. As
can be seen in chapter 3.2.1, the RPM of the animation correlates linearly to the energy consumption in Watt. Therefore, the energy consumption in Watt, will be used to indicate the speed of the animation of the prototype.
In the first step, a broad classification of energy consumption had to be made. This was done by building classes
with a span of 200 Watt, through the complete range (0
Watt to 2200 Watt) and then broadly determining the JND
of these classes. At 2200 Watt (most household appliances
do not use more than 2200 Watt), the animation reaches its
highest speed, therefore no change in speed will be noticeable for values beyond 2200 Watt. At 2200 Watt, the animation has a speed of 300 RPM and at 1 Watt (starting thresh-
a user study is
conducted to find the
just noticeable
difference of ranges
in the animation
first, a broad
classification based
on a pilot study was
made.
4
Figure 4.1: The detection rate of the tested JND in the energy consumption classes.
44
Evaluation
45
old), the animation speed is 0.15 RPM. When the JND of a
consecutive class was much higher (more then double), the
former class is splitted into two classes and the JND of the
higher range (class) is determined. The broad classification
with their JNDs is displayed in table F.1.
From this broad classification, the user study of the first
step could be designed. In the user study, presented in
this work, a sequence of animations running at a certain
speed is shown. The sequence is randomly programmed,
but changes speed accordingly to JNDs of all the classes
of the broad classification. The sequence is random in a
sense, that JNDs of a certain class are rarely tested consecutively and the class from which the JNDs are tested is
randomized. Speed changes that do not contain any useful
speed differences are integrated as well to reduce the predictability. Furthermore, the intervals between the speed
differences of the sequence are randomized as well. This is
done to cancel out a learning effect. To furthermore make
the user less aware of an incoming change, the sequence is
hard coded on the MCU. As soon as the observer initiates
a speed change, this could hint at an oncoming change. By
the time the user observes a speed change, he has to tell the
observer whether it was a speed increase or decrease. The
observer is acknowledged of the speed change by the MCU,
as it sends a message that the speed of the animation has
changed to the computer of the observer. Furthermore, the
number of the actual speed change is send to the observer.
This information is not visible to the user. The observer
has to make notes whether the user recognized the speed
changes correctly. This is done on a form that should not
be visible for the user. Otherwise, this could influence the
user, as he can see whether he or she already missed some
speed changes. To cancel a learning effect, a user gets the
sequence in its original order or backwards. It will be divided such that user n gets the original sequence and user
n+1 the sequence backwards and so forth. This way, the
original order and the backwards order is altered for consecutive users. This is done at runtime by pressing the red
program button seen in figure 3.12 on the left. Pressing the
button has only effect when a running user study is ended.
During a study, the button press is ignored. When a user
study is ended, the animation is turned off. It can be started
from this broad
classification, the
user study was
designed
it consisted of a
sequence of speed
changes
in the sequence
speed jumps where
encoded which
represented a JND
the sequence was
randomized and
speed jumps not
representing a JND
were mixed in
the task of the
participants was to
recognize the speed
jumps
this resulted in how
often a JND was
recognized in a
range
4
46
Evaluation
again in the reverse order by pressing the red program button. The participants are unable to pause the test.
Thirteen users participated in the user study. Twelve of
them were male and one was female. The age of the participants ranged from 22 to 58. The mean of the age of the
participants was 31. None of the participants were color
blind. The results of the user study can be found in table
F.2. Figure 4.1 shows a bar chart of the relative detection
rate of the JNDs.
JNDs 2-5 belong to
the range 0 to 10
JNDs 10 to 15
belong to the range
10 to 25
JNDs 25 to 35
belong to the first
half of the range 100
to 200 and 35 to 40
in the last part of the
range
In the range from 0 to 25 Watt, almost no JND is recognized.
Both JNDs recognized in this range have a detection rate of
8%. This is probably caused by the JNDs which are tested
in the middle of the range and the JND of 10 on the end
of the range. To examine the JND of this range more precise, it is advised to split the range. As a JND from 2-10 will
probably be recognized in a range from 0 to 10. Regarding
the range from 25 to 50, we can see from the results, that
the JND is probably between 10 and 15. According to the
results the JND of the range 50 to 100 is between 15 and 25.
In this case, 15 and 20 are values in the start of the range
and 25 is a value on the end of the range. This would suggest that the JND of the range 50 - 100 is about 15 to 20 and
from the range 75 - 100 about 20 to 25. These JNDs needs to
be verified in a next user study.
In the ranges from 100 to 200 and 200 to 300, the tested
JNDs are probably too low for the area for which they are
tested, as the detection rate for the JNDs of both ranges is
not higher than 38%. The JNDs 20 to 25 of range 100 to 200
is tested in the middle of the range. The JNDs of its predecessor class rather suggest that the JND is above 25 for the
start of the range 100 to 200. The JNDs 30 to 35 are tested in
the last part of this range, which would explain why they
are missed rather often (they only have a detection rate of
15%). For a next user study, the JNDs 25 to 35, should be
tested in the start of the range. In the range 200-300 the
JNDs 35 and 40 are tested in the first half of the range. They
are hardly recognizable (30% and 15% recognized) in this
range, which would suggest they should rather be tested in
the last half of the 100 to 200 range and the 100 to 200 range
should be split. As the JND 35 and 40 would rather fit in the
47
last half of the range 100-200, the JND belonging to the first
half of the range 200-300 will be bigger than 40. The JNDs
50 and 55 are tested in the beginning of the range 300 to 400,
and are rather hardly recognized (detection rate of 46% and
38%). This is supported by the fact that the JNDs 60, 65 and
70, which are tested in the last part of the range, are hardly
recognized (detection rate is not higher than 23%), too. This
suggests that the JNDs 50 and 55 rather belong to the last
part of the range 200 to 300. In a next study, the JNDs 45 to
50 should be tested in the first half of the range 200 to 300,
and JNDs 50 and 55 in the last half of this range.
As already mentioned in the last paragraph, the JNDs
tested in the range 300 to 400 would probably be too low.
According to the last paragraph, JNDs of over 55 should
be tested for the first half of this range. In the range 400 to
600 the JNDs 70 and 80 are already hardly recognizable (detected by 15% and 38%) in the first and middle part of this
range. This would suggest that they are JNDs which belong to the last part of the range 300-400. For the range 300
to 400 we now have a list of JNDs to be tested, which start
with 55 and goes up to 80. The JND 80 in range 400-600 is
slightly recognizable (38%) in the middle of the range, this
would suggest to test the JND range of 80 to 90 in the first
half of this range. In the range 600 to 800 the JNDs 80 and
90 are barely recognizable (recognized by 30% and 15%) in
the first half of the range. This strengthens the assumption
that they belong to the first part of the 400-600 range. For
the last part of the 400-600 range, JNDs from above 90 to 110
should be tested. These JNDs are slightly recognized with a
recognition rate of 15% in the last part of the 600-800 range.
As a JND of 80 is already somewhat recognized (with 30%)
in the beginning of the range 600-800, JNDs beginning from
100 should be tested in the first half of this range. The JNDs
100 and 110 are tested in the middle part of the 800 to 1000
range. They are barely recognized (detected by 23% and
15%) in this part of the range. This would suggest that these
JNDs are candidates for the last part of the 600 to 800 range.
JNDs 45 and 50
belong to the first
part of the range 200
to 300 and 50 to 55
to the last part of the
range
the JNDs belonging
to the range 300 to
400 are 55 to 80
JNDs belonging to
the 400-600 range
are 80 to 90 for the
first half and 90 to
110 for the second
half
4
48
the JNDs 110 to 130
belong to the 800 to
1000 range
the JND of range
1800 to 2000 is
between 190 and
200
170 to 190 are fitting
as JNDs for the
range 1600 to 1800
the JNDs for the
range 1400 to 1600
are 160 to 170
for the range 1200 to
1400 the JNDs are
140 to 150 for the
lower part and 150 to
160 for the higher
part
130 to 150 are the
JNDs of the range
1000 to 1200
Evaluation
110, 120 and 130 are barely recognized (detection rate is
lower then 24%) in the range 1000-1200, which would suggest that they belong to a prior range. This is strengthened
by the fact that the JND 120 is somewhat recognized (38%)
in the first part of the 1200-1400 range, but in the higher
part the JNDs 130 and 140 are barely recognized (both detected by 15%). Therefore, the JNDs 110 to 130 should be
tested in the 800 to 1000 range. As 130 and 140 are not recognized very well (a detection rate of 38% only) in the first
part of the 1400 to 1600 range and 150 is not recognized at
all, these JNDs will probably still be too low for this range.
In the next class (1600 to 1800), rather low JNDs are recognized. This can be explained that at 1600, the animation
changes color to red, which was a very bright color. We can
see that 170 is recognized (with 54%) as well. I assume that
this value is a more correct value, as it would fit to the fact
that the JND of the next class is between 190 and 200 (detection rate of 62% and 53%) and the JND of the last class is
over 200.
With this information, I can now interpolate the JNDs of
the ranges from 1000 to 2000. For the range 1800 to 2000,
the JND will probably be, as already mentioned, between
190 and 200. From this, I can conclude that a JND between
170 and 190 is most fitting for the range 1600-1800. As 160
and 170 are recognized (23% and 54%) in the last part of
the range 1600-1800 these JND are candidates for the range
1400 to 1600. This is furthermore strengthened, as 150 still
seems to be on the low end for this range. Although, 150
should be recognizable at the beginning of the range 1400
to 1600. This makes a JND between 150 and 160 candidate
for the higher part of the range 1200 to 1400. For the lower
part a JND between 140 and 150 should be recognizable, as
130 and 140 are already somewhat recognizable (detection
rate of 15%) in the higher part of the 1200 to 1400 range and
120 is recognizable (38%), although not very good, in the
first part of the range. For the range 1000 to 1200 a JND between 130 and 150 should be tested. This is in accordance
with the results as 130 (recognized by 23%) is still too low
for the higher part of this range and 110 (recognized by 23%
as well) is too low for the lower part. This concludes the
analysis of the test result of the first step of the user study.
49
Although, the results already hint at some JNDs for ranges,
the JND of some ranges can only be coarse determined.
By interpolating, a better insight in possible JNDs for a
range can be obtained. These interpolations needs to be
checked in a further user study. During the user study, almost all participants found the change of color in the animation distracting. As some jumps in JNDs can be noted,
after a change in color (these happened at 1000 and 1600),
this would indicate that the change in color influenced
the result. This suggests disabling a color change for the
next user study, which should confirm the interpolations I
made. These interpolations can be used to construct energy
consumption classes. The span of these classes should be
longer then the JND of the range the class is in. This ensures that the class is recognizable.
using the JNDs,
energy consumption
classes can be
constructed
51
Chapter 5
Summary and future
work
5.1
Summary and contributions
We have seen, that there were some approaches to eliminate the Watt indicator from energy measurement devices.
What never have been addressed is the question whether
these different approaches truly lead to more awareness
of energy consumption, in contrast to conventional energy
measuring devices using Watt or kWh as an indicator. In
this work I argued, that a large scale user study to address
this question of awareness would have been hard with the
prototypes introduced in those works that ipresent an alternative visualization. From this argumentation, some
properties for prototypes used during large scale user studies are discovered. When a prototype encompasses these
properties, it will be more suited to conduct a large scale
user study with it. In this work I have proposed a prototype, that tries to encompass these properties. The main
idea was, to combine PowerSocket [Heller and Borchers,
2011], an appliance level measuring device, with the EM773
smartmeter in a device from Ikea, seen in figure 3.1. In this
work only a prototype is introduced that tests the functionality of this design, with exception from the energy measurement circuit, which is not functional during the time of
5
52
Summary and future work
this work. This prototype, when the energy measurement
circuit works, can be used as a debug platform for future
appliance level measurement prototypes. It is particularly
suited as debug platform, because of the modular design
of the prototype. The visualization unit can be easily replaced, the power supply replaced or extended and other
periphery can be coupled on the ports of the MCU that are
still free. The software which is extended in context of this
work annotates the prototype as debug platform. As the
programmer only has to write a driver for his or her extra attached periphery, visualization unit and application
(animation) itself. The data from the measurement unit is
made available and refreshed in constant time intervals, so
the programmer does not have to worry about the measurement part. Furthermore, drivers for UART, GPI/O ports, a
wireless transmitter and I2 C are already available.
Lastly, a user study is conducted in this work, that assesses
the performance of the rotating animation of PowerSocket.
This is done by first finding feasible energy usage classes
and then check whether participants can classify devices
accurately into these energy usage classes. The first part
of this study is presented in this work. Although a precise
classification of energy usage classes was not possible with
the results of this study, the study strongly hinted to the
ranges of the JNDs possible for an energy usage class.
5.2
Future work
The user study presented in this work, is divided into two
steps. Only the first of the steps has been completed. In this
first step, interpolations had to be made of JNDs of energy
consumption classes. Although this first step gives already
a good indication what the JNDs are, this still needs to be
confirmed in a next study. In the second step, there will be
checked whether users can classify appliance accurately in
the energy usage classes identified in step one. In this second step, it would be beneficiary when the energy metering
unit of the prototype, introduced in this work, would work.
Getting the energy metering unit to work, would therefore
be the next logical step after this work. When the circuits of
5.2
Future work
the prototype are fully functional, then the prototype still
has to be minimized. The minimization would result in the
second version of the prototype. Although minimizing of
the prototype with the PowerSocket animation would only
be sensible, when the second step of the user study, has
positive results. When the second step of the user study
provides positive results and the second version of the prototype is constructed, then a large scale user study can be
conducted that tries to prove that energy meters that avoid
using Watt and kWh lead to more awareness then those that
only display Watt or kWh. Afterwards some experimentation can be done, by extending the prototype with a wireless transmitter. This would result an a combination of the
appliance level and residential level metering class.
53
55
Appendix A
The development
environment of the
prototype
In this section I provide links to the development environment I have used to program my prototype.
The first link is a link to the program I constructed my
schematics and board layout of the prototype with.
Eagle light edition1
The second link contains the SDK of the NXP EM773. In
this SDK drivers for the EM773 can be found, as well as an
example project in IAR embedded workbench. Documentation for the EM773 is in the SDK too. The hardware design for the EM773 based smartmeter is in the SDK as well.
EM773 SDK2
The third link is a link to download the IDE with which the
EM773 can be programmed.
IAR EMbedded Workbench kickstart edition3
1
ftp://ftp.cadsoft.de/eagle/program/6.5/eagle-win-6.5.0.exe
http://www.nxp.com/documents/other/EM773 SDK Setup.exe
3
http://supp.iar.com/Common/ProtectedDownload.asp?key=7WIBVKVG6Q%2C4681686&protocol=HTTP
2
A
56
The development environment of the prototype
The fourth link contains a download link to the program
with which I programmed the EM773 MCU using UART.
Flashmagic4
The last link provides a download link to a program with
which I debugged my software using UART.
Terminal5
4
5
http://www.flashmagictool.com/download.html&d=FlashMagic.exe
https://sites.google.com/site/terminalbpp/Terminal20130116.zip?attredirects=0
57
Appendix B
Reference schematic of
EM773 smartmeter
In this Appendix, the reference schematic of the EM773
smartmeter is shown. Figure B.1 depicts the analog front
end of the EM773 smartmeter, used by the metrology engine of the EM773 microcontroller. In figure B.2, the power
supply of the EM773 can be seen. Figure B.3 shows the
EM773 microcontroller with all the periphery of the EM773
smartmeter attached. This includes switches and the control of the relay. In figure B.4 we can see the wireless transmitter the EM773 smartmeters use, to transmit data to a
central hub.
58
B
Reference schematic of EM773 smartmeter
Figure B.1: The analogue front end of the EM773 smartmeter.
59
Figure B.2: The power supply of the EM773 smartmeter.
60
B
Reference schematic of EM773 smartmeter
Figure B.3: The EM773 microcontroller with some periphery attached.
61
Figure B.4: The wireless transmitter of the EM773 smartmeter.
63
Appendix C
Schematics of the
prototype
C.1
Schematics
In this part of the Appendix the schematic of the prototype, introduced in this work, can be seen. Figure C.1 depicts the power supply of the prototype. It is based on the
viper22a1 , which is a switching mode power supply. As
a reference board the STEVAL-ISA035V12 is used. To get
the required 3.3V a linear regulator is used, coupled on the
output of the SMPS circuit. The linear regulator used, is the
LD1117S33CTR3 . The bill of material for the design of this
power supply can be found in Table C.1.
In Figure C.2 the schematic of the analog front end of the
prototype, presented in this work, can be seen. Table C.2
shows the bill of materials used to construct this part of the
circuit.
In figure C.3 the schematic with the MCU EM773 and some
periphery around it can be seen. The EM773 microcontroller used in the schematic has a user manual4 and a
1
http://www.st.com/web/en/resource/technical/document/datasheet/CD00087939.pdf
http://www.st.com/web/en/resource/technical/document/application note/CD00159053.pdf
3
http://www.st.com/st-web-ui/static/active/en/resource/technical/document/datasheet/CD00000544.pdf
4
http://www.nxp.com/documents/user manual/UM10415.pdf
2
C
64
Schematics of the prototype
datasheet5 . Table C.3 shows the bill of materials for these
parts of the circuit.
Figure C.4 shows the LED PCB. The main part of this board
is the LED driver TLC59476 from Texas Instruments. I have
used the L59EGW-CA7 LED from Kingbright for the LED
circle of the LED PCB.
5
http://www.nxp.com/documents/data sheet/EM773.pdf
http://www.ti.com/lit/ds/symlink/tlc5947.pdf
7
http://www.kingbright.com/manager/upload/pdf/(1366958416)L59EGW-CA(Ver.16A).pdf
6
C.1
Schematics
65
Figure C.1: The schematic of the power supply of the prototype introduced in this
work.
66
C
Schematics of the prototype
Figure C.2: The schematic of the analog front end of the prototype introduced in
this work.
C.1
Schematics
67
Figure C.3: The schematic of the MCU of the prototype introduced in this work
and some periphery around it.
68
C
Schematics of the prototype
Figure C.4: The LED PCB I designed.
C.2
Bill of material
C.2
69
Bill of material
The following conventions have been used for all bills of
material in this appendix. The component number references to the component number in the schematic. The required part describes the properties the part needs. The
placed part is the manufacturer code of the part I placed on
the PCB of the prototype proposed in this work.
C.2.1
Power supply
Component number(s)
Cx
C1, C2
C3
C4
C6
C7
C8
C9
Dz
Dz1
D1, D6, D8
D5
L0
L1
R0
R1
U1
U2
Required Part
0.022µF, 50V, X7R
10µF, 400V, 105C
4.7µF, 25V, X7R
0.47µF, 25V, X7R
47µF, 50V, 105C
0.1µF, 1KV, X7R
100⌫F, 16V, X7R
10⌘F, 6.3V
12V, Zener
16V, Zener
1KV, 1A
600V, 1A, Ultrafast
470µH, 140mA ISat
1mH, 300mA ISat
10⌦, 1W, 5%
1K⌦, 1W, 10%
Viper22A-E
LD1117S33
Placed part
C0805C223K5RACTU
ECA-2GHG100
C3216X7R1E475K160AC
C2012X7R1E474K125AA
AFK476M50X16T-F
GRM55DR73A104KW01L
CC0805KRX7R7BB104
JMK212B7106KG-T
BZT52C12-7-F
BZT52C16-7-F
S1M-13-F
STTH1R06A
5300-33-RC
RCH895NP-102K
PNP1WVJT-52-10R
MCMR12X102 JTL
VIPER22ADIP-E
LD1117S33CTR
Table C.1: The bill of material for the power supply of the proposed prototype.
C
70
C.2.2
Component number(s)
C1
C2
C3
C4, C6
C5
C7, C8
R1, R2, R3, R4, R5, R6
R7, R14
R8
R9
R10
R11, R12
R13
R25
IC1
Schematics of the prototype
Mainboard
Required Part
15⌘F, 16V, ±10%
1.2⌘F, 25V, ±5%
56pF, 50V, ±5%
220⌘F, 10V, ±10%
10µF, 6.3V, ±10%
47µF, 10V, ±10% Tantal
270K⌦, 0.125Watt, 0.1%
5.6K⌦, 0.0625Watt, 0.1%
68K⌦, 0.0625Watt, 0.1%
1.2M⌦, 0.0625Watt, 0.1%
100K⌦, 0.0625Watt, 0.1%
22K⌦, 0.0625Watt, 0.1%
4.7K⌦, 0.0625Watt, 0.1%
5m⌦, 2Watt, 1%
Quad operational amplifier
Placed part
C0402C153K4RACTU
08053A122JAT2A
GRM2165C1H560JZ01D
0603ZC224KAT2A
08056D106KAT2A
T491B476K010AT
ERA6AEB274V
CPF0603B5K6E
CPF0603B68KE
1614959-9
CPF0603B100KE
CPF0603B22KE
CPF0603B4K7E
CRF2512-FX-R005ELF
NE5234D/01,512
Table C.2: The bill of material for the analog front end of the proposed prototype.
Component number(s)
C19, C20
C21, C22
R26, R27
L3, L4
Q1
IC2 (on adapter)
IC5
Required Part
12pF, 50V, ±2%
220⌘F, 10V, ±10%
330⌦, 0.0625Watt, 0.1%
600⌦, 500mA
12Mhz quartz
Energy metering Cortex M0
opto-coupler (UART)
Placed part
06035J120GBSTR
0603ZC224KAT2A
CPF0603B330RE
BLM18AG601SN1D
NX3225SA
EM773FHN33,551
ADUM1281ARZ
Table C.3: The bill of material for the circuit containing the MCU and some periphery of the proposed prototype.
C.2
C.2.3
Bill of material
71
Led PCB
Component number(s)
C1
R1, R48
LED1. . . 12
IC1
Required Part
220⌘F, 10V, ±10%
Together 3.6K⌦
LED green/red, common Anode
PWM LED driver
Placed part
0603ZC224KAT2A
?
L59EGW/CA
TLC5947
Table C.4: The bill of material for the circuit of the LED PCB of the proposed prototype.
73
Appendix D
Software architecture of
the prototype
In this Appendix the module diagram of the software architecture can be seen. It is depicted in figure D.1
D
74
Software architecture of the prototype
METROLOGY
«enum»
EM_return_t
EM_VALID
EM_NOT_VALID
EM_NOT_VALID_OVERFLOW
«enum»
EM_mains_t
EM_AUTO
EM_50HZ = 50
EM_60HZ = 60
«struct»
metrology_result_tag
V: float
I: float
P: float
Q1: float
S: float
S1: float
PF: float
PF1: float
SN: float
N: float
THDI: float
metrology
+metrology_init(AHBClkFrequency: uint32_t, Fmains: EM_mains_t): EM_mains_t
+metrology_set_ranges(ranges: *metrology_ranges_t): void
+metrology_start(void): void
+metrology_stop(void): void
+metrology_read_data(metrology_result: *metrology_result_t): EM_return_t
Responsibilities
-- Manages the metrology engine
metering
#METERING_INTERRUPT_FREQUENCY
+metering_result: metrology_result_t
+Initialise_Metering(void): void
Responsibilities
-- Refreshes the metering result in x ms
-- Makes metering result available
ANIMATIONS
meteringanimationrotation
#MINRPM
#MAXRPM
#POWEROFFSET
#POWERMEDIUMTRESHOLD
#POWERHIGHTRESHOLD
#POWERMAXTRESHOLD
+Metering_Animation_Rotation(void): void
Responsibilities
-- Rotating animation of PowerSocket
animations
+Run_Animations(void): void
Responsibilities
-- Runs one animation
DRIVERS
APP
app_config
#LPC_CORE_CLOCKSPEED_HZ
#SUPPORT_FOR_SERIAL_PORT
#SUPPORT_METROLOGY
#SUPPORT_LED_DRIVER
#SUPPORT_DELAY
Responsibilities
-- Define core clock speed
-- Define which peripherals are used
main
Responsibilities
-- Initializes the system and drivers
-- Starts the animations
delay
+Init_Delay_App(void): void
+Delay(miliseconds: uint16_t): v
Responsibilities
-- Provides a delay function
SYSTEM
startup_armcm0
Responsibilities
-- Initialize the interrupt vector
EM7xxx
Responsibilities
-- MCU specific defines
core_cm0
Responsibilities
-- MCU specific operations
«enum»
LED_write_status_t
WRITE_SUCCESS
WRITE_FAIL
GPIO
gpio
+gpio_init(void): void
+gpio_alloc(portpin: int, mode: pcb_mode_t, dir: int): void
+gpio_chdir(portpin: int, dir: int): void
+gpio_free(portpin: int): void
+gpio_setval(portpin: int, val: int): void
+gpio_set(portpin: int): void
+gpio_clr(portpin: int): void
+gpio_getval(portpin: int): int
+gpio_intgetflag(portpin: int): int
+gpio_intclear(portpin: int): void
+gpio_intdisable(portpin: int): void
+gpio_intenable(portpin: int, rising: int): void
Responsibilities
-- Manages the GPIO ports of the MCU
pcb
+pcb_init(void): void
+pcb_alloc(portpin: int, func: pcb_func_t, mode: pcb_mode_t): void
+pcb_free(portpin: int): void
Responsibilities
-- Manages the pins of the MCU
CMSIS
system_EM7xxx
+ClockSource: uint32_t
+SystemCoreClock: uint32_t
+SystemAHBFrequency: uint32_t
+SystemInit(void): void
+SystemCoreClockUpdate(void): void
+WDT_clk_get(void): int
Responsibilities
-- System clock management
led_driver
#UPDATES_PER_SECOND
+Initialise_LED_Driver(void): void
+Write_LED_To_Buffer(ledbits: uint16_t): LED_write_status_t
Responsibilities
-- Provides communication to the TLC5947 LED driver
uart
+Ser_Init(config: uart_config_t): void
+Ser_WrStr(tx_str: *uint8_t): void
+Ser_RdStr(rx_str: *uint8_t, count: uint16_t, stop_char: uint8_t): uint32_t
Responsibilities
-- Provides communication using UART
«enum»
PCB_MODE_T
PCB_MODE_PULLNONE
PCB_MODE_PULLDOWN
PCB_MODE_PULLUP
PCB_MODE_REPEATER
«enum»
PCB_FUNC_T
PCB_FUNC_0
PCB_FUNC_1
PCB_FUNC_2
PCB_FUNC_3
«struct»
uart_config_t
baudrate: UART_BAUD_RATE
databits: UART_DATA_BITS
stopbits: UART_STOP_BITS
paritybits: UART_PARITY_BITS
Figure D.1: The module diagram of the software architecture. An arrow in this
diagram means a module is used by another module. The arrow points to the
module that uses the module. A green module means that this module is provided
by the EM773 smartmeter SDK. The module painted red, are fully constructed by
myself.
75
Appendix E
Programming and
debugging the prototype
76
E
Programming and debugging the prototype
Figure E.1: Screen shot of flash magic, it shows the settings to use for programming
the prototype.
Figure E.2: Screen shot of terminal, it shows the settings to be used for communicating with the prototype for debugging purposes.
77
Appendix F
Results of the first step
of the user study
Range (Watt)
0-25
25-50
50-100
100-200
200-300
JND
2-5
5-10
15-20
20-30
40-45
300-400
400-600
600-800
800-1000
1000-1200
1200-1400
55-65
70-80
90-100
100-110
120
120-130
1400-1600
1600-1800
1800-2000
2000-2200
140
140-160
190-200
200+
Table F.1: The coarse energy consumption classes I have found in initial testing.
F
78
Results of the first step of the user study
Table F.2 represents the results of the first part of the user
study. On the left you see the ranges from which a JND is
tried to be found. On top you see the JNDs tested in this
user study. The entries in this table represent how often
users recognised a JND in a certain range.
Range\JND
0 - 25
25 - 50
50 - 100
100 - 200
200 - 300
2
1
Range\JND
300 - 400
400 - 600
600 - 800
800 - 1000
Range\JND
1000 - 1200
1200 - 1400
1400 - 1600
1600 - 1800
1800 - 2000
2000 - 2200
110
3
3
1
50
6
5
10
15
20
25
30
35
40
45
50
1
7
4
4
2
7
5
6
4
2
2
4
2
2
2
55
5
120
2
5
60
1
130
3
2
5
6
65
3
1
70
2
2
80
90
100
110
120
5
4
2
2
1
2
3
2
2
1
140
150
160
170
2
5
7
6
3
7
180
190
200
4
8
3
7
1
Table F.2: The result of the first part of the user study.
79
Bibliography
Wokje Abrahamse, Linda Steg, Charles Vlek, and Talib
Rothengatter. A review of intervention studies aimed at
household energy conservation. Journal of Environmental
Psychology, 25(3):273–291, 2005.
Arduino.
URL http://arduino.cc/en/Main/
arduinoBoardDuemilanove.
Blue-Line-Innovations.
URL
bluelineinnovations.com.
http://www.
Loove Broms, Cecilia Katzeff, Magnus Bång, Åsa Nyblom,
Sara Ilstedt Hjelm, and Karin Ehrnberger. Coffee maker
patterns and the design of energy feedback artefacts. In
Proceedings of the 8th ACM Conference on Designing Interactive Systems, pages 93–102. ACM, 2010.
Marshini Chetty, David Tran, and Rebecca E Grinter. Getting to green: understanding resource consumption in
the home. In Proceedings of the 10th international conference on Ubiquitous computing, pages 242–251. ACM, 2008.
Sarah Darby. Making it obvious: designing feedback into
energy consumption. In Energy efficiency in household appliances and lighting, pages 685–696. Springer, 2001.
Sarah Darby. The effectiveness of feedback on energy consumption. A Review for DEFRA of the Literature on Metering, Billing and direct Displays, 486:2006, 2006.
DIY-Kyoto. URL http://www.diykyoto.com.
Energy-Inc. URL http://www.theenergydetective.
com.
80
Bibliography
FabLab-Aachen. URL http://hci.rwth-aachen.de/
fablab.
Corinna Fischer. Feedback on household electricity consumption: a tool for saving energy? Energy efficiency, 1
(1):79–104, 2008.
Jon Froehlich, Kate Everitt, James Fogarty, Shwetak Patel,
and James Landay. Sensing opportunities for personalized feedback technology to reduce consumption. In
Proc. CHI Workshop on Defining the Role of HCI in the Challenge of Sustainability, 2009.
Anton Gustafsson and Magnus Gyllenswärd. The poweraware cord: energy awareness through ambient information display. In CHI’05 extended abstracts on Human factors
in computing systems, pages 1423–1426. ACM, 2005.
Florian Heller and Jan Borchers. Powersocket: towards onoutlet power consumption visualization. In CHI’11 Extended Abstracts on Human Factors in Computing Systems,
pages 1981–1986. ACM, 2011.
Florian Heller and Jan Borchers. Physical prototyping of an
on-outlet power-consumption display. interactions, 19(1):
14–17, 2012.
Tiffany Grace Holmes. Eco-visualization: combining art
and technology to reduce energy consumption. In Proceedings of the 6th ACM SIGCHI conference on Creativity &
cognition, pages 153–162. ACM, 2007.
Ju-Whan Kim, Yun-Kyung Kim, and Tek-Jin Nam. The
ténéré: design for supporting energy conservation behaviors. In CHI’09 Extended Abstracts on Human Factors
in Computing Systems, pages 2643–2646. ACM, 2009a.
Younghun Kim, Thomas Schmid, Zainul M Charbiwala,
and Mani B Srivastava. Viridiscope: design and implementation of a fine grained power monitoring system for
homes. In Proceedings of the 11th international conference on
Ubiquitous computing, pages 245–254. ACM, 2009b.
NXP. Em773. URL http://www.nxp.com/products/
microcontrollers/application_specific/
EM773FHN33.html.
Bibliography
P3-international.
Kill-a-watt.
p3international.com.
81
URL http://www.
Danny Parker, David Hoak, and Jamie Cummings. Pilot
evaluation of energy savings from residential energy demand feedback devices. FSEC, Rpt: FSEC-CR-1742-08,
2008.
Dane Petersen, Jay Steele, and Joe Wilkerson. Wattbot: a
residential electricity monitoring and feedback system.
In Proceedings of the 27th international conference extended
abstracts on Human factors in computing systems, pages
2847–2852. ACM, 2009.
Plugwise. URL http://www.plugwise.com.
SmartLabs. Smartlinc. URL http://www.smarthome.
com.
Vasughi Sundramoorthy, Qi Liu, Grahame Cooper, Nigel
Linge, and Joshua Cooper. Dehems: A user-driven domestic energy monitoring system. In Internet of Things
(IOT), 2010, pages 1–8. IEEE, 2010.
Markus Weiss and Dominique Guinard. Increasing energy
awareness through web-enabled power outlets. In Proceedings of the 9th International Conference on Mobile and
Ubiquitous Multimedia, page 20. ACM, 2010.
Markus Weiss, Friedemann Mattern, Tobias Graml,
Thorsten Staake, and Elgar Fleisch. Handy feedback:
Connecting smart meters with mobile phones. In Proceedings of the 8th International Conference on Mobile and Ubiquitous Multimedia, page 15. ACM, 2009.
83
Index
abbrv, see abbreviation
adapter of the MCU, 25
adjustments to the EM773 smartmeter, 17
advantages of the EM773, 16
appliance level metering, 8–9
availability of metering data, 35–36
bar chart of the relative detection rate, 43
benefits of the prototype, 32
benefits of the software design, 41–42
box containing the mains circuit, 29
box containing the PCBs, 29–31
box of the prototype, 29–31
breakdown of the power supply, 17
communicating with the LED driver, 37
costs of a prototype, 7
deleted parts from the analog front end, 18
deleted periphery around the MCU, 19–20
discussion of the result of the user study, 46–48
drivers, 33–38
ease of installation, 10
electrical safety, 28
evaluation, 43–49
future work, 52–53
GPIO driver, 34–35
household level metering, 9
immediate and detailed feedback, 1
implementation of the rotating animation, 39–40
initialisation the LED driver, 37
integrating an opto coupler, 21
LED driver, 36–38
Index
84
LED PCB, 27
main board, 24–25
mains circuit of the prototype, 29
mechanical safety, 31
methodology of the user study, 43–45
metrology engine, 35–36
modular design of the prototype, 24–27
modules from the EM773 SDK, 33–35
modules I have constructed myself, 35–41
overview of the energy consumption, 11
package ANIMATIONS, 38
power supply, 26–27
problems with Watt and kWh, 1–2
programming and debugging the prototype, 41
properties for prototypes used in large scale studies, 6–7
prototypes avoiding Watt and kWh, 2
replacement of the power supply, 17
reproducing a prototype, 6
ring buffer of the LED driver, 36–37
safety by using a fuse, 28
strength and weaknesses of appliance and household level metering, 10
summary, 51–52
the choice for an appliance level meter, 11
the resulting circuit around the MCU, 21–22
the rotating animation, 39
UART driver, 34
unmeasurable appliances, 10
usability of a prototype, 7
user studies conducted with energy measuring prototypes, 5
using the LED driver, 37–38
using the metrology engine, 35
using the rotating animation, 40–41
Typeset October 27, 2013