1
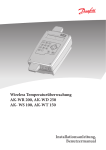
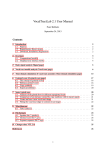
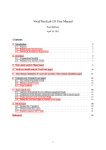
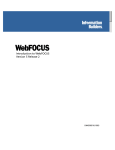
Associating Bar Graphs With Measures
To associate data visualization bar graphs with the Profit column:
1. Click the Measures drop-down list in the report (or open the OLAP Control Panel by clicking
the OLAP button), as shown in the following image.
The check marks indicate that the measures will appear in the report output.
2. Click the Profit check box again. The following image shows the Measures drop-down list
in the OLAP Control Panel with the Profit check box selected as a Graph icon.
The Graph icon replaces the check mark. This icon indicates that the measure will appear
with its associated bar graph.
3. Click the Run button to display the new report output.
260
WebFOCUS