1
Chapter 41. OProfile
313
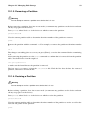
Warning
The executable being profiled must be used with these tools to analyze the data. If it must change
after the data is collected, backup the executable used to create the samples as well as the sample
files.
Samples for each executable are written to a single sample file. Samples from each dynamically linked
library are also written to a single sample file. While OProfile is running, if the executable being
monitored changes and a sample file for the executable exists, the existing sample file is automatically
deleted. Thus, if the existing sample file is needed, it must be backed up, along with the executable
used to create it before replacing the executable with a new version. Refer to Section 41.4 Saving Data
for details on how to backup the sample file.
41.5.1. Using opreport
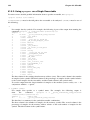
The opreport tool provides an overview of all the executables being profiled.
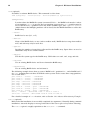
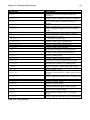
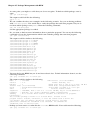
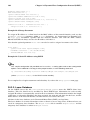
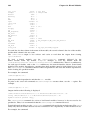
The following is part of an example output:
Profiling through timer interrupt
TIMER:0|
samples|
%|
-----------------25926 97.5212 no-vmlinux
359 1.3504 pi
65 0.2445 Xorg
62 0.2332 libvte.so.4.4.0
56 0.2106 libc-2.3.4.so
34 0.1279 libglib-2.0.so.0.400.7
19 0.0715 libXft.so.2.1.2
17 0.0639 bash
8 0.0301 ld-2.3.4.so
8 0.0301 libgdk-x11-2.0.so.0.400.13
6 0.0226 libgobject-2.0.so.0.400.7
5 0.0188 oprofiled
4 0.0150 libpthread-2.3.4.so
4 0.0150 libgtk-x11-2.0.so.0.400.13
3 0.0113 libXrender.so.1.2.2
3 0.0113 du
1 0.0038 libcrypto.so.0.9.7a
1 0.0038 libpam.so.0.77
1 0.0038 libtermcap.so.2.0.8
1 0.0038 libX11.so.6.2
1 0.0038 libgthread-2.0.so.0.400.7
1 0.0038 libwnck-1.so.4.9.0
Each executable is listed on its own line. The first column is the number of samples recorded for the
executable. The second column is the percentage of samples relative to the total number of samples.
The third column is the name of the executable.
Refer to the opreport man page for a list of available command line options, such as the -r option
used to sort the output from the executable with the smallest number of samples to the one with the
largest number of samples.