1
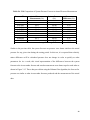
Table No. 3.12 T-Test for Relative Humidity
Forecast Time
2:00 PM
3:00 PM
4:00 PM
5:00 PM
6:00 PM
7:00 PM
8:00 PM
9:00 PM
10:00 PM
11:00 PM
Mean
Standard Deviation
Standard Error Mean
Actual Humidity
Measurement (%)
88
69
94
88
83
88
88
94
94
94
88
7.6739
2.427
System Forecast
(%)
88.11
73.23
90.09
89.25
85.58
92.87
91.42
96.89
97.17
98.45
90.306
7.3372
2.32
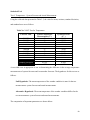
The hypotheses for this test are as follows:
Null Hypothesis: The mean relative humidity of the weather condition is same for the
two measurements: system forecast and actual measurements.
Alternative Hypothesis: The mean relative humidity of the weather condition differs for
the two measurements: system forecast and actual measurements.
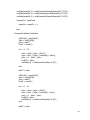
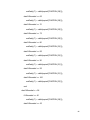
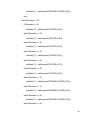
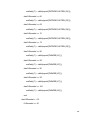
The computation of important parameters are shown below:
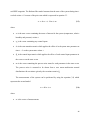
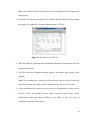
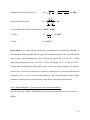
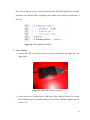
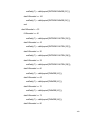
Standard Error of the Difference (se):
√
√
*
+
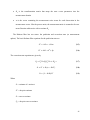
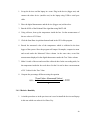
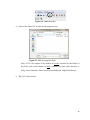
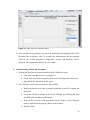
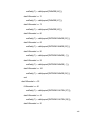
Degrees of Freedom (DF) :
(
)
(
)
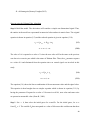
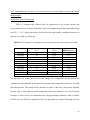
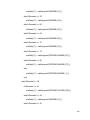
95% Confidence Interval for the Difference: ( -9.3894 , 4.7774 )
̅
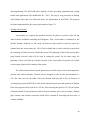
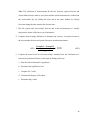
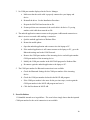
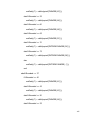
T- Value:
̅
√
52