1
Introduction to Cheminformatics
Cheminformatics is a field of information
technology that uses computers and computer programs to facilitate the collection,
storage, analysis, and manipulation of large
quantities of chemical data. Chemical data
includes chemical formulas, chemical structures, chemical properties, chemical spectra,
and biochemical or biological activities. The
term cheminformatics, which is an abbreviated form of “chemical informatics,” was first
coined by Frank Brown about 10 years ago
(Brown, 1998). However, the central concepts
behind cheminformatics, such as quantitative structure–activity relationships (QSARs)
and compound property prediction, have been
around for more than 30 years. Until recently
cheminformatics was a relatively obscure discipline with a comparatively small academic
or industrial presence. However, with the advent of high throughput drug screening and the
need for million-compound chemical libraries,
cheminformatics is now playing a key role in
many aspects of drug discovery and drug development. Cheminformatics is also playing a
vital role in emerging fields such as chemical genomics (Yang et al., 2006), systems
biology (Schnackenberg and Beger, 2006),
and metabolomics (Schlotterbeck et al., 2006;
Wishart et al., 2006). Indeed, as shall be seen
shortly, cheminformatics has much to offer to
the fields of molecular biology, biochemistry,
and bioinformatics.
Cheminformatics (as it is known in North
America), or chemoinformatics as it is known
in Europe and the rest of the world, is actually a close cousin to bioinformatics. However, the two fields have largely evolved along
separate, almost divergent paths. For instance,
many cheminformatics resources are expensive, closed source (i.e., precompiled), and distributed through commercial vendors. In contrast, most bioinformatics resources are free,
open source, and distributed through the Web.
This difference reflects the fact that the field
of chemical informatics started in the 1970s.
During this era the standard model for software
or database distribution was through commercial entities and the primary clients were multinational drug companies. On the other hand,
most bioinformatics software emerged much
later (in the 1990s) and the field was heavily
influenced by the open source movement, the
UNIT 14.1
emergence of the Web (for distribution) and
the fact that most clients were academics.
The differences between cheminformatics
and bioinformatics are also reflected in their
database content. Many chemical compound
databases were developed without the expectation that this information might eventually
be biologically or medically relevant. As a result most chemical data is (still) not linked in
any meaningful way to biological data such
as protein targets or their downstream physiological effects. Likewise, most bioinformatics databases were developed without the intention of using this data to facilitate drug or
drug-target discovery. Consequently most sequence data is not linked in any meaningful
way to existing drug or disease information.
This lack of data overlap in database content
has led to cheminformatics and bioinformatics
drifting uncomfortably far apart.
However, thanks to a number of new
funding initiatives (such as the NIH Roadmap
initiative) along with the coincidental emergence of chemical genomics, systems biology,
and metabolomics, there is now a growing
desire to bring bioinformatics and cheminformatics closer together. This has led to
an increasing number of freely available,
open-source or Web-enabled databases and
software tools. A number of these public
tools will be discussed in detail in this
cheminformatics unit, including Pharmabase
(http://www.pharmabase.org),
MSDchem
(Golovin et al., 2005), DrugBank (Wishart
et al., 2006), ZINC (Irwin and Shoichet,
2005), and others. Many other freely available
resources will also be briefly reviewed in this
short introduction to the field of cheminformatics. These open source, Web-enabled tools
are now making cheminformatics far more
accessible and far more relevant to biologists,
medicinal chemists, and bioinformaticians
(Geldenhuys et al., 2006).
THE INTERSECTION BETWEEN
CHEMINFORMATICS AND
BIOINFORMATICS
A partial comparison between the types of
databases and software found in both cheminformatics and bioinformatics is given in Table
14.1.1. As seen in this table, there are actually
a remarkable number of similarities between
Cheminformatics
Contributed by David S. Wishart
Current Protocols in Bioinformatics (2007) 14.1.1-14.1.9
C 2007 by John Wiley & Sons, Inc.
Copyright 14.1.1
Supplement 18
Table 14.1.1 Comparisons Between Databases, Data Formats, Prediction Methods, Visualization Software and Manipulation Tools Used in Bioinformatics and Cheminformatics
Bioinformatics
Cheminformatics
Type
Name
Type
Name
Archival sequence
databases
GenBank
Archival compound
databases
PubChem
Curated databases
SwissProt, UniProt,
RefSeq, FlyBase, SGD,
HPRD
Curated databases
ChEBI, KEGG (UNIT 1.12),
DrugBank (UNIT 14.4),
PharmaBase (UNIT 14.2), HMDB
Pathway databases
Reactome (UNIT 8.7),
BioCarta, KEGG (UNIT 1.12)
Pathway databases
KEGG (UNIT 1.12), MetaCyc,
PharmGKB
Structural databases
PDB (UNIT 1.9), MSD
(UNIT 14.3)
Structural databases
ZINC, Ligand Depot (UNIT 1.9)
Sequence string format
FASTA ( APPENDIX 1B)
Chemical string format
SMILES, InCHI
Data exchange format
BioXML, BSML
Data exchange format
CML
Format conversion
software
Readseq (APPENDIX 1E)
Format conversion
software
OpenBabel
Structure format
PDB (UNIT 1.9), mCIF
Structure format
MOL, SDF, PDB (UNIT 1.9)
Sequence similarity
searching
BLAST (UNITS 3.3 & 3.4),
Needleman-Wunsch
Chemical similarity
searching
Tanimoto Algorithm,
Subgraph Isomorphism
Gene identification
software
GenScan
Chemical identification
software
ChekMol
Property prediction
Hydrophobicity
Property prediction
LogP
Property prediction
pI
Property prediction
pKa
Property prediction
Solubility
Property prediction
Solubility
Property prediction
Molecular Weight
Property prediction
Molecular Weight
Protein/peptide ID
software
Mascot, Aldente, Phenyx
Chemical ID software
NIST/EPA/NIH Mass Spec
Library, SDBS, AMDIS
2-D structure
prediction software
PsiPred
2-D structure prediction
software
MolConvert
3-D structure
prediction software
Rosetta
3-D structure prediction
software
Corina
Structure visualization
applet
QuickPDB, JMol, WebMol
Structure visualization
applet
Chime, JME
Ontology
Gene Ontology
Ontology
ChEBI Ontology
Protein-protein
interaction prediction
PIPE, TSEMA
Protein-ligand
interaction prediction
Glide (UNIT 8.11), GOLD;
FlexX; Dock
Introduction to
Cheminformatics
cheminformatics and bioinformatics. For instance, both have a central need for electronically accessible databases. Typically bioinformatics databases consist of large collections
of protein or DNA sequences and/or structures, while cheminformatics databases consist of large collections of chemical formulas,
names, and structures. It is also evident that
both cheminformatics and bioinformatics have
a critical need for database search tools with
bioinformatics needing sequence and structure searching software and cheminformatics
needing software to match molecular substructures or SMILES strings (Weininger, 1988).
The similarities extend even further with both
disciplines requiring: (1) data exchange standards; (2) standardized names, vocabularies, or ontologies; (3) structure visualization
14.1.2
Supplement 18
Current Protocols in Bioinformatics
software; (4) compound (MS) identification
tools; and (5) property prediction software.
Obviously, in bioinformatics the focus is on
large molecules (proteins, DNA, and RNA)
while in cheminformatics, the focus is on small
molecules (<1000 Da).
The linkage between small molecules and
large molecules is what ultimately connects
bioinformatics with cheminformatics. After
all, large molecules such as proteins, RNA,
and DNA are composed of small molecule
constituents (amino acids and nucleotides).
Not only is there a constitutive relationship,
but there is a functional relationship as well.
Small molecules act on large molecules and
vice versa. For instance, most small-molecule
drugs (of which 99% are small molecule
compounds) act on large-molecule protein
or DNA targets. Vitamins, metal ions, and
other small molecule cofactors regulate the
function and activity of most proteins and
many genes. Likewise, large molecules such
as genes and proteins are ultimately responsible for mediating the synthesis and degradation of most small molecules (drugs, nutrients, and metabolites). The connection between small molecules and large molecules extends throughout almost all cellular processes.
Indeed, the interplay between small molecules
(the environment) and large molecules (the
genotype) is what fundamentally defines an
organism’s phenotype.
To make the connections between bioinformatics and cheminformatics a little clearer
it is perhaps useful to briefly review some of
the key software resources now used in cheminformatics. In particular, three main software
categories will be covered including: (1) cheminformatic databases; (2) database searching
tools; and (3) property prediction tools. Also
highlighted in this unit is how the tools or
databases in each of these categories are making, or can make, the vital connections to
biology and bioinformatics.
DATABASES IN
CHEMINFORMATICS
There are three types of cheminformatic
databases: (1) archival or “global” compound
databases; (2) specialized or highly curated
databases; and (3) structural databases. This
closely parallels the situation in bioinformatics where there are archival or global
sequence databases like GenBank (Wheeler
et al., 2006), specialized sequence databases
like GeneCards (Rebhan et al., 1998),
HPRD (Mishra et al., 2006), or SwissProt
(O’Donovan et al., 2002; Bairoch et al., 2005)
and structural databases such as the Protein
Databank (PDB; Westbrook et al., 2002) or
MSD (Brooksbank et al., 2005). In contrast
to most bioinformatics databases, which are
almost all free, the majority of cheminformatics are commercial. However, there are also a
growing number of high quality, freely available cheminformatic databases.
The largest publicly accessible database of
chemical information is PubChem (Wheeler
et al., 2006). PubChem is supported by the
NIH’s Molecular Libraries Roadmap Initiative, so it is mandated to provide information
about small molecules and the biological activities of as many small molecules as possible.
PubChem (PC) includes substance information, compound structures, and bioactivity data
in three primary databases: PC-Substance,
PC-Compound, and PC-BioAssay. Like
GenBank, PubChem was developed and maintained by the National Center for Biotechnology Information (NCBI). Strictly speaking
PubChem is an archival database, as it contains
data deposited by many different organizations, labs, and companies (50+ at last count).
Currently, PubChem contains more than
10 million unique compounds, each of which
have chemical structure information, common names, IUPAC names, SMILES strings,
InChI identifiers, molecular weights, chemical
formulas, LogPs, and other compound descriptors. PubChem is extensively linked to
PubMed and many compounds have descriptions of their biological activity provided
through PubMed abstracts. Because of its
size, its accessibility, and its high standards,
PubChem has become the GenBank of the
cheminformatics world.
In the second category of databases
(curated or highly annotated) are a number
of smaller, more specialized resources. A
partial list of these databases includes KEGG
(Kanehisa et al., 2006), MetaCyc (Caspi
et al., 2006), DrugBank (Wishart et al., 2006),
Pharmabase (http://www.pharmabase.org),
TTD (Chen et al., 2002), HMDB (Wishart
et al., 2007), ChEBI (Brooksbank et al., 2005),
and PharmGKB (Hewett et al., 2002). Rather
than containing millions of compounds, these
databases typically contain thousands or
tens of thousands of bioactive compounds.
What distinguishes these databases from
PubChem is the fact that they include detailed
information describing not only bioactive
small molecules but also their associated
biological pathways, macromolecular targets,
Cheminformatics
14.1.3
Current Protocols in Bioinformatics
Supplement 19
Introduction to
Cheminformatics
mechanisms of action, biological effects,
disease associations, toxicological data, and
pharmacogenomic consequences. Most of
these databases also have extensive search
and browsing capabilities, including text,
sequence, and structure similarity searches.
The third category of cheminformatic
databases are structural databases containing
3-D coordinate data. Some databases,
such as the Cambridge Structure Database
(http://www.ccdc.cam.ac.uk) contain the 3-D
coordinates of chemical structures that were
determined experimentally. The Cambridge
Structure Database (CSD) is the chemical
analog of the Protein Data Bank (Westbrook
et al., 2002). However, unlike the situation
with macromolecules, where ab initio 3-D
structure prediction is still an unsolved problem, the 3-D structure of most small molecules
can be accurately predicted from their 2-D
structures or SMILES strings (Sadowski and
Gasteiger, 1993). In fact, there are a number
of freely available programs and Web servers
such as MolConverter (ChemAxon), CORINA
(Sadowski and Gasteiger, 1993), CACTVS
(Ihlenfeldt et al., 2002), or the Cactus online
Converter (http://cactus.nci.nih.gov/services/
translate/), that can take stick figure diagrams
(MOL and SDF files) or SMILES strings and
generate high-quality 3-D coordinates in PDB
file format. As a consequence, most of today’s
3-D coordinate databases contain predicted 3D structures rather than experimentally determined structures. These 3-D databases are
particularly useful for virtual screening efforts
where large libraries of compounds are rapidly
docked onto a known protein structure using such ligand docking programs as Dock
(Shoichet and Kuntz, 1993), FlexX (Kramer
et al., 1997), or Glide (Halgren et al., 2004).
Some examples of these 3-D databases include ZINC (Irwin and Shoichet, 2005), Ligand Depot (Feng et al., 2004), and the NCI
3-D Structure Database (Milne et al., 1994).
ZINC, which is a recursive acronym for “Zinc
Is Not Commercial”, is a database containing modeled 3-D structures of nearly 4.7 million commercially available small molecules.
To facilitate docking or drug discovery studies, each of the compounds are assigned biologically relevant protonation states. They are
also annotated with relevant physical properties such as molecular weight, LogP, and
number of rotatable bonds. Every molecule
in ZINC contains vendor information and is
ready for “virtual screening” using most of the
common molecular docking programs. ZINC
supports several common file formats includ-
ing SMILES, mol2, 3-D SDF, and DOCK format. A Web-based query tool incorporating a
molecular drawing applet allows the database
to be searched and a variety of structure subsets to be created.
The National Cancer Institute (NCI) Drug
Information System (DIS) 3-D database is
a collection of modeled structures for over
400,000 primarily organic compounds which
have been tested by NCI for anticancer
activity. The NCI 3-D or NCI Open database
is maintained by the NCI’s Developmental Therapeutics Program. The database
is actually an extension of the NCI Drug
Information System. Recent comparisons to
common commercial databases suggest that
the NCI-3D database has by far the highest
number of unique compounds. Approximately
200,000 of the NCI structures were not found
in any of the other analyzed databases
(Voigt et al., 2001). The actual structural
information stored in the NCI-3D database
is the connection table for each compound,
which is just a list of which atoms are
physically connected and how they are connected. Connection tables provide sufficient
information to generate accurate 2-D and 3-D
structures, as well as unambiguous SMILES
strings. As a result, several variations of
the NCI-3D database have been prepared
using various format conversion and structure
generation tools (see http://cactus.nci.nih.
gov/ncidb2/download.html). These freely
available files can be used to set up local
databases that can be used for docking and virtual screening. NCI-3D can also be searched
using compound similarity searching tools
(see next section) to find similar compounds
having comparable biological activity.
Unlike ZINC or the NCI-3D database, the
Ligand Depot is a database that contains actual
structural coordinate data. While many times
smaller than ZINC, NCI-3D, or even the Cambridge Structure Database, what makes the
Ligand Depot particularly appealing is the fact
that it contains structures of small molecule
compounds bound to protein or DNA targets.
As a result, the structural information in Ligand Depot is highly relevant to docking studies. Furthermore, the information contained in
Ligand Depot can be used to train docking
software or it may be used in predicting or determining optimal conformers in 3-D structure
prediction programs. So, while Ligand Depot
is not routinely used as a compound database
for virtual screening, it is used to facilitate the
creation of compound databases and the optimization of many docking software packages.
14.1.4
Supplement 19
Current Protocols in Bioinformatics
DATABASE SEARCHING IN
CHEMINFORMATICS
In the world of informatics, databases are
relatively useless if they cannot be easily
searched. Obviously searching for exact string
or numeric matches is relatively trivial, but
in both bioinformatics and cheminformatics,
there is a central need to perform “fuzzy” or
inexact matching. In other words, researchers
want to find approximate matches to their
query sequences or structures. In conventional
bioinformatics, database sequence (or string)
matching and searching is done using dynamic programming (Needleman and Wunsch,
1970) or heuristic search programs like
BLAST (Altschul et al., 1997). In structural
bioinformatics, structure searching is done
through structure superposition or substructure matching tools such as DALI (Dietmann
et al., 2001), CE (Shindyalov and Bourne,
2001), and VAST (Gibrat et al., 1996).
In cheminformatics, there are a number
of equivalent methods to perform both
“sequence” (i.e., string) and structure matching against large chemical compound libraries.
Thanks to the development of standardized
text representations of chemical compounds
through InChI (IUPAC International Chemical Identifier) strings and SMILES strings, it
is possible to give every chemical a unique
character string. In other words, InChI and
SMILES strings uniquely define chemical
compounds, much like a gene or protein can be
uniquely defined by its sequence. As a result, if
a chemical database such as PubChem, ZINC,
or DrugBank is converted into a collection of
SMILES strings or InChI identifiers, it is then
possible to use character string comparison to
do compound matching. Several Web-based
conversion sites, including the Molecular
Structure File Converter (http://iris12.colby.
edu/∼www/sconv.cgi), the Cactus Structure File Converter (http://cactus.nci.nih.gov/
services/translate/), and the InChI converter
(http://inchi.info/converter en.html) are now
available to facilitate conversion between
MOL, SDF, PDB, SMILES, and InChI
formats.
The actual string or “sequence” search algorithm requires that both the query compound
and the database of searchable compounds be
expressed in SMILES or InChI strings. The algorithm uses common string parsing and string
matching utilities, similar to those found in
spell-checking software, to score the similarity between the query character string and the
database character strings. Unfortunately, this
approach is not always fool-proof. The scor-
ing schemes for chemical substring matching
are not yet as sophisticated as they are with sequence matching algorithms. Likewise, there
are several different SMILES string dialects,
which makes it difficult to exchange databases
or search algorithms.
More sophisticated chemical structure
matching algorithms also exist. These are
based on the idea of matching substructures.
However, because the structures of chemical
compounds are far more diverse than what is
seen for proteins, the structure matching utilities in chemistry have to be slightly more
sophisticated. In particular, chemists must
use the concept of subgraph isomorphisms
(Ullman, 1976) and adjacency matrices to
identify chemical similarity. For substructure
searching, the 2-D chemical structures of both
the query and database compounds must be
rewritten as tables that indicate the bond connectivity between each pair of atoms. These
tables, which have 1s for connected atoms
and 0s for unconnected atoms, are called adjacency matrices. The name comes from the
fact that they indicate which atoms are adjacent (connected) to each other. Once prepared, the adjacency matrix from the query
structure is compared to every adjacency matrix in the database. If substantial sections of
the query matrix match to an adjacency matrix (or portion thereof) in the database, then
it is likely that the two structures are similar. Different scoring schemes and adjustable
threshold cutoffs may be used to distinguish
strong matches from weak matches or to identify compounds with particularly important
substructures.
PROPERTY PREDICTION IN
CHEMINFORMATICS
Compound property prediction is something common to both bioinformatics and
cheminformatics software. In bioinformatics,
the compounds being analyzed are typically
macromolecules such as peptides, proteins,
RNA, or DNA. In cheminformatics, the compounds being analyzed are usually small
molecule drugs, drug leads, toxins, or metabolites. In bioinformatics, the properties of interest include hydrophobicity, isoelectric point,
UV absorbance, molecular weight, flexibility, secondary structure, radius of gyration,
stability, and solubility. In cheminformatics,
the properties of interest include electronic
or charge distribution, preferred conformations, heats of formation, solubility, LogP,
pKa , refractivity, melting point, molecule
length, molecular area, molecular volume, and
Cheminformatics
14.1.5
Current Protocols in Bioinformatics
Supplement 18
Introduction to
Cheminformatics
reactive groups. Some of these chemical properties, such as solubility, LogP, and charge
are particularly relevant to understanding or
predicting the activity, absorption, distribution, and metabolism (ADMET) of drug compounds (Hansch and Zhang, 1993; Hou and
Xu, 2003).
Chemical property prediction has been an
integral part of cheminformatics software for
more than 30 years. Like bioinformatics, most
of the techniques used in cheminformatics
property prediction make use of such machine learning techniques as artificial neural
networks, decision trees, hidden Markov
models, and support vector machines. Cheminformatic prediction methods also use more
conventional techniques, such as hierarchical
clustering, principal component analysis, and
correlational analysis. Most of today’s commercial chemistry software vendors, such as
ACD labs, CambridgeSoft, Tripos, and Acclerys offer at least some kind of chemical
property prediction software. However, many
of these predictions are also freely available
over the internet through a variety of Web
servers (Van de Waterbeemd and De Groot,
2002; Tetko, 2003). Examples of two simple
property prediction servers include the
Actelion Property Explorer and Pre-ADMET.
The Actelion Property Explorer (Google
“Actelion Property Explorer”) is a Webenabled Java applet that allows users to
draw chemical structures and then rapidly
calculate various drug-related properties, including toxicity risks (mutagenicity, tumorgenicity, irritancy, and reproductive effect),
solubility, logP, molecular weight, druglikeness, and overall drug score. Like
the Actelion server, Pre-ADMET (http://
preadmet.bmdrc.org/preadmet/index.php) offers a wide range of ADME and toxicological
property calculations for any submitted chemical compound. Three classes of predictors
are supported, a molecular descriptors calculation, a drug likeness predictor, and an ADME
predictor. The molecular descriptor calculator
can predict nearly 1000 molecular properties
including constitutional, topological, physicochemical, and geometrical descriptors, many
of which are needed for ADMET prediction.
The drug likeness predictor is very simple
and uses Lipinski’s rules (Rule of Five) and
lead-like rules in its predictions. The ADMET
predictor is quite unique and can predict permeability for Caco-2 cells, MDCK cells and
BBB (blood-brain-barrier), HIA (human intestinal absorption), plasma protein binding,
and skin permeability using an artificial neural
network. Users can draw input structures using a simple structure drawing applet or upload
compound files in “sdf” or “mol” file format.
CONCLUSION
As emphasized throughout this chapter, cheminformatics and bioinformatics are
rapidly evolving disciplines in information
technology that share many common features. Both fields need databases (sequence
and structure databases in bioinformatics;
structure/activity databases in cheminformatics), both fields depend critically on database
searches and comparisons (sequence and
structure comparison in bioinformatics; structure comparison in cheminformatics), and both
fields focus on making predictions using modern pattern recognition and data mining techniques. The fundamental difference between
cheminformatics and bioinformatics lies in
the size of the molecules that they study. In
cheminformatics the molecules are typically
<1000 Da, while in bioinformatics the
molecules are typically >10,000 Da. These
size differences lead to some fairly fundamental differences in what is predictable, what
is searchable, and what is observable. Nevertheless, as our understanding of both chemistry and biology improves, it is likely that
these molecular size differences will prove to
be less of a barrier to convergence than once
thought. Furthermore, as the fields of drug discovery, systems biology, chemical genomics,
and metabolomics become progressively more
popular and progressively more computerized,
it is not hard to imagine that, someday, the
complete integration of cheminformatics with
bioinformatics will be seen.
ACKNOWLEDGEMENTS
The author wishes to thank Genome
Alberta, a division of Genome Canada, for
financial support.
LITERATURE CITED
Altschul, S.F., Madden, T.L., Schaffer, A.A., Zhang,
J., Zhang, Z., Miller, W., and Lipman, D.J. 1997.
Gapped BLAST and PSI-BLAST: A new generation of protein database search programs.
Nucl. Acids Res. 25:3389-3402.
Bairoch, A., Apweiler, R., Wu, C.H., Barker, W.C.,
Boeckmann, B., Ferro, S., Gasteiger, E., Huang,
H., Lopez, R., Magrane, M., Martin, M.J.,
Natale, D.A., O’Donovan, C., Redaschi, N.,
and Yeh, L.S. 2005. The Universal Protein
Resource (UniProt). Nucl. Acids Res. 33:D154D159.
Brooksbank, C., Cameron, G., and Thornton, J.
2005. The European Bioinformatics Institute’s
14.1.6
Supplement 18
Current Protocols in Bioinformatics
data resources: Towards systems biology.
Nucl. Acids Res. 33:D46-D53.
Brown, F.K. 1998. Chemoinformatics: What is it
and how does it impact drug discovery. Ann.
Rep. Med. Chem. 33:375-384.
Caspi, R., Foerster, H., Fulcher, C.A., Hopkinson,
R., Ingraham, J., Kaipa, P., Krummenacker, M.,
Paley, S., Pick, J., Rhee, S.Y., Tissier, C., Zhang,
P., and Karp, P.D. 2006. MetaCyc: A multiorganism database of metabolic pathways and
enzymes. Nucl. Acids Res. 34:D511-D516.
Chen, X., Ji, Z.L., and Chen, Y.Z. 2002. TTD:
Therapeutic Target Database. Nucl. Acids Res.
30:412-415.
Dietmann, S., Park, J., Notredame, C., Heger, A.,
Lappe, M., and Holm, L. 2001. A fully automatic
evolutionary classification of protein folds: Dali
Domain Dictionary version 3. Nucl. Acids Res.
29:55-57.
Feng, Z., Chen, L., Maddula, H., Akcan, O.,
Oughtred, R., Berman, H.M., and Westbrook,
J. 2004. Ligand Depot: A data warehouse for
ligands bound to macromolecules. Bioinformatics 20:2153-2155.
Geldenhuys, W.J., Gaasch, K.E., Watson, M., Allen,
D.D., and Van der Schyf, C.J. 2006. Optimizing the use of open-source software applications
in drug discovery. Drug Discov. Today 11:127132.
Kanehisa, M., Goto, S., Hattori, M., AokiKinoshita, K.F., Itoh, M., Kawashima, S.,
Katayama, T., Araki, M., and Hirakawa, M.
2006. From genomics to chemical genomics:
New developments in KEGG. Nucl. Acids Res.
34:D354-D357.
Kramer, B., Rarey, M., and Lengauer, T. 1997.
CASP2 experiences with docking flexible ligands using FlexX. Proteins Suppl. 1:221-225.
Milne, G.W.A., Nicklaus, M.C., Driscoll, J.S.,
Wang, S., and Zaharevitz, D. 1994. The
NCI Drug Information System 3D Database.
J. Chem. Inf. Comput. Sci. 34:1219-1224.
Mishra, G.R., Suresh, M., Kumaran, K.,
Kannabiran, N., Suresh, S., Bala, P.,
Shivakumar, K., Anuradha, N., Reddy, R.,
Raghavan, T.M., Menon, S. Hanumanthu, G.,
Gupta, M., Upendran, S., Gupta, S., Mahesh,
M., Jacob, B., Mathew, P., Chatterjee, P.,
Arun, K.S., Sharma, S., Chandrika, K.N.,
Deshpande, N., Palvankar, K., Raghavnath,
R., Krishnakanth, R., Karathia, H., Rekha,
B., Nayak, R., Vishnupriya, G., Kumar, H.G.,
Nagini, M., Kumar, G.S., Jose, R., Deepthi,
P., Mohan, S.S., Gandhi, T.K., Harsha, H.C.,
Deshpande, K.S., Sarker, M., Prasad, T.S.,
and Pandey, A. 2006. Human protein reference database-2006 update. Nucl. Acids Res.
34:D411-D414.
Gibrat, J.F., Madej, T., and Bryant, S.H. 1996.
Surprising similarities in structure comparison.
Curr. Opin. Struct. Biol. 6:377-385.
Needleman, S.B. and Wunsch, C.D. 1970. A general
method applicable to the search for similarities
in the amino acid sequence of two proteins. J.
Mol. Biol. 48:443-453.
Golovin, A., Dimitropoulos, D., Oldfield, T.,
Rachedi, A., and Henrick, K. 2005. MSDsite:
A database search and retrieval system for the
analysis and viewing of bound ligands and active
sites. Proteins 58:190-199.
O’Donovan, C., Martin, M.J., Gattiker, A.,
Gasteiger, E., Bairoch, A., and Apweiler, R.
2002. High-quality protein knowledge resource:
SWISS-PROT and TrEMBL. Brief. Bioinformatics 3:275-284.
Halgren, T.A., Murphy, R.B., Friesner, R.A., Beard,
H.S., Frye, L.L., Pollard, W.T., and Banks, J.L.
2004. Glide: A new approach for rapid, accurate docking and scoring. 2. Enrichment factors
in database screening. J. Med. Chem. 47:17501759.
Rebhan, M., Chalifa-Caspi, V., Prilusky, J., and
Lancet, D. 1998. GeneCards: A novel functional genomics compendium with automated
data mining and query reformulation support.
Bioinformatics 14:656-664.
Hansch, C. and Zhang, L. 1993. Quantitative
structure-activity relationships of cytochrome
P-450. Drug Metab. Rev. 25:1-48.
Hewett, M., Oliver, D.E., Rubin, D.L., Easton, K.L.,
Stuart, J.M., Altman, R.B., and Klein, T.E. 2002.
PharmGKB: The Pharmacogenetics Knowledge
Base. Nucl. Acids Res. 30:163-165.
Hou, T.J. and Xu, X.J. 2003. ADME evaluation
in drug discovery. 3. Modeling blood-brain
barrier partitioning using simple molecular
descriptors. J. Chem. Inf. Comput. Sci. 43:21372152.
Ihlenfeldt, W.D., Voigt, J.H., Bienfait, B., Oellien,
F., and Nicklaus, M.C. 2002. Enhanced
CACTVS browser of the Open NCI Database.
J. Chem. Inf. Comput. Sci. 42:46-57.
Irwin, J.J. and Shoichet, B.K. 2005. ZINC-a free
database of commercially available compounds
for virtual screening. J. Chem. Inf. Model.
45:177-182.
Sadowski, J. and Gasteiger, J. 1993. From atoms to
bonds to three-dimensional atomic coordinates:
Automatic model builders. Chem. Rev. 93:25672581.
Schlotterbeck, G., Ross, A., Dieterle, F., and
Senn, H. 2006. Metabolic profiling technologies for biomarker discovery in biomedicine and
drug development. Pharmacogenomics 7:10551075.
Schnackenberg, L.K. and Beger, R.D. 2006. Monitoring the health to disease continuum with
global metabolic profiling and systems biology.
Pharmacogenomics 7:1077-1086.
Shindyalov, I.N. and Bourne, P.E. 2001. A database
and tools for 3-D protein structure comparison
and alignment using the Combinatorial Extension (CE) algorithm. Nucl. Acids Res. 29:228229.
Shoichet, B.K. and Kuntz, I.D. 1993. Matching
chemistry and shape in molecular docking. Protein Eng. 6:723-732.
Cheminformatics
14.1.7
Current Protocols in Bioinformatics
Supplement 18
Tetko. I.V. 2003. The WWW as a tool to obtain
molecular parameters. Mini Rev. Med. Chem.
3:809-820.
Ullman, J.R. 1976. An algorithm for sub-graph isomorphism. J. ACM 23:31-42.
Van de Waterbeemd, H. and De Groot, M. 2002.
Can the Internet help to meet the challenges in
ADME and e-ADME? SAR QSAR Environ. Res.
13:391-401.
Voigt, J.H., Bienfait, B., Wang, S., and Nicklaus, M.C. 2001. Comparison of the NCI open
database with seven large chemical structural
databases. J. Chem. Inf. Comput. Sci. 41:702712.
Weininger, D. 1988. SMILES 1. Introduction and
Encoding Rules. J. Chem. Inf. Comput. Sci.
28:31-38.
Westbrook, J., Feng, Z., Jain, S., Bhat, T.N., Thanki,
N., Ravichandran, V., Gilliland, G.L., Bluhm,
W., Weissig, H., Greer, D.S., Bourne, P.E., and
Berman, H.M. 2002. The Protein Data Bank:
Unifying the archive. Nucl. Acids Res. 30:245248.
Wheeler, D.L., Barrett, T., Benson, D.A., Bryant,
S.H., Canese, K., Chetvernin, V., Church, D.M.,
DiCuccio, M., Edgar, R., Federhen, S., Geer,
L.Y., Helmberg, W., Kapustin, Y., Kenton, D.L.,
Khovayko, O., Lipman, D.J., Madden, T.L.,
Maglott, D.R., Ostell, J., Pruitt, K.D., Schuler,
G.D., Schriml, L.M., Sequeira, E., Sherry,
S.T., Sirotkin, K., Souvorov, A., Starchenko,
G., Suzek, T.O., Tatusov, R., Tatusova, T.A.,
Wagner, L., and Yaschenko, E. 2006. Database
resources of the National Center for Biotechnology Information. Nucl. Acids Res. 34:D173D180.
Wishart, D.S., Knox, C., Guo, A., Shrivastava, S.,
Hassanali, M., Stothard, P., and Woolsey, J.
2006. DrugBank: A comprehensive resource for
in silico drug discovery and exploration. Nucl.
Acids Res. 34:D668-D672.
Wishart, D. S., Tzur, D., Knox, C., Eisner, R., Guo,
A. C., Young, N., Cheng, D., Jewell, K., Arndt,
D., Sawhney, S., Fung, C., Nikolai, L., Lewis,
M., Coutouly, M. A., Forsythe, I., Tang, P., Shrivastava, S., Jeroncic, K., Stothard, P., Amegbey,
G., Block, D., Hau, D. D., Wagner, J., Miniaci,
J., Clements, M., Gebremedhin, M., Guo, N.,
Zhang, Y., Duggan, G. E., Macinnis, G. D.,
Weljie, A. M., Dowlatabadi, R., Bamforth, F.,
Clive, D., Greiner, R., Li, L., Marrie, T., Sykes,
B. D., Vogel, H. J. and Querengesser, L. 2007.
HMDB: the Human Metabolome Database.
Nucl. Acids Res, 35:D521-526.
Yang, X., Parker, D., Whitehead, L., Ryder, N.S.,
Weidmann, B., Stabile-Harris, M., Kizer, D.,
McKinnon, M., Smellie, A., and Powers, D.
2006. A collaborative hit-to-lead investigation
leveraging medicinal chemistry expertise with
high throughput library design, synthesis and
purification capabilities. Comb. Chem. High
Throughput Screen. 9:123-130.
KEY REFERENCES
Doucet, J-P. and Weber, J. 1996. Computer-Aided
Molecular Design: Theory and Applications.
Academic Press, London.
An excellent introduction to the concepts and algorithms used in drug design and molecular modeling. This textbook covers methods and tools for
both proteins and small molecule chemicals. Don’t
let the date be deceiving.
Jonsdottir, S.O., Jorgensen, F.S., and Brunak,
S. 2005. Prediction methods and databases
within chemoinformatics: Emphasis on drugs
and drug candidates. Bioinformatics 21:21452160.
A superb review, with a nice summary of both open
source and commercial databases. This review also
provides useful assessments and descriptions of
chemical property prediction and drug metabolism
software.
Geldenhuys, W.J., Gaasch, K.E., Watson, M., Allen,
D.D., and Van der Schyf, C.J. 2006. Optimizing
the use of open-source software applications
in drug discovery. Drug Discov. Today 11:127132.
A very current and very readable review of opensource software and databases, with a special emphasis on their applications to drug discovery.
Wishart, D.S. 2005. Bioinformatics in drug development and assessment. Drug Metab. Rev.
37:279-310.
This review touches on a number of the topics introduced in this section in somewhat more detail.
The focus is more on predicting drug metabolism
and drug toxicology. It is a good complement to the
Jonsdottir et al. (2005) paper.
INTERNET RESOURCES
http://www.pharmabase.org
Pharmabase is a cellular physiology and pharmacology database.
http://www.ccdc.cam.ac.uk
The Cambridge Structure Database contains the 3D coordinates of chemical structures that have been
experimentally determined.
http://cactus.nci.nih.gov/services/translate/
Cactus online Converter can take stick figure diagrams (MOL and SDF files) or SMILES strings and
generate high quality 3-D coordinates in PDB file
format.
http://cactus.nci.nih.gov/ncidb2/download.html
Web site containing downloadable structure files of
NCI Open database compounds.
http://iris12.colby.edu/∼www/sconv.cgi
Web site for Molecular Structure File Converter,
which facilitates conversion between MOL, SDF,
PDB, SMILES, and InChI formats.
http://cactus.nci.nih.gov/services/translate/
Cactus Structure File Converter, which facilitates
conversion between MOL, SDF, PDB, SMILES, and
InChI formats.
Introduction to
Cheminformatics
14.1.8
Supplement 18
Current Protocols in Bioinformatics
http://inchi.info/converter en.html
InChI converter, used to facilitate conversion
between MOL, SDF, PDB, SMILES, and InChI
formats.
http://www.actelion.com/uninet/www/www main p.
nsf/Content/Technologies+Property+Explorer
Web site for the Actelion Property explorer a Webenabled Java applet that allows users to draw chemical structures and then rapidly calculate various
drug-related properties.
http://preadmet.bmdrc.org/preadmet/index.php
Web site for Pre-ADMET, which offers a wide range
of ADME and toxicological property calculations
for any submitted chemical compound.
Contributed by David S. Wishart
University of Alberta
Edmonton, Canada
Cheminformatics
14.1.9
Current Protocols in Bioinformatics
Supplement 18
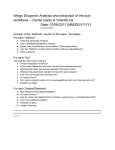
Using Pharmabase to Perform
Pharmacological Analyses of Cell
Function
UNIT 14.2
In this post-genomic period of biological research, the emphasis in cell biology is returning to an understanding of cell function and dynamics, particularly with regard to protein composition and function. New technologies abound, offering methods to examine
protein-dependent processes in living systems, frequently in real time. Experimentally,
one popular tool for defining and manipulating such activities is the use of pharmacological compounds to alter the performance of proteins within the living cell. However,
using these compounds can be a daunting process, particularly to the uninitiated. Locating the correct compound, understanding its target specificity, and even knowing
how to handle and prepare it for use, are frequently in the domain of the specialist.
Pharmabase sets out to overcome these barriers by providing simple protocols, guiding
the user through a series of choices, to a database of compound records addressing the
points above.
Pharmabase is a database containing detailed information on the physicochemical properties of ∼1000 pharmacologically active small molecules and compounds. The compound data are linked to the target molecules, frequently proteins, organized to display
their function within a cell. For example, the database is organized so that the user can
navigate to known interactions between these small molecules and their receptors within
the biological system of membrane transport.
This unit describes how to search and access the information in Pharmabase. The different search routes presented are based broadly on subject and/or graphic navigation.
Getting started with Pharmabase and performing simple searches via subject or compound is described in Basic Protocol 1. The main way to search Pharmabase is via
Membrane Transport (Basic Protocol 2). This subject navigator allows the investigator to
access compounds targeting membrane transporters of ions and molecules. Transporters,
in the context of this database, encompass channels, pumps, and porters (symporters,
uniporters, and antiporters). (Further material on the diversity of these mechanisms and
links to gene sites can be found at http://www.tcdb.org and the role of these molecules
in disease can be accessed through http://www.channelopathies.org.; also see Rose and
Griggs, 2001.) Four other subject-based navigators, derived by subset organization, are
described in Basic Protocol 3. These are: Metabolism, Intracellular Messengers, Cell
Signaling, and Cell Area. The compound database is sorted according to these subsets and their constitutive components. These secondary navigation routes are in place
to provide a cross-referencing structure to other indexing methods and all share the
purpose of reducing the database to a smaller subset of compounds and targets, tailored to the user’s interest. (These navigators will be further expanded and and additional search routines based around Diseases and Tissues, as well as Action Terms,
e.g., “ionophore” or “reporter” are under construction). Basic Protocol 4 describes the
most recent addition to Pharmabase: the Graphics Navigator. Unlike the hierarchical
approaches encompassed in the subject navigators described above, this protocol is relational. Target molecules are placed within cell types and pathways such that a graphic
presentation and selection system allows the user to see which molecule is associated
with others within the context of cell function. Currently, the graphics interface explores
the insulin-secreting β-cell within the pancreas and related pathways, and expansion to
other systems is planned.
Cheminformatics
Contributed by Peter J. S. Smith and David Remsen
Current Protocols in Bioinformatics (2006) 14.2.1-14.2.17
C 2006 by John Wiley & Sons, Inc.
Copyright 14.2.1
Supplement 13
The focus of this database is primarily eukaryotic, multicellular animals. Expansion to
other eukaryotes and prokaryotes is planned. All sections of Pharmabase remain works
in progress as the database expands in links and content.
BASIC
PROTOCOL 1
NAVIGATING THE HOME PAGE OF PHARMABASE USING COMPOUND
AND SUBJECT SEARCH
Pharmabase allows the user to presort the database into a reduced list of subjects and
compounds more tailored to the users interest. The Home Page provides the most direct
access to the database, affording the capacity to search directly by individual compound
or subject name.
Necessary Resources
Hardware
Computer with Internet access
Software
Web browser, e.g., MS Internet Explorer or Netscape. Pharmabase is housed on
the Marine Biological Laboratory (MBL) server and is available entirely through
Internet access. There are no specific requirements for browsers except that the
browser should be relatively recent so that it can properly display PNG-formatted
graphics. JavaScript is employed for some pull-down text functions, but nonJavaScript-aware browsers will display the text. Currently, the database does not
employ any Flash capabilities, but in the future a Flash-enabled component will
require the installation of a Macromedia Flash plug-in.
Navigating the home page
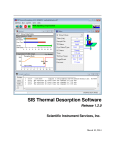
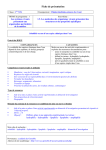
1. Open Pharmabase (http://www.Pharmabase.org). The Home Page is displayed
showing the basic organizational units of the database (Fig. 14.2.1).
At the top is a header bar, providing a link to the host site, BioCurrents Research Center, a
national resource of the National Institutes of Health (NIH)/National Center for Research
Resources (NCRR). Below this, on the left-hand side of the Home Page, is a frame for
carrying out the first search protocol, providing access to the navigator and search
Using
Pharmabase
Figure 14.2.1 Pharmabase Home Page illustrating the basic layout of the site and the major
navigation routes. Details and disclaimers are presented as text on the right.
14.2.2
Supplement 13
Current Protocols in Bioinformatics
tools. The text on the right-hand side of the home page provides some background on
Pharmabase and a disclaimer concerning its use and limitations.
Searching by compound or subject
2. To perform a direct search by compound or subject, click on the respective radio
button below the Search box. For example, to search for the Vacuolar-Type Proton
ATPase, select the Subject radio button and type in Vacuolar-Type, then hit the
Enter key.
If no result is returned, try a synonym. The following synonyms are included in
Pharmabase for this proton pump: Vacuolar-Type; V-ATPase; V-Type; Vacuolar; Vacuolar Type Proton ATPase. This feature is not case-sensitive. However, omit the hyphen
and the search will return zero results. After each search, the Where radio button on the
Home Page defaults to Compounds. The compound search also has latitude for wording
that does not quite match the database entry.
3. Select Compound radio button and type in Bafilomycin, then hit the Enter key.
Pharmabase will be reduced to one compound, with the correct name “Bafilomycin
A1,” an antibiotic that selectively blocks the V-Type ATPase. Click on the [more] link
and the Compound Record for Bafilomycin A1 is displayed. A detailed description
of the Compound Record and its interpretation is given in Basic Protocol 2.
Figure 14.2.2 Clicking the [more] link next to a compound name opens up the Compound Record
directly. Interpreting the Compound Record is discussed in Basic Protocol 2.
Cheminformatics
14.2.3
Current Protocols in Bioinformatics
Supplement 13
4. To view the entire compound database content, click the “all” link next to the
Compound radio button.
All compounds are displayed in alphabetical order on the right side. Clicking on the
[more] link will lead to the Compound Record for that entry. Select the Home tab at the
base of the header to return to the Home Page.
5. Select the Subjects radio button, then click the “all” link.
All the subject headings (820 with synonyms) will now be listed on the left-hand side of
the screen. Use the scroll bar on the right to view the list.
6. Scroll down the subject list and, under Receptors, subcategory Metabotropic, click
the link for 5-HT.
The database is sorted to display the navigator route to a metabotropic, membrane
borne, 5-hydroxytryptamine receptor (5-HT), with alternate names on the left-hand side,
and related pharmacological compounds (18 in this case) on the right-hand side. Each
compound name in the list has an associated [more] link.
7. In the list of compounds on the right-hand side of the page, click the [more] link next
to Propranolol HCl. The associated Compound Record for this entry is displayed,
as shown in Figure 14.2.2. A detailed description on using the Compound Record is
given in Basic Protocol 2.
BASIC
PROTOCOL 2
USING THE SUBJECT NAVIGATOR: MEMBRANE TRANSPORT
Navigating is the key to accessing the database when the subject or compound is not
known. The Navigator is presented on the left-hand side of the Home Page, below the
header bar (see Fig. 14.2.1). It is divided into two sections—navigating by subject or by
graphics. These points of access are the subjects of this and the following basic protocols.
In summary, the point of entry into the database is selected using the navigation route. The
most comprehensive is Membrane Transport, with the other subject navigators allowing a
degree of preselection, and therefore reduction, of the database to subsets. The inclusion
of the subset organization also allows cross-referencing between the cellular component,
protein, or structure, with pharmacological tools and diseases. The Graphics Navigator
(Basic Protocol 4) provides an active graphic map based on Cell Type and Pathways.
A top-down search begins with the root-level subject element or Navigator. This lists all
the major subject subdivisions. Each of these subdivisions represents different taxonomies
linked under a common root. Membrane Transport, the first subject category in the Subject
Navigator window is the major point of entry into the database. This option deals with
protein molecules responsible for the movement of ions and molecules across the lipid
membranes of cells, including the plasma membrane and the membranes of organelles.
Included in the context of Pharmabase are pumps (ATPases), channels, and porters. The
latter can be symporters, uniporters, or antiporters. Also included in this category are cell
membrane receptors and intercellular junctions.
Necessary Resources
Hardware
Computer with Internet access
Using
Pharmabase
Software
Web browser, e.g., MS Internet Explorer or Netscape. Pharmabase is housed on the
Marine Biological Laboratory (MBL) server and is available entirely through
Internet access. There are no specific requirements for browsers except that
the browser should be relatively recent so that it can properly display PNGformatted graphics. JavaScript is employed for some pull-down text functions, but
14.2.4
Supplement 13
Current Protocols in Bioinformatics
non-JavaScript-aware browsers will display the text. Currently, the database does
not employ any Flash capabilities, but in the future a Flash-enabled component
will require the installation of a Macromedia Flash plug-in.
Selecting “subject navigation”
1. Go to the Home Page at http://www.Pharmabase.org. Select the first option (no. 1
under Subject Tree), Membrane Transport. The database is queried to retrieve a list of
all compounds related to this subject or any of its child nodes. The resultant number
of relevant compounds is reduced from the original 717 to 453 (these numbers
will change as compounds are added). Subject navigation through the Membrane
Transport route is the most developed and comprehensive search route available in
Pharmabase.
Querying the database
After the selection of Membrane Transport, two broad choices arise. The database can
be queried further by making a series of choices (six in total; see below) relating to the
type of transporter being considered, or the entire membrane transport structure can be
exploded.
Using the “explode” function
Using the “explode” function to locate a Compound Record is primarily targeted to
the investigator who knows the transporter being studied. However, there is another use
for the novice, or experienced investigator looking into a new field—i.e., the explode
function shows all the possible options available in Pharmabase, educating the user
about the diversity of the database and drawing attention to categories of proteins the
investigator may be unaware of.
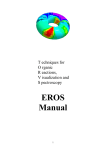
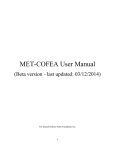
2. Click on the plus sign ([+]) on the second line of the Navigator Window, next to
“1. Membrane Transport.” 133 proteins are now listed in the subject tree on the
left-hand side of the window along with complete navigational subject routes. Now,
for example, select Channels. Figure 14.2.3 shows the first section of the exploded
Membrane Transport: Channel. All levels are searchable, but the deeper down one
penetrates into the hierarchy, the more specific the query to the database. The righthand side shows a list of compounds that relate to this level and its descendents in
alphabetical order (currently 453 for membrane transport and 222 for channels).
3. Select Cations. 209 Compound Records appear on the right-hand side. Select Potassium, and the Compound Records are reduced to 85, with the Navigator presenting
three subsets of potassium channels—Two-pore, Voltage-gated, and Non-Voltagegated. The variety of potassium channels held in the database can be viewed below
Potassium. 20 final potassium channel–related protein structures, associated with the
85 Compound Records, are now presented on the left-hand side with their navigational routes.
Using a “subject navigator”
Navigating the subject tree addresses the following conceptual problem: “I want to
know the protein, and its pharmacology, relating to a proton gradient (pH is changing)
that requires energy (ATP-dependent) but does not respond like a normal phosphorylating pump (such as the Na+ /K+ -ATPase superfamily), as our target is vanadateinsensitive. How do I reduce my options?” On the left-hand side of the page, under
Subject Tree, is the route taken through the Subject Navigator. Below this, synonyms (alternate names) are listed along with links, where available, to gene banks and Web-based
structural information. This section is incomplete, subject to continuing enhancements.
In most cases, these links will lead to the NCBI Entrez Gene bioinformatics project.
Cheminformatics
14.2.5
Current Protocols in Bioinformatics
Supplement 13
Figure 14.2.3 An example of the expanded subject listing after exploding the Subject Tree.
Membrane Transport was selected from the Subject Navigator on the Home Page.
This resource of the National Library of Medicine (NIH) provides material on the related
gene sequences for the molecule in question. Additionally, it provides numerous links to
other sites related to the chosen target. Links to the Kyoto Encyclopedia of Genes and
Genomes (KEGG; UNIT 1.12; http://www.genome.ad.jp/kegg/pathway.html) are particularly relevant to Pharmabase. Two other sites contain some of this information, providing
additional links. These are http://www.rcsb.org/pdb/ (UNIT 1.9) and http://www.tcdb.org.
Also see the Worldwide Protein Data Bank at http://www.wwpdp.org/index.html.
4. At the Home Page, select Subject Navigator from the two tabs above the Subject
Tree.
5. Select Membrane Transport.
6. From the subset list select Pumps. Pumps are defined as transporters utilizing the
energy stored in the phosphate bond of ATP; as a group they are referred to as the
ATPases. An alternative name for the term Pumps, “ATPase,” is displayed below the
classification. Making this selection reduces the list to 10 structures and 34 compounds. The structure list can be viewed by selecting the explode option ([+]) next
to Pumps in the Subject Navigator. All 34 compounds are listed on the right and can
be viewed using the scroll bar.
7. Select Non-phosphorylating. In eukaryotes, Hydrogen is the only product of this
selection.
Using
Pharmabase
8. Select Hydrogen to reveal two variants of a non-phosphorylating hydrogen (proton)
pump. As the F1F0 is mitochondrial-based and does not regulate acidification (it
is the ATP synthase), choose the Vacuolar-Type. The navigation route described is
shown numbered in Figure 14.2.4.
14.2.6
Supplement 13
Current Protocols in Bioinformatics
9. Clicking on Vacuolar-Type displays the view shown in Figure 14.2.5, and the three
compounds that have Compound Records associated with this protein are shown
on the right-hand side: Bafilomycin A1, Concanamycin A, and N-Ethylmaleimide
(NEM).
The first two compounds, antibiotics, are very specific for this pump, whereas NEM has
problems. Although one would no longer use NEM to investigate V-Type activity, for
some time it was the only available blocker. The Compound Record remains useful for
demonstrating the Pharmabase content.
Figure 14.2.4 Example of using the Subject Navigator to descend through the hierarchical tree
via a series of simple choices.
Figure 14.2.5 The Web page presented when the end of the hierarchical tree for the VacuolarType Proton Pump is reached. To the left is the route, to the right, three compounds that target the
V-Type.
Cheminformatics
14.2.7
Current Protocols in Bioinformatics
Supplement 13
Figure 14.2.6 The Compound Record for N-ethylmaleimide (NEM), one of the agents listed in
Figure 14.2.4 as targeting the V-Type. See the text for a description of the Record structure.
10. Click on the [more] option next to NEM to access the Compound Record for that
entry. The current page is replaced to include the Compound Record associated with
NEM and the Vacuolar-Type (Fig. 14.2.6).
Interpreting the compound record
11. The Compound Record shown in Figure 14.2.6 is divided into four sections. The
header bar and the compound or subject search area to the left are described in Basic
Protocol 1. Below the search area, the Navigator area containing the navigation
route is found. Below this are synonyms, if appropriate, and links to gene and
structural information. Plans have been made to include a graphics window below
the synonyms. This window will provide structural information and related site
links with graphic content. On the right-hand side is information concerning the
compound—in this case, N-ethylmaleimide.
Using
Pharmabase
14.2.8
Supplement 13
Current Protocols in Bioinformatics
12. The Compound Record presents the main information contained in Pharmabase.
Three sections are incorporated.
a. A header with definitions—compound name, synonyms, and molecular weight.
This also includes a simple way to contact the Pharmabase Editor.
This feature is to encourage input from the user. As the database tries to remain
current and continually develops, input from the user group is invaluable. Some
records are incomplete or do not recognize a nonselectivity known to others. More
relevant references may be available.
b. An information block, including the compound formula and structure.
c. Specimen references.
Where applicable the scroll bar to the right of the page allows full access to the
information and bibliography.
13. The information block contains details on the compound of particular use to the
experimentalist. It is divided into the following sections.
a. Action: This section defines the targets of the compound and its actions—for
example, inhibitory (antagonistic) or agonistic. For NEM there are a number of
possible actions; obviously, if the investigator is unaware of these, mistakes can be
made. Notable is the action on the V-Type at micromolar concentrations, but there
is also an action on phosphorylating ATPases at millimolar levels. Furthermore, as
the compound generally attacks sulfhydryl groups, it can impact a broad number
of mechanisms, inevitably more than listed.
b. Preparation: Where the Merck Index gives solubility from a chemist’s point of
view, Pharmabase puts this in a biological context. For biological investigations,
concentrations at or above the biological threshold are of interest, rather than
maximum solubility. For example, NEM has a very poor water solubility, but can
be prepared with sonication at levels needed to inhibit the V-Type. This avoids
problems with solvent toxicity. This section points out that nonaqueous solvent
concentrations should not exceed 0.1%.
c. Thresholds: Where available, this gives the final concentrations needed to block
the action of a target protein.
d. Comment: This provides a space for drawing attention to features not dealt with
above or which need to be emphasized—in this case, the clear lack of specificity
of NEM, which manifests a general action on sulfhydryl groups. This lack of
specificity, particularly with regard to applied concentrations and thresholds, cannot be overemphasized in the use of any pharmacological compound. This will be
further discussed in the Commentary. In some of the data records there is also a
Problems section, which is being absorbed into the Comment and Action fields.
Where no compounds are associated with a target molecule, there may be more
generic compounds for a transporter or channel group listed at a higher level.
SEARCHING PHARMABASE BY BIOCHEMICAL PATHWAY OR CELL
STRUCTURE TARGETS
BASIC
PROTOCOL 3
In this protocol, four other subject-based Navigators are described. These are organized
into the following categories: Metabolism, Intracellular Messengers, Cell Signaling, and
Cell Area.
Necessary Resources
Hardware
Computer with Internet access
Cheminformatics
14.2.9
Current Protocols in Bioinformatics
Supplement 13
Software
Web browser, e.g., MS Internet Explorer or Netscape. Pharmabase is housed on
the Marine Biological Laboratory (MBL) server and is available entirely through
Internet access. There are no specific requirements for browsers except that the
browser should be relatively recent so that it can properly display PNG-formatted
graphics. JavaScript is employed for some pull-down text functions, but nonJavaScript-aware browsers will display the text. Currently, the database does not
employ any Flash capabilities, but in the future a Flash-enabled component will
require the installation of a Macromedia Flash plug-in.
1. On the Home Page (http://www.Pharmabase.org), the Subject Navigator provides
a choice of seven navigational routes listed under Subject Tree. In Basic Protocol
2, navigational route number 1, Membrane Transport, was addressed. This protocol
collectively addresses numbers 2 to 7. All of these categories are in the early stages
of development, with editing and expansion planned.
These routes provide access to subsets of Pharmabase, reducing the Compound Records
to targeted areas.
2. Metabolism (no. 2). This category will focus on the steps behind the cellular processing of metabolites, such as glucose and the production of ATP. For more detail,
see steps 7 to 12.
3. Intracellular Messengers (no. 3) and Cell Signaling (no. 4). These should currently
be considered together, encompassing the mechanisms by which information is
conveyed across the cytosolic component of a cell. These mechanisms can couple
membrane receptors to cellular action and/or gene expression. For more detail, see
steps 13 to 15.
4. Cell Area (no. 5). This field is self-explanatory allowing a user to select a cell region,
structure, or organelle.
5. Diseases and Tissues (no. 6). These categories will allow the database to be presorted
to molecules and compounds specific to certain disease states and tissues with
specialized expression patterns.
6. Action Terms (no. 7). This category address compounds by their action on the target,
for example, whether they are agonists or antagonists, solvents, permeabilizers, or
reporter molecules.
Searching metabolism
The following steps are carried out from the Home Page (http://www.Pharmabase.org)
in the Subject Navigator window.
7. Select Metabolism. 53 compounds are selected from the database. These are associated with a current index under metabolism in the Navigator Window of 7 processes.
8. Select ATP. 13 compounds are associated at this level with only one further option
presented.
9. Select Production. 6 compounds address this level, each with its own Compound
Record.
Using
Pharmabase
10. Click on [more] next to FCCP, and the Compound Record is displayed on the righthand side. The format is the same as discussed above for NEM (Basic Protocol 2).
As in many cases, this compound has multiple actions depending on the target and
concentration. Most commonly, it is used as a protonophore to depolarize the mitochondrial membrane by creating a proton leak. This dissipates the proton gradient
14.2.10
Supplement 13
Current Protocols in Bioinformatics
used to drive the ATP synthase termed the F1F0 pump. This information is contained
in the first text field, Action, of the Compound Record. However, having come in via
a subset route, the investigator may not know what the F1F0 is. This can be resolved
by using the Basic Protocol 1 component search by subject.
11. In the Search Window above the Navigator (also see Basic Protocol 1) select the
Subject radio button and type in F1F0, the press the Enter key. The page refreshes
to present one match below the Search Window—F1F0.
12. Select “F1F0.” The window refreshes to the Subject Navigator and the route through
the Membrane Transport protocol discussed in Basic Protocol 2. Below the Navigator Route are displayed alternate names and links to gene sequence, where listed
and available. To the left, the selection of Compound Records associated with the
transporter is displayed.
Four Compound Records are displayed in this case, one being FCCP.
Searching intracellular messengers and cell signaling
Navigational Routes 3 and 4 of Pharmabase (see above) should be handled as one. There
is currently considerable thematic overlap between the categories Intracellular Messenger
and Cell Signaling. Future development will refine these. For example, from the Subject
Tree area of the Home Page:
13. Select Intracellular Messengers. This action presents three further choices:
a. Intermediates
b. Messengers
c. Receptors.
14. Select Intermediates. A limited selection of 11 kinase molecules are presented. There
are 105 compounds associated. Return to the Subject Tree on the Home Page.
15. Select Cell Signaling. This choice reveals six subjects related to 38 compounds.
Selecting Phospholipase A2 reduces the compound list to 20.
Cell signaling, particularly when referring to signal transduction mechanisms, is complex.
As yet, Pharmabase does not include an adequate set of navigational tools or specific
Compound Records. For interested parties, other databases allow entry into this field.
Examples are:
The Database of Quantitative Cellular Signaling (http://doqcs.ncbs.res.in/). This is a
repository of models of signaling pathways. Included are reaction schemes, concentrations, and rate constants, as well as annotations on the models.
Another site, available through subscription, is the Signal Transduction Knowledge
Environment (stke; http://stke.sciencemag.org/) run by the American Association for the
Advancement of Science.
The Protein Kinase Resource (PKR; http://pkr.sdsc.edu/html/index.shtml) aims to be a
Web compendium of information on the protein kinase family of enzymes. The PKR is a
collaborative project of researchers and computational biologists working to integrate
molecular and cellular information.
Cell Signaling Technology (http://www.cellsignal.com), a company site, provides a
searchable set of “kinomes” where, like the Pharmabase Graphics Navigator (see Basic
Protocol 4), the pathway components are clickable allowing access to the company’s
product catalog.
Search cell area
The final subset of Navigational Routes is Cell Area, category 5 in the Subject Tree. Here,
compounds noted to target particular cellular components are associated at that level. For
example, from the Subject Tree on the Home Page http://www.pharmabase.org.
Current Protocols in Bioinformatics
Cheminformatics
14.2.11
Supplement 13
16. Select Cell Area. A list of 13 subcellular structures are presented within the Navigator.
212 compounds are associated at this level.
17. Select Reticulum. Two choices are now available, the endoplasmic and the sarcoplasmic reticulum.
18. Select Endoplasmic Reticulum. A list of 21 compounds is presented on the righthand side. Click on [more] next to Caffeine and the Compound Record now occupies
the right-hand side. The protein targets for Caffeine are listed in the Actions of the
Compound Record.
As with a search through Metabolism (see above), these target molecules may be unfamiliar to an investigator entering the database through a subset navigation route. Additional
information may thus be obtained, e.g., as in step 19, using the example of the ryanodine
receptor mentioned as a target under Actions in the Compound Record for Caffeine.
19. Select the Subjects radio button in the Search area. Type in ryanodine receptor and hit the Enter key. One entry is found (indicated by a link underneath the
Search area). Clicking on this link presents three receptor types, and the navigation
route via subset 3, Intracellular Messengers. 12 compounds, with access to the Compound Records via the [more] link, are associated at this level. Selecting the Type
(via the links under the Subject Tree area of the window) can generate compounds
selective for that molecule.
Other searches
As subsets 6 and 7 are very much in their infancy, no details to their use are given here.
20. Subset 6 in the Subject Navigator aims to address compounds relevant to diseases
or tissues. This hierarchy currently extends to only one level. A more complete
hierarchy of diseases and physiological conditions related to tissues will become
available as the database grows.
An example from this subset is Apoptosis to which 63 compounds are mapped as related
to this choice.
21. Subset 7 allows compounds to be searched according to their Action on the target.
BASIC
PROTOCOL 4
USING THE GRAPHIC NAVIGATOR: SEARCHING CELL TYPE OR
PATHWAY
In addition to the hierarchically orientated navigation by subject described in the basic
protocols above, Pharmabase offers a graphics interface. The Graphics Navigator is
a relational search method. Proteins are arranged in pathways such that their interrelationship is apparent. This Navigator is also a work in progress, with Figure 14.2.7
illustrating and example of the appearance of the searchable window. The Graphics
Navigator is organized with a left-hand searchable panel starting with either Cell Type
or Pathway. In the example, selecting Cell Type is further reduced, e.g., as follows:
1 Cell Type
1.1 Beta Cell (pancreas)
1.1.a ATP production and membrane depolarization
1. 1.a.1 F1F0.
The Graphics Navigator is anticipated to be a powerful search tool. Currently, the model
under construction is for the pancreatic beta cell and glucose-stimulated insulin release.
Necessary Resources
Using
Pharmabase
Hardware
Computer with Internet access
14.2.12
Supplement 13
Current Protocols in Bioinformatics
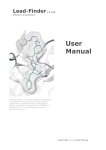
Figure 14.2.7 The Graphics Navigator illustrating the first searchable pathway of the pancreatic
beta cell. Clicking the F1F0 pump on the mitochondrial membrane moves on to Figure 14.2.8. For
the color version of this figure go to http://www.currentprotocols.com.
Software
Web browser, e.g., MS Internet Explorer or Netscape. Pharmabase is housed on
the Marine Biological Laboratory (MBL) server and is available entirely through
Internet access. There are no specific requirements for browsers except that the
browser should be relatively recent so that it can properly display PNG-formatted
graphics. JavaScript is employed for some pull-down text functions, but nonJavaScript-aware browsers will display the text. Currently, the database does not
employ any Flash capabilities, but in the future a Flash-enabled component will
require the installation of a Macromedia Flash plug-in.
Using the “graphics navigator”
1. Select Graphics Navigator on the Home Page (http://www.Pharmabase.org). From
the links in the window that appears, select Cell Type.
2. Select Beta Cell (the only choice at time of writing).
Cheminformatics
14.2.13
Current Protocols in Bioinformatics
Supplement 13
3. Pass the cursor over the cell graphic; five active pathways are embedded to date.
Select the first pathway by clicking on the mitochondrion or its surrounding area.
This action will bring up the Pathway Graphic below the navigation route and synonyms. Immediately to the right of the Search window is a thumbnail of the “Beta Cell”
(Fig. 14.2.7). Clicking on this or the Beta Cell text returns the user to the higher level of
the Graphics Navigator.
4. Pass the cursor over the Pathway Graphic. Two components are currently linked to
the database: i.e., the F1F0 pump and the ATP-dependent potassium channel. Active
links are currently indicated by the red highlighting circle. Leave the cursor over one
of the linked images and a descriptor pop-up appears.
5. Find the F1F0 and select by clicking on it.
The Pathway Graphic now settles as a thumbnail beneath the Cell Graphic, and is replaced
by a graphic of the targeted molecule. Below the Navigator are synonyms and links to
gene structure. The database is sorted to compounds targeting the F1F0 with these being
presented on the right-hand side.
6. Click the [more] link next to FCCP. The compound listing is replaced by the Compound Record for FCCP (Fig. 14.2.8). For a guide through the Compound Record,
refer to Basic Protocol 2.
Using
Pharmabase
Figure 14.2.8 The terminal point for the transporter F1F0 and targeted compounds after selection of the compound FCCP. The Compound Record is displayed to the right. For the color version
of this figure go to http://www.currentprotocols.com.
14.2.14
Supplement 13
Current Protocols in Bioinformatics
COMMENTARY
Background Information
Pharmabase provides an educational and
research tool accessible to a broad spectrum
of investigators and students. Navigating the
database can be approached from different
levels and assumes varying degrees of background knowledge. In all cases, the final result is a compound data sheet. The user can,
however, utilize the linking capacity at various steps to jump to other databases related to the level of search. The broad goal
is to direct the user to the correct selection
and use of pharmacological compounds targeting cellular proteins and their function in
living cells.
It is worthwhile to consider what the major
obstacles are to the successful use of a pharmacological compound and how a bioinformatics
approach, such as Pharmabase, helps to solve
them.
1. First, and foremost, the researcher needs
to identify a target, sometimes with minimal
information. Here, a directed knowledge base,
indicating what molecules exist for moving
an ion or compound and what varieties are
present in a particular tissue or within a known
pathway, can be of advantage to the experienced investigator. Pharmabase tackles this
problem by presenting two alternative search
mechanisms—one subject-based and the other
graphics-based. The subject-based approach
allows several routes of access to the database,
such as through transporters, diseases, or structures. A major advantage here is that the whole
subject index can be viewed and related to
function. This reveals the diversity of mechanisms available without any prior knowledge
being required. In the graphics approach, a relational database is presented. Pathways or cell
types are accessed where different molecules,
embedded in the same pathway, can be accessed. No prior knowledge of the pathway is
needed.
2. Once a target is selected, a compound
must be chosen. The core of Pharmabase is
the joining of the search, or navigator, routes
with compounds that alter the performance of a
chosen target or category of targets. Each compound, arrived at by the selective reduction of
the compound listing with more targeted selections, has a compound record.
3. One critical issue with almost all pharmacological compounds is the matter of selectivity. Almost always, if used incorrectly,
a compound can have multiple targets. This
may be a result of similar binding sites and/or
chemistry of the susceptible protein structures.
Here the experienced investigator has an advantage in knowing the “tricks of the trade.”
A key component of the Compound Record in
Pharmabase draws these caveats to the user’s
attention.
4. Once the molecule to be studied has
been identified, and a suitable compound has
been selected to modify its performance, it
is necessary to know the concentrations at
which to apply it and how it should be
handled—in terms of solubility, storage, etc.
The Pharmabase Compound Record has separate fields that deal with these issues, and
also provides selected references. Of note is
the disclaimer that records can be incomplete, and, importantly, that any user should
consult the manufactures guidelines with regard to toxicity and safe handling. Many
of the compounds listed in the database are
hazardous.
Figure 14.2.9 illustrates the organizational
layout of Pharmabase. A key element is that
the Subject and Graphics Navigators address
the same databases, cross-indexing between
routes and subsets. Unseen to the user is
the data management and editing capability. Pharmabase editors use this tool to add
and edit compound information, link compound records to the bibliography, and manage compound synonymy. The Editor is also
used to manage the subject indexes, and contains tools for linking compounds to the various taxonomies provided in Pharmabase and
for managing the hierarchical and relational
taxonomies themselves. Compounds can be
linked to or unlinked from any node in a classification hierarchy.
Editors can also make structural changes to
a subject term. Subjects can be inserted into
an existing hierarchy or moved to a new location. Synonyms can be swapped to create a
new preferred display term or the node can be
removed altogether.
The flexibility of the Editor allows the relational databases and Navigators to be easily updated and corrected. This capability
makes the interactive goal of Pharmabase feasible. Users are encouraged to supply additional information, correct inaccurate entries
or omissions, and request additional navigational routes and graphics.
Cheminformatics
14.2.15
Current Protocols in Bioinformatics
Supplement 13
Figure 14.2.9
The structural components of Pharmabase.
Critical Parameters and
Troubleshooting
Using
Pharmabase
14.2.16
Supplement 13
The core information for Pharmabase lies
in the Compound Record database. This
database was started to make up for a shortfall
in the published literature. Scientific research
papers, under the onerous pressure of limited
space, are frequently parsimonious with details on compound actions and preparations.
Solubility and selectivity are often omitted;
even thresholds can be missing. Investigators
must either be conversant with the compound
and target molecule or have access to in-depth
studies, such as a recent publication on calcium
channel pharmacology (McDonough, 2003).
A novice to a field can, however, find advanced texts hard to digest and general texts
inadequate in detail. The alternative mechanism is to trawl through the primary literature, necessitating patience and an excellent
library resource. Pharmabase seeks to bypass
these problems and cross-index the databases
to each other. However, the scope of the task
should not be underestimated, and the problems with available data should always be
borne in mind. It is safe to expect nonspecificity from any pharmacological compound,
and, as Pharmabase grows, more of these issues will be comprehensively covered. But
beware—if an experimental result is clearly inconsistent or paradoxical, it is wise to question
the selectivity before rewriting the literature!
The problem of tissue or species variability is of a similar nature to that of compound specificity. Different molecules, sup-
posedly similar in function, can have a variable
pharmacology. For example, schistosomiasis
is a disease caused by trematode flatworms of
the genus Schistosoma. A relatively common
tropical disease, it can be easily and cheaply
treated with the drug praziquantel (PZQ). For
some time the target of this drug was unclear
but Greenberg and colleagues (see Greenberg,
2005, for review) have shown that a beta subunit of a voltage-sensitive calcium channel
confers PZQ sensitivity. The unique sequence
of this subunit in the schistosomes imparts the
selectivity of the drug. Because this is the only
commercially available agent targeting these
parasites, the possibility of resistance developing in the organisms, indicated by these
findings, is frightening; hence, more alternatives are needed. This is a perfect example
of where the molecular and pharmacological
sciences can converge, with important consequences to the understanding of diseases and
their threats, as well as the future ability to
control such diseases. Species differences can
also tell evolutionary stories. A good example
is the mongoose, a predator with a particular
appetite for poisonous snakes. Here, the structure of the nicotinic acetylcholine receptor
has been modified to make it resistant to the
alpha neurotoxins, including alpha bungarotoxin, which comes from the Krait, a poisonous snake that is a favorite meal of the
mongoose (Barchan et al., 1992). Sequence information related to this example is available
through the Expert Protein Analysis System
(http://au.expasy.org/uniprot/P54251).
Current Protocols in Bioinformatics
Acknowledgments
Graphics and database management are
done by Tamara Clark. This database is funded
by NIH:NCRR P41 RR001395 to PJSS.
Pharmabase is maintained by the BioCurrents
Research Center, MBL, Woods Hole, Mass.
Literature Cited
Barchan, D., Kachalsky, S., Neumann, D., Vogel,
Z., Ovadia, M., Kochva, E., and Fuchs, S. 1992.
How the mongoose can fight the snake: The
binding site of the mongoose acetylcholine receptor. Proc. Natl. Acad. Sci. U.S.A. 89:77177721.
Greenberg, R.M. 2005. Are Ca2+ channels targets
of praziquantel action? Int. J. Parasitol. 35:1-9.
McDonough, S.I. 2003. Peptide toxin inhibition of
voltage gated calcium channels: Selectivity and
mechanisms. In Calcium Channel Pharmacology, 1st ed. (S.I. McDonough, ed.). Plenum,
New York.
Rose, M.R. and Griggs, R.C. 2001. Channelopathies of the Nervous System, p. 347.
Butterworth-Heinemann, Burlington, Mass.
Internet Resources
Diversity in molecular channels
and transporters
http://www.tcdb.org
The Transport Classification Database provides information on the diversity of these mechanisms and
links to gene sites.
Transporters and channels in disease
http://www.channelopathies.org/
Channelopathies, maintained by the University of
Ulm, provides an overview of channelopathies, organized for patients, doctors, and researchers.
http://www.neuro.wustl.edu/neuromuscular/mother/
chan.html#SCN4A
The Neuromuscular Disease Center provides an extensive, cross-referenced, database of ion channels,
transmitters, and receptors, and their role in disease.
Protein structure databases
http://www.rcsb.org/pdb/cgi/resultBrowser.cgi
Protein Data Bank.
http://www.wwpdp.org/index.html
The Worldwide Protein Data Bank.
http://au.expasy.org/
The ExPASy (Expert Protein Analysis System) proteomics server of the Swiss Institute of Bioinformatics (SIB) is dedicated to the analysis of protein
sequences and structures as well as 2-D PAGE.
Signal transduction pathways
http://doqcs.ncbs.res.in/
The Database of Quantitative Cellular Signaling:
a repository of models of signaling pathways. Included are reaction schemes, concentrations, and
rate constants, as well as annotations on the
models.
The Signal Transduction Knowledge Environment
(stke) run by the American Association for the Advancement of Science. This requires a subscription.
http://pkr.sdsc.edu/html/index.shtml
The Protein Kinase Resource (PKR) has as its aim
to be a Web compendium of information on the protein kinase family of enzymes. The PKR is a collaborative project, of researchers and computational
biologists working to integrate molecular and cellular information.
http://www.cellsignal.com.
Cell Signaling Technology provides a searchable set
of “kinomes” where, like the Pharmabase “Graphics Navigator” (Basic Protocol 4), the pathway
components are clickable, allowing access to the
company’s product catalog.
http://www.emdbiosciences.com/html/EMD/
interactivepathways.htm
Calbiochem also offers a variety of interactive pathways to help find the products directed against various cell components—the emphasis is on signal
transduction.
Proteomic and genomic databases
http://www.ncbi.nlm.nih.gov/gquery/gquery.fcgi
A general database focusing on several genetic and
protein problems relevant to this protocol can be
found at Entrez, The Life Sciences Search Engine
managed by the NCBI.
Key References
Ashcroft, F.M. 2000. Ion Channels and Disease.
Academic Press, Inc., San Diego, Ca.
A text that covers channels, receptors, and gap junctions, as related to disease.
Hille, B. 2001. Ion Channels of Excitable Membranes. Sinauer Associates, Inc., Sunderland,
Mass.
An advanced biophysical text that covers channel
properties in excitable cells.
Piccolino, M. 1997. Luigi Galvani and animal
electricity: Two centuries after the foundation of electrophysiology. Trends Neurosci.
20:443-448.
A general introduction, from an historical perspective, to excitable membranes.
Stein, W.D. 1990. Channels, Carriers, and Pumps.
Academic Press, Inc., San Diego, Ca.
Although now dated, this is an excellent and well
written introduction to the field of transmembrane
transport mechanisms.
Contributed by Peter J. S. Smith and
David Remsen
BioCurrents Research Center
Marine Biological Laboratory
Woods Hole, Massachusetts
Cheminformatics
http://stke.sciencemag.org/
14.2.17
Current Protocols in Bioinformatics
Supplement 13
Using MSDchem to Search the PDB
Ligand Dictionary
UNIT 14.3
The Protein Data Bank (PDB; UNIT 1.9) is an extremely valuable resource for understanding
the three-dimensional (3-D) structure of proteins and interacting ligands. The PDB
datafiles, however, do not provide clear and unambiguous information about chemical
properties (e.g., bond orders, atom elements, and charges) for biological molecules. The
possible ways that atoms in the molecules entered in the PDB are connected to form
ligands and polymer residues are calculated from atom distances in the 3-D space. This
is exactly what many protein visualization packages do—successfully in most, but not
all, cases. Experimental errors and inaccuracies complicate things further; as a result,
information about important chemical characteristics such as aromatic rings and chiral
atoms is not directly accessible to scientists who want to understand the chemical structure
of ligands they encounter in a PDB file.
The Macromolecular Structure Database (MSD), one of three that maintains the Worldwide Protein Data Bank (wwPDB), provides MSDchem, the definitive database of chemical records of PDB ligands (Bernstein et al., 1977). MSDchem contains data supplementary to the PDB archive that is exchanged among members of wwPDB (Berman et al.,
2005; Golovin et al., 2004). These data provide explicit chemical definitions for standard
and modified amino acids, nucleic acids, drugs, inhibitors, cofactors, and other chemical
species included in PDB entries.
MSDchem is of use to structural biologists who want to resolve the chemical identity of a small molecule’s 3-D structure and to chemists who are interested in a ligand’s biological structure and function. MSDchem utilizes chemical software packages
and resources including CACTVS (Ihlenfeldt et al., 1992; http://www2.chemie.unierlangen.de/software/cactvs) and CORINA (Gasteiger et al., 1990; http://www.molnet.de/software/corina). The CACTVS toolkit implements several checks on chemical
consistency and functions to introduce additional molecular properties such as explicit
stereodescriptors, aromatic flags, chemical drawings with PDB atom names, and unique
SMILEs strings (Weininger, 1988). CORINA is used to produce coordinates of an ideal
3-D conformation of each PDB ligand. MSDchem is an integral part of the Macromolecular Structure Search Database (MSDSD; Boutselakis et al., 2004) and is updated on a
weekly basis with new and revised ligand definitions, resulting from significant curation and clean-up efforts by wwPDB. Many MSD and wwPDB tools reference this data
(e.g., the Ligand Depot service described in UNIT 1.9).
The MSDchem search service offers various options for searching the ligand dictionary
based on name, chemical formula, subgraph matching, or fingerprint similarity, as well as
any combination of the above. While searching for a ligand using part of its code, name,
synonym, or formula is useful in following literature or PDB file references, looking for
molecules that contain a given chemical structure (subgraph searching) can be valuable
when only an outline of the chemical diagram is known or when identifying variants
of molecules that are expected to have similar chemical behavior in their common parts.
On the other hand, chemical fingerprint similarity can be used to find ligands composed
of a similar set of smaller subgroups, which may be connected differently but which
have similar localized chemistry. Based on the results Web pages users may investigate,
visualize, and export ligand structures or refer back to the relevant PDB entries. The
MSDchem database is available for export in various formats: a ready-to-use relational
database, collections of commonly used chemical data files, or SMILE string listings.
Cheminformatics
Contributed by Dimitris Dimitropoulos, John Ionides, and Kim Henrick
Current Protocols in Bioinformatics (2006) 14.3.1-14.3.21
C 2006 by John Wiley & Sons, Inc.
Copyright 14.3.1
Supplement 15
Four protocols are included in this unit, the first of which covers the simplest search option
where the three-letter code or a part of the molecular name is known (Basic Protocol 1).
This is the most popular option because it provides an overview of the ligand details from
a literature reference. The next two protocols cover searching using a molecular formula
or chemical fragment (Basic Protocol 2) and subgraph matching (Basic Protocol 3).
These types of searching provide increasingly more powerful and accurate options for
interactive use of MSDchem. Basic Protocol 4, which involves exporting the ligand
dictionary, is for users who need to apply their own tools and methods to a local copy of
the data collection.
BASIC
PROTOCOL 1
SEARCHING FOR LIGANDS USING THE THREE-LETTER PDB CODE OR
MOLECULAR NAME
The most common reason for using MSDchem is to have a look at the chemical diagram
and properties of a ligand mentioned in a PDB file or to search the literature by either
its common three-letter PDB code or a chemical name. This protocol demonstrates how
to use MSDchem to perform this fundamental task and familiarizes the user with the
MSDchem Web pages.
Necessary Resources
Hardware
Computer with Internet access
Software
An up-to-date Internet browser, such as Internet Explorer 3.0 or later
(http://www.microsoft.com/ie); Netscape 4.75 or later
(http://browser.netscape.com); Firefox 1.0 or later
(http://www.mozilla.org/firefox); or Safari (http://www.apple.com/safari)
Search for ligands using the three-letter PDB code
1. Open the MSDchem search home page (http://www.ebi.ac.uk/msd-srv/msdchem;
Fig. 14.3.1).
This page is the starting point for simple and advanced searches of the ligand dictionary
with combinations of individual search constraints and access to export functionality and
relevant documentation.
The main area of the page provides version and summary information about the status
of the database and the various text fields, controls, and buttons for selecting the search
operators and invoking the constraint editors in order to build the value of constraints.
Documentation about search fields can be found by following links from the data item
labels (like “Molecule Name”) or by using the adjacent question marks. There are various
search operators for each search field that can be selected from the drop-down menu next
to each search item name, and the most frequently used one is preselected.
The top header area of the page provides Web links to the MSD group page at EBI, the
MSD Web services toolbox, introductory MSDchem documentation, and e-mail address
contact for feedback and questions. There is also a link for accessing the “Energy types”
section of the MSDchem data that is used as a source for refinement dictionaries of
crystallographic software packages (Krissinel et al., 2004) and a direct shortcut back to
the MSDchem search home page.
Using MSDchem
to Search the PDB
Ligand Dictionary
The left-hand menu area contains references to MSDchem guide, relevant literature and
citations, and acknowledgments to software and resource contributors of MSDchem. This
area has also links to alternative search pages and access to the ligand index and export
pages.
14.3.2
Supplement 15
Current Protocols in Bioinformatics
Figure 14.3.1
of ATP.
The MSDchem search home page. The figure illustrates how to find the ligand with a three-letter code
2. Add the three-letter code or the name of the ligand of interest. For example, type
ATP in the “3 letter code” text field.
The alternative Code text field is used when entering the MSD extended code, which in
cases of topological variants can be different from the three-letter code. In the Molecule
name text field, the user may input a part or a pattern of a molecular name. Both * and
% are accepted as wildcard expressions (that match any number of characters). When
no wildcards are used, they are automatically assumed at both ends, and searches are
case insensitive. For example, the ligand MIT, with the common name ARGATROBAN,
systematic name (2R,4R)-4-methyl-1-(N2-{[(3S)-3-methyl 1,2,3,4-tetrahydroquinolin-8yl]sulfonyl}-L-arginyl)piperidine-2-carboxylic acid, and synonyms MD-805 and MITSUBISHI INHIBITOR will match all following molecule name expressions: inhibitor,
*tetrahydroquinolin* acid, and ARGA%.
3. Click on the Search button and view the list of ligand results. There is a row for
each one of the ligands (in this example, only one) that match the search criteria in
the result page, with summary details that include the three-letter code, the common
name, and the formula, as well as a small overview image of its chemical drawing.
Cheminformatics
14.3.3
Current Protocols in Bioinformatics
Supplement 15
On the top of the page there are links to the list of PDB entries and binding site
details (Golovin et al., 2005) for the set of these ligands.
Documentation can be found by following links from the data item names in the column
headers just below the line reporting the number of results.
View a ligand details page
4. Click on the three-letter code (the PDB reference) to navigate to an individual ligand
details page. The resulting page is shown in Figure 14.3.2. In this page there is
extensive data about the molecule, e.g., common and systematic names, stereo and
nonstereo SMILE strings, formula and molecular charge, and number of total and
heavy (non-hydrogen) atoms. There is also a larger chemical diagram of the molecule
with atoms identified by their common PDB atom names. This diagram and other
information in this page provide an understanding of the chemical context of the
atoms observed in the PDB experiment. Atoms are colored based on their element
type, bond orders, and stereo configurations, while aromatic bonds are displayed
using gray instead of the black color used for other bond types.
5. Click on the Atoms link on the left hand side of the page to obtain more detailed
data. The view shown in Figure 14.3.3 appears, providing a list of the atoms of the
ligand with explicit stereodescriptors, aromatic flags, atomic charges, idealized 3-D
coordinates, and other data at the atomic level.
Additionally, one may get a summary page with all the entities that are part of or associated
with the ligand using the Contents or the Complete contents links.
As usual, the documentation for all data items in all pages is available from links accessed
by clicking on the data item names or the close-by question marks.
Visualize the ligand in three dimensions
6. Select a coordinate set from the Library drop-down menu on the left side of the
ligand details page (Fig. 14.3.2) by choosing one of the menu items described below.
Ideal: idealized 3-D coordinates that are generated automatically by the
CORINA (Gasteiger et al., 1990) software package. CORINA does not use
experimental data but only the molecule connectivity, bond orders, and
chirality to produce a conformation of the molecule that is energetically
favorable in isolation and visually elegant in the 3-D space.
PDB: the set of representative coordinates that wwPDB curators have manually
chosen from all the occurrences of the ligand in PDB files. The “PDB
representative conformation” of a ligand is chosen from the PDB file of an
experiment with the best possible resolution after the curators make sure that
there are no errors or conflicts with this coordinate set and the chemical
structure of the ligand as given by its chemical diagram. This conformation is
the result of the interaction of the ligand with a protein and is useful in
understanding its biological function.
The other menu option, PDB+H (representative non-hydrogen atom coordinates with
idealized hydrogen coordinates), is not used in this step since hydrogen atoms are not
visible for reasons of clarity.
7. Select the viewer of preference from the Viewers drop down menu by choosing one
of the following:
Jmol applet viewer, which will work with any browser without any other
prerequisites, but is missing some functionality of other popular viewers, or
Rasmol/rastop variant viewer, which must be installed by the user.
Using MSDchem
to Search the PDB
Ligand Dictionary
This viewer must be configured as the “chemical/x-pdb” mime type handler of the computer, associated with .pdb files.
14.3.4
Supplement 15
Current Protocols in Bioinformatics
Figure 14.3.2 The MSDchem result page (top), listing the ligand with the three-letter code of ATP
that matches the search criteria, and the ligand details page (bottom) with information about the
ligand properties. Links to ligand content and related data, visualization and export functionality,
and the PDB nomenclature chemical diagram are provided.
8. Click on the View button to obtain one of the views (idealized or representative)
shown in Figure 14.3.4.
Export ligand data in different file formats
9. Select sdf from the Format drop down menu on the left side of the ligand details
page (Fig. 14.3.2).
Cheminformatics
14.3.5
Current Protocols in Bioinformatics
Supplement 15
Figure 14.3.3
MSDchem ligand data at the atomic level that can be accessed from a ligand details page.
Figure 14.3.4 Three-dimensional visualizations of a ligand using the Jmol applet for idealized
versus representative coordinates from MSDchem.
Using MSDchem
to Search the PDB
Ligand Dictionary
14.3.6
Supplement 15
Current Protocols in Bioinformatics
Other choices include PDB, crystallographic mmCif, CML (Chemical Mark-up Language), and XYZ file formats. The reason that MSDChem offers all these alternative
export formats is that the most common ones are not designed to store every important
piece of information. PDB ligand export files can be easily incorporated and used in
parallel with files from the actual PDB archive but are missing placeholders for important chemical properties like bond orders. SDF/MDL format, on the other hand, is one
of the most popular formats in chemoinformatics in that it is able to store the definitive
chemical properties. However, it has no place for PDB atom labels, which are used to
provide direct literature references for ligands on the atom level. Crystallographic mmCif
is the format of the wwPDB exchange designed to solve the problems of incomplete ligand
representation but is not been widely used by chemical and visualization software. CML is
an XML-based format ideal for programmatic use and slowly gaining in popularity, while
XYZ is a very primitive format supported by various general purpose 3-D visualization
packages.
10. Select the HTML option from the Output drop down menu.
Other choices allow a user the options to either download the file on the hard disk to
later open using a text editor or another program or have a look at the contents of the file
directly on a separate browser window.
11. From the Library drop down menu choose either ideal (to use idealized) or PDB
(to use representative coordinates). The Hydrogens checkbox specifies whether to
include hydrogen atoms in the exported files; uncheck this option in order to exclude
hydrogens.
Files that include hydrogen atoms provide a more complete data set, but excluding the
hydrogen atoms may often simplify visualization and processing of the really significant
chemical structure of the heavier atoms. If hydrogen atoms are required, use the pdb+H
option from the Library menu to get representative PDB heavy atom coordinates together
with CACTVS (Ihlenfeldt et al., 1992) idealized hydrogen coordinates. This is usually a
good idea since hydrogen coordinates are often missing from the PDB, and the hydrogen
atoms will have null (zero) coordinates in the exported file. Most export formats do not
distinguish between an atom in the three-dimensional point (0,0,0) from an unobserved
atom, with unpredictable results.
12. Click on the Save button. The pop-up window shown in Figure 14.3.5 will appear.
13. Access the PDB entries that include the ligand, and their binding site information.
On the bottom of the left menu area of the ligand details page, there are links that redirect
the user to the list of PDB entries containing the ligand from MSDlite (Golovin et al.,
Figure 14.3.5 Exporting ligand data with representative heavy-atom and idealized hydrogen
coordinates in the SDF/MDL chemical file format using MSDchem.
Cheminformatics
14.3.7
Current Protocols in Bioinformatics
Supplement 15
2004), as well as to details about its binding sites from MSDsite (Golovin et al., 2005).
For example, following the link for binding statistics labeled “As a Ligand” produces a
chart with the relative frequencies of interactions with various amino acids. The next link
below, labeled “As ligand environment,” is useful for standard and modified amino acids
that can be part of a bound molecule’s environment.
BASIC
PROTOCOL 2
SEARCHING FOR LIGANDS USING A FORMULA OR FRAGMENT
EXPRESSION
Remembering ligand three-letter codes and avoiding mistakes in spelling molecular
names are not easy. Additionally, it may be desirable to perform searches that do not
target a single ligand, but rather a class of ligands that share some common chemical
characteristics (e.g., atoms of particular elements or common chemical groups). A simple
way of performing this type of search is by using a formula range expression or a
pharmacophore fragment expression. Following the steps of this protocol will facilitate
converting these elements into a formula or fragment-based search option that may
significantly reduce the number of candidate ligands that have to be inspected.
Necessary Resources
Hardware
Computer with Internet access
Software
An up-to-date Internet browser, such as Internet Explorer 3.0 or later
(http://www.microsoft.com/ie); Netscape 4.75 or later
(http://browser.netscape.com); Firefox 1.0 or later
(http://www.mozilla.org/firefox)
Use the formula expression editor
1. Open the MSDchem search home page (http://www.ebi.ac.uk/msd-srv/msdchem;
Fig. 14.3.1)
2. Enter a formula range expression (a space-separated list of chemical elements followed by a value or a range for the number of times this element is allowed in the
ligand formula).
The syntax for a formula range expression is as follows.
[<Element> | <Element><Value> | <Element><Minimum>–<Maximum>]
A range has to be given in the form of “minimum value”-“maximum value” (separated
with the “-” character). Elements given without a specified value or a range are equivalent
to <Element>1 while <Element>0 means that the particular element is not allowed at
all. Elements not given in the expression at all may or may not be part of the ligand
formula.
For example: C3-6 N2 F (three to six carbon atoms, exactly two nitrogen atoms, a fluorine,
and anything else); O1-4 N3-100 CL1-100 F0 S0 (no more than four oxygen atoms, at
least three nitrogen atoms, at least one chlorine, no fluorine or sulfur, and anything else).
3. Alternatively, click on the “edit” button on the same line as the Formula text field to
bring up the formula expression editor window shown in Figure 14.3.6.
Using the formula expression editor is optional, but it is a fast and easy way to build
an expression in an interactive way, without having to worry that the formula range
expression being queried is incorrect.
Using MSDchem
to Search the PDB
Ligand Dictionary
4. If using the formula expression editor window, leave the default “formula range”
search operator selected and specify, for example, ligands with one to four oxygen
14.3.8
Supplement 15
Current Protocols in Bioinformatics
Figure 14.3.6 The formula expression editor screen used in an example to obtain MSDchem
ligands with one to four oxygen atoms, at least three nitrogen atoms, no fluorine, and no sulfur.
atoms, more than three nitrogen atoms, and no fluorine or sulfur, by performing the
following steps:
a. Click on O (oxygen) and type in 1 and 4 as the min and max values. Click on
Add.
b. Click on N (nitrogen) and specify 3 as the min value. Click on Add.
c. Click on F (fluorine) and tick the “none” checkbox. Click on Add.
d. Repeat the same step for S (sulfur).
e. When finished, click on OK to transfer the expression in the search page.
In order to add a constraint for a new element on the formula, first click on the corresponding element, choose either the “any” or “none” check box, or alternatively provide
input values into the min and max fields and click on the Add button to append the new
constraint in the formula expression. Just clicking on an element name and immediately
on the OK button will generate the expression equivalent to “any number of atoms of this
element” (the value of 100 is realistically a number for no actual upper limit).
Use the fragment expression editor
5. Go to the MSDchem search home page (http://www.ebi.ac.uk/msd-srv/msdchem).
Click on the “edit” button that is on the same line as the Fragments text field to bring
up the fragment expression editor window shown in Figure 14.3.7. Enter a fragment
name, followed by a value or a range, for the number of times this fragment is
allowed in the ligand formula, as in the following formal description:
[<Fragment> | <Fragment><Value> | <Fragment><Min>-<Max>]
Cheminformatics
14.3.9
Current Protocols in Bioinformatics
Supplement 15
Figure 14.3.7 The fragment expression editor screen used in an example to obtain MSDchem
ligands with two or more benzimidazole and without any piperazine groups.
The benzimidazole and piperazine groups used are shown Figure 14.3.7. There are fragments for about 90 common functional groups that are chosen to be large and characteristic enough to locate real pharmacophores. The selection, which is based on published
literature, is expected to be revised in the future.
Using the fragment editor is convenient because it has a context sensitive list of various
predefined fragments. Whenever the mouse cursor is moved above a group name, the
corresponding fragment is displayed on the top right area of the editor.
Fragments and their display images often include wildcard “green colored - X” types for
atom elements and wildcard “green colored - any” orders for bonds. Aromatic bonds are
displayed with gray color. In order to add a constraint for a new fragment click on the
corresponding group name, choose either the “any” or “none” check box. Alternatively,
provide input values into the “min”-“max” field (for the number of times the fragment
should appear in the molecule).
6. For example, use the fragment expression editor in building an expression for ligands
that have at least two benzimidazole and no piperazine groups by performing the
following steps:
Using MSDchem
to Search the PDB
Ligand Dictionary
a. Click on the benzimidazole group and specify 2 in the min text field.
b. Click on the Add button to specify at least two benzimidazole groups.
14.3.10
Supplement 15
Current Protocols in Bioinformatics
c. Click on the piperazine group and tick the "none" check box.
d. Click on the Add button and then (when finished with all fragments) click on the
OK button. The search home page shown in Figure 14.3.1 will appear, with the
search fields filled out according to the selection made in the previous step.
7. Click on the Search button on the search page to get the list of PDB ligands with
one to four oxygen atoms, at least three nitrogen atoms, no fluorine or sulfur, at least
two benzimidazole groups, and no piperazine groups to obtain the view shown in
Figure 14.3.8.
Figure 14.3.8
constraints.
MSDchem ligands that satisfy particular formula range and fragment expression
Figure 14.3.9 List of PDB entries referring to MSD atlas pages that include ligands that satisfy
particular formula range and fragment expression constraints.
Cheminformatics
14.3.11
Current Protocols in Bioinformatics
Supplement 15
8. Follow links in the results list for details about each individual ligand using the same
steps explained in Basic Protocol 1.
9. Obtain a list of PDB entries from the links on the top of the page for information
on where these ligands can be found or about their binding site details (e.g., see
Fig. 14.3.9).
10. Follow the four-character PDB file name links in the list of PDB entries to the atlas
pages that provide summary information about the PDB entries, or follow the “view”
links to activate a protein 3-D visualization applet for the whole PDB entry.
BASIC
PROTOCOL 3
PERFORMING A CHEMICAL SUBGRAPH SEARCH
Formula and chemical fragment searching is appropriate in cases where little is known
about the ligand chemical structure. Often one may not remember the three-letter PDB
code or chemical name of a ligand but may still easily draw up the diagram of a significant
part of its chemical structure. In cases where the connectivity diagram for a reasonable
fraction of the molecule is known or there is a ligand that is quite similar in terms
of chemical structure, the steps in this protocol may be used to search for a chemical
subgraph, i.e., a subset of the atoms and bond of the target ligand drawn up in a chemical
diagram editor. This procedure will return a restricted list of more accurate candidate
molecules that include the input chemical structure, and it can be also used to look for
ligand variants.
A convenient and popular way to encode a chemical structure into a text string is
by using SMILE strings that are equivalent to chemical formulas but also incorporate
the atom connectivity and chemical properties. A nonstereo SMILE will encode all
the fundamental information found on a chemical diagram but with unspecified atom
chirality. This information is about atom elements, formal charges and connectivity, as
well as bond orders. Nonstereo SMILEs will not be able to distinguish between two
different stereo-isomers, while stereo SMILEs, which also encode stereo descriptors of
atoms and bonds, will. It is usually a lot more convenient to use the nonstereo SMILEs
as the search criteria and then to visually inspect all the stereoisomers. Reading and
writing SMILE strings is a rather difficult exercise for larger molecules and this where a
molecular editor will definitely help.
Necessary Resources
Hardware
Computer with Internet access
Software
An up-to-date Internet browser, such as Internet Explorer 3.0 or later
(http://www.microsoft.com/ie); Netscape 4.75 or later
(http://browser.netscape.com); Firefox 1.0 or later
(http://www.mozilla.org/firefox)
1. Open the MSDchem search home page (http://www.ebi.ac.uk/msd-srv/msdchem;
Fig. 14.3.1).
2. Open the JME molecular editor by clicking on the “edit” button on the same line as
the “Non stereo smile” text field. Sketch the ligand structure or modify the ligand
structure of a similar known ligand (Fig. 14.3.10).
Using MSDchem
to Search the PDB
Ligand Dictionary
14.3.12
Supplement 15
Current Protocols in Bioinformatics
Figure 14.3.10 Screen used for loading the molecular structure diagram of DM1 on JME editor
and modifying it by removing its noncharacteristic atoms or groups in order to prepare a subgraph
search criteria that will match molecules with the same main structure as DM1.
3. For example, to load the chemical diagram of daunomycin, type the three-letter code
(DM1 in this case), a chemical file name (SDF/MOL, mmCif, PDB), or a SMILE
string into the appropriate field on the molecular editor page and click Load. The
molecular diagram of DM1 will appear on the JME editor.
The JME molecular editor is a Java applet embedded in a Web page that offers the
functionality of drawing a chemical diagram. It has controls to add bonds and small
groups (common rings) on the molecule, modify existing atom elements and bond orders,
and remove bonds together with their atoms. In order to use it, first sketch the connectivity
diagram of the desired substructure and then finalize it by modifying noncarbon heavy
elements and bond orders. Use of hydrogen atoms is not recommended, and the editor
will not allow input of a disconnected chemical graph.
4. Click on the delete (DEL) button of JME, and then click on all bonds of the OH
and C-C=O groups linked to the C12 ring atom on the left bottom of the structure to
remove the hydroxyl and methylCO nonring groups linked to atom C12.
5. Click on the OK button to transfer the SMILE string of this chemical subgraph on
the search page.
Alternatively, skip using the molecular editor altogether by directly inputting the SMILE
string or a three-letter code that will be used as a subgraph, assuming that these groups
are not characteristic for the substructure being searched in this example. The result will
be a more generalized chemical subgraph of DM1.
6. Leave the default “has substructure” search operator selected.
7. Click on Search to get the list of molecules that include the substructure. The partial
result is shown in Figure 14.3.11. There are ten ligands that match the specified subgraph search criteria. The images in the results list indicate that they are very similar
Cheminformatics
14.3.13
Current Protocols in Bioinformatics
Supplement 15
Figure 14.3.11 Eight of the ten daunomycin-like ligands that contain the reduced chemical graph of DM1 as a
subgraph, retrieved using the MSDchem “has substructure” search functionality.
molecules, and even the molecular names for most of them suggest that they fall in
the class of daunomycin/doxorubicin variants.
In the case of ERT, the molecule name does not resemble anything, and this is an obvious
example where only a subgraph search will identify the similarity of this ligand with
daunomycins and doxorubicins while a name based one would not.
Using MSDchem
to Search the PDB
Ligand Dictionary
Subgraph searching is nontrivial problem, and this means that often the results are not
instantaneous. The user is warned by a pop-up window that the search may require
a couple of minutes to finish, but in practice, in the majority of cases, the results are
available a lot faster.
14.3.14
Supplement 15
Current Protocols in Bioinformatics
Figure 14.3.12 The 40 PDB entries that include the 10 daunomycin-like ligands and access to
their binding site details from MSDsite.
8. Click on the Get PDB entries URL; there are 40 PDB entries that include these
ligands.
By browsing through, one can also identify similarities in the biological function.
9. At the top right of the results screen, click on the Get PDB sites link to view details
about the binding sites of these ten ligands in PDB entries. The view shown in
Figure 14.3.12 (MSDsite search result page) appears. Follow a link for each PDB
entry to visualize interactions of the ligands with the macromolecule, as well as
further details and statistics regarding strength and distance of the interactions.
There are more search options based on molecule graphs. The drop down menu for search
operators next to the “Non stereo smile” label allow options for “exact structure” and
“is substructure of ” a particular structure. The exact structure search is instantaneous
and will find all ligands that are stereoisomers of the input, using the “Non stereo smile”
data field. If using the “Stereo smile” data field, which is just below, and the same “exact
structure” search operator, one can search for particular stereoisomers but will need to
input the correct stereo configuration in JME. The “Non stereo smile” “substructures
of ” search operator will return ligands that are included as subgraphs in the chemical
graph provided as input.
Search using fingerprint similarity
10. Open the MSDchem search home page (http://www.ebi.ac.uk/msd-srv/msdchem;
Fig. 14.3.1).
11. Type DM1 directly into the “fingerprint” text field.
For known ligands there is no need to use the JME editor in order to draw up their
chemical structure. Giving a three-letter PDB code directly instead of a SMILE string is
enough for MSDchem to automatically use its chemical structure as the search criteria.
The Fingerprint search field uses fingerprints prepared using the existence of each one of
500 segments in the predefined library of the CACTVS system (Ihlenfeldt et al., 1992). This
search option will give useful results mainly for big input molecules where the resulting
hits will have almost the same segment groups (at least 99% common groups).
Cheminformatics
14.3.15
Current Protocols in Bioinformatics
Supplement 15
Figure 14.3.13 Three more hits for DM1 daunomycin-like ligands revealed using the MSDchem
fingerprint similarity searching.
12. Click on the Search button.
Giving the reduced DM1 as input will also return molecules that do not include the
complete input structure but are still quite close in structure. For example, three more
daunomycin/doxorubicin variants are found in this search (shown in Fig. 14.3.13) that
were missed using the subgraph search. In this case the fingerprint similarity search
proved quite useful, although one must take into to account that this option is in general
more unpredictable than subgraph searching.
BASIC
PROTOCOL 4
EXPORTING THE LIGAND DICTIONARY
Searching and downloading data for individual ligands is sufficient in most cases, but
there are still times when it may be useful to have the complete ligand dictionary as a
local resource for convenience or systematic use. The volume of data in the database
is manageable and the MSDchem service offers several options for downloading it in
various formats.
Necessary Resources
Hardware
Computer with Internet access
Software
An up-to-date Internet browser, such as Internet Explorer 3.0 or later
(http://www.microsoft.com/ie); Netscape 4.75 or later
(http://browser.netscape.com); Firefox 1.0 or later
(http://www.mozilla.org/firefox)
A compression/decompression utility that can handle gzip-compressed tar files
(WinZip for Windows, http://www.winzip.com; gzip,
http://www.gnu.org/software/gzip/gzip.html, and tar,
http://www.gnu.org/software/tar, for Linux and other Unix systems)
View the ligand index pages
1. Open the MSDchem search home page (http://www.ebi.ac.uk/msd-srv/msdchem).
Click on link to “ligand index and download” at lower left hand side to open an
MSDchem ligand index page.
Using MSDchem
to Search the PDB
Ligand Dictionary
Ligand index pages provide direct links and data about ligands organized on a very simple
layout. Ligands are listed numerically (0 to 9) and alphabetically (A to Z) according to
the first character of their three-letter code. There are links to all of the index pages on
the top of each index page for easy navigation. Each ligand is presented visually using a
14.3.16
Supplement 15
Current Protocols in Bioinformatics
Figure 14.3.14 The MSDchem ligand index page for the letter A with a list of the 525 ligands
that have a three-letter code starting with the character A. There are links to access and download
data for each one of them as well as for the whole ligand collection.
small image of its chemical diagram, together with its common name and three-letter code
for ligand identification. There are also links for the ligand details page and for chemical
file format downloads. These pages can be useful for browsing ligands with interesting
structure and for access to general purpose Web search engines that use components of
ligand names.
2. Click on the letter A to obtain the view shown in Figure 14.3.14.
Download ligand files
3. Click on one of the four links at the top of each ligand page (Fig. 14.3.14) to download
a gzip-compressed tar file for the complete ligand collection in a single compressed
archive file. The file contains separate entries (∼7000 as of this writing) for each
ligand in one of the SDF/MDL, CML, PDB, or mmCif formats.
4. Alternatively, export an SDF/MDL, CML, PDB, or mmCif file for an individual
ligand (e.g., DM1) by using the corresponding link in the ligand index page for letter
D and clicking on the format link associated with DM1 (e.g., CML). The CML file
for this entry will appear as shown in Figure 14.3.15.
Alternatively, the file may be saved in a temporary area and opened later using the
appropriate program. Run the utility and export the files on a local directory.
Download a single file with summary data for all ligands
5. Click on the Export button on the MSDchem search home page (http://www.ebi.
ac.uk/msd-srv/msdchem) to get a list of all ligands, together with their common
names and SMILE strings, in a single XML file. Choose the output format from the
Retrieve drop-down menu to get the list as a Perl or JavaScript data structure for
easier programmatic processing.
Cheminformatics
14.3.17
Current Protocols in Bioinformatics
Supplement 15
Figure 14.3.15
letter D.
The CML file for ligand DM1 as exported through the ligand index page for the
COMMENTARY
Background Information
Using MSDchem
to Search the PDB
Ligand Dictionary
The PDB ligand dictionary
The information available from the ligand
dictionary is not part of the historical PDB
archive. The PDB data bank files do not provide a clear chemical definition for ligands and
amino/nucleic acids. Nevertheless, the PDB
nomenclature based on three-letter codes and
atom names clearly suggests that ligands with
the same three-letter code should be the same
chemical species and that atoms should superimpose within a stereochemical diagram.
Of course, an explicit process to validate this
rule has not always been in place, and the
PDB archive has many errors propagated over
the years. Furthermore, deriving the chemical
identity of a ligand using a set of 3-D coordinates from a PDB entry is not a reliable operation, especially since there are inaccurate or
unavailable experimental data in many cases.
The international body that manages the
PDB is the Worldwide Protein Data Bank
(wwPDB; Berman et al., 2005), with the mis-
sion of maintaining a single archive, freely
and publicly available to the global community. wwPDB was founded by the Research
Collaboratory for Structural Bioinformatics
(RCSB PDB USA), the Macromolecular
Structure Database group (MSD-EBI Europe)
and the PDBj (Japan). All three organizations
serve as deposition, data processing, and distribution sites for the PDB archive. Each site
additionally provides its own view of the primary data with a variety of tools and resources
for the global community.
There is an ongoing effort in wwPDB to
address the problem of missing chemical definitions and to provide references and cleanedup PDB data. At the time of curation of PDB
entries, extensive work is done in carefully examining ligand chemistry issues and resolving
them in cooperation with the depositors. The
ligand dictionary (Westbrook et al., 2005), exchanged in the wwPDB (Chemical Component Information dictionary), that forms the
basis of MSDchem, is a first step toward
14.3.18
Supplement 15
Current Protocols in Bioinformatics
achieving this goal. The wwPDB partners are
making a systematic effort to finalize and resolve any remaining issues. This effort will
ultimately be consolidated into a common dictionary. MSDchem incorporates the results of
this effort, and at times it may provide data
and corrections that are ahead of this common
dictionary.
Ligand stereochemistry in MSDchem ligand
dictionary
The MSDchem ligand dictionary includes
explicit stereodescriptors using the absolute Chan-Ingold-Prelog notation as part of
the definition of atoms and bonds in order
to cope with the PDB implicit convention,
i.e., different stereoisomers should be identified by different three-letter codes. Additionally, the MSDchem back-end system utilizes chemoinformatics programs and libraries
like the CACTVS software package (Ihlenfeldt
et al., 1992) and the CORINA Web service
(Gasteiger et al., 1990) in order to enrich the
ligand dictionary with important chemical information and to validate and clean-up the data
collection.
The MSDchem view is that PDB coordinates and atom names are not fundamental
properties of a ligand, which is defined as a
complete, distinct stereoisomer of a chemical compound. Representative coordinates are
used as speculative chemistry, and they require
manual curation since a set of coordinates may
be compatible with different isomers. On the
other hand, there may be conflicts with the depositor’s view of ligand chemistry introduced
as errors in experimental data or in the refinement process. Therefore, the unique chemical
identity of a ligand in MSDchem is based on its
stereo SMILE string in the CACTVS canonical unique form, including automatic detection
of aromaticity and tautomerism.
UNIT 1.9 describes in detail the PDB archive
data and the RCSB PDB Web tools as well as
Ligand Depot, the RCSB’s Web search system
for small molecule information. Ligand Depot,
among others, provides access to various small
molecule sites and resources, one of which is
MSDchem.
Role of the MSDchem database
The MSDchem database provides the
framework for the contribution of the Macromolecular Structure Database group in the
wwPDB ligand curation and clean-up effort
and for the correct processing of new PDB ligands and entries. It is based on the wwPDB
chemical component information dictionary
(Westbrook et al., 2005) and is an exchange
resource; nevertheless, it also introduces several extensions like the use of explicit stereoconfiguration descriptors as part of the ligand
identity.
Additionally, MSDchem has identified several cases where the same chemical species
has been defined more than once using different three-letter codes. In these cases, one
unique three-letter identifier has been selected
and the remaining codes have been marked as
obsolete in the MSDchem database in order
to stop their use in new PDB entries. These
obsolete ligands will be highlighted in all MSDchem result pages, with direct links to the
entries that supersede them.
Topological variants
The MSDchem database also includes
topological variants of small molecules (typically standard and modified amino/nucleic
acids) that form polymeric chains. Amino
acids, for example, usually have four entries
for the same small molecule in the dictionary, one each for the free, N-terminal, Oterminal, and linking variants. This is apparent from the value of the “Extended code”
column that is included in MSDchem results
and ligand details pages. There is no predefined formula for the extended code values,
and the format depends on the type of polymerization. However, the following standard
naming conventions are used: <three-letter
code> LFOH for L-form of a free amino acid
with OH group added; <three-letter code> LL
for L-form of a linking amino acid residue;
<three-letter code> LSN3 for L-form of a
starting N-terminal (NH3 + group); <threeletter-code> LEO2 for L-form of an ending
O-terminal (O2 − group).
The results from the protocols presented
in the unit were retrieved from MSDchem release 28-2006 06 25. MSDchem is following
the PDB weekly release cycle.
Critical Parameters and
Troubleshooting
Even though the production of MSDchem requires systematic checking and corrections, it still contains several known errors and inaccuracies. These errors may be
due to missing or problematic experimental
data (e.g., incomplete single set of fully observed coordinates for some ligands or inconsistencies between the experimental coordinates and the chemical description), bugs
or inaccuracies in chemical software packages (core dumps or error messages during
Cheminformatics
14.3.19
Current Protocols in Bioinformatics
Supplement 15
stereo-identification and idealized coordinate
generation), or incomplete manual curation
(e.g., valence inconsistencies or missing hydrogen atoms).
It is important to understand that construction of the MSDchem database and back-end
system is an ongoing effort that will gradually
improve the quality of the data collection and
merge it into wwPDB. In addition, MSDchem
provides a reference definition for a ligand that
is not required to be consistent with data in
the PDB archive. The task of validating and
correcting the PDB data with ligand definitions is a separate effort that is only loosely
associated with the quality of the data in
MSDchem.
Finally, the MSDchem Web service has an
additional restriction to avoid server and user
overload. There is a maximum limit of 300 hits
in any search. On exceeding this limit, the first
300 results are displayed along with a clear
warning on the result page that the search has
to be further refined.
Acknowledgements
The Macromolecular Structure Database
(MSD) group is part of the European BioInformatics Institute (EBI), which is one of the
outstations of the European Molecular Biology Laboratories (EMBL) located in the
Welcome Trust Genome Campus at HinxtonCambridge, UK.
Peter Keller, Sameer Velankar, Jawahar
Swaminathan, John Ionides, Harry Boutselakis, Adel Golovin, and many other members of the MSD group have significantly contributed to MSDchem, together with all partners of wwPDB who are committed to the
ligand dictionary exchange effort. MSD funding has been provided from the EU-Templor
project, by the Wellcome trust and EMBL/EBI
core support.
Finally, chemical software development
projects like CACTVS and CORINA play
a crucial role in providing supporting technology in the back-end of the MSDchem
database.
Literature Cited
Using MSDchem
to Search the PDB
Ligand Dictionary
Berman, H., Nakamura, H., and Henrick, K. 2005.
The Protein Data Bank (PDB) and the WorldWide PDB http://www.wwpdb.org. In Encyclopedia of Genetics, Genomics, Proteomics
and Bioinformatics. Section 4.6. (M. Dunn,
L. Jorde, P. Little, and S. Subramaniam, eds.)
http://www.mrw.interscience.wiley.com/ggpb/
articles/g406303/frame.html. John Wiley &
Sons, Hoboken, N.J.
Bernstein, F.C., Koetzle, T.F., Williams, G.J.B.,
Meyer, E.F. Jr., Brice, M.D., Rodgers, J.R.,
Kennard, O., Shimanouchi, T., and Tasumi, M.
1977. Protein Data Bank: A computer-based
archival file for macromolecular structures. J.
Mol. Biol. 112:535-542.
Boutselakis, H., Dimitropoulos, D., Henrick,
K., Ionides, J., John, M., Keller, P.A.,
McNeil, P., Pineda, J., and Suarez-Uruena. A.
2004. The European Bioinformatics Institute
macromolecular structure relational database
technology. In Database Annotation in Molecular Biology. pp. 223-240. John Wiley & Sons,
Hoboken, N. J.
Gasteiger, J., Rudolph, C., and Sadowski, J. 1990.
Automatic generation of 3D-atomic coordinates for organic molecules. Tetrahedron Comp.
Method. 3:537-547.
Golovin, A., Oldfield, T.J., Tate, J.G., Velankar, S.,
Barton, G.J., Boutselakis, H., Dimitropoulos,
D., Fillon, J., Hussain, A., Ionides, J.M.C.,
John, M., Keller, P.A., Krissinel, E., McNeil,
P., Naim, A., Newman, R., Pajon, A., Pineda, J.,
Rachedi, A., Copeland, J., Sitnov, A., Sobhany,
S., Suarez-Uruena, A., Swaminathan, J., Tagari,
M., Tromm, S., Vranken, W., and Henrick,
K. 2004. E-MSD: An integrated data resource
for bioinformatics. Nucl. Acids Res. 32:D211D216.
Golovin, A., Dimitropoulos, D., Oldfield, T.,
Rachedi, A., and Henrick, K. 2005. MSDsite:
A database search and retrieval system for the
analysis and viewing of bound ligands and active
sites. Proteins 58:190-199.
Ihlenfeldt, W.D., Takahasi, Y., Abe, H., and
Sasaki, S. 1992. CACTVS: A chemistry algorithm development environment. In Daijuukagakutouronkai Dainijuukai Kouzoukasseisoukan Shinpojiumu Kouenyoushishuu (K.
Machida and T. Nishioka, eds.) pp. 102-105.
Kyoto University Press, Kyoto, Japan.
Krissinel, E.B., Winn, M.D., Ballard, C.C., Ashton,
A.W., Patel, P., Potterton, E.A., McNicholas,
S.J., Cowtan, K.D., and Emsley, P. 2004. The
new CCP4 Coordinate Library as a toolkit for the
design of coordinate-related applications in protein crystallography. Acta. Crystallogr. D Biol.
Crystallogr. 60:2250-2255.
Weininger, D. 1988. SMILES 1. Introduction and
encoding rules. J. Chem. Inf. Comput. Sci.
28:31.
Westbrook, J.D., Henrick, K., Ulrich, E., and
Berman, H.M. 2005. Classification and use of
macromolecular data. Appendix 3.6.2. The Protein Databank exchange dictionary. In International Tables for Crystallography, Vol. G: Definition and Exchange of Crystallographic Data
(S. Hall and B. McMahon, eds.) pp. 195-197.
Springer, Dordrecht, The Netherlands.
Key References
Berman et al., 2005. See above.
A description of the wwPDB consortium, its organization, and goals.
14.3.20
Supplement 15
Current Protocols in Bioinformatics
Dutta, S., Burkhardt, K., Bluhm, W.F., and Helen, B.
2006. Using the tools and resources of the RCSB
Protein Data Bank. In Current Protocols in
Bioinformatics (A.D. Baxevanis, R.D.M. Page,
G.A. Petsko, L.D. Stein, and G.D. Stormo, eds.)
pp. 1.9.1-1.9.40. John Wiley & Sons, Hoboken,
N. J.
Explains various concepts about the PDB, the wwPDB, and tools that are provided by the RCSB partner, as well as the corresponding Ligand Depot service databases and suite of Web tools.
Golovin et al., 2004. See above.
A consistent overview of the activities and policies
of the MSD group at EBI and of the concepts of the
MSD.
Westbrook et al., 2005. See above.
A description of the process of the wwPDB exchange, which is the basis of the MSDchem
database.
Internet Resources
http://deposit.pdb.org/public-component-erf.cif
The Chemical Component Information dictionary
that is exchanged in wwPDB.
http://www2.chemie.uni-erlangen.de/software/
cactvs
The CACTVS chemistry algorithm development environment, the main software package used by
MSDchem database and Web service
http://www2.chemie.uni-erlangen.de/software/
corina
The CORINA Web service for fast and efficient generation of high-quality 3-D molecular models used
to generate idealized coordinates for ligands.
http://www.molinspiration.com/jme
The home page of the JME Molecular Editor Java
applet used by MSDchem Web service.
http://jmol.sourceforge.net
The home page of the Jmol, free, open source 3-D
molecule viewer used by MSDchem Web service.
http://www.ebi.ac.uk/msd-srv/msdchem
The MSDchem search home page.
http://www.mdli.com
Information about the definition of the popular
MDL CTfile Formats.
http://www.ebi.ac.uk/msd/index.html
Contains information about the MSD group and the
MSD suite of tools and services.
http://www.acdlabs.com
The ACD-labs chemical software package used at
the time of curation of new ligands.
http://www.ebi.ac.uk/msd-srv/msdlite
The MSDlite search system provides overview atlas
pages for PDB entries, using the MSD database.
http://users.unimi.it/∼ddl/vega/index noanim.htm
The VEGA Molecular modeling software package
used in the back-end of the MSDchem database.
http://www.ebi.ac.uk/msd-srv/msdsite
The MSDsite Web service that provides details
about ligand occurrences and binding sites of small
molecules in PDB entries.
http://www.ebi.ac.uk/msd-srv/docs/dbdoc
Contains information about the MSDSD public
search relational database and how to download
and use it.
Contributed by Dimitris Dimitropoulos,
John Ionides, and Kim Henrick
European Bioinformatics Institute
Hinxton, Cambridgeshire
United Kingdom
http://www.ebi.ac.uk/msd-srv/docs/moldoc/
help.html
The molecule subgraph containment package used
by the MSDchem search system.
Cheminformatics
14.3.21
Current Protocols in Bioinformatics
Supplement 15
In Silico Drug Exploration and Discovery
Using DrugBank
UNIT 14.4
DrugBank is a Web-based bioinformatics/cheminformatics resource that combines detailed drug data with comprehensive drug target information. It is primarily designed to
facilitate computer-based drug and drug target discovery. Since it electronically catalogs
almost all known drugs and drug targets, DrugBank is also used as a comprehensive online reference by pharmacists and pharmaceutical researchers. First released in January
2006, the DrugBank database is continuously being updated as new drugs are approved
by the FDA or as new drug leads are identified (Wishart et al., 2006). DrugBank is
fully searchable and supports extensive text, sequence, chemical structure, and relational
database queries. Potential applications of DrugBank include computer-based drug target
discovery, in silico drug design, drug docking or screening, drug metabolism prediction,
drug interaction prediction, and general pharmaceutical education. In this unit, readers
will be shown how to effectively navigate through and retrieve data from the DrugBank
Web site (Basic Protocol 1), how to perform chemical structure similarity searches (Basic
Protocol 2), and how to identify potential drug targets from newly sequenced pathogens
(Basic Protocol 3).
Chemical structure similarity searching (Basic Protocol 2) is the chemical equivalent of
searching a sequence database for sequence homologs or searching the Protein Data Bank
(PDB; UNIT 1.9) for similar protein folds. It is particularly useful for organic chemists or
natural product chemists who are interested in determining whether a newly synthesized
compound or a newly identified natural product exhibits some similarity to a known
drug. It is also useful for finding or comparing different compounds that are thought to
be similar in structure. Drug target identification (Basic Protocol 3) essentially involves
the identification of protein sequences from a newly sequenced pathogen that exhibit
some similarity to the sequences of known drug targets. Presumably, if a novel virus or
a newly identified pathogenic bacterium share some significant sequence similarity to a
protein that is a known drug target from another organism, then the same (or similar)
drugs may be used to treat this pathogen. Alternately, if they prove to be ineffective, these
previously known drugs may serve as potential drug leads for developing more effective
therapies. These protocols and their accompanying descriptions are intended to provide
users with an appreciation of how cheminformatics (the study of chemical information)
can be integrated into bioinformatics in a very practical and medically useful way.
NAVIGATING THE DrugBank WEB SITE
DrugBank can be accessed at: http://redpoll.pharmacy.ualberta.ca/drugbank/. It is a
Web-accessible database that is structured to facilitate both casual browsing and directed
searching. DrugBank is compatible with most modern Web browsers (equipped with a
Java interpreter) and is designed to be navigated using standard hyperlinked menus or
hyperlinked text. The appearance of the database and its functionality should be the same,
regardless of the user’s browser or operating system. As with any online tool, DrugBank
has a home page with a hyperlinked menu bar located at the top of the page. This menu
bar allows users to easily move back and forth between specific display or query pages.
Directed queries or text and sequence searches are typically done by typing or pasting
text into standard text boxes and the query function is activated by pressing a “Search”
or “Submit” button. The home page also provides a brief overview of the database and
some of its features. This protocol describes in detail how users can find, view, interpret,
and retrieve data from the DrugBank Web site.
BASIC
PROTOCOL 1
Cheminformatics
Contributed by David S. Wishart
Current Protocols in Bioinformatics (2007) 14.4.1-14.4.32
C 2007 by John Wiley & Sons, Inc.
Copyright 14.4.1
Supplement 18
Necessary Resources
Hardware
Computer with Internet access
Software
An up-to-date Internet browser, such as Internet Explorer (http://www.microsoft.
com/ie); Netscape (http://browser.netscape.com); Firefox (http://www.mozilla.
org/firefox); or Safari (http://www.apple.com/safari). The Web browser must be
capable of handling Java Applets (i.e., equipped with a Java interpreter) and
capable of opening and viewing PDF files.
Files
None
Standard DrugCard overview
1. Go to the DrugBank Web site at http://redpoll.pharmacy.ualberta.ca/drugbank/.
The DrugBank home page (Fig. 14.4.1) has a blue menu bar located near the top of the
page with eight clickable titles: Home, Browse, PharmaBrowse, ChemQuery, TextQuery,
SeqSearch, Data Extractor, and Download. This menu bar, which appears near the top
of every DrugBank Web page, allows users to easily navigate to the different browsing
and search utilities in the database. Below the menu bar is a text box with the phrase
Search DrugBank for. This text search utility, which is the most commonly used search
feature in DrugBank, is also displayed near the top of nearly every DrugBank Web page.
Below this is a brief description of DrugBank and some of the features contained in the
database. Users may refer to this page for more information on how to use DrugBank or
to get the latest information on what is contained in it.
In Silico Drug
Exploration and
Discovery Using
DrugBank
Figure 14.4.1 Screen shot of the DrugBank home page. At the top of the page is a menu bar
(blue on screen) containing eight menu choices (in white). Users can navigate through DrugBank
using this menu bar. Details of how to use, contact, and reference DrugBank are given in the
central text window.
14.4.2
Supplement 18
Current Protocols in Bioinformatics
2. Type tricyclic into the Search DrugBank for text box and then press the Search
button. A three-column table should appear within a few seconds, containing a list of
almost all known tricyclic antidepressant drugs, as well as other tricyclic molecules
(Fig. 14.4.2). The first column displays the DrugBank accession number (which is
hyperlinked); the second column displays the drug’s generic (or common) name,
while the third column displays the chemical formula.
The text search is a non-case-sensitive utility that supports searches of complete words,
numbers, multiple words, phrases, and partial words (be careful, numeric searches can
take a while). Users could enter tryc or tricyclic anti, for example, and similar results would be returned (23 to 30 hits). Not all of the drugs listed are tricyclic
antidepressants, as they only contain the quoted word or word segments somewhere in
their data files. It is important to mention the fact that DrugBank’s text search utility is
not restricted to drugs or drug names—it is able to search through most any text in the
database, including gene and protein names that are known drug targets. Note that the
text search tool does not search through sequence text. The search engine uses a rapid
index-based query tool called GLIMPSE (Manber and Bigot, 1997). Hits are ordered
according to the DrugBank accession numbers, with FDA-approved drugs given first
(marked by an APRD prefix), followed by experimental or preclinical drugs (marked by
an EXPT prefix). Biotech drugs are given the BIOD prefix.
3. Click on the hyperlinked accession number for desipramine (APRD00022). A
new window should be launched containing the “DrugCard” for desipramine
(Fig. 14.4.3).
All of the drugs contained in DrugBank have their information listed in individual
DrugCards—in analogy to the very successful GeneCards concept (Rebhan et al., 1998).
Each DrugCard entry contains >80 data fields, with half of the information being devoted
to drug/chemical data and the other half devoted to drug target or protein data (see
Table 14.4.1). More specifically, the DrugCard information is ordered as follows: (1)
drug nomenclature; (2) physical properties; (3) structural data; (4) pharmacological
Figure 14.4.2 A screen shot of a Search DrugBank for query output for the word “tricyclic.” The
drug names on the left side of the table are hyperlinked.
Cheminformatics
14.4.3
Current Protocols in Bioinformatics
Supplement 18
Figure 14.4.3
A screen shot of the DrugCard for desipramine, a tricyclic antidepressant.
data; (5) drug target or target protein data; and (6) genetic and/or SNP data for the
target protein. If a drug has more than one biomolecular target, the protein and genetic
data fields are repeated for each protein target. In addition to providing comprehensive numeric, sequence, and textual data, each DrugCard also contains hyperlinks to
other databases, abstracts, digital images, and interactive applets for viewing molecular
structures.
4. To get better acquainted with the type of information contained in a typical DrugCard,
use the scroll bar on the right side of the browser’s window to scroll down the
desipramine DrugCard page. Field names or titles are given on the left side of
the table, while drug-specific descriptors are given on the right. The top portion
of each DrugCard is devoted to providing detailed information about the names,
synonyms, chemical structure, and general information for that drug. Some of the
fields contain hyperlinks (marked in light blue text). Click on the KEGG Compound
ID hyperlink (see UNIT 1.12). This will launch a new window to the KEGG Web page
for desipramine. Close this window, then click on the PubChem ID (Substance or
Compound) hyperlink. This will launch the PubChem page for desipramine. After
viewing the PubChem site, close its window. The desipramine DrugCard should still
be visible.
In Silico Drug
Exploration and
Discovery Using
DrugBank
The chemical and biological information contained in DrugBank is assembled from more
than a dozen textbooks, several hundred journal articles, nearly 30 different electronic
databases, and at least 20 in-house or Web-based programs were individually searched,
accessed, compared, written, or run over the course of four years. The original team
of DrugBank archivists and annotators included two accredited pharmacists, a physician, and three bioinformaticians with dual training in computing science and molecular
biology/chemistry. Manual updates of the database are continuing, although many annotation fields are now being automatically updated and added using customized text-mining
programs.
5. To view an editable 2-D image of desipramine, scroll down to the data field called
MOL File Image and click on the hyperlinked button called View 2D Structure.
14.4.4
Supplement 18
Current Protocols in Bioinformatics
Table 14.4.1 Summary of the Data Fields or Data Types Found in Each DrugCarda
Drug or compound information
Drug target or receptor information
Generic name
Target name
Brand name(s)/synonyms
Target synonyms
IUPAC name
Target protein sequence
Chemical structure/sequence
Target no. of residues
Chemical formula
Target molecular weight
PubChem/KEGG/ChEBI Links
Target pI
SwissProt/GenBank Links
Target gene ontology
FDA/MSDS/RxList Links
Target general function
Molecular weight
Target specific function
Melting point
Target pathways
Water solubility
Target reactions
pKa or pI
Target Pfam domains
LogP or hydrophobicity
Target signal sequences
NMR/MS spectra
Target transmembrane regions
MOL/SDF/PDF text files
Target essentiality
MOL/PDB image files
Target GenBank Protein ID
SMILES string
Target SwissProt ID
Indication
Target PDB ID
Pharmacology
Target cellular location
Mechanism of action
Target DNA sequence
Biotransformation/absorption
Target chromosome location
Patient/physician information
Target locus
Metabolizing enzymes
Target SNPs/mutations
a A more complete listing is provided on the DrugBank home page.
This launches ACD’s ChemSketch Java applet. After a few seconds, an image of
desipramine should appear in the applet window (Fig. 14.4.4). If it does not, this
likely indicates that the browser being used lacks the Java Virtual Machine and
needs upgrading. The ChemSketch applet used to display this image allows the user
to interactively alter, view, rotate, or zoom into the structure and to cut/paste the
image (or altered image) into other files.
In addition to structural images of the drug, MOL and SDF text files are also available.
MOL and SDF files are standard formats used by chemists to exchange and render 2-D
chemical structure information. These files can be downloaded by the user and used
to display or re-render the structures using higher-end commercial chemistry software
packages like ChemDraw, ChemSketch, or IsisDraw.
6. A 3-D structure of desipramine can also be viewed by clicking on the hyperlinked
button View 3D Structure contained in the PDB File Calculated Image field. This
launches the WebMol interactive 3-D viewing applet (Fig. 14.4.5). The Calculated
3-D structure is generated via CORINA (Sadowski and Gasteiger, 1993). If an
experimental set of 3-D coordinates (in PDB) is available, these may be viewed in a
similar manner. 3-D coordinate files can also be downloaded and the structure can
be minimized or a molecular dynamics run may be performed (using third-party
software) to generate multiple conformers of the drug. These structures may be used
Cheminformatics
14.4.5
Current Protocols in Bioinformatics
Supplement 18
Figure 14.4.4 A 2-D image of the structure of desipramine as displayed using the ChemSketch
Java applet. The image may be manipulated for different display purposes.
for ligand docking experiments with such tools as GLIDE (UNIT 8.12) or FLEXX
(Kramer et al., 1997; Halgren et al., 2004).
CORINA is a rule-based structure generation program that has been shown to generate
very accurate 3-D structures from 2-D chemical sketches. These calculated structures
◦
typically differ from the experimentally determined structures by no more than 0.4 A.
The same WebMol applet that is used to display small molecule drugs in DrugBank
can also be used to display protein structures of either the drug target or of certain
biotech drugs (e.g., BIOD00017). WebMol is a fast, flexible viewing tool that allows
users to rotate, zoom, color, stereoview, measure, label, and selectively display different
parts of a molecule. More information about WebMol and how to use it can be found at
http://www.cmpharm.ucsf.edu/∼walther/webmol.html.
7. Continue to scroll down the desipramine DrugCard. Numerous fields containing
detailed pharmaceutical, pharmacological, and clinical data should be seen (e.g.,
Drug Category, Indication, Pharmacology, Absorption, Toxicity, Half Life, Interactions), as well as hyperlinks to different online Drug References (RxList and
Drugs.com). Click on these to see what additional clinical information is available on
desipramine. Remember to close the window once the information has been viewed.
Scrolling further down on the desipramine DrugCard a table separator labeled Drug
Target 1 should be seen. This marks the beginning of the biological data on the
genes and proteins that this drug is known to target. For instance, desipramine is
known to bind to the M1 muscarinic acetylcholine receptor. As seen in this section,
a considerable amount of detailed information is provided about this protein. This
information can be particularly useful if one is planning on purifying, cloning, or
working with the protein for any prospective drug assays.
In Silico Drug
Exploration and
Discovery Using
DrugBank
DrugBank is particularly notable for the amount of biological information it provides
about known drug targets. Many of its annotations are obtained through direct database
comparisons to SwissProt and UniProt (Bairoch et al., 2005) or “guilt-by-association”
14.4.6
Supplement 18
Current Protocols in Bioinformatics
Figure 14.4.5 An image of the 3-D structure of desipramine as displayed using the WebMol Java
applet. Users may manipulate the image for better viewing or further analysis.
determinations through BLAST searches. However, other annotations are obtained independently using a variety of in-house predictive programs, including protein family
analysis with Pfam (Bateman et al., 2004), sequence motif analysis with PROSITE (Hulo
et al., 2004), signal peptide and transmembrane domain prediction with TM-HMM (Krogh
et al., 2001), and secondary structure prediction with PSIPRED and PROTEUS
(McGuffin et al., 2000; Montgomerie et al., 2006). If the sequence has >35% sequence
identity to a sequence represented in the PDB database, a homology model is generated using a program called HOMODELLER and subsequent structural analyses are
performed using VADAR (Willard et al., 2003). Several additional annotations, such as
molecular weight, amino acid content, and isoelectric point are calculated directly from
the amino acid sequence using well-known algorithms and formulae.
8. Near the bottom of the Drug Target 1 section of the desipramine DrugCard will be
a detailed list containing information about the Single Nucleotide Polymorphisms
or Drug Target 1 SNPs associated with the M1 muscarinic acetylcholine receptor
gene (Fig. 14.4.6). This multicolumn table provides a hyperlink to the refSNP ID,
the type of SNP (synonymous or nonsynonymous), level of validation, base changes,
position of the SNP, the consequent amino acid changes (if applicable), the amino
acid position (if applicable), and the allele frequencies in different populations.
SNP information is particularly important for understanding the origins for certain
diseases, the propensity for individuals to get certain diseases and, most particularly,
the cause of adverse drug reactions (ADRs).
ADRs are unexpected, drug induced problems that adversely affect the health of a patient.
Sometimes they are called drug “allergies.” Some individuals and some ethnic groups
are known to have strong reactions to certain drugs or to require significantly different
dosing regimens than other individuals or groups. Many of these differences are likely
due to SNPs in either the drug target or a drug metabolizing enzyme. Recently, several
drugs (aripiprazole, atomoxetin, and celecoxib) have received FDA approval for only
targeted segments of the population having the appropriate SNP genotype. Adverse drug
Cheminformatics
14.4.7
Current Protocols in Bioinformatics
Supplement 18
Figure 14.4.6 Details of the SNP (single nucleotide polymorphism) drug target information contained in the DrugCard for desipramine.
reactions are not a trivial problem. They lead to an average of two million hospitalizations, 100,000 deaths and thousands of malpractice suits per year in the United States
alone. Furthermore, approved-drug withdrawals due to adverse drug reactions can cost
pharmaceutical companies billions of dollars (recall Vioxx and Bextra).
9. Scroll down further through the desipramine DrugCard. The DrugCard will contain 6
more drug targets for desipramine including the Sodium-dependent norepinephrine
re-uptake pump, the beta-2 adrenergic receptor, the M2 muscarinic acetylcholine
receptor, the sodium-dependent serotonin re-uptake pump, the histamine H1 receptor,
and the beta-1 adrenergic receptor. A quick check will reveal that similarly detailed
biochemical and genetic data is available for each of these targets.
Using the DrugBank Browser and PharmaBrowse tools
The following part of the protocol involves learning how to use the navigation and search
tools listed in the DrugBank menu bar.
10. Return to the DrugBank home page (press the back button on the browser or re-enter
the DrugBank URL). Click on the Browse hyperlink located in the left side of the
DrugBank menu bar. This launches the DrugBank Browser (Fig. 14.4.7).
In Silico Drug
Exploration and
Discovery Using
DrugBank
The DrugBank Browser consists of a multi-page summary table listing all the drugs in
DrugBank. Each browser page contains a formatted list of ∼20 drugs that includes the
DrugBank accession code, the generic (or common) drug name, the molecular formula
(and weight), a thumbnail image of the drug structure, the CAS (Chemical Abstract
Service) number, the therapeutic indication (the disease or condition it is used to treat), and
the drug class—for each drug. Using the DrugBank Browser users may navigate through
DrugBank in a slightly different way than through the text search tool. In particular, the
DrugBank Browser allows users to select or sort drugs on the basis of drug class, accession
code, or molecular weight. Clicking on the DrugCard button found in the leftmost column
of any given DrugBank browser table opens the corresponding DrugCard.
14.4.8
Supplement 18
Current Protocols in Bioinformatics
Figure 14.4.7 A screen shot of the DrugBank Browser. Note the tabular format and the sorting/display tools at the top of the Browser page.
11. At the top of the DrugBank Browser users may use the pull-down menu tab called
Select Drug Type to select the type of drug class they wish to view. Users may
choose between FDA-approved Drugs, Experimental, Nutraceutical, Biotech, Small
Molecule Drugs (approved and experimental), and All Compounds (Experimental +
Approved). The default class is FDA-approved Drugs. For this step in the protocol,
select the Biotech drug class from the pull-down menu. The Browser page should
automatically change to the screen shown in Figure 14.4.8.
DrugBank contains ∼1100 FDA-approved small molecule drugs, 120 FDA-approved
biotech (protein/peptide) drugs, 65 nutraceuticals or micronutrients such as vitamins and
metabolites, and 3200 experimental drugs, including unapproved drugs, de-listed drugs,
illicit drugs, enzyme inhibitors, and potential toxins (Wishart et al., 2006). Generally
much less pharmacological and biophysical data is available for the experimental drugs
than for the approved drugs. Users may note that the Biotech drugs contain “generic”
structures for their thumbnail images rather than detailed chemical structures as seen for
the small molecule drugs. This is because most Biotech drug molecules are simply too
large and too complex to show anything meaningful in a thumbnail sketch.
12. Below the Select Drug Type pull-down tab is a rectangular blue box that serves
as the Browser’s sorting and reformatting interface. Within this box is a Sort By
pull-down tab. Users may sort any given DrugBank summary table by the DrugBank
accession code, generic name, molecular weight, CAS number, therapeutic category,
or therapeutic indication. Using the Display pull-down tab, users may also reformat
the table to display 20, 50, 100, or 200 drugs per page. A repagination selector at
the bottom of the box allows users to navigate from one page to another or to jump
from one page to another quickly simply by clicking the hyperlinked page numbers
or arrows. Sort the table by Molecular Weight and use the Display tab to show 100
drugs per page. The results should look like what is shown in Figure 14.4.9.
Cheminformatics
14.4.9
Current Protocols in Bioinformatics
Supplement 18
Figure 14.4.8
A screen shot of the DrugBank Browser set to display biotech (i.e., protein) drugs.
Figure 14.4.9 A screen shot of the DrugBank Browser set to display biotech drugs sorted by
molecule weight (from smallest to largest).
In Silico Drug
Exploration and
Discovery Using
DrugBank
14.4.10
Supplement 18
Current Protocols in Bioinformatics
The selecting, sorting, reformatting, and repagination features of the DrugBank Browser
are particularly useful for surveying particular classes of drugs and getting a global
picture of certain drug characteristics. Users may notice certain trends or patterns in
the structure or therapeutic indications of selected drugs. They may also easily identify
the largest or smallest drugs or quickly count up the total number of drugs belonging
to a particular class or therapeutic indication. In the example shown here, it can be
seen that the smallest biotech drug is eptifibatide, with a molecular weight of 831.96 Da.
The DrugBank Browser is primarily intended to facilitate undirected exploration of the
database and it allows users with no experience or little knowledge in the area of drugs
or drug chemistry to easily access the material in the DrugBank database.
13. Go to the DrugBank menu at the top of the page and select PharmaBrowse. The
following window should appear (Fig. 14.4.10). Scroll down to the list until the table
heading called NERVOUS SYSTEM can be seen. Click on the hyperlink below
this title called PSYCHOANALEPTICS. This should jump the page down to a
list of FDA-approved psychoanaleptic drugs (central nervous system stimulants that
reverse depression). Note that desimaprine is listed at the top of the page, along with
37 other drugs.
This particular browsing tool, which is also called the DrugBank category browser, provides navigation hyperlinks to 14 major drug categories which are then divided into more
than 70 drug classes. Each drug class contains the generic names of all the FDA-approved
drugs associated with that drug class. Each drug name is then linked to its respective
DrugCard. Within PharmaBrowse, users may select Approved Drugs, Biotech Drugs, or
Nutraceuticals by clicking on the hyperlinks at the top of the table. The PharmaBrowse
browser is distinct from the regular DrugBank browser, as it was designed to address the
specific needs of pharmacists, physicians, and medicinal chemists. These individuals tend
to think of drugs in clusters of indications or drug classes. This allows them to identify
alternate drug therapies (clinicians) or to look for common structural themes (medicinal
chemists). On the other hand, biochemists and molecular biologists tend to think of drugs
as stand-alone substrates, templates, or ligands. This view is more compatible with the
conventional DrugBank Browser presented in steps 11 and 12.
Figure 14.4.10 A screen shot of the PharmaBrowse browsing/navigation page. Note the hyperlinked list of drug categories and general indications.
Current Protocols in Bioinformatics
Cheminformatics
14.4.11
Supplement 18
Using the Text Query search option
14. Go to the DrugBank menu at the top of the page again and click on the Text Query
hyperlink. The window shown in Figure 14.4.11 should appear. The Text Query
tool allows users to perform more complex text queries in DrugBank than would be
possible using the simple text search system (Search DrugBank for) found on the
home page.
With Text Query, users may perform case-sensitive queries, queries with multiple misspellings, partial or complete word matches (partial word matches are the default), along
with phrases containing Boolean (AND, OR, NOT, etc.) operators. Upper limits on the
number of files and number of word matches within a file (200 is the default) are also
adjustable.
15. In the text box, type tricyclic AND antidepressant and press the Submit
button. Within a few seconds, a hyperlinked list of the 25 known tricyclic antidepressants, including desipramine, should appear. Note that this query is obviously
more specific than the simple text query done in Step 4.
Like the general Text Query tool, the Text Search tool supports searches of complete words,
numbers, multiple words, phrases, and partial words among most data fields (except
sequence text) in DrugBank. Text Search uses the full version of GLIMPSE (Manber and
Bigot, 1997) to allow very rapid search and retrieval of text data.
Using the Data Extractor search option
16. Go to the DrugBank menu at the top of the page again and click on the Data Extractor
hyperlink. The following window, as seen in Figure 14.4.12, should appear. The Data
Extractor was developed to allow users to perform more complex searches than what
is possible through DrugBank’s Search DrugBank for, Text Search, Browse, or
PharmaBrowse utilities.
In Silico Drug
Exploration and
Discovery Using
DrugBank
Figure 14.4.11 A screen shot of the Text Query window. This permits more complex text queries
than what is available through the default Search tool.
14.4.12
Supplement 18
Current Protocols in Bioinformatics
Figure 14.4.12 A screen shot of the Data Extractor window. The Data Extractor supports advanced SQL-like searches through many different data fields.
DrugBank’s Data Extractor employs a simple relational database system that allows
users to select one or more data fields and to search for ranges, occurrences or partial
occurrences of words, strings, or numbers. Using a few mouse clicks it is relatively simple
to construct very complex queries (“find all drugs less than 300 Da with LogPs between
3.4 and 4.2 that are antidepressants”) or to build a series of highly customized tables. The
output from these Data Extractor queries is provided as an HTML format with hyperlinks
to all associated DrugCards.
17. The central window frame provides a brief description of how to use the Data
Extractor. On the left side of the Data Extractor is a smaller window frame (the
selector window frame) with two scrollable/selectable lists, one titled Drug and the
other titled Drug Targets. At the top and bottom of these lists are two buttons, Go and
Deselect. Scroll down the first list and use the mouse to click on the word Molecular
Weight. Molecular Weight should now be highlighted. Scroll down further and,
while holding down the “Ctrl” key, click on LOGP and then Drug Category. In
total, three query words should be highlighted. These query words represent the data
fields that will be used to fine-tune the final query (i.e., finding a drug with specified
features pertaining to molecular weight, LogP, and drug category).
This list highlighting process is actually being used to build the structured query language
(SQL) query that is used to search the DrugBank database. Rather than having users learn
SQL, this graphical user interface allows users to construct complex queries by simply
selecting different data fields from a scrollable list. The scrollable list is generated using
a JavaScript tool and so, unfortunately, it is not consistently formatted from browser to
browser. If the list of Drug and Drug Target terms is cut off, move the mouse over the
right border region of the smaller window. A double-sided horizontal arrow or similar
image should appear. Click on the mouse and drag the window border so that the full list
of terms and scroll bars is viewable.
Cheminformatics
14.4.13
Current Protocols in Bioinformatics
Supplement 18
18. Now, go to the top of the selector window frame and click on the Go button. A central
blue box with multiple text boxes and radio buttons should appear in the central
window, as seen in Figure 14.4.13. In the first box, titled Molecular Weight, type in
the numbers 0 and 300. In the second box, titled LOGP, enter the numbers 3.4 and
4.2. In the third box, titled Drug Category enter the name antidepressant.
Leave the Drug Type selection to Approved Drugs (the default). Press the Submit
button at the bottom of the box. This process has effectively allowed the user to
create the following query: “find all drugs less than 300 da with LogPs between 3.4
and 4.2 that are antidepressants.”
In this fine-tuning phase of the query, the first box allows the user to define the molecular
weight range (0 to 300 da), the second box allows one to define the LogP range (3.4 to
4.2), and the third box allows the drug category (antidepressants) to be identified.
19. This query should generate a table with three drugs, including desipramine, doxepin,
and bupropion. The table lists their DrugBank accession code and generic name,
along with their molecular weight, logP, and drug category (Fig. 14.4.14). The user
may choose to explore the different drugs in more detail by clicking on any of the
hyperlinks. This will open the DrugCard for that particular drug. Many other complex
queries can be constructed with the Data Extractor. For instance, try constructing a
query that finds all drugs that target small (<500 Da) molecules.
Steps 16 to 19 provide a brief overview of how to use the Data Extractor. The Data
Extractor is perhaps the most powerful search utility in DrugBank. Unfortunately, it is
also the least frequently used. This may stem from its somewhat more complex interface
compared to the simple interfaces used for the Text Query or Search DrugBank for query
tools. Nevertheless, with practice, one can use the Data Extractor to perform some very
useful analyses of the data contained within DrugBank.
In Silico Drug
Exploration and
Discovery Using
DrugBank
Figure 14.4.13 A screen shot of the Data Extractor query window. Users are required to fill in
the text boxes using the suggested characters or formats.
14.4.14
Supplement 18
Current Protocols in Bioinformatics
Figure 14.4.14 A screen shot of the output from a Data Extractor Query aimed at finding all
drugs less than 300 Da with LogPs between 3.4 and 4.2 that are antidepressants.
Figure 14.4.15
A screen shot of DrugBank’s Download page.
Cheminformatics
14.4.15
Current Protocols in Bioinformatics
Supplement 18
Using the Download search option
20. Go to the DrugBank menu at the top of the page again and click on the Download
hyperlink. The window shown in Figure 14.4.15 should appear. The Download page
contains numerous large text files including DrugBank flat files, drug structure files,
as well as redundant and nonredundant sequence files (both protein and DNA) for
different classes of drug targets and drug metabolizing enzymes. Any or all of these
files can be downloaded and further analyzed by interested users. The Download
page also displays statistics about DrugBank (i.e., numbers of drug types, numbers
of drug targets, numbers of nonredundant sequences). These flatfiles and statistics
are updated every 3 to 6 months.
BASIC
PROTOCOL 2
CHEMICAL STRUCTURE SIMILARITY SEARCHING
In cheminformatics, chemical structure similarity searching is the chemical equivalent of
searching a sequence database for sequence homologs or searching the Protein Data Bank
(PDB) for similar 3-D protein structures. It is particularly useful for organic chemists or
natural product chemists who are interested in determining whether a newly synthesized
compound or a newly identified natural product exhibits some similarity to a known
drug. Chemical structure similarity searching is also useful for searching for compounds
that may have the same parent compound or belong to the same drug class. Given
the complexities or spelling inconsistencies found in many drug and chemical names,
chemical structure similarity searching is often a useful search alternative. Indeed queries
using chemical structures are often simpler and sometimes far more informative than text
queries. This protocol describes how users may use several different features in DrugBank
to search for chemically similar structures.
Necessary Resources
Hardware
Computer with Internet access.
Software
An up-to-date Internet browser, such as Internet Explorer (http://www.microsoft.
com/ie); Netscape (http://browser.netscape.com); Firefox (http://www.mozilla.
org/firefox); or Safari (http://www.apple.com/safari). The Web browser must be
capable of handling Java Applets (i.e., equipped with a Java interpreter) and
capable of opening or viewing PDF files.
Files
None
Using the ChemQuery link
1. Go to the DrugBank Web site at http://redpoll.pharmacy.ualberta.ca/drugbank/.
The DrugBank home page should be visible as should the blue menu bar located near the
top of the page with eight clickable titles: Home, Browse, PharmaBrowse, ChemQuery,
Text Query, SeqSearch, Data Extractor, and Download.
In Silico Drug
Exploration and
Discovery Using
DrugBank
2. Click on the ChemQuery link. After a few seconds a window should appear with
two pull-down tabs along with the ACD ChemSketch Java applet (Fig. 14.4.16).
The top pull-down menu (Search DrugBank Via) allows users to select the type
of chemical structure search (via Chemical Structure, Chemical Formula, Molecular
Weight, or SMILES String). The lower pull-down menu (Select Drug Type) allows
users to select the group of drugs to be searched (All Compounds, Approved Drugs,
Experimental Drugs, Biotech Drugs, Small Molecule Drugs, and Nutraceuticals).
14.4.16
Supplement 18
Current Protocols in Bioinformatics
The ChemQuery tool is designed to permit a range of chemical structure queries. Using
the Search DrugBank Via pull-down menu, users can either draw chemical structures into
the ChemSketch applet, enter a range of molecular weights (through text boxes), type in
a SMILES string (Weininger, 1988), or enter a chemical formula with a range of numeric
indices. Searches via chemical formulas or molecular weight ranges are particularly
useful for identifying drugs or drug structures via mass spectrometry (MS), where mass
ranges or approximate chemical formulas (via FT-MS) are typically generated. Searches
via SMILES strings or chemical structures are generally most useful for organic and natural product chemists, as well as many biochemists. SMILES (Simplified Molecular Input
Line Entry Specification) is a specification for unambiguously describing the structure of
chemical molecules using short ASCII strings. SMILES strings can be imported by most
molecule editors for conversion back into 2-D drawings or 3-D molecular models. Recently, the IUPAC has introduced InChI notation as a standard for formula representation.
However, SMILES is generally considered to have the advantage of being slightly more
human-readable than InChI. DrugBank contains both InChI and SMILES representations
for almost all of its small molecule drugs.
Drawing a chemical structure using ChemQuery
This particular part of the protocol will use the ChemQuery link to look for molecules that
are similar to a certain tricyclic structure recently isolated from sea snails. Therefore, the
user should leave the pull-down menus with their default selections (Chemical Structure
and Approved Drugs).
3. To begin drawing the chemical structure, go to the top panel of buttons in the
ChemSketch applet and press the button that looks like a stack of file cards
(3rd button from right). This is the ChemSketch template library button. A small,
mostly empty window should appear with a list on the left side containing different
structure template names (Rings, Chains, Bicyclics, etc.) as seen in Figure 14.4.17.
Figure 14.4.16 A screen shot of the ChemQuery window with the ACD ChemSketch Java applet
at the center. This is where the query chemical structures can be drawn.
Cheminformatics
14.4.17
Current Protocols in Bioinformatics
Supplement 18
Figure 14.4.17 A screen shot of the ChemSketch applet with the template library window placed
above the drawing palette.
The ChemSketch applet is a relatively simple chemical drawing utility. On the left side
of the applet is a vertical list of Element buttons covering the most common elements or
atoms used in organic chemistry. Above the C (carbon) button is a button for the periodic
table of elements, which allows selection of rarer atoms. On the top of the applet is a
series of buttons for drawing, erasing, moving, magnifying, undoing, redoing, or clearing
different bonds or drawings. Mousing over each of the buttons will generate a one or
two word description of what the button does (this appears on the right corner of the
applet). Clicking on the About hyperlink on the right corner will launch a new window
that describes the ChemSketch applet in more detail. Because many drug or drug-like
structures are quite complex, probably the easiest route to drawing them via ChemSketch
is to make frequent use of the template library and to add on molecular groups as needed.
4. Select the Rings template gallery by clicking on the word Rings at the top of the
template list. A collection of 13 cyclic structures should appear. Go to the left
side of this template gallery and click on one of the corners of the heptacyclic
(seven-membered) ring. Upon clicking on the corner of the structure the template
window should disappear. This action selects and copies the template image. Now,
go to the ChemSketch drawing screen and click somewhere in the center of the
screen. The clicking action pastes the heptacyclic ring image on to the ChemSketch
drawing screen. The image shown in Figure 14.4.18 should now be seen.
In Silico Drug
Exploration and
Discovery Using
DrugBank
5. Go back to the template button (the one with the stack of file cards) and click on it one
more time. The template window should appear again. Select the Aromatics template
by clicking on the word Aromatics at the top of the template list. A collection of 11
aromatic ring structures should appear in a new window. On the left corner of this
template gallery is a benzene ring. Click on one of the bonds or edges (do not click on
the atoms or vertices) of the ring. Now, go to the heptacyclic ring structure displayed
on the ChemSketch palette and click on one its bonds (on the left side of the ring).
This action pastes the previously selected benzene ring onto the seven-membered
14.4.18
Supplement 18
Current Protocols in Bioinformatics
Figure 14.4.18 A screen shot of the ChemSketch applet with a heptacyclic ring placed at the
center of the palette.
ring. Now go to the right side of the heptacyclic ring and click on one of the bonds
opposite to where the previous benzene ring was pasted. A tricyclic structure with
two benzene “mouse ears” should now be seen (Fig. 14.4.19).
If a mistake is made, the last operation can be undone by clicking on the curved-arrow
button (the undo button; displayed in cyan on screen) which is the third button on the
upper left corner. To start over, click on the second button (with a folded paper icon)
on the upper left corner. This clears the screen. A common error in drawing structures
using ChemSketch’s template tools is to join two template molecules inappropriately.
This may arise by clicking the atom of a template molecule and then clicking the bond of
the molecule being rendered (or vice versa). This will join a corner to an edge, thereby
creating an undesirable and unrealistic structure.
6. Go to the Element buttons on the left side of the window and click on the N atom
(third atom button down). Now, click on the single free vertex (the top atom) in the
heptacyclic ring that is between the two benzene rings. This will insert a nitrogen
atom into the heptacyclic ring.
7. Click on the Template button again and select Chains (second word from top). A
template gallery containing 12 aliphatic chains of different lengths will be displayed.
Choose the pentane (five-carbon) chain and click on the left terminal atom. The
template gallery window should disappear. Now, click on the NH atom that was just
placed in the heptacyclic ring (Step 6). An aliphatic chain should now be attached
to your tricyclic ring (Fig. 14.4.20). This is the structure of the compound isolated
from sea snails.
Cheminformatics
14.4.19
Current Protocols in Bioinformatics
Supplement 18
Figure 14.4.19
A screen shot of the partially completed tricyclic structure of the sea snail product.
Figure 14.4.20 A screen shot of the complete chemical structure of the sea snail product. This
is the query structure used by ChemQuery.
In Silico Drug
Exploration and
Discovery Using
DrugBank
14.4.20
Supplement 18
Current Protocols in Bioinformatics
8. Scroll down the ChemQuery page and click on the button called CLICK TO
CONVERT TO MOL FILE. Clicking this button will generate a MOL file that will
automatically be pasted into the text box below the button (Fig. 14.4.21).
The MOL file conversion allows users to cut/copy/paste the structure they just generated
into a text document for future storage or reference. It also allows the conversion program
called Babel to more easily convert the image that has just been drawn to a SMILES string.
9. Scroll down the ChemQuery page a little further and click on the button called
CLICK TO SUBMIT QUERY. Within a few seconds, the ChemQuery window
will be replaced with a new window displaying a list of similar compounds with the
most chemically similar compounds listed at the top. The list format is essentially
identical to that seen for the DrugBank Browser. The one difference is that, in the
leftmost column, the matching score of each hit is indicated. Higher scores indicate
better matches. Notice that this structure matches the structure of a number of wellknown antidepressants, including desipramine (Fig. 14.4.22).
This action takes the MOL file just generated and converts it to a SMILES string. The
SMILES string is then compared using a specially developed text parsing program against
all other SMILES strings in DrugBank. This text search is similar to a “Find text” query
or a simplified sequence alignment. The ChemQuery search engine looks for shared
chemical substructures by looking for shared SMILES substrings. A heuristic scoring
method is used to prioritize and rank substring matches and to generate an overall
chemical matching score. Clicking this button, a MOL file will be generated and pasted
into the text box below the button.
Using the SMILES String option from ChemQuery
This protocol has described the steps for performing a graphical structure query search in
DrugBank. However, as mentioned earlier (Step 2), ChemQuery also supports chemical
structure queries using SMILES strings only.
Figure 14.4.21
A screen shot of the MOL file generated by the ChemQuery conversion utility.
Cheminformatics
14.4.21
Current Protocols in Bioinformatics
Supplement 18
Figure 14.4.22
A screen shot of the similar structures found using the ChemQuery search tool.
Figure 14.4.23 A screen shot of the table generated when the Search for Similar Structures
button is pressed for desipramine.
In Silico Drug
Exploration and
Discovery Using
DrugBank
14.4.22
Supplement 18
Current Protocols in Bioinformatics
10. In this case users should select the SMILES String option (bottom of the list) from
the Search DrugBank Via pull-down menu. If one is adept with generating SMILES
strings or already has a SMILES string for a given compound, then this option is
generally much faster than drawing a structure.
11. In addition to ChemQuery, chemical structure searches are also possible through
DrugBank’s DrugCards. At the top of every DrugCard (Fig. 14.4.3), immediately
above the Creation Date field and to the right is a button called Show Similar
Structures. Clicking on this button will return a DrugBank Browser list displaying
the most similar structures and their similarity scores (Fig. 14.4.23). Users may
choose to have the search conducted over Approved Drugs (the default) or any of the
other five drug categories (All Compounds, Approved Drugs, Experimental Drugs,
Biotech Drugs, Small Molecule Drugs, or Nutraceuticals). This is a particularly
useful option for researchers interested in understanding, comparing, or displaying
the chemical modifications found in a given class of drugs.
IN SILICO DRUG TARGET IDENTIFICATION
In silico drug target identification is a method by which a protein or a set of proteins is
involved in identifying protein sequences from a newly sequenced pathogen that exhibit
some similarity to the sequences of known drug targets. Presumably, if a novel virus or
a newly identified pathogenic bacterium share some significant sequence similarity to a
protein that is a known drug target from another organism, then the same (or similar)
drugs may be used to treat this pathogen. Alternately, these previously known drugs
may serve as potential drug leads for developing more effective therapies. This protocol
describes how users may use DrugBank’s SeqSearch utility to identify potential drug
targets from a small retrovirus.
BASIC
PROTOCOL 3
Necessary Resources
Hardware
Computer with Internet access.
Software
An up-to-date Internet browser, such as Internet Explorer (http://www.microsoft.
com/ie); Netscape (http://browser.netscape.com); Firefox (http://www.mozilla.
org/firefox); or Safari (http://www.apple.com/safari). The Web browser must be
capable of handling Java Applets (i.e., equipped with a Java interpreter) and
capable of opening or viewing PDF files.
Files
A list of viral protein sequences is located at: http://cpicanada.org/bioinfo2006/
(click on the Virus hyperlink). No other files are needed for this protocol.
1. Start your local Web browser and go to the DrugBank Web site at http://redpoll.
pharmacy.ualberta.ca/drugbank/.
The DrugBank home page should be visible as should the blue menu bar located near the
top of the page with the 8 clickable titles Home, Browse, PharmaBrowse, ChemQuery,
Text Query, SeqSearch, Data Extractor, and Download.
2. Click on the SeqSearch link. A window with the title DrugBank BLAST Search
should appear (Fig. 14.4.24). As seen in the figure, the window contains a standard
online BLAST search form with a text box window, Submit and Reset buttons as
well as pull-down menus offering a choice of Programs (BLASTP or BLASTN),
Databases (14 choices), and scoring Matrices (BLOSUM or PAM). Below the
Cheminformatics
14.4.23
Current Protocols in Bioinformatics
Supplement 18
Figure 14.4.24
interface.
A screen shot of the SeqSearch window. Note the standard BLAST query
Submit and Reset buttons are textboxes and radio buttons for selecting various
Advanced Search Options. In almost all cases users can leave everything (except
the Database selection) in their default position.
A unique feature of the SeqSearch program is its capacity to handle multiple FASTAformatted sequences. This allows users to BLAST multiple sequences—or even entire
proteomes—using only a single paste and then clicking Submit. The required format of the
multi-FASTA sequence list is described in more detail by clicking on the Sequence format
help hyperlink above the text box. Note that the spacing between protein sequences does
not matter (0, 1, or multiple spaces are allowed). Note also that the default Expectation
Value for the BLASTP search is 0.000001 (1 ×10⁻⁶ ) and not 10 (as is the usual default
with GenBank searches). This is done to ensure the hits found in this search are significant
enough to be considered truly homologous.
3. For this example the user will be looking for potential drug targets to a newly isolated
retrovirus. To obtain the set of sequences to paste into the SeqSearch text box, launch
a new browser window and go to http://cpicanada.org/bioinfo2006/. Click on the
Virus hyperlink. A list of 16 viral sequences should be visible (Fig. 14.4.25). Select
all 16 sequences by clicking and dragging through the window with your mouse.
Copy the sequences (using the Copy option on your browser or using Ctrl+C).
4. Now click on the SeqSearch browser window to activate it and paste the sequences
into the SeqSearch text box by clicking your mouse in the text box and using the Paste
option on your browser (or Ctrl+V). The image shown in Figure 14.4.26 should now
be seen.
In Silico Drug
Exploration and
Discovery Using
DrugBank
Sixteen different protein sequences from the newly sequenced retrovirus have now been
pasted. Use the scroll bars on the right side of the text box to see if all 16 sequences
are there. Note that each sequence is separated by a “>” sign and a sequence title
(Sequence 1, Sequence 2, etc.).
14.4.24
Supplement 18
Current Protocols in Bioinformatics
Figure 14.4.25 A screen shot of the Web site listing the 16 protein sequences for the newly
sequenced retrovirus.
5. Press the Submit button. Within a few seconds, the BLAST search for all 16 input
sequences should be completed. The program will return a concatenated, text-based
BLAST summary for each of the 16 proteins that were submitted. The top portion of
the SeqSearch output consists of a summary of the submitted sequences. Below that
is the BLAST result for the first sequence (Sequence 1, with 231 residues). The output
should indicate ***** No hits found ******. Scrolling further down, the
output for Sequence 2 should be seen (Fig. 14.4.27).
This 143 residue protein exhibits about 74% sequence identity to the HIV envelope protein
(or a portion thereof). Four hits are listed in the matching sequence list, meaning that
the query sequence found matches to four other proteins in the DrugBank drug target
database (all of which appear to be identical HIV proteins). Also displayed in this list is
the name of the drug enfuvirtide and a hyperlink to the enfuvirtide drugcard.
6. Click on the hyperlink BIOD00106 listed beside the word enfuvirtide. The DrugCard
for enfuvirtide or Fuzeon will appear. This page describes the drug and its mode of
action in detail and it suggests that enfuvirtide may be able to target this viral protein
target as well.
7. Scroll down further through the SeqSearch output page and look for other sequences
that exhibit hits to known DrugBank targets and for drugs that would be likely to
work on these protein targets. The user should find that most of the 16 proteins in
this virus appear to be potential drug targets and that multiple existing drugs could
be effective against it.
Cheminformatics
14.4.25
Current Protocols in Bioinformatics
Supplement 18
Figure 14.4.26 A screen shot of the SeqSearch window with all 16 retroviral protein sequences
pasted into the text box.
In Silico Drug
Exploration and
Discovery Using
DrugBank
Figure 14.4.27 A screen shot of the SeqSearch output for the second sequence (Sequence 2)
in the retroviral proteome. Note the drug names and hyperlinks in the output.
14.4.26
Supplement 18
Current Protocols in Bioinformatics
GUIDELINES FOR UNDERSTANDING RESULTS
Basic Protocol 1
This particular protocol was designed to show users how to explore the DrugBank
database and to learn about a given drug (desiparmine), related drugs (tricyclic antidepressants), and its drug targets, along with other data about this class of drugs. The intent
is to give users a broad overview of the data content and the capabilities of DrugBank.
To summarize, Steps 1 to 2 provide brief a description of the DrugBank home page and
its text search tool. Steps 3 to 9 take the user through a tour of a standard DrugCard,
highlighting the layout, content, and important visualization and display tools. Steps 10
to 13 give a brief description of how to use the DrugBank Browser and PharmaBrowse
tools, while Steps 14 to 15 demonstrate how the Text Query tool can be used. Steps 16
to 19 show how the Data Extractor can be used to extract far more specific and detailed
information about certain drugs or drug classes, while Step 20 highlights the content
and information that can be obtained from DrugBank’s Download section. Overall, it
is hoped that this protocol provides sufficient grounding and rationale to allow users to
more fully explore DrugBank on their own. It is also worth noting that this protocol did
not cover every aspect of DrugBank’s search and query capabilities. In particular, the
ChemQuery and SeqQuery options or their potential applications were not discussed.
These query tools were discussed in separate protocols (Basic Protocols 2 and 3).
Basic Protocol 2
This protocol outlines the procedures for using DrugBank’s chemical similarity search
routines. Steps 1 to 2 outline the options available in DrugBank’s ChemQuery tool,
including mass range and chemical formula searches. These search tools are particularly
useful for analytical chemists where compounds are frequently identified on the basis
of their mass or chemical composition. Steps 3 to 9 describe how to use DrugBank’s
chemical structure drawing tools, specifically its ChemSketch Java applet. This series of
steps illustrates how ChemQuery can be used to find known drugs that are structurally
related to a natural product isolated from sea snails. Finally, steps 10 to 11 outline some
of the other available chemical structure search utilities available in DrugBank, including
the Show Similar Structures button that is available at the top of every DrugCard. This
feature allows users to identify other compounds in DrugBank that are structurally similar
to their drug of interest. This kind of query is particularly useful for researchers wishing
to do comparative or rational drug design.
The results shown in Figure 14.4.22 demonstrate both the advantages and disadvantages
of working with structure-based queries in DrugBank. Many drug discovery efforts are
based on screening large libraries of organic compounds or on testing large numbers
of natural product extracts, isolated from plants, soil bacteria, or sea creatures. When
a bioactive substance is found and the structure is determined, the structure can often
provide a rationalization for the compound’s action. In this case, it can be seen that the
sea snail compound drawn in steps 3 to 9 would be predicted to have some antidepressant
activity and therefore it could be useful in treating depression or obsessive-compulsive
disorders. It also exhibits some structural similarity to antiemetics, so it may be useful to
treating motion sickness or sea sickness. These predictions, of course, would have to be
verified by further wet-bench experiments. Other applications of this kind of structurebased search include the identification of potential protein targets (obtained by clicking
on the DrugCard hyperlink), the prediction of unintended side effects (if a drug that is an
antidepressant also exhibits structural similarity, say, to a diurectic), and the determination
of whether a compound of interest may exhibit unexpected interactions with unintended
protein targets.
Cheminformatics
14.4.27
Current Protocols in Bioinformatics
Supplement 18
It is worth noting that ChemQuery’s structure similarity search did not find all tricyclic
antidepressants and that the antiemetic compounds it found are only vaguely similar to
the sea snail compound (Fig. 14.4.22). This result demonstrates one of the algorithmic
limitations of the ChemQuery search. Since the program only uses SMILES strings
and SMILES substrings as part of its query process, it can sometimes miss structurally
similar compounds. Furthermore, because SMILES strings depend on the atom ordering
in the MOL file, the sequence in which one draws the query molecule in ChemSketch
can change the syntax of the SMILES string. As a result, the scoring and ordering of
compounds generated via a ChemQuery structure search of a known drug will differ than
the scoring and ordering of compounds generated via a Show Similar Structures search.
To address these problems, the ChemQuery search algorithm makes use of molecular
weight, chemical formula, and identified chemical functionalities as part of its scoring
scheme. More sophisticated structure search tools are available that use graph theory
(subdirected graph isomorphisms) and structural superpositioning to identify similar
compounds. PubChem, in particular, offers an excellent online structure query tool that
employs these techniques. An improved version of ChemQuery’s structure search tool
should be available in the Fall of 2007.
Basic Protocol 3
This short example demonstrates how the SeqSearch tool in DrugBank can be used to
rapidly identify potential drugs and drug targets for a viral pathogen. As it turns out
the particular virus used in the protocol exhibits a high degree of similarity to HIV and
so there are a number of drugs that are likely to be effective against it. The principle
behind this kind of drug target identification is relatively simple. All that is required is
a comprehensive list of the sequences of known drug targets. By performing a sequence
similarity search of an unknown or newly generated sequence (or set of sequences)
against this database of known drug targets, it should be possible to identify if this
sequence could be a likely drug target too. The unique aspect about DrugBank (and
SeqSearch) is that it is currently the only electronic database that has a comprehensive
collection of known drug target sequences (5795, at last count). Because DrugBank also
links sequence information to drug information, the name of the drug (or drugs) that
would be most effective against the drug target is also provided in its SeqSearch output.
Obviously, any potential hits generated by SeqSearch are only hypothetical. Confirmation
of their utility as drug targets or the efficacy of the existing drug against the protein
would have to be done using carefully controlled biochemical experiments or biological
assays. Nevertheless, given the rate at which new viral and bacterial genomes are being
sequenced (about two per day) and the enormous effort required to experimentally screen
for potential drugs or drug targets, the use of a simple in silico tool like SeqSearch could
be of enormous help.
In Silico Drug
Exploration and
Discovery Using
DrugBank
To make the analyses relatively simple, this particular example was done only for a small
virus. Certainly larger proteomes, including bacterial proteomes, could also be done. One
difference between working with bacteria and viruses is the fact that not all proteins in
a bacterium are essential whereas, for a virus, just about every protein is essential. As a
rule, the most effective drug targets are those proteins that are highly conserved and are
metabolically essential. Typically, only 200 to 300 proteins are absolutely essential in
any given bacterium. Therefore, if one is trying to identify a set of potential drug targets
for a pathogenic bacterium, it is usually a good idea to limit the search to those proteins
that are metabolically essential. Current lists of essential genes for a number of bacteria
is contained in the Database of Essential Genes (Zhang et al., 2004). This collection
can be used concurrently with SeqSearch to identify (through homology) the most likely
drug targets.
14.4.28
Supplement 18
Current Protocols in Bioinformatics
The identification of potential drug targets within the human genome (or proteome) is also
possible with SeqSearch. However, as most human genes have already been identified
and analyzed, the likelihood of finding a novel drug target through this sequence search
method is rather remote. Instead, the greatest utility for this type of search for human drug
targets may lie in the identification of unexpected or potentially co-inhibited proteins that
were not the intended or known targets of a given drug.
COMMENTARY
Background Information
Overcoming the “two solitudes” of
cheminformatics and bioinformatics
Cheminformatics and bioinformatics have
largely evolved along two separate, almost
divergent paths. Most chemical compound
databases were developed without the intention or expectation that this information might
be biologically or medically relevant. As a result, most chemical data is not linked in any
meaningful way to protein names, protein targets, or their downstream physiological effects. Likewise, most sequence databases were
developed without the intention of using this
data to facilitate drug or drug-target discovery.
As a result, most sequence data is not linked in
any meaningful way to existing drug or disease
information. This state of affairs largely reflects the “two solitudes” of cheminformatics
and bioinformatics. Historically, neither discipline has really tried to integrate with the
other. As a consequence, the wealth of electronic sequence/structure data that exists today
has never been well-linked to the enormous
body of drug or chemical knowledge that has
accumulated over the past half century. This
“information disconnect” is one of the reasons
why bioinformatics has been so slow to help in
the drug discovery and drug-target discovery
process.
Attempts are now being made to remedy this situation. For instance, NCBI has
now integrated OMIM (disease information),
GenBank (sequence information), and PubChem (chemical or drug information) into its
freely available Entrez Global Search Engine
(Wheeler et al., 2005). Other efforts are
also underway including GNF’s Druggable
Genome database (Orth et al., 2004) and the
Therapeutic Target Database, or TTD (Chen
et al., 2002). TTD is a freely accessible Webbased resource that contains linked lists of
names for more than 1100 small molecule
drugs and drug targets (i.e., proteins). It contains information about known protein and nucleic acid targets together with the associated
disease conditions, pathway information, and
the corresponding drugs/ligands directed
to each drug target. Hyperlinks to other
databases facilitate access to information regarding the function, sequence, 3-D structure,
nomenclature, drug/ligand binding properties,
and related literature about each protein/DNA
target.
In addition to TTD, a number of comprehensive small molecule databases have also
emerged including KEGG (Kanehisa et al.,
2004), ChEBI (Brooksbank et al., 2005), and
PubChem (Wheeler et al., 2005). Each contains tens of thousands of chemical entries—
including hundreds of small molecule drugs.
All three databases provide names, synonyms,
images, structure files, and hyperlinks to
other databases. Furthermore, both KEGG
and PubChem support structure similarity
searches. Unfortunately, these databases were
not specifically designed to be drug databases,
and so they do not provide specific pharmaceutical information or links to specific drug
targets (i.e., sequences). Furthermore, because
these databases were designed to be synoptic
(containing fewer than 15 fields per compound
entry), they do not provide a comprehensive
molecular summary of any given drug or its
corresponding protein target. In contrast to
KEGG and PubChem, some of the more specialized drug databases, such as PharmGKB
(Hewett et al., 2002) or online pharmaceutical
encyclopedias such as RxList (Hatfield et al.,
1999), tend to offer much more detailed clinical information about many drugs (their pharmacology, metabolism, and indications), but
they were not designed to contain structural,
chemical, or physico-chemical information.
Instead their data content is targeted
more towards pharmacists, physicians,
or consumers—not drug-target discovery
specialists.
DrugBank was developed to fill some of
these database voids and to create a single,
fully searchable in silico drug resource that
links sequence, structure, and mechanistic data
about drug molecules with sequence, structure, and mechanistic data about their drug
targets. Fundamentally, DrugBank is a dual
purpose
bioinformatics-cheminformatics
knowledgebase with a strong focus on
Cheminformatics
14.4.29
Current Protocols in Bioinformatics
Supplement 18
In Silico Drug
Exploration and
Discovery Using
DrugBank
quantitative, analytic, or molecular-scale
information about both drugs and drug
targets. Knowledgebases can be distinguished
from databases in that they contain not only
facts and data, but also knowledge, i.e., the
information or wisdom gained from a critical
assessment of raw data. In fact, there is a
growing trend in biology and medicine to
enrich the textual or numerical content of
many “first generation” databases, such as
GenBank or the Protein Data Bank with
detailed annotations and expert commentary
to create “second generation” knowledgebases
such as SwissProt or OMIM. In particular,
DrugBank combines the data-rich molecular
biology content normally found in curated
sequence databases such as SwissProt and
UniProt (Bairoch et al., 2005) with the equally
rich data found in medicinal chemistry
textbooks and chemical reference handbooks.
By constructing comprehensive, meaningful
links between drugs, diseases, and sequences,
DrugBank can allow one to learn from
past successes (and even past failures) in
terms of what proteins make for good drug
targets (soluble versus membrane-bound,
structural proteins versus enzymes, and strong
binders versus weak binders), what types
of pathways (metabolic, signaling, nuclear,
and cytoplasmic) make for good therapeutic
intervention strategies, what characteristics
in small molecules make for good drug leads
(Lipinski’s Rule of Five), what classes of
drug targets are under- or over-represented in
existing formularies and so on.
For example, using DrugBank it is relatively easy to determine that 96% of FDAapproved drug target types are peptide or
protein molecules. Less than 1% of all drug
targets are small molecules (i.e., adenosine,
uric acid, digoxin, iduronic acid, asparagine,
hyaluronic acid, etc.), while three classes of
DNA (eukaryotic, prokaryotic, and viral) and
two classes of RNA (bacterial rRNA and retroviral cRNA) serve as nucleic acid drug targets.
Likewise, the vast majority of drug targets
(97%) and drugs (89%) are associated with endogenous diseases, while only a tiny minority
of drug targets (3%) and drugs (11%) are actually associated with exogenous or infectious
diseases. Endogenous diseases are typically
chronic human disorders or conditions that
arise due to germ-line mutations (genetic diseases), somatic mutations (cancer), the aging
process (atherosclerosis, immune disorders,
etc.), or some other internal factors. Exogenous diseases are typically temporary diseases
or conditions that arise from external, nonhuman agents such as viruses, bacteria, fungi,
protozoans, poisons, or poisonous animals.
DrugBank is unique not only in the type of
data it provides but also in the level of integration and depth of coverage it achieves. In
addition to its extensive small molecule drug
coverage, DrugBank is certainly the only public database that provides any significant information about the 110+ approved biotech
(i.e., protein) drugs. DrugBank also supports
an extensive array of visualizing, querying,
and search options including a structure similarity search tool and an easy-to-use relational
data extraction system. It is hoped that DrugBank will serve as a useful resource to not only
members of the pharmaceutical research community but to educators, students, clinicians,
and the general public.
Critical Parameters and
Troubleshooting
To facilitate consistency and simplicity,
DrugBank has very few user-settable parameters. Users may change the settings on the
SeqSearch (i.e., local BLAST) search, but the
default settings are generally sufficient for
most applications. More details about the critical parameters for BLAST searches can be
found in UNITS 3.3 & 3.4. The other component to DrugBank that can cause users some
problems is the Data Extractor tool. This relational query system requires that the users
know something about the content in different
DrugBank fields, including number ranges (for
MW or pKa) or type of textual content. Obviously, typing in a negative molecular weight, a
misspelled or nonsense word, a number where
a word is expected, or a word where a number is expected will cause some unpredictable
behavior in the search engine. If a questionable result is generated or if a query seems
to “hang” for >1 minute, users are requested
to double-check their query to make sure it
contains none of the above errors. Nonresponsiveness can be a problem with any Web site.
This may reflect heavy use, periodic maintenance, server hardware problems, or the submission of an erroneously structured query
that, in effect, searches and grabs all data in the
database. DrugBank is heavily used and certainly its performance may be compromised
by this heavy use (or abuse). If users experience consistent problems with either Web
site access or program performance, they are
encouraged to contact the DrugBank staff or
the author of this unit.
14.4.30
Supplement 18
Current Protocols in Bioinformatics
DrugBank is a curated database, not an
archival database. This means that the data
in DrugBank are compiled, assessed, and entered by trained curators. Every effort is made
to ensure the data in DrugBank is as correct,
complete, and as current as possible.
However, as with any database, DrugBank
contains some errors. These may be errors arising from data entry, drug de-accessioning (removing a drug but leaving the DrugBank link
in place), or recent revisions to the knowledge
about a particular drug or drug target. If a user
believes they have identified an error, it is encouraged for them to contact the DrugBank
staff as soon as possible. Usually, errors can
be confirmed and corrected within a few days.
Likewise users may find some data are missing
in certain DrugCards. In many cases, the information (melting point, solubility, pKa, and
drug target) has never been collected or is not
yet known. However, if users become aware of
a new source of information that fills in a missing data field, they are encouraged to contact
the DrugBank staff.
Acknowledgements
The author wishes to thank Genome
Alberta, a division of Genome Canada, for
financial support in the development and maintenance of DrugBank.
Literature Cited
Bairoch, A., Apweiler. R., Wu, C.H., Barker, W.C.,
Boeckmann, B., Ferro, S., Gasteiger, E., Huang,
H., Lopez, R., Magrane, M., Martin, M.J.,
Natale, D.A., O’Donovan, C., Redaschi, N.,
and Yeh, L.S. 2005. The Universal Protein
Resource (UniProt). Nucl. Acids Res. 33:D154D159.
Bateman, A., Coin, L., Durbin, R., Finn, R.D.,
Hollich, V., Griffiths-Jones, S., Khanna, A.,
Marshall, M., Moxon, S., Sonnhammer, E.L.,
Studholme, D.J., Yeats, C., and Eddy, S.R. 2004.
The Pfam protein families database. Nucl. Acids
Res. 32:D138-D141.
Brooksbank, C., Cameron, G., and Thornton, J.
2005. The European Bioinformatics Institute’s
data resources: Towards systems biology.
Nucl. Acids Res. 33:D46-D53.
Chen, X., Ji, Z.L., and Chen, Y.Z. 2002. TTD:
Therapeutic Target Database. Nucl. Acids Res.
30:412-415.
Halgren, T.A., Murphy, R.B., Friesner, R.A., Beard,
H.S., Frye, L.L., Pollard, W.T., and Banks, J.L.
2004. Glide: A new approach for rapid, accurate docking and scoring. 2. Enrichment factors
in database screening. J. Med. Chem. 47:17501709.
Hatfield, C.L., May, S.K., and Markoff, J.S. 1999.
Quality of consumer drug information provided
by four Web sites. Am. J. Health Syst. Pharm.
56:2308-2311.
Hewett, M., Oliver, D.E., Rubin, D.L., Easton, K.L.,
Stuart, J.M., Altman, R.B., and Klein, T.E. 2002.
PharmGKB: The Pharmacogenetics Knowledge
Base. Nucl. Acids Res. 30:163-165.
Hulo, N., Sigrist, C.J., Le Saux, V., LangendijkGenevaux, P.S., Bordoli, L., Gattiker, A.,
De Castro, E., Bucher, P., and Bairoch, A. 2004.
Recent improvements to the PROSITE database.
Nucl. Acids Res. 32:D134-D137.
Kanehisa, M., Goto, S., Kawashima, S., Okuno,
Y., and Hattori, M. 2004. The KEGG resource
for deciphering the genome. Nucl. Acids Res.
32:D277-D280.
Kramer, B., Rarey, M., and Lengauer, T. 1997.
CASP2 experiences with docking flexible ligands using FlexX. Proteins 1:221-225.
Krogh, A., Larsson, B., von Heijne, G., and
Sonnhammer, E.L. 2001. Predicting transmembrane protein topology with a hidden Markov
model: Application to complete genomes.
J. Mol. Biol. 305:567-580.
Manber, U. and Bigot, P. 1997. USENIX Symposium on Internet Technologies and Systems
(NSITS’97), Monterey, Calif., pp. 231-239.
McGuffin, L.J., Bryson, K., and Jones, D.T.
2000. The PSIPRED protein structure prediction server. Bioinformatics 16:404-405.
Montgomerie, S., Sundararaj, S., Gallin, W.J., and
Wishart, D.S. 2006. Improving the accuracy
of protein secondary structure prediction using structural alignment. BMC Bioinformatics
7:301-312.
Orth, A.P., Batalov, S., Perrone, M., and Chanda,
S.K. 2004. The promise of genomics to identify novel therapeutic targets. Expert Opin. Ther.
Targets 8:587-596.
Rebhan, M., Chalifa-Caspi, V., Prilusky, J., and
Lancet, D. 1998. GeneCards: A novel functional genomics compendium with automated
data mining and query reformulation support.
Bioinformatics 14:656-664.
Sadowski, J. and Gasteiger, J. 1993. From atoms to
bonds to three-dimensional atomic coordinates:
Automatic model builders. Chem. Rev. 93:25672581.
Weininger, D. 1988. SMILES 1. Introduction and
encoding rules. J. Chem. Inf. Comput. Sci.
28:31-38.
Wheeler, D.L., Barrett, T., Benson, D.A., Bryant,
S.H., Canese, K., Church, D.M., DiCuccio,
M., Edgar, R., Federhen, S., Helmberg, W.,
Kenton, D.L., Khovayko, O., Lipman, D.J.,
Madden, T.L., Maglott, D.R., Ostell, J., Pontius,
J.U., Pruitt, K.D., Schuler, G.D., Schriml,
L.M., Sequeira, E., Sherry, S.T., Sirotkin,
K., Starchenko, G., Suzek, T.O., Tatusov, R.,
Tatusova, T.A., Wagner, L., and Yaschenko, E.
2005. Database resources of the National Center for Biotechnology Information. Nucl. Acids
Res. 33:D39-D45.
Cheminformatics
14.4.31
Current Protocols in Bioinformatics
Supplement 18
Willard, L., Ranjan, A., Zhang, H., Monzavi, H.,
Boyko, R.F., Sykes, B.D., and Wishart, D.S.
2003. VADAR: A web server for quantitative
evaluation of protein structure quality. Nucl.
Acids Res. 31:3316-3319.
http://xin.cz3.nus.edu.sg/group/cjttd/TTD ns.asp
TTD Web site
Wishart, D.S., Knox, C., Guo, A., Shrivastava, S.,
Hassanali, M., Stothard, P., and Woolsey, J.
2006. DrugBank: A comprehensive resource for
in silico drug discovery and exploration. Nucl.
Acids. Res. 34:D668-D672.
http://www.cmpharm.ucsf.edu/∼walther/
webmol.html
WebMol Web site
Zhang, R., Ou, H.Y., and Zhang, C.T. 2004. DEG,
a Database of Essential Genes. Nucl. Acids Res.
32:D271-D272
Internet Resources
http://redpoll.pharmacy.ualberta.ca/drugbank/
DrugBank Web site
http://www.genome.jp/kegg/drug/
KEGG drug database Web site
http://tubic.tju.edu.cn/deg/
Database of Essential Genes
Contributed by David S. Wishart
University of Alberta and the National
Institute of Nanotechnology (NINT)
National Research Council
Edmonton, Alberta Canada
http://pubchem.ncbi.nlm.nih.gov/
PubChem Web site
In Silico Drug
Exploration and
Discovery Using
DrugBank
14.4.32
Supplement 18
Current Protocols in Bioinformatics
Using ChemBank to Probe Chemical
Biology
UNIT 14.5
Kathleen Petri Seiler,1 Heidi Kuehn,1 Mary Pat Happ,1 Dave DeCaprio,1 and
Paul A. Clemons1
1
Chemical Biology Program and Platform, Broad Institute of Harvard and MIT, Cambridge,
Massachusetts
ABSTRACT
ChemBank (http://chembank.broad.harvard.edu/) is a public, Web-based informatics
environment. ChemBank stores and makes freely available data derived from small
molecules and small-molecule screens and has resources for relating and studying
these data. Currently, ChemBank stores information on hundreds of thousands of small
molecules and hundreds of biomedically relevant assays performed at the Broad Institute screening center. Web-based analysis tools are available within ChemBank to
study the relationships between small molecules, cell measurements, and cell states. This
unit demonstrates the use of ChemBank data to ask and answer questions relating to
chemical biology and screening experiments contained within ChemBank. Curr. Protoc.
C 2008 by John Wiley & Sons, Inc.
Bioinform. 22:14.5.1-14.5.26. Keywords: chemical biology r cheminformatics r data analysis r database r
high-throughput screening r small molecule
INTRODUCTION
ChemBank (http://chembank.broad.harvard.edu/) stores information on small molecules
and biomedically relevant assays that have been performed at the Broad Institute screening center. The ChemBank Web-based user interface makes it easy to retrieve this information, and the ChemBank online help pages (http://chembank.broad.harvard.edu/
details.htm?tag = Help) provide descriptions of the Web pages and the data displayed.
This unit provides a brief introduction to ChemBank, followed by a series of scenarios
that show how one might use ChemBank to address specific research questions. Each
scenario is an independent hands-on tutorial. The collection of scenarios introduces most
of the features in ChemBank (version 2.1.3).
Basic Protocols 1 and 3 will explore the intersection of biological annotations within
small-molecule records in ChemBank and the performance of small molecules in highthroughput screens (HTS). Basic Protocols 2, 4, and 5 will focus on using chemical
structure manipulation and comparison to answer research questions. Basic Protocol 6
describes how to download and export data from ChemBank for use in other software
applications.
Note that data are regularly added to ChemBank, and that addition of data may alter
some of the expected output of steps within the protocols contained in this unit.
MAKE A HYPOTHESIS ABOUT THE POTENTIAL BIOLOGICAL
ACTIVITY OF A MOLECULE
BASIC
PROTOCOL 1
In this protocol, imagine that a compound (“Compound X”) has been synthesized and that
one is looking for clues about the potential biological activities of the molecule. Because
the small-molecule structure is known, the SMILES string, structure, or ChemBankID
for the molecule is available. Using ChemBank, it is possible to explore the biological
Cheminformatics
Current Protocols in Bioinformatics 14.5.1-14.5.26, June 2008
Published online June 2008 in Wiley Interscience (www.interscience.wiley.com).
DOI: 10.1002/0471250953.bi1405s22
C 2008 John Wiley & Sons, Inc.
Copyright 14.5.1
Supplement 22
activity of structurally similar molecules scoring as standard hits in assays, to explore
the assays in which these molecules appear, and to generate hypotheses about potential
biological activities of Compound X.
This protocol will use the known SMILES string of Compound X to find molecules in
ChemBank that are structurally similar to Compound X and that would score as standard
hits in any assay. A multi-assay heatmap is used to visualize the CompositeZ scores
for these molecules across all assays in which they were tested. From the heatmap, it
is possible to view the ChemBank annotations for a molecule. Where the annotations
include activity-related terms from the scientific literature, one can use the heatmap to
identify the assay(s) in which the molecule scored as a hit. The heatmap also provides
access to a description of the project and the assay.
For more information about the definition of a “hit” and information about ChemBank in
general, refer to Background Information at the end of this unit and Seiler et al. (2008).
Briefly, the calculated CompositeZ score is the overall measure of whether a compound
scored as active in an assay. In ChemBank, the term “hit” refers to a non-zero response
based on a researcher’s subjective criteria. The term “standard hit” refers to a defined
cutoff for the CompositeZ score and Reproducibility based on the objective criteria. For
most assays, these criteria are |CompositeZ| > 8.53 AND |Reproducibility| > 0.99, where
CompositeZ and Reproducibility are both calculated values stored by ChemBank.
Necessary Resources
Hardware
A computer with a minimum of 256 Mb of RAM, connected to the Internet. A
high-speed Internet connection (e.g., DSL or cable modem) is recommended, as
dial-up connections will likely be exceedingly slow to load ChemBank Web
pages and visualizations.
Software
A Web browser such as Internet Explorer, Firefox, or Safari is required to access
ChemBank
NOTE: For this example, the SMILES string for Compound X is: CCn1cc (C ( = O) O)
c ( = O) c2c (N) c (F) c (N3CCNCC3) c (F) c12.
Find the molecule of interest
1. Go to the ChemBank home page: http://chembank.broad.harvard.edu/welcome.htm.
Under Find Small Molecules in the menu bar on the left-hand side of the screen (see
Fig. 14.5.1), click the link for “by user list.”
ChemBank displays the “Search by user list” page (also illustrated in Fig. 14.5.1).
This page may also be directly accessed by going to the URL http://chembank.broad.
harvard.edu/chemistry/search/input/userList.htm.
2. Enter the SMILES string (see Necessary Resources, above) in the “names or
SMILEs” text box. Instead, if the ChemBankID is known, it can be entered here.
Click the “search now” button.
ChemBank displays the search results in list format (Compound Search page, not illustrated in Fig. 14.5.1).
Using ChemBank
to Probe Chemical
Biology
If a SMILES-based search does not return a ChemBank molecule, click “by similarity”
under Find Small Molecules in the left-hand menu bar and enter the SMILES string on
the “Search by similarity” page. Identify the molecule of interest among those returned
by the similarity search.
14.5.2
Supplement 22
Current Protocols in Bioinformatics
Figure 14.5.1 Screenshots of steps to search for a molecule by SMILES representation using ChemBank similarity
search. (A) ChemBank home page with search menus at far left. (B) Illustration of SMILES input in the “search by user
list” feature. (C) ChemBank Molecule Display page associated with the search result from (B); the arrow in (C) shows how
to search for structurally similar entries directly from the Molecule Display Web page.
Find molecules similar to the molecule of interest
For this example, focus on the molecule with ChemBankID “1347770.”
3. On the Compound Search page containing the search results obtained at step 2, click
ChemBankID “1347770” to bring up the Molecule Display page (illustrated in the
right-hand panel of Figure 14.5.1).
4. Click “[find similar molecules]” (below the structure depiction) to search for related
compound structures.
ChemBank displays the search results in a list format.
Modify the search to find molecules that are similar to the molecule of interest AND
that scored as standard hits in any assay
5. Click “[modify]” (near the top of the page under the number of molecules found) to
modify the query.
ChemBank displays the “molecule search builder” page (not illustrated in the figures).
6. From the drop-down list labeled “Select a criterion to add,” select Assay and then
click the “add” button.
ChemBank displays the “Search by assay” page (not illustrated in the figures).
7. Select all projects and assays by clicking “Check all.”
By default, ChemBank finds molecules that scored as standard hits in the selected
assays.
8. Click the “add to search” button to review the search criteria or the “search now”
button to begin the search.
ChemBank displays the search results in a list format (not illustrated in the figures).
Cheminformatics
14.5.3
Current Protocols in Bioinformatics
Supplement 22
Use a heatmap to visualize the screening results for these molecules
9. Click “[view multi-assay result heatmap]” from the row of links near the top of the
screen.
ChemBank displays the “select visualization features” page (not illustrated in the figures),
which prompts the user to select the assays to display in the heatmap.
10. Select all projects and assays by clicking “Check all,” then click the “generate
visualization” button.
ChemBank displays a heatmap that shows the molecules that were on the search result
page and the assays in which they were tested. For additional description and a figure
showing a heatmap, see Basic Protocol 6 and the Commentary.
A molecule can be used in multiple assays and/or multiple wells in an assay; therefore,
the heatmap may contain more compounds than there are molecules in the search results.
11. For a more readable heatmap, sort the compounds by name and plate number by
using the bottom scroll bar to scroll all the way to the right side of the visualization,
and then clicking the Compound column heading (on the right side of the heatmap).
Display the details of each compound, including activity-related terms (if any) from
the scientific literature
For this example, focus on ciprofloxacin and norfloxacin.
12. Double-click a compound name to display the Molecule Display page. Scroll down
this page and notice that both ciprofloxacin and norfloxacin include the term “antibacterial” under the Therapeutic Uses heading.
The browser may need to allow popup windows for the ChemBank site to display this
result properly; if a popup blocker is in use, temporarily turn it off.
Having found compounds of interest, use the heatmap to explore assays in which
those compounds scored as standard hits
13. Scroll the heatmap display to scan for dark blue and dark red cells, which indicate the
lowest and highest CompositeZ scores for the compounds of interest, ciprofloxacin
and norfloxacin.
Hover over a cell to display the associated compound name, assay name, and CompositeZ
score.
14. When an assay is found in which the compound scored as a standard hit, double-click
the assay name (at the top of the column) to display information about the assay
and its associated project. A “standard hit” refers to a predefined cutoff for both
CompositeZ score and Reproducibility and is represented as a dark red or dark blue
cell on the heatmap. Other views, such as the platemap view, represent a Standard
Hit with a marker dot. The precise definitions can be found in the Help section of
the ChemBank Web site.
Examining the descriptions of these assays/projects may provide insight into the molecule
of interest.
Ciprofloxacin and norfloxacin scored as standard hits in several assays. For example, both
compounds scored as standard hits in project “907” (ciprofloxacin in assay “907.0134”
and “907.0135” and norfloxacin in assay “907.0115”) and ciprofloxacin scored as a
standard hit in assay “1000.0052.”
Using ChemBank
to Probe Chemical
Biology
Having found compounds with annotations of interest, search ChemBank to find all
compounds that have those annotations
15. Under Find Small Molecules in the left-hand menu bar, click the “by function” link.
On the “Search by function” page, for Ontology, select Therapeutic Use and for
14.5.4
Supplement 22
Current Protocols in Bioinformatics
Term, enter anti-bacterial. Leave the “Include child term matches” check
box checked (the default). Click the “search now” button to start the search.
ChemBank displays the search results in a list format (not illustrated in the figures).
Ontological terms are case-sensitive. If unsure of a term, use the Browse (magnifying
glass) button to select it rather than simply typing it in.
16. Modify the search to find only those molecules that scored as standard hits (see
steps 5 through 8).
ChemBank displays a subset of the original search results
All molecules with an activity annotation of “anti-bacterial” from the literature which
scored as standard hits in an assay have now been found. See Figure 14.5.2.
17. To generate a list of all projects and assays, under Find Assays in the left-hand menu
bar, click “advanced assay search.” On the “advanced assay search” page which then
appears, click the Search button. ChemBank displays a list of all assays and their
associated projects. To save the list to a file, click “[export as text]” near the top of
the page.
Figure 14.5.2 Screenshot of portion of search results for molecules scoring as “hits” in an assay
with the biological annotation of “anti-bacterial.”
Cheminformatics
14.5.5
Current Protocols in Bioinformatics
Supplement 22
BASIC
PROTOCOL 2
SELECT TESTED COMPOUNDS ON WHICH TO PURSUE ADDITIONAL
SCREENING OR FOLLOW-UP CHEMISTRY
For this protocol, the reader should imagine that he or she has observed that hundreds
of compounds have been tested in a ChemBank project and would now like to select
a small number of those compounds for additional screening or follow-up chemistry.
A heatmap will be used to visualize the CompositeZ scores for compounds that were
tested in the assays of this project. For any assay of interest, an assay histogram will be
used to examine the CompositeZ scores for the tested compounds. From the histogram,
the compounds with the most significant scores should be selected. For any compound
of interest, an assay scatterplot is used to determine the replicate reproducibility of
the compound. Having identified compounds active in this project based on significant
CompositeZ scores, one then determines if the compounds are selectively active in this
assay or are globally active in many assays. To do so, a heatmap should be generated to
visualize the screening results for these compounds in all assays of all projects.
Necessary Resources
Hardware
A computer with a minimum of 256 Mb of RAM, connected to the Internet. A
high-speed (e.g., DSL or cable modem) Internet connection is recommended, as
dial-up connections will likely be exceedingly slow to load ChemBank Web
pages and visualizations.
Software
A Web browser such as Internet Explorer, Firefox, or Safari is required to access
ChemBank
NOTE: For this example, the project of interest is “DihydroorotateDehydrogenase.”
Find compounds that scored as hits in the project of interest
1. Go to the ChemBank home page (http://chembank.broad.harvard.edu/welcome.htm).
In the menu bar on the left-hand side of the page, click “view projects,” scroll down
the list of projects that appears, and then click “DihydroorotateDehydrogenase.”
ChemBank displays the View Project page (not illustrated in the figures).
Notice that the project contains pairs of assays taken at 0- and 30-minute timepoints.
The assays named “Calc. . .” show the change between the two timepoints, which are the
values of interest. In looking at this project, the focus is on the “Calc. . .” assays.
2. Click “[find hits]” to find the compounds that scored as standard hits in the assays
of this project.
ChemBank displays the search results in list format.
Use a heatmap to visualize the molecules and the assays in which they were tested
Focus on the values of interest in this project by including only the “Calc. . .” assays of
the “DihydroorotateDehydrogenase” project in the heatmap.
3. Click “[view multi-assay result heatmap].”
ChemBank displays the “Feature selection” page, which prompts the user to select the
assays to display in the heatmap.
4. In the Select Projects and Assays list box, click the plus (+) icon next to DihydroorotateDehydrogenase to display the assays in that project.
Using ChemBank
to Probe Chemical
Biology
5. Select the calculated assays by clicking the checkbox next to each assay. For this
example, select assays “Calc(E1-E2)(1021.0018),” “Calc(E1-E2)1021.0019,” and
14.5.6
Supplement 22
Current Protocols in Bioinformatics
“Calc(E1-E2)1020.0020.” Click the “generate visualization” button to display the
heatmap.
ChemBank displays a heatmap that shows the molecules that were on the search page
and the selected calculated assays in which they were tested.
6. Scroll the heatmap to scan for the dark red and dark blue cells that indicate the lowest
and highest CompositeZ scores for these compounds.
The dark blue cells indicate that the compounds scored as hits in assay “1021.0019”
have the lowest CompositeZ scores.
Use an assay histogram to select the compounds with the lowest CompositeZ scores
in assay “1021.0019”
7. Double-click assay “1021.0019” to display its details.
The browser may need to allow popup windows for the ChemBank site to display this
result properly; if a popup blocker is in use, temporarily turn it off.
8. Click “[view histogram]” near the top of the page to display a histogram of the
CompositeZ scores for the assay (see Fig. 14.5.3).
9. Select the compounds with a CompositeZ score less than −20 by clicking on the
histogram image at “−20” and dragging the cursor to the left side of the histogram
(it does not matter where the cursor is on the vertical axis). ChemBank draws a box
around the selected portion of the histogram.
It is also possible to manually input values into the boxes to the left of the histogram
image rather than drawing a box within the histogram.
10. Click “[view molecules in range as list]” to display the selected compounds on the
search result page.
Figure 14.5.3 Screenshot of histogram of CompositeZ scores for the assay “DihydroorotateDehydrogenase:
Calc(E1-E2)(1021.0019).” Mock treatment measurements are depicted in red; compound-treatment wells are depicted in blue. For the color version of this figure go to http://www.currentprotocols.com.
Cheminformatics
14.5.7
Current Protocols in Bioinformatics
Supplement 22
Use an assay scatterplot to determine the replicate reproducibility of a selected
small-molecule test
11. Click a representative molecule from the list to display information about the
molecule. For this example, click ChemBankID “3052589.” A Molecule Display
page appears.
12. The Screening Test Instances section of the Molecule Display page shows compound
activity across all projects. Click the “CompositeZ score” heading once to sort the
list by ascending CompositeZ scores.
The assay of interest, “1021.0019,” with its low CompositeZ score, moves to the top of
the list.
13. Click assay “1021.0019,” “DihydroorotateDehydrogenase: Calc(E1-E2),” to display
its details.
14. Click “[view scatterplot]” to determine replicate reproducibility for the compound of
interest, ChemBankID “3052589.” The page that appears is shown in Figure 14.5.4.
The plot shows the CompositeZ scores of both mock-treatment and compound-treatment
wells from the selected assay. The score for the compound of interest is highlighted in
cyan. In this example, most scores (including the highlighted score) lie on the diagonal,
indicating similar results for both replicates.
Using ChemBank
to Probe Chemical
Biology
Figure 14.5.4 Screenshot of scatterplot of Dimensionless Z-score values (Seiler et al., 2008) for
assay “1021.0019” in ChemBank. Mock-treatment values are in red circles; compound-treatment
values are in blue squares; compound with ChemBankID “305289” highlighted in cyan. For the
color version of this figure go to http://www.currentprotocols.com.
14.5.8
Supplement 22
Current Protocols in Bioinformatics
15. Optionally, check the replicate reproducibility of other molecules in the list.
Use a heatmap to determine whether the compounds active in this project are
selectively active
16. Repeatedly click the Back button of the browser to return to the list of the molecules
with lowest CompositeZ scores in assay “1021.0019” of the “DihydroorotateDehydrogenase” project (i.e., to the page that was obtained in step 10).
17. Click “[view multi-assay result heatmap].” ChemBank displays the “select visualization features” page, which prompts the user to select the assays to display in
the heatmap. Select all projects and assays by clicking “Check all,” then click the
“generate visualization” button.
18. Scroll the heatmap to scan for the dark red and dark blue cells that indicate the lowest
and highest CompositeZ scores for these compounds.
The heatmap shows relatively restricted activity in projects other than project “1021,”
“DihydroorotateDehydrogenase.”
DETERMINE WHICH SMALL MOLECULES MAY PERTURB BIOLOGICAL
PATHWAYS AND PROCESSES
BASIC
PROTOCOL 3
To understand the protocol below one should imagine studying a biological pathway or
process and finding a related high-throughput screening (HTS) project in ChemBank (the
biological object of the project is a cell line or an organism). ChemBank also contains
screening projects for purified proteins—small-molecule microarray (SMM) projects
(Duffner et al., 2007) and HTS projects for homogenous proteins. It may be desirable to
identify assays related to the biological process under study, or SMM projects containing
proteins known to be involved in that biological process. Searching for compounds that
are active in both types of assays, the investigator hopes to identify small molecules that
may affect the biological pathway or process being studied.
In this protocol, the ChemBank user finds compounds that scored as standard hits in both
the HTS assay of interest and an SMM assay. From the Molecule Display page for a
compound scoring in both types of assays, the screening test results are viewed; SMM
assays in which the compound scored as a standard hit are identified and the View Assay
page is used to examine the assay and the tested protein. The protocol also describes how
to identify other HTS projects in which the compound scored as a standard hit and use
a heatmap to examine the compound response pattern across the projects in which the
compound is active.
Necessary Resources
Hardware
A computer with a minimum of 256 Mb of RAM, connected to the Internet. A
high-speed Internet connection (e.g., DSL or cable modem) is recommended, as
dial-up connections will likely be exceedingly slow to load ChemBank Web
pages and visualizations.
Software
A Web browser such as Internet Explorer, Firefox, or Safari is required to access
ChemBank
NOTE: For this example, the project of interest is “PSACAntagonistScreen.”
Cheminformatics
14.5.9
Current Protocols in Bioinformatics
Supplement 22
Find hits in the “PSACAntagonistScreen” project
1. Go to the ChemBank home page (http://chembank.broad.harvard.edu/welcome.htm).
In the menu bar on the left-hand side of the page, click “view projects,” scroll down
the list of projects that appears, and then click “PSACAntagonistScreen.”
ChemBank displays the View Project page (not illustrated in the figures).
2. Click “[find hits]” to find the compounds that scored as standard hits in the assays
of this project.
The ChemBank search returns thousands of molecules.
Modify the search to find compounds that scored as standard hits in
PSACAntagonistScreen AND in a small-molecule microarray (SMM) project
3. Click “[modify]” to modify the query.
ChemBank displays the “Molecule search builder” page (not illustrated in figures).
4. From the drop-down list labeled “Select a criterion to add,” select Assay, and then
click the “add” button.
ChemBank displays the “search by assay” page.
5. From the Assay Type drop-down list, select “small-molecule microarray.”
ChemBank filters the list of projects and assays to display only small-molecule microarray
projects.
6. For this example, select the small-molecule microarray project “SMMDIV06Annotation.” Click the “search now” button.
ChemBank displays the search results in list format.
Each molecule scored as a standard hit in the project of interest and as a standard hit in
the small-molecule microarray project “SMMDIV06Annotation.” For this example, focus
on the molecule with ChemBankID “2144641.”
7. Click ChemBankID “2144641” to display the molecule details. A Molecule Display
page appears.
8. Click the “CompositeZ score” heading twice to sort the screening test instances by
descending CompositeZ score. Locate a small-molecule microarray assay in which
the compound scored as a hit. For this example, select the “SMMDIV06Annotation”
assay with the CompositeZ score of 4.0887, “1066.0011.”
9. Click the assay name, “ManualSNR(1066.0011),” to view assay details, including
the name of the protein that was tested.
ChemBank displays the View Assay page (not illustrated in figures).
10. Click the “protein components” link for more information about the protein.
ChemBank displays the Protein page (not illustrated in figures).
11. Click the Back button of the browser to return to the Molecule Display page (i.e., the
page obtained in step 7). Optionally, examine the other “SMMDIV06Annotation”
assays and their proteins. To list the small-molecule microarray assays together, click
the Assay Type heading to sort the screening test instances by assay type.
12. Click the Back button of the browser to return to the search results page (i.e., the
page obtained in step 6).
Using ChemBank
to Probe Chemical
Biology
On the search results page, each molecule scored as a standard hit in the project of interest
and in at least one screening assay for a purified protein. For a molecule of interest, use
the Molecule Display page to find other HTS projects in which it scored as a hit. For this
example, focus on the molecule with ChemBankID “2144641.”
14.5.10
Supplement 22
Current Protocols in Bioinformatics
13. Click ChemBankID “2144641” to display molecule details. ChemBank displays the
Molecule Display page.
14. Click the “CompositeZ score” heading to sort the screening test instances by descending CompositeZ score.
In addition to scoring as a standard hit in the “PSACAntagonistScreen” and “SMMDIV06Annotation” projects, this compound also scored as a hit in the “FacioscapulohumeralMD,” “HemeDetoxification,” and “PKCoreAssaySet” projects.
Use a heatmap to examine the compound response patterns across these projects
15. Click the Back button of the browser to return to the search results page (i.e., the
page obtained in step 6).
16. Click “[view multi-assay result heatmap].”
ChemBank displays the “select visualization features” page, which prompts the user to
select the assays to display in the heatmap.
17. In the Select Projects and Assays list of check boxes, select the following projects
of interest: “FacioscapulohumeralMD,” “HemeDetoxification,” “PKCoreAssaySet,”
“PSACAntagonistScreen,” and “SMMDIV06Annotation.” Click the “generate visualization” button.
ChemBank displays a heatmap that shows the molecules on the search result page and
the assays (from the selected projects) in which they were tested.
18. Examine the assays in project “1066,” “SMMDIV06Annotation.”
The response pattern for the “Porco-J/BostonU” compound (well “2111L03”) is distinctly different from that of the “Neumann-C/Harvard” compounds (wells “2098E03,”
“2097G06,” “2098G18,” and “2098E08”). While all five compounds show reactivity in assays “1066.0001” and “1066.0002,” only the “Porco-J/BostonU” compound
shows consistently negative CompositeZ scores across the other assays in that project.
To examine a compound, including its structure, double-click the compound name in the
Compound column.
19. The response pattern for the “Neumann-C/Harvard” compounds appear to have potentially interesting similarities across the assays of project “1051” (“HemeDetoxification”) and potentially interesting differences across the assays in project “1035”
(“PSACAntagonistScreen”). For more information about an assay, double-click the
assay number.
DISSECT SMALL-MOLECULE STRUCTURE USING ASSAY PROFILES
Imagine that a small molecule has been synthesized and that one is interested in examining the response patterns for structurally related compounds. Because this is a known
molecule, the structure, SMILES string, or ChemBankID of the molecule is known.
BASIC
PROTOCOL 4
In this protocol, the ChemBank user finds structurally related molecules by using the
JME Molecular Editor (Ertl and Jacob, 1997) to draw the known molecular structure.
The search is modified to find structurally related molecules that scored as standard hits
in any assay. A heatmap is used to visualize the CompositeZ scores for these molecules
across all assays. In the heatmap, the compounds are sorted by SMILES string to group
structurally similar compounds. Small-molecule groups with similar and/or significantly
different response patterns are identified and other molecules in ChemBank that share
similar response patterns are found. Finally, a structure-data file (.sdf) for the compounds
associated with a particular response pattern is generated.
Cheminformatics
14.5.11
Current Protocols in Bioinformatics
Supplement 22
O
Figure 14.5.5
Protocol 2.
N
O
Structure to be drawn in the JME Molecular Editor (Ertl and Jacob, 1997) for Basic
Necessary Resources
Hardware
A computer with a minimum of 256 Mb of RAM, connected to the Internet. A
high-speed (e.g., DSL or cable modem) Internet connection is recommended, as
dial-up connections will likely be exceedingly slow to load ChemBank Web
pages and visualizations.
Software
A Web browser such as Internet Explorer, Firefox, or Safari is required to access
ChemBank
A text editor is needed to view the .sdf output file and other software to view the
chemical graphs encoded within the.sdf
NOTE: For this example, the known molecular structure is shown in Figure 14.5.5.
Find molecules structurally related to the molecule of interest
1. Go to the ChemBank home page (http://chembank.broad.harvard.edu/welcome.htm).
Under Find Small Molecules, click the “by substructure” link. On the “search by
substructure” page, use the JME Molecular Editor (Ertl and Jacob, 1997) to draw the
molecular structure shown in Figure 14.5.5. Click the “search now” button to find
molecules that share the structure.
Figure 14.5.6 shows the “search by substructure” window with the drawn molecular
structure. The SMILES string for this structure is: C12C(C(=0)NC1=0)CCC3C2CCCC3.
Modify the search to find molecules that contain this substructure AND that scored
as standard hits in any assay
2. In the page displaying the search results, click “[modify]” to modify the query.
3. From the drop-down list labeled “Select a criterion to add,” select Assay, then click
the “add” button.
ChemBank displays the “search by assay” page.
4. Select all projects and assays by clicking “Check all.”
By default, ChemBank finds molecules that scored as standard hits in the selected assays.
Using ChemBank
to Probe Chemical
Biology
5. Click the “add to search” button to review the search criteria or the “search now”
button to begin the search.
ChemBank displays the search results in list format.
14.5.12
Supplement 22
Current Protocols in Bioinformatics
Figure 14.5.6 Screenshot of structure from Figure 14.5.5 drawn within the structure editor interface in ChemBank.
Use a heatmap to visualize the molecules on the search result page and the assays in
which they were tested
6. On the page with the search results, click “[view multi-assay result heatmap].”
ChemBank displays the “select visualization features” page, which prompts the user to
select the assays to display in the heatmap.
7. Select all projects and assays by clicking “Check all,” then click the “generate
visualization” button.
ChemBank displays a heatmap that shows molecules on the search result page and the
assays in which they were tested.
8. Scroll the heatmap to scan for the dark blue and dark red cells that indicate the lowest
and highest CompositeZ scores for these compounds.
For this example, notice that the compound of interest is active in project “1012” and its
compound response patterns vary across the assays in that project.
Examine project “1012”
9. From the heatmap, double-click an assay to display its information. For example,
double-click assay “1012.0064.”
Cheminformatics
14.5.13
Current Protocols in Bioinformatics
Supplement 22
The browser may need to allow popup windows for the ChemBank site to display this
result properly; if a popup blocker is in use, temporarily turn it off.
ChemBank displays the View Assay page.
10. From the View Assay page, click the project name to display information about the
project.
ChemBank displays the View Project page for the “NOXSuperoxideGeneration” project.
Simplify the heatmap by displaying only the “NOXSuperoxideGeneration” project
11. Using the Back button of the browser, return to the “select visualization features”
page (i.e., the page obtained in step 6), which prompts the user to select the assays
to display in the heatmap.
12. Select the “NOXSuperoxideGeneration” project and click the “generate visualization” button.
ChemBank displays a heatmap that shows the same set of compounds and the assays (in
the “NOXSuperoxideGeneration” project) in which they were tested.
Group compounds by structure in the heatmap and examine their response patterns
13. Click the SMILES heading to sort the compounds by SMILES string.
ChemBank sorts the compounds by ordering the SMILES strings alphabetically. This is a
crude way of grouping compounds by structure similarity.
14. Notice that compounds “2110K11” and “2110K03” have similar response patterns:
they both have high CompositeZ scores in assays “1012.0064” and “1012.0065” and
have low scores in all other assays. Compound “2111M11” has a distinctly different
response pattern: it has high CompositeZ scores in all assays.
15. For a visualization of the response pattern, select all assays by shift-clicking the
assay numbers, and select compounds “2110K11,” “2110K03,” and “2111M11” by
control-clicking the compound names, then select Profile from the View menu on
the heatmap menu bar. When finished viewing the profile, close the profile window.
16. Double-click the compound name in the heatmap to display more detailed information, including its molecular structure and activity across assays in all projects. For
example, double-click “2110K11.” ChemBank displays the Molecule Display page.
17. Display the Molecule Display page for the three compounds of interest: “2110K11,”
“2110K03,” and “2111M11.” As one would expect, the first two have a similar
structure, which is distinct from that of the third.
Find molecules that have a response pattern similar to compounds “2110K11” and
“2110K03”and generate a structure-data file (.sdf) for those molecules
18. Return to the heatmap and examine the response pattern for “2110K11” and
“2110K03.” These compounds have CompositeZ scores greater than 5.4 in assays “1012.0064” and “1012.0065” and less than −1.5 in assays “1012.0068” and
“1012.0069.” Hover over a cell of the heatmap to see the CompositeZ scores.
19. Define the first search criterion: molecules that have CompositeZ scores “> 5.4” in
assay “1012.0064”:
Using ChemBank
to Probe Chemical
Biology
a. In the menu bar on the left-hand side of the heat map, under Find Small Molecules,
click “by assay.” On the “search by assay” page, select assay “1012.0064” from
the “NOXSuperoxideGeneration” project.
b. At the bottom of the page, use the drop-down list to select “molecules satisfying
the condition” and then specify CompositeZ > 5.4 to complete the search criterion.
14.5.14
Supplement 22
Current Protocols in Bioinformatics
c. Click the “add to search” button.
ChemBank displays the “molecule search builder” page.
Projects can have many assays. On the “search by assay” page, use the Find function of
the browser to find the correct assay.
20. Define the second search criterion: molecules that have CompositeZ scores > 5.4 in
assay “1012.0065”:
a. From the drop-down list labeled “Select a criterion to add,” select Assay and then
click the “add” button.
b. On the “search by assay” page, select assay “1012.0065” from the “NOXSuperoxideGeneration” project.
c. At the bottom of the page, use the drop-down list to select “molecules satisfying
the condition” and then specify CompositeZ > 5.4 to complete the search criterion.
d. Click the “add to search” button.
21. Define the third search criterion: molecules that have CompositeZ scores < −1.5 in
assay “1012.0068.”
a. From the drop-down menu labeled “Select a criterion to add,” select Assay and
then click the “add” button.
b. On the “search by assay” page, select assay “1012.0068” from the “NOXSuperoxideGeneration” project.
c. At the bottom of the page, use the drop-down menu to select “molecules satisfying the condition” and then specify CompositeZ<–1.5 to complete the search
criterion.
d. Click the “add to search” button.
22. Define the fourth search criterion: molecules that have CompositeZ scores < −1.5
in assay “1012.0069.”
a. From the drop-down menu labeled “Select a criterion to add,” select Assay and
then click the “add” button.
b. On the “search by assay” page, select assay “1012.0069” from the “NOXSuperoxideGeneration” project.
c. At the bottom of the page, use the drop-down menu to select “molecules satisfying the condition” and then specify CompositeZ<–1.5 to complete the search
criterion.
d. Click the “add to search” button.
23. Click the “search” button.
ChemBank displays the two molecules from the heatmap. No other molecules tested in
this project have this response pattern.
24. Click “[export as SDF]” to generate an .sdf file for these molecules.
Find molecules that have a response pattern similar to compound “2111M11” and
generate a structure-data file (.sdf) for those molecules
25. Return to the heatmap (displayed in step 12) and examine the response pattern for “2111M11.” This compound has CompositeZ scores greater than 4.7 in
assays “1012.0064,” “1012.0065,” “1012.0066,” “1012.0067,” “1012.0068,” and
“1012.0069” of the “NOXSuperoxideGeneration” project.
Cheminformatics
14.5.15
Current Protocols in Bioinformatics
Supplement 22
Figure 14.5.7 Screenshot of .sdf export file output from a ChemBank download. (A) Search results with the “export to
SDF” function highlighted. (B) Example of a single molecule record in .sdf output format, showing atomic coordinates
and connection table.
26. Define a search to find all molecules that have this response pattern, repeating the
procedure in steps 20 to 22 using assays “1012.0064,” 1012.0065,” “1012.0066,”
1012.0067,” “1012.0068,” and “1012.0069” of the “NOXSuperoxideGeneration”
project. Specify “molecules satisfying the condition” of CompositeZ scores “>5.4”
for all assays.
27. Click the “search” button.
ChemBank displays the search results in a list format.
28. Click “[export as SDF]” to generate an .sdf file for these molecules (see Fig. 14.5.7).
BASIC
PROTOCOL 5
Using ChemBank
to Probe Chemical
Biology
IDENTIFY STRUCTURALLY RELATED SMALL MOLECULES WITH
KNOWN BIOLOGICAL FUNCTIONS
Imagine that compounds with a known biological function have been identified and
that it is now desirable to identify structurally related compounds involved in the same
biological function. This protocol describes how to use ChemBank to find molecules
with the known biological function and browse their chemical structures. For a given
chemical structure (the query structure), one can use a similarity search to find molecules
with a structure similar to that of the query structure, or a substructure search to find
molecules that share the query structure. It is thus possible to assemble a collection of
structurally related compounds by exporting and concatenating the search results.
14.5.16
Supplement 22
Current Protocols in Bioinformatics
Necessary Resources
Hardware
A computer with a minimum of 256 Mb of RAM, connected to the Internet. A
high-speed (e.g., DSL or cable modem) Internet connection is recommended, as
dial-up connections will likely be exceedingly slow to load ChemBank Web
pages and visualizations.
Software
A Web browser such as Internet Explorer, Firefox, or Safari is required to access
ChemBank
A text editor and/or a spreadsheet program is needed to the view the contents of the
downloaded .txt file from ChemBank
NOTE: For this example, the known biological function of the compounds of interest is
their use in the treatment of asthma (Therapeutic Indication = Asthma).
Find the molecules of interest and browse their chemical structures
1. Go to the ChemBank home page (http://chembank.broad.harvard.edu/welcome.htm).
Under Find Small Molecules, click “by function.” On the “search by function” page
that appears: for Ontology, select Therapeutic Indication; for Term, enter Asthma;
also select the “Include child term matches” check box (the default). Click the “search
now” button to start the search.
Ontology terms are case-sensitive. If unsure of a term, use the Browse (magnifying glass)
button to select it rather than simply typing it in.
ChemBank displays the search in list format.
2. Examine the structures of the molecules by browsing the search results. Notice that
many of the molecules include a particular four-fused-ring substructure. For this
example, select ChemBankID “1000123” as having a chemical structure of interest.
Find molecules with similar chemical structures
3. Click ChemBankID “1000123” to display the Molecule Display page for that
molecule.
4. Copy the SMILES string for the molecule by clicking it.
ChemBank displays the SMILES string in a text box from which it can be copied without
embedded line breaks. Copy the SMILES string from the text-box and close the pop-up
window.
5. In the left-hand menu bar, under Find Small Molecules, click “by similarity.” On the
“Search by similarity” page, paste the SMILES string into the SMILES field. Leave
the similarity metric set to Tanimoto and the similarity threshold set to 0.8. Click the
“search now” button.
A similarity threshold of 0.8 to 0.9 will return chemically intuitive results under most
circumstances. A detailed description of each metric is available in the Help section of
the ChemBank Web site.
ChemBank displays the search results in list format.
Expand the search by reducing the similarity threshold from 0.8 to 0.6
6. Click “[modify]” to modify the query.
7. Click “[edit criterion]” to modify the structure criterion. The “search by similarity” page appears. Notice that the structure has been drawn on screen in the JME
Molecular Editor (Ertl and Jacob, 1997).
Cheminformatics
14.5.17
Current Protocols in Bioinformatics
Supplement 22
8. On the “search by similarity” page, set the similarity threshold to 0.6 and click the
“search now” button.
ChemBank displays the search results in list format.
9. Click “[export as text]” to save the results to a text file. Rename the file
similarity 1000123.txt.
Only registered users are permitted to export data from ChemBank. If you logged in as
“guest,” you must register as a user of ChemBank to complete this step.
A similarity search returns molecules that have the smallest number of “unshared”
features when compared to the query structure. A substructure search returns molecules
that share the query structure, but may have complex superstructures (extensive unshared
features). For a similarity search, simplifying the query structure is likely to reduce the
number of molecules found. For a substructure search, simplifying the query structure is
likely to increase the number of molecules found.
Modify the query structure
10. Click “[modify]” to modify the query and “[edit criterion]” to modify the structure
criteria.
11. Use the delete (DEL) function of the JME Molecular Editor (Ertl and Jacob, 1997)
to simplify the chemical structure, as shown in Figure 14.5.8, panel B.
IMPORTANT NOTE: Due to a known software bug, when the query is modified, the chemical structure may be drawn incorrectly. To avoid this issue, set the similarity threshold
to “0.6” in step 5 and skip steps 6 through 8. Alternatively, go to http://chembank.broad.
harvard.edu/chemistry/search/execute.htm?id = 5050874 and begin at step 10.
12. Click the “search now” button.
ChemBank displays the search results in list format.
13. Click “[export as text]” to save the results to a text file. Rename the file
similarity edited.txt.
Only registered users are permitted to export data from ChemBank. If you logged in as
“guest,” you must register as a user of ChemBank to complete this step.
Use a substructure search to find molecules that share the edited query structure.
14. Copy the SMILES string for the edited structure as it appears in the query statement
at the top of the search results page.
15. In the left-hand menu bar, under Find Small Molecules, click “by substructure.” On
the “search by substructure” page which appears, paste the SMILES string into the
SMILES/SMARTS field and click the “search now” button.
ChemBank displays the search results in list format.
Using ChemBank
to Probe Chemical
Biology
14.5.18
Supplement 22
Figure 14.5.8 Structure of ChemBankID 1000123 (A) as shown on Molecule Display page and
(B) simplified structure created by using the DEL function in the JME Molecular Editor (Ertl and
Jacob, 1997).
Current Protocols in Bioinformatics
16. Click “[export as text]” to save the results to a text file. Rename the file substructure edited.txt.
Only registered users are permitted to export data from ChemBank. If you logged in as
“guest,” you must register as a user of ChemBank to complete this step.
17. Compare the three result files.
Sorting by ChemBankID reveals the overlap between the search results. Sorting by molecular weight reveals the higher average molecular weights of the overall larger compound
structures in the substructure search result.
Determine which search was most effective in finding compounds with the known
biological function of interest (Therapeutic Indication = Asthma)
18. Copy all ChemBankIDs from the first result file.
19. In the left-hand menu bar, under Find Small Molecules, click “by user list” and paste
the copied values into the ChemBankIDs list box.
20. Click the “add to search” button. ChemBank displays the “molecule search builder”
page.
21. From the drop-down list labeled “Select a criterion to add,” select Function, and then
click the “add” button.
22. On the “search by function” page: for Ontology, select Therapeutic Indication; for
Term, enter Asthma; also select the “Include child term matches” check box (the
default). Click the “search now” button to start the search.
23. Repeat the process for the other result files.
After displaying details for molecule “1000123,” one can find molecules with similar
chemical structures by copying the SMILES string from the Molecule Display page to the
“Search by similarity” page (steps 4 and 5). Alternatively, from the Molecule Display
page, it is possible to find molecules with similar chemical structures by clicking “[find
similar molecules].”
DOWNLOAD DATA FOR FURTHER CALCULATION USING EXTERNAL
APPLICATIONS
BASIC
PROTOCOL 6
For this protocol, the reader should imagine that he or she would like to download information from ChemBank for use in other applications. ChemBank provides several
options for downloading data, as summarized in Table 14.5.1. In general, from a ChemBank display page, it is necessary to click “[download data]” or “[export as text]” to
write the associated data to a text file.
For this example, all possible information will be downloaded for the “AspulvinoneUpregulation” project. First, project screening data are viewed and downloaded. Next,
the molecules tested in the project are viewed, with all available information about
those molecules. Third, functional annotations for the molecules tested in the project are
viewed and downloaded. Finally, a heatmap showing the assays in the project and the
compounds tested in those assays is displayed; the heatmap data are then downloaded.
Necessary Resources
Hardware
A computer with a minimum of 256 MB of RAM, connected to the Internet. A
high-speed (e.g., DSL or cable modem) Internet connection is recommended, as
dial-up connections will likely be exceedingly slow to load ChemBank Web
pages and visualizations.
Cheminformatics
14.5.19
Current Protocols in Bioinformatics
Supplement 22
Table 14.5.1 Downloadable Data and Fields Using the ChemBank Download/Export Functions
Object
Instructions
Downloaded data
Projects & Assays
Click “advanced assay search”
Click “Search”
Click “[export as text]”
ProjectID, project description, assay
description, project name, project
motivation, assay name, assay type,
species, screener, and organization for
all ChemBank projects
Project
Click “view projects”
Click a project
Click “[download data]”
Project name, assay name, plate, well,
raw data values, background-subtracted
values, CompositeZ scores,
reproducibility calculations,
ChemBankIDs, and SMILES strings for
all compounds tested in all assays in
this project
Assay
Click “advanced assay search”
Click “Search”
Click an assay name
Click “[download data]”
Project name, assay name, plate, well,
raw data values, background-subtracted
values, CompositeZ scores,
reproducibility calculations,
ChemBankIDs, and SMILES strings for
all compounds tested in this assay
Search results
Find small molecules
Click “[export as text]”
ChemBankIDs and SMILES strings for
all compounds on the search results
page, as well as any additional
information (such as Chemist,
Molecule Name, or Descriptors)
displayed on the search results page
Search results
Find small molecules
Click “[export as SDF]”
Structure-data file (.sdf) for the
compounds on the search results page
Heatmap
Find small molecules
Click “[view multi-assay result
heatmap]”
Select assays
Click “generate visualization”
Click “[download data]”
Matrix of assay names and compounds
(with SMILES strings), with
CompositeZ scores for each compound
in each assay (CompositeZ scores are
truncated at ±8.53)
Software
Web browser such as Internet Explorer, Firefox, or Safari is required to access
ChemBank
A text editor and/or spreadsheet program is needed to view the contents of the
downloaded files from ChemBank
NOTE: It is necessary to be logged into ChemBank as a registered user to download data.
See Table 14.5.1 for details of downloaded data from various database objects.
View the project and download the associated screening data
1. From the menu bar on the left-hand side of the screen, click “view projects,” and
then select “AspulvinoneUpregulation.”
ChemBank displays the “view projects” page.
2. Click “[download data].”
Using ChemBank
to Probe Chemical
Biology
ChemBank writes the data to a tab-delimited text file and then prompts the user to open
or save the file.
14.5.20
Supplement 22
Current Protocols in Bioinformatics
3. Save the file to the local hard drive. Depending on the Web browser, a prompt for
directory location and filename may appear.
The browser may need to allow popup windows for the ChemBank site to display this
result properly; if a popup blocker is in use, temporarily turn it off.
Use Microsoft Excel, a text editor, or other program of choice to view the data.
Find all molecules tested in this project
4. In the left-hand menu bar, under Find Small Molecules, click “by assay.” On the
“search by assay” page, check the check box for the “AspulvinoneUpregulation”
project. At the bottom of the page, use the drop-down list to direct ChemBank to
find “all screened molecules” (by default, ChemBank finds molecules that scored as
standard hits). Click the “search now” button.
ChemBank displays the search results in list format.
Download chemist, molecule name, and descriptor values for the compounds tested
in this project, modify the query to display that information, and then download the
search results
5. To add the criterion “Chemist = ∗ ”, first click “[modify]” to modify the query. From
the drop-down list labeled “Select a criterion to add,” select Chemist and then click
the “add” button. On the “search by chemist” page, input ∗ in the text box to return
the source of synthesis for every compound. Click the “search now” button.
The asterisk (∗) substitutes as a wildcard character for any zero or more characters. In
this example, entering ∗ finds every instance of the search object.
ChemBank returns significantly more results—all compounds synthesized for all
molecules tested in this project. The search results include the source of synthesis for
each compound.
6. Add the criterion “Molecule Name = ∗”, first click “[modify]” to modify the query.
From the drop-down list labeled “Select a criterion to add,” select Molecule Name
and then click the “add” button. On the “search by molecule name” page which
appears, input ∗ in the text box to return the molecule name for every compound.
Click the “search now” button.
The ChemBank search returns the same compounds, and the search results now include
the molecule name for each compound.
7. To add the descriptor criterion “Aqueous Solubility > = –59.44,” first click “[modify]” to modify the query. From the drop-down list labeled “Select a criterion to add,”
select Descriptor and then click the “add” button. On the “search using descriptors”
page, select the first descriptor, Aqueous Solubility. To return that descriptor value
for every compound, select “greater than or equal to” (> = ) and input the minimum
value displayed (−59.44) into the text box. Click the “search now” button.
The ChemBank search returns fewer compounds than before, and the search results now
include the Aqueous Solubility descriptor value for each compound. Fewer compounds
are returned because a subset of ChemBank compounds (for example, ChemBankIDs
“701” and “1484”) are missing descriptor values. These compounds are removed from
the search results when descriptors are added to the query.
8. Add additional descriptor criteria as desired.
9. From the search result page, click “[export as text].”
ChemBank writes the data to a tab-delimited text file and then prompts the user to open
or save the file.
Cheminformatics
14.5.21
Current Protocols in Bioinformatics
Supplement 22
10. Save the file to the local hard drive. Depending on the Web browser, there may be
prompts for a directory location and file name.
Use Microsoft Excel, a text editor, or another program of choice to view the data.
Download functional annotations for the compounds
11. Remove all previously added search criteria except the first (i.e., that the molecule
was tested in any assay of project “AspulvinoneUpregulation”). To do this, click
“[modify]” to modify the query, then click “[remove criterion]” next to the criterion
to be removed.
12. Modify the query to add the functional annotation by choosing Function from the
drop-down list labeled “select a criterion to add,” and then clicking the “add” button.
13. On the “search by function” page: for Ontology, select Therapeutic Indication; for
Term, use the Browse (magnifying glass) button to select the MeSH root term; also
select the “Include child term matches” check box (the default). Click the “search
now” button.
ChemBank displays the compounds tested in this project that have annotations for Therapeutic Indication.
14. From the search result page, click “[export as text]” and save the results to a file.
15. On the “search by function” page: for Ontology, select Therapeutic Use; for Term,
use the Browse button to select the root term (“use classification ontology”); also
select the “Include child term matches” check box (the default). Click the “search
now” button.
ChemBank displays the compounds tested in this project that have annotations for Therapeutic Use.
16. From the search result page, click “[export as text]” and save the results to a file.
17. On the “search by function” page: for Ontology, select Biological Process; for
Term, use the Browse button (magnifying glass) to select the root term (“biological
process”); also select the “Include child term matches” check box (the default). Click
the “search now” button.
The ChemBank search returns the compounds tested in this project that have annotations
for ‘Biological Process.
18. From the search result page, click “[export as text]” and save the results to a file.
View a heatmap of the assays in the project and the compounds tested in those assays
19. In the left-hand menu bar, under Find Small Molecules, click “by assay.” On the
“search by assay” page, select the “AspulvinoneUpregulation” project. Click the
“search now” button.
By default, ChemBank finds molecules that scored as standard hits in the assays of the
selected project.
ChemBank displays the search results in list format.
20. Click “[view multi-assay result heatmap].” ChemBank displays the “select visualization features” page, which prompts the user to select the assays to display in
the heatmap. Select the “AspulvinoneUpregulation” project and click the “generate
visualization” button.
Using ChemBank
to Probe Chemical
Biology
ChemBank displays a heatmap (Fig. 14.5.9) of the compounds from the search result page
and the assays (in the “AspulvinoneUpregulation” project) in which they were tested.
14.5.22
Supplement 22
Current Protocols in Bioinformatics
Figure 14.5.9 Screenshot of a multi-assay heatmap from ChemBank. Assays from the
“AspulivnoneUpregulation” project are depicted. Compound names and SMILES for the search
results are depicted in the columns to the right of the heatmap view. For the color version of this
figure go to http://www.currentprotocols.com.
21. Click “[download data]” and save the heatmap data as a tab-delimited text file on the
local hard drive. Use Microsoft Excel, a text editor, or another program of choice to
view the data. CompositeZ scores in the heatmap and downloaded file are truncated
at ±8.53. For actual scores, download the screening data from the View Project or
View Assay page.
GUIDELINES FOR UNDERSTANDING RESULTS
The exercises in this unit have introduced some of the basic data contained within
ChemBank and their potential use in a research setting. Readers have been directed to
follow along with the above exercises using the “public” version of ChemBank, which
contains screening data that are at least 1 year old; more recent screening data are limited
to users of the screening facility at the Broad Institute and ChemBank team members,
and is available at a separate URL. Data that can be viewed on ChemBank may or may
not have been used in a primary publication; this information is not currently indicated
on the Web site.
ChemBank is geared toward helping screeners and others contextualize and interpret
high-throughput screening data by coupling its analysis to other small-molecule annotations and cheminformatics data. ChemBank is an evolving project, so new features will
be added over time.
Cheminformatics
14.5.23
Current Protocols in Bioinformatics
Supplement 22
COMMENTARY
Background Information
General overview of ChemBank
ChemBank, which was created by the
National Cancer Institute’s Initiative for
Chemical Genetics, stores information on
hundreds of thousands of small molecules and
hundreds of biomedically relevant assays that
have been performed at the Broad Chemical
Biology screening center, in collaboration
with biomedical researchers worldwide. The
ChemBank Web-based user interface makes
it easy to retrieve this information, and the
ChemBank online help (http://chembank.
broad.harvard.edu/details.htm?tag=Help)
provides descriptions of the Web pages and
the data displayed (Seiler et al., 2008).
ChEBI (Brooksbank et al., 2005), DrugBank (UNIT 14.4; Wishart et al., 2006), PubChem (Wheeler et al., 2007), and ZINC
(UNIT 14.6; Irwin and Shoichet, 2005), among
others, are also publicly available smallmolecule databases. While many of these
databases are focused on discovery of novel
therapeutic small molecules, ChemBank is
geared not only toward chemistry and experimental results but also toward biological
knowledge of small molecules from sources
other than screening experiments. ChemBank
stores raw screening data from the screening facility at the Broad Institute, as well as
small-molecule structures from many sources.
ChemBank employs a rigorous definition of
screening experiments and uses a metadatabased organization for its assays and screening
projects. ChemBank also allows for the visualization and analysis of both raw and normalized small-molecule assay results so that users
of ChemBank can customize their views of
biological results.
Using ChemBank
to Probe Chemical
Biology
Molecules and compounds
In ChemBank, a ChemBankID is assigned to each unique molecule. For registration to ChemBank, standardized representations of new chemical structures are checked
against the existing small-molecule collection in ChemBank and assigned an existing ChemBankID if they match an existing
molecule, or a new ChemBankID if they provide a unique new structure. Individual instances of molecules are called compounds
and may be salt, hydrate, or other forms for
the unique molecule. Compounds are distinguished by unique Plate/Well assignments.
There can be several compound samples for
any given ChemBankID (molecule). Com-
pound structures are input via a structure editor or can be entered by entering a chemistrystandard text string format, named SMILES
(Weininger, 1988; Weininger and Weininger,
1989).
Projects and assays
Assays to measure the biological effects
of compounds are organized into screening
projects. Each project is assigned a four-digit
project identifier, called a projectID. A project
comprises a group of assays that all assess
the same general area of biology, but may differ from each other in details of the execution protocol, the date performed, the reagents
employed, or the nature of the measurement
(e.g., baseline and post-incubation measurements are considered two different assays, and
the calculated difference between them is a
third). An assayID is the four-digit project
identifier dot-separated from a four-digit assay index. Within each project, assays are
uniquely numbered, usually sequentially, beginning with assay 0001. For example, an assayID might appear as the number 1012.0069,
indicating the 69th assay in project 1012.
Hits and standard hits
An assay tests a collection of compounds
for a single biological readout. For each tested
well, ChemBank stores the associated raw
value and a number of calculated values. The
calculated CompositeZ score (Seiler et al.,
2008) value is the overall measure of whether
a compound scored as active in an assay.
In ChemBank, the term hit refers to a nonzero response based on a researcher’s subjective criteria. The term standard hit refers
to a defined cutoff for the CompositeZ score
and Reproducibility based on the objective
criteria. For most assays, these criteria are
|CompositeZ| > 8.53 AND |Reproducibility|
> 0.99, where CompositeZ and Reproducibility are both calculated values stored by ChemBank. For more information about how ChemBank calculates these values, see the recent
article describing ChemBank (Seiler et al.,
2008).
Molecule Display page and heatmaps
In ChemBank, the Molecule Display page
is the primary source of information about
a molecule. It includes the name, SMILES
string, descriptors, molecular structure,
activity-related terms (if annotated) from the
scientific literature, and all sample sources for
the molecule. It also lists every screening test
14.5.24
Supplement 22
Current Protocols in Bioinformatics
instance of the molecule including the screening project, assay, plate, well, and resulting
CompositeZ score. For an example, point to
the URL http://chembank.broad.harvard.edu/
chemistry/viewMolecule.htm?cbid = 1347770
to display the Molecule Display page for the
molecule with ChemBankID “1347770.”
Heatmaps are used to visualize screening
results (CompositeZ scores) for multiple
compounds across multiple assays. In a multiassay result heatmap, each row represents
a compound (identified by plate/well and
SMILES string) and each column represents
an assay (identified by assay ID). The
intersection of a row and a column represents
the CompositeZ score for that compound in
that assay. Dark blue represents the lowest
CompositeZ scores and dark red represents the
highest CompositeZ scores. Point to the URL
http://chembank.broad.harvard.edu/chemistry/
featureSelection/visualize.htm?molSearchId
=5046996&featureSelectId=5046999 to view
a ChemBank heatmap (it takes a minute or
two to gather data and display the heatmap).
Critical Parameters and
Troubleshooting
It is possible to log in to ChemBank as a
guest or as a registered user. Guests can try
most of the scenarios; however, one must be
a registered user to download any data from
ChemBank (as described in Basic Protocol 6).
If logged in as a guest and an attempt is
made to download data, ChemBank displays
an error message and offers the opportunity to
register.
ChemBank supports most commonly used
browsers. To check whether a browser is compatible with ChemBank, click the Browser Requirements link at the bottom of the ChemBank home page (http://chembank.broad.
harvard.edu/welcome.htm). It may be necessary to allow popup windows from the ChemBank site, depending on the browser used. It
may take ChemBank a few minutes to complete a molecule search or draw a heatmap.
Any single step in a scenario should complete
in less than 5 min.
One may encounter incomplete biological
information or an incomplete list of names
for a ChemBank page. Molecule name curation is ongoing and not all molecules have
gone through curation, and therefore may
be missing commonly known names. Additionally, one may encounter more than one
molecule with the same name but slightly different structures. Structures in ChemBank are
often loaded from vendor-supplied files and
are not independently verified by the ChemBank team. Molecular structure verification
and merging of database records is planned
for future ChemBank enhancements.
Many of the biological annotations on
ChemBank pages are taken from the primary
literature. PubMed IDs, when available, appear as a hyperlink to the right of the biological annotation. Additionally, users cannot
currently search biological annotations by GO
molecular function terms (UNIT 7.2). GO terms
may also be out of date, as ChemBank updates its local version of GO only periodically.
GO terms are planned to be fully searchable,
regularly updated, and hyperlinked in future
ChemBank releases.
The following are a few tips for using
ChemBank heatmaps:
1. Select Color Scheme Legend from the
View menu to display a legend for the colors.
The colors in a heatmap always range from
dark blue to dark red; however, the CompositeZ scores represented by those colors vary
from one heatmap to another. Dark blue represents the lowest CompositeZ score in the
heatmap and dark red the highest CompositeZ
score in the heatmap.
2. Hover the cursor over a cell to display
the associated compound name, assay ID, and
CompositeZ score.
3. Double-click an assayID (column
header) to display its details. Double-click a
compound name (right side of the heatmap) to
display its Molecule Display page.
4. Heatmaps truncate CompositeZ scores
at ±8.53 (the ChemBank cutoff for a standard
hit). To see the precise CompositeZ scores,
display the Molecule Display page for a compound.
5. For a more readable display, sort the
heatmap in one of three ways: click the box below an assay ID (column header) to sort compounds based on their CompositeZ scores in
that assay; click the Compound column heading (right side of the heatmap) to sort compounds by name and plate number; or click
the SMILES column heading (right side of
the heatmap) to sort compounds by SMILES
string. Sorting by SMILES string is a crude
way of grouping compounds by structure
similarity.
To report problems, click the Report Problem link at the bottom of any ChemBank page.
To submit questions not answered by this unit
or the online help, contact the ChemBank team
by e-mailing [email protected].
Cheminformatics
14.5.25
Current Protocols in Bioinformatics
Supplement 22
Literature Cited
Brooksbank, C., Cameron, G., and Thornton,
J. 2005. The European Bioinformatics Institute’s data resources: Towards systems biology.
Nucl. Acids Res. 33:D46-D53.
Duffner, J.L., Clemons, P.A., and Koehler, A.N.
2007. A pipeline for ligand discovery using
small-molecule microarrays. Curr. Opin. Chem.
Biol. 11:74-82.
Ertl, P. and Jacob, O. 1997. WWW-based
chemical information system. J. Mol. Struct.
THEOCHEM 419:113-120.
Irwin, J.J. and Shoichet, B.K. 2005. ZINC: A
free database of commercially available compounds for virtual screening. J. Chem. Inf. Model
45:177-182.
Seiler, K.P., George, G.A., Happ, M.P.,
Bodycombe, N.E., Carrinski, H.A., Norton, S.,
Brudz, S., Sullivan, J.P., Muhlich, J., Serrano,
M., Ferraiolo, P., Tolliday, N.J., Schreiber,
S.L., and Clemons, P.A. 2008. ChemBank:
A small-molecule screening and cheminformatics resource database. Nucl. Acids Res.
36:D351-D359.
Weininger, D.A. 1988. SMILES, a chemical language and information system 1: Introduction
and encoding rules. J. Chem. Inf. Comput. Sci.
28:31-36.
Weininger, D.A. and Weininger, J.L. 1989.
SMILES 2: Algorithm for generation of unique
SMILES notation. J. Chem. Inf. Comput. Sci.
29:97-101.
Wheeler, D.L., Barrett, T., Benson, D.A., Bryant,
S.H., Canese, K., Chetvernin, V., Church, D.M.,
DiCuccio, M., Edgar, R., Federhen, S., Geer,
L.Y., Kapustin, Y., Khovayko, O., Landsman,
D., Lipman, D.J., Madden, T.L., Maglott, D.R.,
Ostell, J., Miller, V., Pruitt, K.D., Schuler,
G.D., Sequeira, E., Sherry, S.T., Sirotkin, K.,
Souvorov, A., Starchenko, G., Tatusov, R.L.,
Tatusova, T.A., Wagner, L., and Yaschenko, E.
2007. Database resources of the National Center for Biotechnology Information. Nucl. Acids
Res. 35:D5-D12.
Wishart, D.S., Knox, C., Guo, A.C., Shrivastava,
S., Hassanali, M., Stothard, P., Chang, Z., and
Woolsey, J. 2006. DrugBank: A comprehensive
resource for in silico drug discovery and exploration. Nucl. Acids Res. 34:D668-D672.
Using ChemBank
to Probe Chemical
Biology
14.5.26
Supplement 22
Current Protocols in Bioinformatics
Using ZINC to Acquire a Virtual
Screening Library
UNIT 14.6
John J. Irwin1
1
University of California San Francisco, San Francisco, California
ABSTRACT
The ZINC database of commercially available compounds contains biologically relevant representations of purchasable compounds in ready-to-screen formats. ZINC uses
catalogs from over 50 compound vendors, changing from time to time to reflect newly
available compounds and depleted stock. ZINC is available in subsets that reflect current
opinion in the field such as “fragment-like” and “lead-like,” and has a facility to create
additional small ad hoc subsets. ZINC has a search facility, as well as a service to process
molecules that are not in ZINC by uploading them to a server. Curr. Protoc. Bioinform.
C 2008 by John Wiley & Sons, Inc.
22:14.6.1-14.6.23. Keywords: virtual screening r molecular docking r ligand discovery r
small molecule libraries
INTRODUCTION
The ZINC database of commercially available compounds for virtual screening contains
biologically relevant representations of purchasable compounds for ligand discovery.
ZINC aggregates catalogs from chemical suppliers and processes them into biologically
relevant forms, reformats them into popular file formats, and distributes them in a variety
of subsets. The ZINC Web site offers a search capability, custom subset preparation, and
a facility for processing molecules that are uploaded to the site.
ZINC is based on a processing pipeline that converts two-dimensional vendor catalog
entries into biologically relevant forms. ZINC contains protonated, deprotonated, and
tautomeric forms of molecules classified over three pH ranges. Whereas ZINC was originally designed with structural (3-D) ligand discovery methods like molecular docking and
virtual screening in mind, it has also proven useful for topological (2-D) efforts, including
similarity searching, scaffold hopping, clustering, and classification approaches. Thus
medicinal chemists, drug designers, and structural biologists as well as bioinformaticians
and data miners are all potential users of ZINC. ZINC focuses on commercially available
compounds to shorten the hypothesis-test cycle in early-stage ligand discovery. It also
includes annotated ligands from PubChem, many of which are in turn linked to annotated
databases or other sources of information. ZINC utilizes chemical software packages
and resources including CACTVS (Ihlenfeldt et al., 1992; http://xemistry.com),
CORINA (Gasteiger et al., 1990; http://www.molecular-networks.com), OEChem
and Omega (OpenEye Scientific Software; http://www.eyesopen.com), mitools (Molinspiration; http://www.molinspiration.com), AMSOL (Chris Cramer
and Don Truhlar; http://amsol.chem.umn.edu/), and ligprep (Schrödinger Inc.,
http://www.schrodinger.com).
The five protocols in this unit describe the most common procedures that researchers
will use to acquire computer representations of purchasable compounds from ZINC.
If you want to screen for novel ligands without the bias of a chemical starting point,
we recommend starting with Basic Protocol 1. Even if you already have one or more
actives for your project, you may still want to acquire one or more of the general
purpose screening libraries available via Basic Protocol 1. We recommend either the
Current Protocols in Bioinformatics 14.6.1-14.6.23, June 2008
Published online June 2008 in Wiley Interscience (www.interscience.wiley.com).
DOI: 10.1002/0471250953.bi1406s22
C 2008 John Wiley & Sons, Inc.
Copyright Cheminformatics
14.6.1
Supplement 22
“fragment-like” or “lead-like” subsets of ZINC, which best represent current thinking
in the field. For 3-D applications like docking, use either mol2 or SDF format. For 2-D
methods like scaffold hopping via molecular similarity metrics, you may want to use
SMILES. Once downloaded to your local disk, use your screening application to identify
compounds to acquire and test. If you have a special pricing deal with a particular vendor
or your screening center has purchased compounds from a single vendor, for example,
you will want to use Basic Protocol 2 to acquire a vendor-specific subset of ZINC. If
you already have actives and you prefer to screen only a small set of related molecules,
start with Basic Protocol 3 to find molecules that match your criteria, and download
up to 500 of them. Basic Protocol 3 is also useful for browsing ZINC to see what is
inside. A number of protocols that are alternatives to Basic Protocol 3 illustrate a range
of supported queries. If you require a larger subset, up to 10,000 molecules, use Basic
Protocol 4 to create one and acquire it. If you need a custom subset with >10,000
molecules, please contact [email protected] to request it. Finally, if the molecules
that you wish to screen do not exist in ZINC, you will want to use Basic Protocol 5,
which processes molecules you upload using the standard ZINC processing pipeline.
The ZINC search service, detailed in Basic Protocol 3, offers a variety of options for
searching ligands in ZINC based on substructure, physicochemical properties, catalog
information, or a combination of these constraints. ZINC can be useful for finding similar or dissimilar compounds, using either SMARTS or SMILES (see Daylight Theory
Manual; http://daylight.com). The results of a ZINC search point directly to compound
vendors, to facilitate compound acquisition. Pointers to PubChem and other public annotated databases are also included where available, as a source of annotations about the
molecule. This unit describes the use of ZINC version 7 for Basic Protocols 1, 2, and 3.
These protocols are nearly the same for ZINC version 8—the release of which is expected
soon—except the second step involves using a pull-down menu in ZINC 8 instead of
simply clicking on a link. Basic Protocols 4 and 5 are only supported in ZINC 8, which
is accessible at http://zinc8.docking.org/.
BASIC
PROTOCOL 1
DOWNLOAD A PROPERTY-FILTERED DATABASE SUBSET FOR VIRTUAL
SCREENING
This protocol describes how to acquire a property-filtered database subset of small
molecules in ready-to-dock formats for general purpose virtual screening of commercially available chemical space. The two most popular of these are the “lead-like” and
“fragment-like” subsets. The subsets are available in three popular formats over three pH
ranges. Large files are split into slices for more reliable downloading. At the end of this
protocol, you will have a database of small molecules on your disk that are ready to screen.
Necessary Resources
Hardware
A modern computer with an Internet connection. Some files are very large, so
100 GB or more of free space may be required to store the uncompressed files in
mol2 format.
Software
Using ZINC to
Acquire a Virtual
Screening Library
A Unix-like environment, such as Unix, Linux, Mac OS X, or Cygwin. See
Support Protocol of UNIT 9.6 for installation of Cygwin. Other operating systems
may require minor changes.
If using Windows, wget is needed; this is available from SourceForge
(http://sourceforge.net/) or the Web site http://wget.docking.org/. It may be easier
to download ZINC files to a Unix-like machine and move the files to Windows.
A modern browser, such as Firefox 1.5 or later, Opera 9 or later, or Internet
Explorer 7 or later (Internet Explorer 6 will work, but is not advised), with the
Java Runtime Environment (JRE). JRE is available from http://java.sun.com/jre/
if not already installed.
14.6.2
Supplement 22
Current Protocols in Bioinformatics
Figure 14.6.1
The ZINC Property-Filtered Subsets page.
To download the “lead-like” subset in mol2 format
1. Point the browser to http://zinc.docking.org.
2. Click on the Property-filtered Subsets link to see available property-based database
subsets.
You will see a table of available subsets (Fig. 14.6.1). In addition to “lead-like,” other subsets are available, such as “fragment-like” and “all-purchasable.” For general-purpose
screening, the “lead-like” and “fragment-like” subsets are the most popular and are representative of current opinion in the field. The table of database subsets (Fig. 14.6.1) lists
the name of the subset, number of molecules in each subset, date of the last update, criteria
used to select molecules, and number of compounds available from a single source. The
table provides a thumbnail sketch of how “chemically diverse” each subset is, expressed
as the number of representatives required to represent the subset at various Tanimoto (T)
similarity levels. Thus, for the lead-like subset, all 972,608 compounds are at least 60%
similar to at least one of 9279 representatives and at least 70% similar to at least one of
28,337 representatives. The sponsor of the subset, to whom any correspondence should
be addressed, is the final item.
3. Click on “lead-like," in the first row, left-most column, to go to the lead-like download
page.
The “lead-like” download page (Fig. 14.6.2) contains detailed information about the
subset organized into four sections: (1) General Information, (2) Property Distributions,
(3) Clustering and Diversity, and (4) Downloads.
General Information lists the following information: subset name, subset number, number
of entries, selection criteria, when and by whom the subset was created, and additional
filtering constraints.
Cheminformatics
14.6.3
Current Protocols in Bioinformatics
Supplement 22
Figure 14.6.2
The ZINC database lead-like subset download page.
Under Property Distribution, scatter plots offer an immediate if limited means of evaluating the distribution of molecular properties in the subset.
The representative clusters listed in the Clustering and Diversity section offer four levels
of selected representatives that cover the same range of chemical diversity as the entire
subset.
The Downloads section contains a table of links with which to download molecules in
various formats, over various pH ranges, as well as purchasing information, molecular
properties, and compounds with a sole supplier.
4. Click on the Downloads link (near the top of the page under the General Information
section) to go to the download section of the page at the bottom (Fig. 14.6.3), or
simply scroll to the bottom of the page where the Downloads section and download
table are located.
5. Click on Usual in the right-most column of the “mol2” row of the download table.
Using ZINC to
Acquire a Virtual
Screening Library
This downloads a C-shell script (usual.mol2.csh) that will be used to acquire
the mol2 format molecular structure files for molecular representations at or near
14.6.4
Supplement 22
Current Protocols in Bioinformatics
physiological pH. The Usual subset includes single representations of each molecule
plus any additional protonated or tautomeric forms near physiological pH. Other choices
include Single, to download only a single representation of each molecule (at pH 7),
Metals, to download Usual forms plus additional high-pH forms, such as deprotonated
sulfonamides and thiolates, and All, which includes additional low-pH forms such as
protonated anilines, for example.
6. Invoke the C-shell to run the script:
unix> csh usual.mol2.csh
This runs the usual.mol2.csh script to download the database in compressed mol2
format. This script uses wget to download all files automatically with a single command. If
you are on Linux, Mac OS X, Cygwin, or another Unix-like platform, this script will work
as long as wget is available. If you are on Windows, you will need wget, available from
SourceForge or http://wget.docking.org as described above. It is also possible to download
each database slice individually by clicking on individual slices in the download table.
Whereas downloading files individually is a viable strategy for smaller subsets, such as
the “fragment-like” subset, it becomes impractical for larger database subsets with many
slices. Downloading the “lead-like” subset can take hours, depending on the speed of
your Internet connection. To download SDF instead of mol2, follow the same procedure
as above (i.e., clicking Usual in the rightmost column of the SDF row in the download
table; the script downloaded will then be usual.sdf.csh.). SDF and mol2 format
files contain largely the same information, so normally you will only want one or the
other. SMILES-format files (see top row of download table) are much smaller, so you
download SMILES directly, rather than scripts, to download them. Thus there are no
Figure 14.6.3
Bottom of the “lead-like” download page, featuring the download table.
Cheminformatics
14.6.5
Current Protocols in Bioinformatics
Supplement 22
C-shell scripts to download SMILES. Flexibase files (see bottom row of download table)
are only read by DOCK3.5.54, a version of UCSF DOCK, and may not be available for
all subsets. If you are docking to a metallo-enzyme, you may want to consider using the
Metals option instead of Usual to download additional high-pH representations. If you
are doing substructure searches, clustering, or pattern matching, you may prefer to use
the Single option instead, which offers a single representation of each molecule at pH 7
only.
If your docking program does not read gzip-compressed files, then you will need to
uncompress the files before using them, using gunzip. Warning, these files can be large!
7. When downloading of the database in mol2 format, as described in step 6, is complete,
execute:
unix> gunzip *.mol2.gz; # optional
At this point you have a database on your disk ready for screening. This protocol works
equally well for all the subsets on the subset download page. Some users may be interested
in optional additional information about this subset, as described below.
To view and acquire additional information about the “lead-like” subset
8. Click on the Reference link in the SMILES row of the download table at the bottom
of the “lead-like” download page (Fig. 14.6.3).
This downloads a single representation of each molecule in the subset as SMILES, which
can be useful for local similarity searching, cluster analysis, and scaffold hopping,
9. Go to the Clustering and Diversity section of the download page (Fig. 14.6.4) by
scrolling, or by clicking on the Clustering and Diversity link at the top of the page.
10. Click on the “80%” link.
This downloads cluster representatives at the Tanimoto 80% level as SMILES. All 972,608
lead-like compounds are within Tanimoto 80% of one of these 83,331 representatives.
Cluster representatives may be useful for fast, approximate screens, or to save time. For
example, you might choose to screen only some representatives of the subset to get an
impression of what might be found via a larger database screen. To download cluster
Using ZINC to
Acquire a Virtual
Screening Library
Figure 14.6.4
Clustering and Diversity section of the “lead-like” download page.
14.6.6
Supplement 22
Current Protocols in Bioinformatics
representatives, there are four sets of representatives at the 60%, 70%, 80%, and 90%
Tanimoto levels, offering a range of set sizes to choose from.
11. Click on the Purchasing Information link at the bottom of the download page
(Fig. 14.6.3).
If you intend to purchase compounds to test your predictions, you may wish to download
purchasing information. This file is tab-delimited text containing ZINC ID, catalog number, supplier name, and contact information for each compound. If there are <64,000
rows (e.g., for the “fragment-like” subset), then this file may be opened in Excel or
OpenOffice. If there are >64,000 rows, right mouse click to save file, and use a text editor
such as vim or emacs.
12. Click on the Calculated Properties link at the bottom of the download page
(Fig. 14.6.3).
This downloads a table of calculated properties for each molecule. The columns are:
ZINC ID, molecular weight, calculated LogP, apolar desolvation energy (kcal/mol), polar
desolvation energy (kcal/mol), number of hydrogen bond donors, number of hydrogen
bond acceptors, parametric polar surface area, net molecular charge, number of rotatable
bonds, and the SMILES representation. If there are <64,000 rows, then this file may be
opened in Excel or OpenOffice. If there are >64,000 rows, right mouse click to save file,
and use a text editor such as vim or emacs.
13. Click on the last link on the “lead-like” download page to acquire a list of compounds
that can only be purchased from a single supplier (Fig. 14.6.3).
This downloads a table of compounds that are only available from a single supplier (as
far as we know). Again, due to limitations of spreadsheets, right click to save files with
>64,000 rows.
14. Click the Back button in your browser to return to the list of available property-filtered
subsets (i.e., the page shown in Fig. 14.6.1).
15. Click on the number in the Compounds column in the row corresponding to the
subset of interest on the Property-filtered Subset page to browse the subset online
(Fig. 14.6.1).
This allows you to browse the content of available subsets online. You might want to do
this with each subset before you download it, to check whether you are interested in it.
Each page displays 500 molecules at a time. Thus for large subsets, you are only seeing
a very small fraction of the subset.
When you have finished this protocol, you will have a database of commercially available
compounds that is ready to dock (see UNIT 8.12), screen, classify, or otherwise interpret.
You may also have additional information if you performed any of the steps 10 to 15.
When downloading so many large files, errors in transmission may occur.
16. You may check that you successfully acquired the entire database subset by counting
the number of unique ZINC ID numbers that are included in the files you downloaded,
as follows:
unix> grep ZINC *.mol2 | sort -u | wc -l
17. If you have kept the files compressed, then use:
unix> grep ZINC *.mol2.gz | sort -u | wc -l
The result of this command should be compared with the number of molecules in the
subset, listed at the top of the download page (Fig. 14.6.2). If the numbers differ by >1%,
then compare the number of subset slices with the number in the usual.mol2.csh
script and with the number of slices listed on the download page. Incomplete, missing, or
damaged files may be re-downloaded individually by clicking on the slice number in the
download table at the bottom of the download Web page (Fig. 14.6.3).
Cheminformatics
14.6.7
Current Protocols in Bioinformatics
Supplement 22
BASIC
PROTOCOL 2
DOWNLOAD A VENDOR DATABASE SUBSET FOR VIRTUAL SCREENING
Use this protocol to acquire biologically relevant representations of molecules for screening from a single supplier. You might want to do this because you have a special pricing
deal with a particular vendor, because you are involved in a collaboration that favors a
particular vendor, or because you may have already purchased a vendor’s collection for
HTS and you wish to complement that effort with virtual screening. Whatever your reason, this is the protocol to use. PubChem, which is not a vendor but whose molecules are
linked to the chemical and biological literature via the NIH Entrez system, may be useful
for identifying ligands with biological annotations. Similarly, the Molecular Libraries
Screening Center Network screening collection (MLSCN), which is the screening library
used at nine extramural NIH-funded centers and the National Chemical Genomics Center,
may be of interest because biological activity data for its compounds are available in the
PubChem Assay database.
Necessary Resources
Hardware
A modern computer with an Internet connection. Some files are very large, so
100 GB or more of free space may be required to store the uncompressed files in
mol2 format.
Software
A Unix-like environment, such as Unix, Linux, Mac OS X, or Cygwin. See
Support Protocol of UNIT 9.6 for installation of Cygwin. Other operating systems
may require minor changes.
If using Windows, wget is needed; this is available from SourceForge
(http://sourceforge.net/) or the Web site http://wget.docking.org/. It may be easier
to download ZINC files to a Unix-like machine and move the files to Windows.
A modern browser, such as Firefox 1.5 or later, Opera 9 or later, or Internet
Explorer 7 or later (Internet Explorer 6 will work, barely, but is not advised),
with the Java Runtime Environment (JRE). JRE is available from
http://java.sun.com/jre/ if not already installed.
To download the Enamine vendor subset in mol2 format
1. Point the browser to http://zinc.docking.org.
2. Click on the Vendors link to see available vendor database subsets, sorted alphabetically (Fig. 14.6.5).
3. For this example, scroll down to the Enamine subset. You could equally well use any
other vendor.
Using ZINC to
Acquire a Virtual
Screening Library
About 50 vendor subsets are available, one for each vendor. This protocol works equally
well for all vendors. The table of vendor subsets (Fig. 14.6.5) contains one row for each
vendor with the following information and features organized in five cells. First, the
vendor logo may be clicked to browse the subset online. The second cell contains supplier
information including name, Web site, e-mail, phone, and fax numbers. The third cell
contains the number of source catalog entries and the catalog version used. The fourth
cell contains information about this subset in ZINC: number of molecules loaded, number
filtered out, number for which this vendor is the sole source, and number of compounds in
previous catalogs that are no longer in stock (termed “depleted"). Diversity information
comes last in the form of four sets of cluster representatives at the 60%, 70%, 80%, and
90% Tanimoto levels as was done in Basic Protocol 1. For example, for Enamine, all
876,780 compounds are at least 90% similar to at least one of the 241,664 90% cluster
representatives, reflecting a >3-fold reduction in the size of the set at the Tanimoto 90%
level.
14.6.8
Supplement 22
Current Protocols in Bioinformatics
Figure 14.6.5
ZINC vendor subsets.
4. Click on the number 876780 in the fourth column to go to the Enamine download
page (Fig. 14.6.6).
The Enamine download page (Fig. 14.6.6) contains detailed information about the subset
organized into four sections, analogous to the organization of the “lead-like” download
page in Basic Protocol 1, as follows: (1) General Information, (2) Property Distributions,
(3) Clustering and Diversity, and (4) Downloads.
General Information lists the following information: subset name, subset number, number
of entries, selection criteria, when and by whom the subset was created, and additional
filtering constraints.
Under Property Distribution, scatter plots offer an immediate if limited means of evaluating the distribution of molecular properties in the subset.
The representative clusters listed in the Clustering and Diversity section offer four levels
of selected representatives that cover the same range of chemical diversity as the entire
subset.
The Downloads section contains a table of links with which to download molecules in
various formats, over various pH ranges, as well as purchasing information, molecular
properties, and compounds for which this vendor is the sole supplier.
5. Click on the Downloads link (near the top of the page under the General Information
section) to go to the download section of the page near the bottom, or simply scroll
to the bottom of the page to see the available files to download (refer to Fig. 14.6.7).
6. In the table of downloadable files, click on Usual in the “sdf” row.
This downloads a csh script that will be used to acquire the molecular structure files in
SDF format.
Cheminformatics
14.6.9
Current Protocols in Bioinformatics
Supplement 22
Figure 14.6.6
The ZINC database Enamine vendor download page.
7. Run the usual.sdf.csh script to download the database in compressed sdf
format (see Basic Protocol 1, step 6).
8. If your docking program does not read gzip-compressed files, then you will need to
uncompress the files before using them, using gunzip (see Basic Protocol 1, step 7).
At this point you have a 3-D dockable database of the Enamine “in stock” collection on
your disk ready for screening. This protocol works equally well for all the vendors on
the By Vendor page displayed in Figure 14.6.5. Some users may be interested in optional
additional information about this subset, which is described below.
To download additional information about the Enamine subset of ZINC
9. Click on the last (bottom-most) link (“419986 compounds are ONLY available from
a single vendor”) on the download page (refer to Fig. 14.6.7).
This downloads a list of compounds only available from this vendor. Each row contains
the ZINC ID and the original catalog number of the compound that is, according to our
information, not available from any other vendor.
Using ZINC to
Acquire a Virtual
Screening Library
14.6.10
Supplement 22
Current Protocols in Bioinformatics
Figure 14.6.7
Bottom of the download page for vendor Enamine, featuring the download table.
10. Scroll to the Clustering and Diversity section of the Enamine download page (depicted at the top and bottom in Fig. 14.6.6 and Fig. 14.6.7, respectively), or click on
the Clustering and Diversity link near the top of the page.
11. Click on the four entries in the table at the 60%, 70%, 80%, and 90% levels to
download.
This downloads cluster representatives as SMILES at four levels. For some applications,
to save time, you may wish to download cluster representatives of the collection.
12. Click on Purchasing Information (second link from the bottom of the download page;
see Fig. 14.6.7).
This downloads a tab-delimited file of purchasing information to your computer for this
subset. You can use this table to look up purchasing information without having to return
to the ZINC Web site. The tab-delimited text file, which may be loaded into a spreadsheet,
contains one row per catalog item as follows: catalog number, supplier name, contact
information (Web site, e-mail, phone, and fax).
13. Click on Calculated Properties near the bottom of the download page (refer to
Fig. 14.6.7).
This downloads a tab-delimited text file containing calculated properties, one row per
compound. Each row contains: ZINC ID, calculated logP, molecular weight, H-bond
donors, H-bond acceptors, number of rotatable bonds, net charge, and polar surface
area.
Cheminformatics
14.6.11
Current Protocols in Bioinformatics
Supplement 22
More information about this subset
14. Click the Back button in your browser to return to the table of available vendor
subsets (Fig. 14.6.5).
15. In the Enamine row, click on the number of filtered-out compounds, which is the
second line in the ZINC Information column.
This downloads a list of compounds that were filtered out of the supplier catalog, one
line per compound. For each compound, a reason is given as to why it was rejected. The
rules for loading compounds into ZINC have evolved, and continue to change to reflect
opinion in the field and our own biases. If a molecule in a supplier catalog is not in ZINC,
look for it in this list. If you still want to have the molecule processed, you may process it
yourself using Basic Protocol 5. We aim to provide a database that is useful to a broad
audience, and thus you are welcome to suggest changes to our filtering rules by writing
us comments at [email protected].
16. Click on the vendor’s icon in the ZINC Database by Vendor page (Fig. 14.6.5).
You may wish to browse the collection online before deciding to download it. To do this,
click on the Enamine icon in the left-most cell.
17. From the Subset menu (on the Zinc homepage), select Synthesis on Request.
18. Proceed as if you were in the ZINC Database by Vendor section, described above in
this protocol.
Four vendors currently offer “synthesis on request" catalogs. These catalogs include compounds that can be made, often in <10 weeks, occasionally much faster. At this time there
are more compounds available in ZINC via synthesis on request than there are in stock.
When you have finished this protocol you will have a database of commercially available
compounds from the vendor Enamine (or any other vendor you choose) that is ready to
dock, screen, classify, or otherwise interpret. You may also have additional information
if you performed any of steps 9 through 18. With such large files to download, errors in
transmission may occur.
19. You may check that you successfully acquired the entire database subset by counting
the number of unique ZINC ID numbers that are included in the files you downloaded,
as follows:
unix> grep ZINC *.mol2 | sort -u | wc -l
20. If you have kept the files compressed, then use:
unix> zgrep ZINC *.mol2.gz | sort -u | wc -l
The result of this command should be compared with the number of molecules in the subset,
listed at the top of the download page. If the numbers differ by >1%, then compare the
number of subset slices with the number in the usual.sdf.csh script and with the
number of slices listed on the download page. Incomplete, missing, or damaged files may
be re-downloaded individually by clicking on the slice number in the download table at
the bottom of the download Web page.
BASIC
PROTOCOL 3
Using ZINC to
Acquire a Virtual
Screening Library
SEARCHING ZINC
Use this protocol to explore the contents of ZINC online, and to find molecules that match
some criteria. You should consider using this protocol if you already have a chemical
starting point, for example, a list of actives, and you wish to identify similar commercially
available molecules for screening, modeling, or acquisition. Directly finding molecules
you like in ZINC can save time compared to downloading an entire subset such as the
“lead-like” collection (Basic Protocol 1). You may search using molecular structure
or substructure constraints expressed as SMILES or SMARTS, molecular property
constraints, supplier catalog constraints, ZINC ID numbers, or any combination of these.
14.6.12
Supplement 22
Current Protocols in Bioinformatics
The result of a search is a list of molecules, which may be empty if none matches
the criteria provided. This protocol illustrates the flexible search options available for
finding molecules in ZINC. At the end of this protocol you should know how to specify
molecular property, substructure, and other constraints to identify compounds of interest,
browse them online, and download them, either individually or as a mini-subset. The
ZINC search tool is limited: not all queries can be carried out in a single transaction.
For example, to search for small rigid molecules, or medium-sized neutral molecules, it
is advisable to perform this as two separate queries. For fastest performance, always try
with “no time limit” unchecked at first, so that you get some feedback quickly. It is easy
to go back a page in the browser and re-execute the query with no time limit after you
are sure you are matching what you really want.
If you fail to find a particular molecule, or members of a particular class of molecule, even
with “no time limit” checked, this may be due to one or more of the following reasons:
(1) the pattern match may have failed, (2) the molecule may not be loaded, or (3) there
may be a bug or a limitation in the ZINC system. Each of these three possibilities are
discussed below.
The molecule you seek may not be in ZINC. One reason for this may be that the
compound you seek may not be sold by the vendors that are used to build ZINC, even
if the compound seems very popular. Even if it is in one of the source catalogs used
for ZINC, it may have been filtered out or may have failed one of the many steps of
processing. If a molecule you need is not in ZINC, you may attempt to process it using
Basic Protocol 5. If this fails, or if you are stumped about the absence of a particular
molecule, please contact us at [email protected] to discuss.
Another reason the molecule may not be in ZINC is that there may be a problem with
ZINC. For example, the search index may be out of date. There may be a transient
problem with the ZINC server, the server may be undergoing maintenance, some key
service may have crashed, a license may have expired, or there may be any number of
other problems. If you suspect this is the reason, try to search again tomorrow. If you
still do not find what you are looking for and you believe it is present in ZINC, please
write us at [email protected] to discuss.
Necessary Resources
Hardware
A modern computer with an Internet connection. Some files are very large, so
100 GB or more of free space may be required to store the uncompressed files in
mol2 format.
Software
A Unix-like environment, such as Unix, Linux, Mac OS X, or Cygwin. See
Support Protocol of UNIT 9.6 for installation of Cygwin. Other operating systems
may require minor changes.
If using Windows, wget is needed; this is available from SourceForge
(http://sourceforge.net/) or the Web site http://wget.docking.org/. It may be easier
to download ZINC files to a Unix-like machine and move the files to Windows.
A modern browser, such as Firefox 1.5 or later, Opera 9 or later, or Internet
Explorer 7 or later (Internet Explorer 6 will work, barely, but is not advised),
with the Java Runtime Environment (JRE). JRE is available from
http://java.sun.com/jre/ if not already installed.
Files
Some variants of this protocol may use a text file containing SMILES, SMARTS,
or ZINC IDs, one item per line. SMARTS should be listed one per line with no
Cheminformatics
14.6.13
Current Protocols in Bioinformatics
Supplement 22
spaces or other characters. SMILES should have an integer Tanimoto similarity
constraint between 0 and 100, after the SMILES, separated by whitespace.
To acquire molecules in ZINC similar to purine
1. Point the browser to http://zinc.docking.org.
2. Click on the Search and Browse link to go to the database search page (Fig. 14.6.8).
Use this page for all ZINC database searches. On the left is a form for molecular property–
based queries, which will be used later in the protocol. On the right, the Java Molecular
Editor (JME) may be used to compose structure-based queries. The JME requires the
Java Runtime Environment (JRE). Get the JRE from http://java.sun.com/jre/ if you do not
have it.
3. For this example, we will search for molecules similar to purine. Draw purine in
the JME (refer to Fig. 14.6.8 for the structure of purine). Click on the phenyl ring
and then click in the drawing area. Click on cyclopentane and then click on one of
the edges of the phenyl ring. Click on N and click on the four locations where N
goes (refer to Fig. 14.6.8). Click on the double bond tool and click the bond in the
five-membered ring to complete the aromatic system. If you make a mistake, you
can click UDO to undo the last move or CLR to clear and start over.
Using ZINC to
Acquire a Virtual
Screening Library
Figure 14.6.8
Database Search and Browse page.
14.6.14
Supplement 22
Current Protocols in Bioinformatics
4. When you have finished, click on the Save SMILES link to write the SMILES code
for purine in the window below the JME.
It is the SMILES window and not the JME that is actually used for searching. The JME
merely helps you compose the SMILES. You may use more than one SMILES, one per
line. If you have difficulty creating the SMILES, you may type it manually as follows:
c2ncc1[nH]cnc1n2. (Please note the SMILES window is case sensitive.)
5. Click your mouse after the SMILES for purine and type a space followed by 100,
indicating that you want to match this SMILES at or near the 100% Tanimoto
similarity level (i.e., we seek identical or nearly identical molecules). To start the
search, click the QUERY DATABASE button at the bottom of the page.
The search may take 30 sec. When finished, your browser will display the molecules that
have been found matching this pattern (Fig. 14.6.9), the first of which is purine.
Processing speed depends on the load on the ZINC Web site servers, which varies minute
to minute throughout the day. The default calculation returns a result after ∼30 sec, irrespective of load, which may result in an incomplete result. To force the server to perform an
exhaustive search, click the No time limit checkbox to the right of the QUERY DATABASE
button at the bottom of the search page (Fig. 14.6.8). In some cases, searches with no time
limit may take a long time to complete. Note that the result contains molecules containing
the purine ring substructure. You have thus just performed a Tanimoto similarity search
using SMILES. SMILES is a powerful molecular specification language. You can read
more at the Daylight Web site, http://www.daylight.com/dayhtml/doc/theory/index.html.
Each molecule found that matches the search query appears as a separate row in the table,
with a maximum of 500 rows at a time, three cells per row. Cell one contains the ordinal
number in the list, the ZINC Id number, a “flag” icon used to indicate a problem to the
curators, and a “discuss” button used to annotate or discuss this molecule on the wiki.
The second cell contains purchasing information, molecular representation information,
molecular properties, available annotations, any precalculated “Similar to” information
and a Find Similar action button. The third cell has a 2-D depiction of the molecule,
which opens a 3-D model when clicked.
The result of this search is purchasing information for the compounds matching your
query. You may also want to obtain additional information about this list of compounds,
or about any one particular compound.
To view additional information about the compounds found in ZINC
6. Click on the MOL2 button at the top of the page (see Fig. 14.6.9).
This downloads all the molecules matched (up to 500) in mol2 format.
7. Click on the Purchasing Info button at the top of the page.
This downloads a table of purchasing information for all the molecules matched (up to
500) in tab-delimited text format, suitable for loading into a spreadsheet.
8. Click on the “Download table” button at the top of the page.
This downloads a table of calculated molecular properties for all the molecules matched
(up to 500) in tab-delimited text format, suitable for loading into a spreadsheet.
9. Click on the SMILES button at the top of the page.
This downloads all the molecules matched (up to 500) as SMILES.
10. Click on the 2-D depiction of any molecule.
This displays a 3-D structure of the molecule in a separate window, using a Java applet.
11. Click on the ZINC Id of the first hit, which is found in the left-most cell.
This brings up a separate window containing only that molecule. It effectively focuses on
a single molecule.
Cheminformatics
14.6.15
Current Protocols in Bioinformatics
Supplement 22
Figure 14.6.9
Results browser showing hits matching purine.
12. Click on the first “ref” link, called “mol2” for reference, in the second cell.
This downloads the pH 7 representation of the molecule to your computer in mol2 format.
13. Click on the Find Similar button in the second cell.
This searches ZINC in real time for similar molecules at the Tanimoto 80% similarity
level. The search is exhaustive and may take anywhere from a few seconds to more than a
minute, depending on the number of compounds matched, and the transient load on our
servers.
14. Click on the Go SEA! button in the second cell (next to the Find Similar link).
This scans the SEA database (Keiser et al., 2007) to see whether this molecule resembles
any known drugs or metabolites.
15. Click on the catalog number next to the Supplier in the second cell.
Using ZINC to
Acquire a Virtual
Screening Library
If the vendor has an e-commerce Web site, and if ZINC is aware of it and compatible
with it, then you will be taken to the vendor’s Web site where you may add the compound
to your shopping basket on the vendor’s site. If the foregoing conditions are not met,
then you are offered an opportunity to write to the supplier enquiring about price and
availability of the compound. Compounds may also be purchased via intermediary agents,
14.6.16
Supplement 22
Current Protocols in Bioinformatics
but this is not considered here. We also recommend using http://emolecules.com to check
for information about price and availability, which is often faster and more current than
ZINC.
To search for molecules containing a purine ring (via SMARTS)
16. Point the browser to http://zinc.docking.org/.
17. Click on the Search and Browse link to go to the database search page (Fig. 14.6.8).
18. Create purine (see step 3, above) in the JME and click Save SMILES.
19. Do not type 100 as you did in step 5 above. Without a number at the end of the line,
this pattern will not be interpreted as SMARTS and will thus perform a substructure
search.
20. Click on the QUERY DATABASE link at the bottom of the search page.
The search may take up to 30 sec to run, depending on the load on our servers. The rest of
the details are the same as above. The search result is now molecules that contain purine,
not just those molecules that closely resemble purine.
21. If there are >500 molecules in the list (and there will be in this case), you may see
the next page by clicking on Next Page at the upper-left-hand side of the browser
page.
To download >500 molecules at a time, you must create a subset (see Basic Protocol 4).
You may experiment with different values of Tanimoto similarity, the molecule used to
search. You may enter multiple SMILES in the same line, separated by the conjunction
“.”, which means that each of them must match (logical AND).
To search ZINC using physicochemical property constraints
22. Point your browser to http://zinc.docking.org.
23. Click on the Search and Browse link to the database search page (Fig. 14.6.8).
24. To find small, neutral, rigid molecules, enter numbers as follows. In Rotatable bonds
and Net charge, enter 0 as both high and low constraints. For Molecular weight,
enter 50 as a lower bound and 100 as the maximum constraint.
25. Click on the QUERY DATABASE link at the bottom of the search page.
In a few seconds the results appear in your browser. Proceed to browse these results as
described above in steps 6 to 15.
To retrieve ZINC entries by ZINC ID number
26. Point the browser to http://zinc.docking.org.
27. Click on the Search and Browse link to the database search page (Fig. 14.6.8).
28. In the ZINC codes field (left-hand side, center) type the number 1234567. (You
may enter more than one ZINC ID, one per line).
29. Click on the QUERY DATABASE link at the bottom of the search page.
In a few seconds the results appear in your browser. Proceed to browse these results as
described above in steps 6 to 15.
CREATE AND DOWNLOAD A CUSTOM SUBSET
As we have seen, you may download large preprepared subsets by property (Basic
Protocol 1) or vendor (Basic Protocol 2). You may also download mini-subsets of up to
500 molecules directly from the results of a ZINC database search (Basic Protocol 3).
If you would like to download >500 but <10,000 molecules based on your own search
BASIC
PROTOCOL 4
Cheminformatics
14.6.17
Current Protocols in Bioinformatics
Supplement 22
criteria, then you should use this protocol. If you require a subset with >10,000 molecules,
please write to us to request a custom subset be made for you. Basic Protocol 4 is only
supported in ZINC version 8.
Necessary Resources
Hardware
A Unix-like environment, such as Unix, Linux, Mac OS X, or Cygwin. See
Support Protocol of UNIT 9.6 for installation of Cygwin. Other operating systems
may require minor changes.
Software
If using Windows, wget is needed; this is available from SourceForge
(http://sourceforge.net/ ) or the Web site http://wget.docking.org/. It may be
easier to download ZINC files to a Unix-like machine and move the files to
Windows.
A modern browser, such as Firefox 1.5 or later, Opera 9 or later, or Internet
Explorer 7 or later (Internet Explorer 6 will work, barely, but is not advised),
with the Java Runtime Environment (JRE). JRE is available from
http://java.sun.com/jre/ if not already installed.
To create a custom subset of purine-ring containing compounds that have logP <4
and have molecular weight <400
1. Point the browser to http://zinc8.docking.org/.
2. Select Search and Browse from the Home pull-down menu.
3. Specify the search as in Basic Protocol 3, sketching purine, clicking Save SMILES,
and adding constraints for logP <4 and molecular weight <400.
4. Click on the QUERY DATABASE link at the bottom of the search page.
5. At the top of the listing of results click on the Create Subset link.
After a brief pause of no more than a minute, a message reading “Creating subset X.
Browse subset X. Browse user-created subsets.” appears, where X is the number of the
subset being created. Subset preparation typically takes ∼1 min per 100 molecules, with
a 1 min minimum. You may browse all currently available subsets by clicking on Browse
user-created subsets or by choosing User Subsets from the Subsets pull-down menu at
any time.
The subset download page contains a directory listing of all files, and a helpful guide
to the most useful files at the bottom of the page. Click on the files that match the
pattern e p0.*.mol2.gz to get the reference structures at pH 7 in mol2 format and on
e p1.mol2.gz to get additional protonated and tautomerized forms near physiological
pH.
Subset preparation is a live service, and thus may fail for various reasons. Although most
subsets are ready in minutes, please wait 24 hr before reporting a problem so that we can
attempt to fix it first. If you find us slow, there is a link where you may bring a failure to
our attention.
BASIC
PROTOCOL 5
Using ZINC to
Acquire a Virtual
Screening Library
UPLOAD AND PROCESS YOUR OWN MOLECULES
Sometimes you want to dock molecules that are not in ZINC. These could be molecules
you have made, or are considering making. This protocol describes how to process arbitrary molecules. A maximum of 1000 molecules may be processed in each transaction.
Some restrictions apply (see Table 14.6.1). Compounds are filtered, and will be rejected,
with reasons, if they do not pass. This facility is not for vendors to upload their catalogs.
Vendors, please contact [email protected] to send us your catalogs in SDF format,
14.6.18
Supplement 22
Current Protocols in Bioinformatics
Table 14.6.1 Limitation to Uploading and Processing Molecules
Limitation
Comments
File formats for
Basic Protocol 5
Basic Protocol 5 depends on receiving correctly formatted files of
molecules. Prospective users of this service should pay attention to the
standards for SMILES, SDF, and mol2 formats.
Subset limitations
You may only create subsets of up to 10,000 molecules.
Filtering restrictions
ZINC filters molecules to prevent molecules that we think are unlikely
candidates for structure-based ligand discovery from being loaded. The
filtering rules continue to evolve with our research. The current rules in
effect are available on our Web site, http://filtering.docking.org.
Failure during upload
File upload and processing is perhaps the most error-prone service
offered on the ZINC Web site. This is because success depends on
many factors: the file format of the data being uploaded, the chemical
constitution of the molecules themselves, the availability of our
servers, and the correctness of our processing scripts. Normally, an
error message is produced by failures, and we review these messages
regularly. If you can’t wait for us, or if you think we have not noticed
the failure, please bring the failure to our attention.
which we will process and load ourselves. Basic Protocol 5 is only supported in ZINC
version 8.
Necessary Resources
Hardware
A Unix-like environment, such as Unix, Linux, Mac OS X, or Cygwin. See
Support Protocol of UNIT 9.6 for installation of Cygwin. Other operating systems
may require minor changes.
Software
If using Windows, wget is needed; this is available from SourceForge
(http://sourceforge.net/ ) or the Web site http://wget.docking.org/. It may be
easier to download ZINC files to a Unix-like machine and move the files to
Windows.
A modern browser, such as Firefox 1.5 or later, Opera 9 or later, or Internet
Explorer 7 or later (Internet Explorer 6 will work, barely, but is not advised),
with the Java Runtime Environment (JRE). JRE is available from
http://java.sun.com/jre/ if not already installed.
Files
You will need the molecules to be formatted in either SMILES, mol2, or SDF
format. We recommend SMILES format. We will convert your mol2 and SDF to
SMILES before generating 3-D structures.
View and download additional information about the “lead-like” subset
1. Point the browser to http://zinc8.docking.org/.
2. Select User Upload from the Home pull-down menu.
3. Click on the Browse link to select your file in either SMILES, mol2, or SDF format.
(Fig. 14.6.10).
All other fields are optional, and will only be used to annotated the uploaded ligands.
Cheminformatics
14.6.19
Current Protocols in Bioinformatics
Supplement 22
Figure 14.6.10
Database Upload page.
4. Click Upload & Build to start the process.
You will receive a message indicating that the molecules have been uploaded and that
they are being processed. (Fig. 14.6.11). Processing can take up to a minute per molecule,
with a minimum of 1 min. You may browse to the ligands. As in Basic Protocol 4, there
is a helpful guide to the important files at the bottom of the download page. You may
download the mol2 representations at pH 7 using e p0.*.mol2.gz and the additional
forms near physiological pH using e p1.*.mol2.gz.
The directory contains a report about molecules that were filtered out (filterlog.
txt), with justifications. There is a log file of the processing (stdout, stderr), which
may contain messages about problems during processing. There are three files mapping
your identification numbers to ZINC identification numbers depending on whether they
were already in ZINC (alreadyinzinc.smi, inzinc.smi) or were processed
for the first time (dict).
Using ZINC to
Acquire a Virtual
Screening Library
14.6.20
Supplement 22
Current Protocols in Bioinformatics
Figure 14.6.11
Page showing Upload & Build status.
COMMENTARY
Background Information
ZINC was created to lower one of the
barriers to entry to virtual screening: the
preparation of a 3-D database suitable for
docking. ZINC serves this purpose by processing catalogs from many of the most important compound vendors and making ready-todock databases available in easy-to-download
formats. ZINC is organized for download by
physicochemical properties (Basic Protocol 1)
and vendor (Basic Protocol 2). Search facilities (Basic Protocol 3) enable browsing and
the download of small (<500 molecules) subsets. Mid-size subsets containing up to 10,000
molecules may be created and downloaded just
like preprepared subsets (Basic Protocol 4).
Larger subsets may be created only on request
to [email protected] as this can entail significant CPU usage and possibly some curation. Finally, there will always be molecules
that are not in ZINC, so small sets of molecules
(<1000) may be uploaded for processing using
our standard pipeline (Basic Protocol 5).
Vendor catalogs evolve over time. Some
vendors make as many as 20,000 new compounds in a single month! Similarly, every
quarter tens of thousands of molecules become depleted and can no longer be purchased.
ZINC aims to keep up with this staggering rate
of change, at least annually, and, one day perhaps, faster than that. Moreover, we try to add
several new vendors every year. Sadly, some
vendors occasionally cease operations, requiring updating of our records. At any one time,
it is typical that perhaps 20% of selected compounds from a virtual screen may no longer
be purchasable. We therefore recommend that
you select ∼20% more compounds than you
aim to buy to avoid disappointment. Supply
rates do vary by vendor, but much of this data
is anecdotal, and also changes over time.
The ZINC pipeline makes use of third-party
software from collaborative software vendors.
The ZINC protocol attempts to incorporate the
latest tested algorithms from these vendors,
and as a result, the treatment of molecules
changes gradually over time. Keeping ZINC
curated and correct is a never-ending process,
and we acknowledge that there are numerous
“broken” or otherwise problematic molecules
in ZINC. If you find something, please tell us.
We attempt to fix all problems that are reported
to us.
Biologically relevant forms are important
for physics-based scoring of docked poses, and
are a central feature and organizing principle
of ZINC. Besides 3-D docking applications,
ZINC has been used for chemical informatics
Cheminformatics
14.6.21
Current Protocols in Bioinformatics
Supplement 22
(2-D) applications. In this case, we recommend the use of the “pH 7” or “single”
representation of the database.
Critical Parameters and
Troubleshooting
Corrupt or incomplete files
If a file you acquired from the ZINC Web
site seems incomplete or damaged in some
way, or cannot be uncompressed, or does not
look right for some reason, the first thing
to try is to redownload the file manually. If
the file is still corrupt, please contact us at
[email protected] to correct it. We offer
tens of millions of separate files for download,
and we would be surprised if there were no
problems at all. Please bring problems to our
attention and we will try to fix them as soon as
logistics allow.
Search, Upload, Subset creation or Web
page browsing hung
If a search seems to run forever, try without
the No time limit option checked. If it still
runs forever, there may be a problem with our
servers. Please be patient, and try again later.
If you can’t wait, or if it seems persistently
hung, please email us at [email protected]
describing the problem you are seeing.
Problems with the interface and how to
report them
The ZINC Web site continues to develop
and evolve. Numerous errors and other problems have been reported in the ZINC Web
site since it first appeared 2 years ago. Moreover, transient errors due to system load, full
disks, or failed components occur from time
to time. If you notice a problem with the
ZINC Web site, please report it to us at
[email protected] and we will do our best
to fix it as soon as logistics allow.
Acknowledgments
Using ZINC to
Acquire a Virtual
Screening Library
This work was supported by NIGMS,
GM71896 (to Brian K. Shoichet and JJI).
We thank participating compound suppliers,
which are named on the ZINC Database by
Vendor Web page. We are grateful to our commercial software suppliers for access to their
software and technical support: OpenEye Scientific Software (http://www.eyesopen.com),
Xemistry GmbH (http://xemistry.com),
Molinspiration (http://www.molinspiration.
com), Molecular Networks (Germany), and
Schrödinger Inc. (http://www.schrodinger.
com).
Literature Cited
Gasteiger, J., Rudolph, C., and Sadowski, J. 1990.
Automatic generation of 3D-atomic coordinates
for organic molecules. Tetrahedron Comput.
Methods 3:537-547.
Ihlenfeldt, W.D., Takahasi, Y., Abe, H., and
Sasaki, S. 1992. In Daijuukagakutouronkai
Dainijuukai Kouzoukasseisoukan Shinpojiumu
Kouenyoushishuu (K. Machida and T. Nishioka,
eds.) pp. 102-105. Kyoto University Press, Kyoto, Japan.
Keiser, M.J., Rother, B.L., Armbruster, B.N.,
Ernsberger, P., Irwin, J.J., and Shoichet, B.K.
2007. Relating protein pharmacology by ligand
chemistry. Nat. Biotechnol. 25:197-206.
Key References
Huang, N., Shoichet, B.K., and Irwin, J.J. 2006.
Benchmarking sets for molecular docking. J.
Med. Chem. 49:6789-6801.
Irwin, J.J. 2006. How good is your screening library? Curr. Opin. Chem. Biol. 10:352-356.
Irwin, J.J. and Shoichet, B.K. 2005. ZINC: A
database of commercially available compounds
for virtual screening. J. Chem. Inf. Model
45:177-182.
This paper describes the original public release of
the ZINC database (version 4, released January
2005).
Internet Resources
http://zinc.docking.org/
The Zinc Web site. All the protocols described in
this unit use the ZINC Web site exclusively.
http://daylight.com
The Daylight Theory Manual describes SMARTS
and SMILES.
http://dock.compbio.ucsf.edu
DOCK is an example of a docking program that can
use molecules from ZINC.
http://emolecules.com
Commercially available chemical space, without
the 3-D representation.
http://pubchem.ncbi.nlm.nih.gov/
Source of pubchem molecules.
http://eyesopen.com
Source of the OEChem chemical informatics toolkit,
the Omega conformational sampling program, the
Ogham depiction tools, the QuacPAC charge and
electrostatics tools, and other tools used by ZINC.
Also home of VIDA, a remarkable visualization tool,
that works well with ZINC.
http://xemistry.com
Source of Cactvs, used to prepare ZINC and to support numerous key functions on the ZINC Web site.
http://molinspiration.com
Source of mitools, used to calculate molecular properties for ZINC. Mitools are noteworthy for catching errors in SMILES that other packages miss.
http://www.schrodinger.com
Source of ligprep, used to protonate and tautomerize molecules in ZINC.
14.6.22
Supplement 22
Current Protocols in Bioinformatics
http://comp.chem.umn.edu/amsol/
Source of AMSOL, the semiempirical quantum mechanics program by Cramer and Truhlar with
a salvation-adjusted Hamiltonian, used to calculate partial atomic charges and atomic desolvation
penalties in ZINC.
Cheminformatics
14.6.23
Current Protocols in Bioinformatics
Supplement 22
PharmGKB: An Integrated Resource of
Pharmacogenomic Data and Knowledge
UNIT 14.7
Li Gong,1 Ryan P. Owen,1 Winston Gor,1 Russ B. Altman,1, 2 and Teri E. Klein1
1
2
Genetics Department, Stanford University, Stanford, California
Department of Bioengineering, Stanford University, Stanford, California
ABSTRACT
The PharmGKB is a publicly available online resource that aims to facilitate understanding how genetic variation contributes to variation in drug response. It is not only a
repository of pharmacogenomics primary data, but it also provides fully curated knowledge including drug pathways, annotated pharmacogene summaries, and relationships
among genes, drugs, and diseases. This unit describes how to navigate the PharmGKB
Web site to retrieve detailed information on genes and important variants, as well as
their relationship to drugs and diseases. It also includes protocols on our drug-centered
pathway, annotated pharmacogene summaries, and our Web services for downloading the underlying data. Workflow on how to use PharmGKB to facilitate design of the
pharmacogenomic study is also described in this unit. Curr. Protoc. Bioinform. 23:14.7.1C 2008 by John Wiley & Sons, Inc.
14.7.17. Keywords: database r pharmacogenomics r pharmacogenetics r drug response r
genetic variation r pathway analysis r SNP r polymorphisms r study design
INTRODUCTION
Pharmacogenomics is the study of how genetic variation contributes to variation in drug
response. Driven by technology advancements in the post-genomic era, pharmacogenomics research has the potential to optimize drug efficacy and minimize toxicity. It
bridges the gap between the scientific discoveries and clinical application, and offers
the exciting promise of personalized drug therapy. The Pharmacogenetics and Pharmacogenomics Knowledge Base (PharmGKB) is a publicly available internet resource for
pharmacogenomic data and knowledge (Klein and Altman, 2004). PharmGKB strives to
capture rapid advancements in the pharmacogenomics area. It is the central data repository for pharmacogenetic and pharmacogenomic data, in addition to providing integrated
knowledge including drug pathways, gene summaries, and relationships among genes,
drugs, and diseases.
PharmGKB serves diverse user groups from the scientific community. It provides comprehensive and integrated drug, gene, and disease information to pharmacologists, clinical
investigators, and biologists, as well as to informaticians. The PharmGKB homepage has
been designed in a way that highlights the primary interests of most users, and registered
users have complete access to individualized genotype and phenotype data for discovery research and further analysis. PharmGKB is also an excellent educational portal for
any person who is new to pharmacogenomics. A graphic schema depicting the central
elements involved in drug response and associated genetic basis is displayed on the
PharmGKB homepage. Also provided on the homepage are lecture materials, tutorials,
and useful links intended to help people familiarize themselves with the fundamental
concepts of pharmacogenomics research and personalized medicine.
Cheminformatics
Current Protocols in Bioinformatics 14.7.1-14.7.17, September 2008
Published online September 2008 in Wiley Interscience (www.interscience.wiley.com).
DOI: 10.1002/0471250953.bi1407s23
C 2008 John Wiley & Sons, Inc.
Copyright 14.7.1
Supplement 23
The protocols in this unit describe how to use PharmGKB to browse pharmacogenomic
data and knowledge. The Basic Protocol describes how to navigate the PharmGKB
homepage and browse through the knowledge base starting from the search by gene
option. Support Protocol 1 explains in detail how to use our variant browser and variant
table; Support Protocol 2 describes how to explore our unique drug-centered pathways;
Support Protocol 3 demonstrates the types of knowledge contained in our Very Important
Pharmacogene (VIP) gene summaries; and Support Protocol 4 describes our Web services
project, which allows our users to bulk download data from PharmGKB.
BASIC
PROTOCOL
NAVIGATING THE HOMEPAGE OF PharmGKB USING SEARCH
BY GENE
This protocol introduces the basic techniques used for searching and browsing the content
on the PharmGKB Web site.
Necessary Resources
Hardware
Computer with an internet connection
Software
Any up-to-date Web browser will work.
Files
No input files required
The PharmGKB homepage: Getting started
1. Open the PharmGKB homepage at http://www.pharmgkb.org in a Web browser.
The PharmGKB homepage is the common entry point for all users. It has been designed
to highlight the types of information that are most sought after by a diverse group of
users. A graphic schema for understanding the basis of pharmacogenomics has also been
included (Fig. 14.7.1).
The menu tabs at the top of the page provide access to the top-level section of the
PharmGKB site; see Table 14.7.1 for a description of the various tabs. Prominently
displayed in the center of the homepage are clickable icons that allow our users to go
directly to a specific type of pharmacogenomic-related data, such as pathways, genes,
variants of interest, drugs, diseases, and download information. Right below the icon is
the search box where a user can enter text for a Google-type query. The search box is
also prominently displayed at the top right-hand corner of the homepage. At the top right
of every PharmGKB page, a feedback link is available. A scientific curator responds to
all feedback within 48 hr.
Pharmacogenomics
Knowledge Base
(PharmGKB)
The PharmGKB homepage also provides basic tutorial information about pharmacogenetics and pharmacogenomics. Below the search box is a graphic schema that illustrates
the basic flow of pharmacogenetic information. After a drug is administered, it is absorbed, distributed, metabolized, and excreted (pharmacokinetics; PK); the drug then
reaches its target and elicits a drug response (pharmacodynamic effects; PD). Both the
PK and PD of the drug can be influenced by an individual’s genetic makeup (GN) and
in turn, lead to distinct clinical outcomes (CO). The five categories of evidence (COE)
mentioned above appear in this diagram, and their relationship to each other is indicated
in the picture. Definitions of these terms are provided in the Useful Links section at the
bottom-right of the homepage. Another valuable learning resource on the PharmGKB
homepage is the list of Curators’ Favorite Papers. This is a biweekly feature that covers
recent “hot” papers in pharmacogenomics. Each paper is annotated with the pertinent
categories of evidence (COE) and tagged with relevant genes, drugs, and diseases.
14.7.2
Supplement 23
Current Protocols in Bioinformatics
Figure 14.7.1
The PharmGKB homepage (http://www.pharmgkb.org).
Table 14.7.1 Description of Menu Tabs
Tab
Description
Home
The front page where we highlight our knowledge and data content, mission,
contact information, and registration
Search
The main search page where we can either search by free text, user-canned
queries, or browse information by domain
Submit
The section that describes how a user can submit genotype, phenotype,
pathway, or literature data
Help
An extensive list of background information, downloads, educational, as well
as technical references
PGRN
Lists all members involved in the NIH Pharmacogenetics Research Network,
their research interests, and submissions to PharmGKB
Contributors
The section where people are listed who have contributed data to PharmGKB
My PharmGKB
The section for our registered users to view their profile, submission, and
Web site statistics
Searching by Gene and its associated variant, pathways, drugs, and disease
information
A gene can be searched by either typing the gene name or symbol in the search box, or,
clicking on the gene icon from the homepage and then browsing through the alphabetically sorted gene list. For example, to search for VKORC1, a key protein in vitamin K
metabolism and target of the anticoagulant drug warfarin, type VKORC1 in the search
Cheminformatics
14.7.3
Current Protocols in Bioinformatics
Supplement 23
Figure 14.7.2
subunit 1).
Example of PharmGKB Gene page (VKORC1, vitamin K epoxide reductase complex,
box, then click “go.” If no result is returned, try a synonym or partial name. Both alternative names and other symbols that might have been used in the literature for the gene
of interest are included for all genes in PharmGKB. We adhere to the nomenclature at
HUGO Gene Nomenclature Committee (HGNC) for official gene names (Eyre et al.,
2006), and make every effort to keep them current.
2. Open the VKORC1 gene page (Fig. 14.7.2).
The main gene page is also organized by a tab system similar to the homepage. The
overview tab lists the alternative gene symbols and gene names as well as details, such
as gene and mRNA boundaries, and their OMIM phenotype, if available. Additional
tabs for the gene include Datasets, Pathways, Curated, and noncurated publications.
The last tab is the downloads/cross-references, which illustrates the links to download
genotype or phenotype data associated with the gene. It also lists unique identifiers used
by PharmGKB and other external genomic databases for the specific gene.
3. Click on the VIP tab to view the VKORC1 VIP gene summary containing detailed information on variant and haplotype mapping and their importance in drug responses.
(See Support Protocol 3 for details).
4. Click on the Variants tab to display all the variants for VKORC1 available in PharmGKB in the browser, as well as in the variant table with variant details and functional
annotation for variants of interests (see Support Protocol 1 for details).
5. To view curated phenotype data associated with VKORC1, click on the Datasets tab,
then select the link titled WUSTL warfarin dosing data, group A (Fig. 14.7.3).
Pharmacogenomics
Knowledge Base
(PharmGKB)
Phenotype data at PharmGKB are organized by a tab system, similar to that on the
homepage. The Overview tab lists the investigator, related genes, drugs, and disease,
as well as a summary for the study. The second tab, Publications, lists all publications
related to that phenotype. The third tab lists all column headers and descriptions for the
14.7.4
Supplement 23
Current Protocols in Bioinformatics
Figure 14.7.3
Example of PharmGKB phenotype data.
individual phenotype data, such as gender, race, age, dose etc. The Individualized data
tab allows the user to view individualized subject data after the user logs in.
6. Click on the Pathways tab to view all pathways associated with VKORC1. Click
on the Warfarin Pathway (PD) link to view the simplified diagram of the target of
warfarin action and downstream genes and effects.
See Support Protocol 2 for details.
7. To find drugs and diseases associated with VKORC1, click on the Curated Publications tab to see the manually curated literature information. Under the Details
column, click on View to see the evidence of relationship between the drug (warfarin)
and gene (VKORC1).
8. Click on warfarin under the Drug column in the Related Drugs from Literature
section to bring up the drug page for warfarin, where the detailed pharmacology,
mechanism of action, and therapeutic use of the drug are listed in the detail section
of the page.
Both the drug page and disease page follow a design similar to the gene page.
9. Click on Atrial Fibrillation under the Disease column in the Related Diseases from
Literature section to see the disease page for Atrial Fibrillation.
10. To download genotype and phenotype data related to VKORC1, click on
Downloads/Cross-references tab on the gene page.
All individualized primary data at PharmGKB are available for download by registered
users. For bulk download of some, or all, of the data in PharmGKB for further analysis,
please use our SOAP-based Web services (See Support Protocol 4 for details).
Cheminformatics
14.7.5
Current Protocols in Bioinformatics
Supplement 23
11. Under the Downloads/Cross-references tab, click on links to go to external databases
where additional information on the VKORC1 gene may be found.
PharmGKB has established bidirectional links with leading gene, protein, and drug
resources, such as NCBI Entrez Gene (Maglott et al., 2007), GeneCards (Safran et al.,
2002), UniProtKB (Wu et al., 2006), and DrugBank (Wishart et al., 2006). We also provide
links from the gene page to Online Mendelian Inheritance in Man (OMIM; Hamosh,
et al., 2005), the Genome Data Base (GDB; Letovsky et al., 1998), NCBI RefSeq sequences
(Pruitt et al., 2007), and their associated Gene Ontology annotations (Harris et al., 2004).
In the Common Searches section immediately below the Cross-references, users can check
to see if their gene of interest is part of any pathway documented within public pathway
databases, such as the Kyoto Encyclopedia of Genes and Genomes (KEGG; Kanehisa
et al., 2004), BioCarta (http://www.biocarta.com), or Reactome (UNIT 8.7; Joshi-Tope
et al., 2005).
SUPPORT
PROTOCOL 1
ORIENTATION TO THE PharmGKB VARIANT PAGE
The PharmGKB gene variant page contains a variant browser and a variant table. The
variant browser displays all the polymorphisms in the gene of interest documented
within various sources, such as PharmGKB primary data, single-nucleotide polymorphism (SNP) arrays (http://www.illumina.com and http://www.affymetrix.com), NCBI
Single Nucleotide Polymorphism Database (dbSNP; Sherry et al., 2001), and Japanese
Single Nucleotide Polymorphisms Database (jSNP; Hirakawa et al., 2002). The variant
table below the browser lists detailed nonarray genotype data in PharmGKB, such as
their genomic positions, functional annotation for variants of interests, structural view of
the coding variants, polymorphism frequencies, and assay types. Both the variant table
and PharmGKB SNP array data for the gene of interest are available for download at the
bottom of the variant page.
Necessary Resources
Hardware
Computer with an internet connection
Software
Any up-to-date browser will work
Files
No input files required
1. Open the PharmGKB homepage at http://www.pharmgkb.org in a Web browser and
click on the genotyped genes icon in the browse section. This will lead to the page
containing all genes with genotype information listed in alphabetical order.
2. Click on the letter V to go to all genes starting with the letter V. The number 4 to
the right of the letter V indicates the number of genes with variant data starting with
that specific letter.
3. Click on the “[variants]” link to the right of VKORC1 to go to the variant gene page
for VKORC1.
The variant gene page contains a variant browser at the top and a variant table below
(Fig. 14.7.4).
Pharmacogenomics
Knowledge Base
(PharmGKB)
The variant browser gives a graphical representation of gene structure and location of
variants contained within PharmGKB (including those derived from whole genome SNP
arrays). Variants collected from external SNP databases, such as dbSNP and jSNP are also
available through the variant browser, allowing users to easily compare and contrast SNPs
14.7.6
Supplement 23
Current Protocols in Bioinformatics
Figure 14.7.4 Example of PharmGKB Variant Gene Page (VKORC1) with variant browser on the top and
variant table below.
from different resources and identify regions that have a high density of polymorphisms.
Each tick on the browser represents a variant from the respective resource. The gene
features are also color-coded to differentiate exons, introns, promoters, and untranslated
regions (UTRs). By using the magnification and move tools below the browser, the user
can move or zoom into the specific region of interest for a gene.
4. Scroll down the variant page to locate the variant table below the browser to see
PharmGKB nonarray variants and their genomic positions, functional annotations,
frequencies, and assay types.
Clicking on the link under the GP Position column will open the UCSC Genome Browser
(UNIT 1.4; Kuhn et al., 2007) in another window. Clicking on the link under the “dbSNP
Id” column will open the dbSNP entry that corresponds to the variant in another window
(UNIT 1.3). The entries in the Feature and Amino Acid Translation columns are derived
from the default reference sequence from NCBI for the specific gene.
5. Click on the G/A variant (at GP position chr16:31009822) in the variant column. This
will display the variant report that includes the reference sequence for the specific
variant.
6. Click on the “stars” under the Variants of Interest Curation Level column to see the
brief functional summary for the variants and their literature support evidence.
Cheminformatics
14.7.7
Current Protocols in Bioinformatics
Supplement 23
Stars are used to indicate the level of annotation applied to the variants: 1 star for
noncurated annotations, 2 stars for curated annotations, and 3 stars for in-depth annotations. Note that noncurated variant information is accumulated solely by computational
methods and has not been verified by the scientific staff at PharmGKB.
7. Click on the Expand Variants View button, below the variant browser, to see the
full variant table containing more in-depth information collected for the variants,
such as frequencies and assay types. Click on the link in the Frequency column
(e.g., “58.97%/41.03%” at GP Position chr16:31009822) to see a breakdown of the
frequency across all variants reported by racial categories.
The value in the Frequency column is calculated by aggregating all variants reported at
that Golden Path position. Clicking on the value will allow the user to drill down further
for frequency data by race or ethnicity. The entry in the Number of Chromosomes column
is typically twice the number of subjects that were in the submitted sample set. Each
variant is also annotated with the detailed genotyping assay performed on that variant
in the Assay Types column.The Phi link () in the Flags column indicates that phenotype
data was collected on subjects genotyped for that Golden Path position.
8. Click on the View link under the Data column in the full variant table to see subject genotype data reported at the specific position. (Individual level genotype data
requires user registration).
9. Scroll down to the bottom of the variant page to export the variant table in
CVS/Excel/XML formats, along with any SNP array data from PharmGKB, for
the gene of interest.
SUPPORT
PROTOCOL 2
ORIENTATION TO THE PharmGKB PATHWAY PAGES
The interactive drug-centered pathways displayed in PharmGKB provide an overview of
how genes are involved in the pharmacokinetics (PK) and pharmacodynamics (PD) of
drugs. The pathway diagrams use standard shapes and colors to represent genes, metabolites, drugs, and interactions. All genes and drugs on the pathway diagram are clickable. If
the user clicks on these objects, the PharmGKB gene or drug page opens in a new browser
window. Below the pathway picture is a description of the pathway that describes the complex gene-drug relationships depicted in the pathway diagram. The pathway authors and
the date of the most recent update are listed below the text of the description on the bottom
of the pathway diagram. There is a section of useful links and downloads to the right of the
pathway picture. At the top right, there is a link to return to the list of pathways. If PharmGKB has both PK and PD pathways for a given drug, the user will see a box with a dropdown menu, allowing them to toggle between the PK and PD pathways. Also listed are
links to related drugs, genes, and pathways that have been selected by the authors as being
of potential interest to the user. Finally, on the lower right of the pathway page, there are
download links for the evidence spreadsheet and the pathway image. The evidence spreadsheet describes each interaction depicted on the pathway, and it includes at least one peerreviewed article with their PubMed reference identifier in support of each interaction.
Necessary Resources
Hardware
Computer with an internet connection
Software
Any up-to-date browser will work
Pharmacogenomics
Knowledge Base
(PharmGKB)
Files
No input files required
14.7.8
Supplement 23
Current Protocols in Bioinformatics
Figure 14.7.5 Example of PharmGKB pathway (Irinotecan pathway). For color version of this
figure see http://www.currentprotocols.com.
1. Open the PharmGKB homepage at http://www.pharmgkb.org in a Web browser and
click on the pathway icon to access the list of pathways on PharmGKB. Pathways
can also be accessed by clicking on the Search tab, then on Pathways.
2. Jump to page 2 of the pathway list and click on the Irinotecan Pathway link to go to
Irinotecan Pathway (Fig. 14.7.5).
The Irinotecan Pathway shows the pharmacokinetic (PK) process of the chemotherapy
drug irinotecan. Genes involved in biotransformation and transport of irinotecan are
highlighted in this PK pathway. A pathway that describes the pharmacodynamic (PD)
aspect of irinotecan is also available on PharmGKB titled Irinotecan Pathway (Cancer).
How irinotecan acts on its target topoisomerase I (TOP1) in the cancer cell is illustrated
in this PD pathway.
3. Click on the Legend link on the top-left corner of the pathway diagram to display
the standard shapes used to designate the different objects in the pathway.
4. Click on the ABCC1 oval to go to the ABCC1 gene page.
5. Clicking on “irinotecan” will open a pop-up window of the drug page for irinotecan.
Click on metabolite SN38 to open a pop-up window that shows the chemical conversion from irinotecan to SN38, it also includes a link to the original article describing
the conversion, as well as a link back to the irinotecan drug page.
Cheminformatics
14.7.9
Current Protocols in Bioinformatics
Supplement 23
6. Click on the golden arrow between two objects (SN38 ↔ SN38G) to see a link to
the primary data, titled Irinotecan Clinical Data, that support the relationship. This
pop-up window also provides a link to the original article describing the influence
of UGT1A1 genotype on the rate of glucuronidation of SN38 (PMID:12464801).
7. Click on the pull-down menu in the upper right-hand corner of the pathway page to
select an alternative view of the pathway (liver or cancer for Irinotecan pathway, PK
or PD in many other pathways).
8. Click on the Illustrator file to download the pathway image in PDF format.
The original pathway diagram is drawn using Adobe Illustrator. A PDF version of the
pathway is available for download to users.
9. Click on Supporting Evidence to download the evidence spreadsheet containing
detailed literature support evidence for each step of the pathway.
SUPPORT
PROTOCOL 3
ORIENTATION TO THE VIP GENE PAGE
Very Important Pharmacogenes (VIPs) are structured summaries containing key information for genes that are important for pharmacokinetic or pharmacodynamic effects of
drugs. These in-depth annotated summaries include information on important variants of
the gene, mapping information, haplotypes, population frequencies, phenotypes, and interacting drugs. Supporting key PubMed references are included in each gene summary.
These annotations are manually curated.
Necessary Resources
Hardware
Computer with an internet connection
Software
Any up-to-date browser will work
Files
No input files required
1. Open the PharmGKB homepage at http://www.pharmgkb.org in a Web browser and
click the VIP gene icon. This will lead to the page for all VIPs within PharmGKB,
in alphabetical order.
2. Click on View under the VIP Page column to go to the ABCB1 VIP gene summary.
VIP pages can also be accessed from a gene page by clicking on the VIP tab.
On the ABCB1 VIP main page, one can find the gene name/symbol, summary, key PubMed
IDs, associated pathways and drugs, and important haplotype information (Fig. 14.7.6).
Pharmacogenomics
Knowledge Base
(PharmGKB)
The VIP gene page itself is constructed from a standard template. The list of contributors to
the pathway is provided at the top, followed by links to any important variants, haplotypes,
or splice variants that are associated with that gene. Below this information is the VIP
summary. Included with every VIP summary are the HGNC gene name, common names or
synonyms that frequently appear in the literature for this gene, an introductory paragraph,
and key PubMed ID numbers that are associated with the information in the introductory
paragraph. If applicable, the VIP page also contains links to PharmGKB pages for the
drugs that this gene interacts with, the PharmGKB pathways that the gene appears in,
and any phenotypes or diseases for which information is available. At the bottom of the
main VIP page, there are links to the important variants, haplotypes, or splice variants
that are associated with this gene. In order for a gene to qualify as a VIP gene candidate,
it must have at least one variant of pharmacogenomic significance.
14.7.10
Supplement 23
Current Protocols in Bioinformatics
Figure 14.7.6
Example of VIP gene page (ABCB1).
3. Click on the Important Variants link on the top left-hand corner of the VIP gene page
to go to the page with detailed information on important variants, external references,
and their impact on drug responses (Fig. 14.7.7).
The VIP variant page is structured similarly to the main VIP page. The top of the VIP
variant page contains the list of authors and links back to the main VIP summary, as well
as any important haplotypes associated with this gene. Following below is a list showing
how many important variants there are for each gene (e.g., there are three important
variants for ABCB1). Each important variant has its own entry. This entry contains the
HGNC name for the gene, a variant summary that is specific to that particular variant
(in contrast to the general summary on the VIP gene page), key PubMed IDs that are
associated with the variant summary, complete mapping information for the variants, links
to relevant PharmGKB pages for the drugs, and links to phenotype datasets for the gene.
The mapping information includes genomic position and accession number, a dbSNP
unique identifier (number starts with rs), and its Golden Path position. If applicable, an
mRNA and protein position and accession number are also provided. Variant pages may
also contain allele frequency tables that list a brief description of the population that has
been studied, the number of subjects in that population, the allele frequency of the variant
in question, and a link with the PMID number that opens a new browser window with that
PubMed abstract. If the variant is part of a haplotype, then there is also a link included
at the bottom of the page linking the user to the haplotype that contains the variant.
Cheminformatics
14.7.11
Current Protocols in Bioinformatics
Supplement 23
Figure 14.7.7
Example of important variant page for VIP genes (ABCB1).
4. Click on the Important Haplotype link on the top left-hand corner of the VIP page.
This will bring you to a page containing detailed information on known haplotypes
for gene of interest, related SNPs, and associated phenotype data files, and their
impact on drug responses.
Haplotype pages are similar to the variant pages, and contain much of the same information. The differences are that there is no mapping information for haplotypes, and these
pages also describe how many SNPs contribute to the formation of these haplotypes. A
haplotype may be defined by only one SNP, as is the case with many of the CYP haplotypes.
In this case, information on the haplotype page may be duplicated on the variant page
and vice versa. A separate variant page for any CYP haplotype is included so that the
mapping information for that position can also be incorporated. A haplotype page also
contains a definitive publication or link to an external Web site, which will take the user
to the source that was used to name the haplotype.
SUPPORT
PROTOCOL 4
ORIENTATION TO PharmGKB WEB SERVICES
PharmGKB Web services enable our users to download a selected subset of data
from PharmGKB via a Simple Object Access Protocol (SOAP) interface. Application
programming interface (API) documentation and sample codes are available for any
user who wishes to access portions of the database at http://www.pharmgkb.org/home/
projects/webservices/index.jsp.
Necessary Resources
Pharmacogenomics
Knowledge Base
(PharmGKB)
Hardware
Computer with an internet connection
14.7.12
Supplement 23
Current Protocols in Bioinformatics
Software
A user may create a Web services client program in any language of choice.
PharmGKB provides Perl and Python clients to access Web services; detailed
documentation is available at http://www.pharmgkb.org/home/projects/
webservices/index.jsp.
Files
Sample codes (Perl and Python) are available for download to access genes, drugs,
diseases, and variants using PharmGKB accession numbers. Documentation is
found at http://www.pharmgkb.org/home/projects/webservices/README-perl.
txt or, http://www.pharmgkb.org/home/projects/webservices/README-python.
txt
1. To use the Perl scripts, download and install the SOAP::lite module from http://
soaplite.com/ or http://sourceforge.net/projects/soaplite (available from CPAN)
API documentation: http://cpan.uwinnipeg.ca/htdocs/SOAP-Lite/SOAP/Lite.html
% cpan
cpan> install MIME::Parser
cpan> install SOAP::Lite
2. Alternatively, if the user is more familiar with writing or running Python scripts,
download and install SOAPpy from:
http://sourceforge.net/project/showfiles.php?group id = 26590
in addition to the python module “fpconst” available from:
http://cheeseshop.python.org/packages/source/f/fpconst/fpconst-0.7.2.tar.gz
% cd fpconst-0.7.2
% python setup.py install
Table 14.7.2 Codes for Use with specialSearch.pl
Code Data Type
0
Genes with pharmacokinetic (PK) significance
1
Genes with pharmacodynamic (PD) significance
2
Genes with PharmGKB variant data
3
Genes with PK variants
4
Genes with PD variants
5
Drugs with supporting information
6
Diseases with supporting information
7
Phenotype datasets
8
Pathways with PGx significance
9
Annotated publications describing relationships between genes, drugs, and diseases
10
Literature annotations, pathways, and phenotype datasets annotated with a
pharmacokinetics (PK) COE
11
Literature annotations, pathways, and phenotype datasets annotated with a
pharmacodynamics (PD) COE
12
Literature annotations and phenotype datasets annotated with a clinical outcome (CO)
COE
Cheminformatics
14.7.13
Current Protocols in Bioinformatics
Supplement 23
Then, install the SOAPpy module itself
% cd SOAPpy-0.12.0
% python setup.py install
3. If Perl client is used, simple client programs are available to access. Web services on
PharmGKB (see https://www.pharmgkb.org/home/projects/webservices/READMEperl.txt for details). For example, users can use specialSearch.pl
<searchType(integer)> to access various types of data from PharmGKB
(refer to Table 14.7.2 for special codes for searchTypes). Typing % perl
specialSearch.pl O will output all genes with pharmacokinetic relevance
at PharmGKB.
COMMENTARY
Background Information
Pharmacogenomics
Knowledge Base
(PharmGKB)
PharmGKB began as the central data repository for the Pharmacogenetics Research Network (PGRN) and scientific community at
large in 2000 (Giacomini et al., 2007; Long,
2007). It is designed to be a publicly available knowledge base with scientifically documented information connecting phenotypes
to genotypes. Over the past 8 years of development (funded by NIH), PharmGKB has
grown to be an integrated resource that provides data on variants in genes, their relationship to drug response phenotype, the phenotype data, and curated knowledge in the
forms of drug centered pathways, pharmacogene summaries (VIPs), and literature annotations (Hodge et al., 2007). PharmGKB
currently houses variant data associated with
>600 genes, >2000 manually curated literature annotations, 52 drug-centered pathways,
and 27 VIP gene summaries. Our comprehensive content makes it easier and faster for our
users to access key pharmacogenomic information without repeating searches in multiple
databases.
PharmGKB primary data comprises
both genotype data and phenotype data.
Initially, the data depository was seeded by
data from the PGRN and mainly focused
on a handful of genes at a time. With the
rapid advancement and widespread use of
high-throughput technology to measure gene
variation and gene expression, the field of
pharmacogenomics has evolved to explore
a much larger set of genes, up to the whole
genome. This also includes how variations in
these larger gene sets work in concert to affect
drug response. PharmGKB has expanded
its capacity to accommodate large-scale
high-throughput data, which may involve a
large number of samples assayed across the
entire genome. SNP array data can now be
viewed and downloaded from the PharmGKB.
PharmGKB also houses large data submissions from beyond PGRN. In 2006, Applied
Biosystems posted genotype data for >220
drug response genes from four human populations (i.e., Caucasian, African American,
Chinese, and Japanese) on PharmGKB. Allele
frequencies for each of these populations were
calculated and are available from the variant
frequency report. PharmGKB is also the
central repository for the International Warfarin Pharmacogenetics Consortium (IWPC;
http://www.pharmgkb.org/views/project.jsp?
pId = 56). The goal of this consortium
is to create a merged international dataset
(including >5700 patients) in order to develop
the best strategy for predicting the therapeutic
dose of warfarin.
In addition to our data mission, PharmGKB is curating pharmacogenomic knowledge, including summarizing drug-centered
pathways, annotating very important pharmacogenes (VIPs) and primary literature. Unlike other pathway resources—e.g., KEGG
(UNIT 1.12), Reactome (UNIT 8.7), Biocarta,
GenMAPP (UNIT 7.5)—that primarily focus
on physiological processes, PharmGKB is the
only resource that focuses on drug-centered
pathways, particularly pharmacokinetic (PK)
pathways. This effort is valuable to the scientific community as our pathways enable researchers to conduct in-depth analysis of various forms of experimental data within the
framework of curated drug response pathways.
Our pharmacokinetics (PK) pathways describe
candidate genes involved in the absorption,
distribution, metabolism, and excretion of a
given drug, while the pharmacodynamic (PD)
pathways illustrate the physiological effects
of the drug, its mechanism of action, and possible side effects. Currently, there are 39 interactive drug-centered pathways created in
collaboration with experts in the pharmacogenomic area. PharmGKB pathways have been
14.7.14
Supplement 23
Current Protocols in Bioinformatics
widely quoted by the scientific community for
their unique content (Mangravite et al., 2006;
Scripture and Figg, 2006). The VIP gene summaries are another unique knowledge-rich feature provided by PharmGKB for key genes
that are involved in modulating drug response.
Each VIP summary is constructed using a
structured template and includes detailed information about a given gene, including its
important polymorphisms, haplotypes, phenotypes, and complete mapping information.
An allele frequency table may also be included if the specific variant is studied extensively in different populations. VIP summaries
are encyclopedia-like encapsulations for genes
that require tremendous amounts of manual
curation. They can potentially save scientists
countless hours of time in their own literature
mining process, which can be tedious, repetitive, and time consuming. To keep our pathways and VIPs current, PharmGKB updates
them every 2 years to incorporate any new
interactions or correct any erroneous information that is being displayed.
PharmGKB provides a wealth of information to facilitate the design of a pharmacogenetics study, such as identifying genetic markers for a patient’s response to a therapeutic
agent. A scientist designing the study can use
PharmGKB in the following manner to pick
the best candidates genes and variants from
our integrated knowledge base.
Identify candidate genes important for
pharmacokinetics or pharmacodynamics of
the drug used in the study
If the pathway for the specific drug is
available through PharmGKB, this is the best
place to start looking for the candidate genes.
The genes on our drug-centered pathway are
known to be involved in the disposition or
mechanism of action of the drug, and the user
can click on each gene in the pathway to delve
down to the detailed variant information associated with that gene. If no pathway is currently available for the drug of interest, the
scientist can first perform a search for the drug
in PharmGKB, open the drug page, and then go
to the section on Related Genes From Literature to find candidate genes that are implicated
in drug response, as well as their literature evidence to decide on which genes to choose for
the study.
Find functional variants for the candidate
genes chosen
If there is a PharmGKB VIP page available for the gene, the VIP will identify the
important variants and haplotypes for the gene
of interest. Alternatively, the scientist can go
to the PharmGKB variant page and browse
through the variant table, which lists all the
variants for the gene, their genomic position,
functional role, frequency, and assay type.
SNPs that reside in the exon or promoter
regions of the gene, and SNPs that lead to
changed amino acid composition, inactive protein, or changed expression of the gene are
good candidates to be included for the study.
Annotations for variants that have been studied for phenotypic consequences are tagged
with the star system as discussed in Support
Protocol 1.
Determine if the population frequencies for
the chosen variants are desirable
This step will further screen out SNPs that
may be too rare in the population that will
be included in the study. The frequency information can be found in the frequency column
on the PharmGKB variant table. Clicking on
the frequency value displays the breakdown of
frequencies by racial categories.
Find assay and primer information for the
chosen variants
Clicking on the nucleotide changes in the
Variant column of the PharmGKB variant table will allow the user to find information such
as assay methods and primers. For instance, if
the Taqman assay was used to genotype a specific drug metabolizing enzyme variant, PharmGKB provides a direct link to ordering information at Applied Biosystems to help the user
identify the material required for the study. By
iterating through these steps, a scientist can
compile a short list of candidate genes and
SNPs that can be used in a study to identify
genetic markers that might explain and predict
the efficacy and adverse effect profiles of the
drug of interest.
Pharmacogenomics is a rapidly evolving
field with many unmet challenges in translating the scientific findings in pharmacogenomics to clinical practice. However, the
increasing understanding of how a person’s
genetic makeup can influence his or her response to drugs provides the opportunity to
improve the drug development process and
provide more effective and safer therapies for
individual patients. PharmGKB will continue
its efforts to aggregate, integrate, and annotate the latest findings in pharmacogenomic
research, and provide tools and context to catalyze scientific discoveries.
Cheminformatics
14.7.15
Current Protocols in Bioinformatics
Supplement 23
Critical Parameters and
Troubleshooting
PharmGKB is designed to be a valuable
resource for both expert researchers in the
pharmacogenomics field, as well as for novice
users and the general public. PharmGKB’s
homepage prominently displays the information that our users are looking for most frequently with a distinct icon system to represent different data types and knowledge. Typical searches conducted at PharmGKB are for
information about drugs, genes, diseases, and
pathways. Searches can be conducted using
the Web-search engine-like search box. If too
many search results are returned, users can narrow the search with more specific terms. Alternatively, a user can use our Search tab and
simple query to limit the domain of the search
to a specific area of interests (e.g., genes with
genotype data; the relevant literature on drug
X; diseases with PharmGKB primary data). If
the user encounters difficulties in finding information of interest, using alternative names,
partial names, or a loosening of the search criteria is suggested. Alternatively, if nothing is
returned under the “database search” tab, the
user should look for results under the Web site
Search tab as PharmGKB has full-text indexing to allow users to search across the entire
Web site.
We welcome all feedback regarding the
PharmGKB. Questions and concerns can be
sent to [email protected]. Our scientific staff will respond to your inquiry within
48 hr.
Acknowledgements
PharmGKB is supported by the
NIH/NIGMS Pharmacogenetics Research
Network (PGRN; UO1GM61374). The
authors thank the entire PharmGKB team
(https://www.pharmgkb.org/home/team.jsp)
that has contributed to the development of
PharmGKB.
Literature Cited
Eyre, T.A., Ducluzeau, F., Sneddon, T.P., Povey,
S., Bruford, E.A., and Lush, M.J. 2006. The
HUGO Gene Nomenclature Database, 2006 updates. Nucleic Acids Res. 34:D319-D321.
Pharmacogenomics
Knowledge Base
(PharmGKB)
Giacomini, K.M., Brett, C.M., Altman, R.B.,
Benowitz, N.L., Dolan, M.E., Flockhart, D.A.,
Johnson, J.A., Hayes, D.F., Klein, T., Krauss,
R.M., Kroetz, D.L., McLeod, H.L., Nguyen,
A.T., Ratain, M.J., Relling, M.V., Reus, V.,
Roden, D.M., Schaefer, C.A., Shuldiner, A.R.,
Skaar, T., Tantisira, K., Tyndale, R.F., Wang, L.,
Weinshilboum, R.M., Weiss, S.T., and Zineh, I.
2007. The pharmacogenetics research network:
From SNP discovery to clinical drug response.
Clin. Pharmacol. Ther. 81:328-345.
Hamosh, A., Scott, A.F., Amberger, J.S., Bocchini, C.A., and McKusick, V.A. 2005. Online Mendelian Inheritance in Man (OMIM), a
knowledgebase of human genes and genetic disorders. Nucleic Acids Res. 33:D514-D517.
Harris, M.A., Clark, J., Ireland, A., Lomax, J.,
Ashburner, M., Foulger, R., Eilbeck, K., Lewis,
S., Marshall, B., Mungall, C., Richter, J., Rubin,
G.M., Blake, J.A., Bult, C., Dolan, M., Drabkin,
H., Eppig, J.T., Hill, D.P., Ni, L., Ringwald,
M., Balakrishnan, R., Cherry, J.M., Christie,
K.R., Costanzo, M.C., Dwight, S.S., Engel, S.,
Fisk, D.G., Hirschman, J.E., Hong, E.L., Nash,
R.S., Sethuraman, A., Theesfeld, C.L., Botstein,
D., Dolinski, K., Feierbach, B., Berardini, T.,
Mundodi, S., Rhee, S.Y., Apweiler, R., Barrell,
D., Camon, E., Dimmer, E., Lee, V., Chisholm,
R., Gaudet, P., Kibbe, W., Kishore, R., Schwarz,
E.M., Sternberg, P., Gwinn, M., Hannick, L.,
Wortman, J., Berriman, M., Wood, V., de la
Cruz, N., Tonellato, P., Jaiswal, P., Seigfried,
T., and White, R. 2004. The Gene Ontology
(GO) database and informatics resource. Nucleic
Acids Res. 32:D258-D261.
Hirakawa, M., Tanaka, T., Hashimoto, Y., Kuroda,
M., Takagi, T., and Nakamura, Y. 2002. JSNP:
A database of common gene variations in the
Japanese population. Nucleic Acids Res. 30:158162.
Hodge, A.E., Altman, R.B., and Klein, T.E.
2007. The PharmGKB: Integration, aggregation,
and annotation of pharmacogenomic data and
knowledge. Clin. Pharmacol. Ther. 81:21-24.
Joshi-Tope, G., Gillespie, M., Vastrik, I.,
D’Eustachio, P., Schmidt, E., de Bono, B.,
Jassal, B., Gopinath, G.R., Wu, G.R., Matthews,
L., Lewis, S., Birney, E., and Stein, L. 2005. Reactome: A knowledgebase of biological pathways. Nucleic Acids Res. 33:D428-D432.
Kanehisa, M., Goto, S., Kawashima, S., Okuno,
Y., and Hattori, M. 2004. The KEGG resource
for deciphering the genome. Nucleic Acids Res.
32:D277-D280.
Klein, T.E. and Altman, R.B. 2004. PharmGKB:
The pharmacogenetics and pharmacogenomics
knowledge base. Pharmacogenomics J. 4:1.
Kuhn, R.M., Karolchik, D., Zweig, A.S., Trumbower, H., Thomas, D.J., Thakkapallayil, A.,
Sugnet, C.W., Stanke, M., Smith, K.E., Siepel, A., Rosenbloom, K.R., Rhead, B., Raney,
B.J., Pohl, A., Pedersen, J.S., Hsu, F., Hinrichs,
A.S., Harte, R.A., Diekhans, M., Clawson, H.,
Bejerano, G., Barber, G.P., Baertsch, R., Haussler, D., and Kent, W.J. 2007. The UCSC
genome browser database: Update 2007. Nucleic Acids Res 35:D668-D673.
Letovsky, S.I., Cottingham, R.W., Porter, C.J., and
Li, P.W. 1998. GDB: The Human Genome
Database. Nucleic Acids Res. 26:94-99.
Long, R.M. 2007. Planning for a national effort to
enable and accelerate discoveries in pharmacogenetics: The NIH Pharmacogenetics Research
Network. Clin. Pharmacol. Ther. 81:450-454.
14.7.16
Supplement 23
Current Protocols in Bioinformatics
Maglott, D., Ostell, J., Pruitt, K.D., and Tatusova, T.
2007. Entrez Gene: Gene-centered information
at NCBI. Nucleic Acids Res. 35:D26-D31.
Mangravite, L.M., Thorn, C.F., and Krauss, R.M.
2006. Clinical implications of pharmacogenomics of statin treatment. Pharmacogenomics
J. 6:360-374.
Pruitt, K.D., Tatusova, T., and Maglott, D.R. 2007.
NCBI reference sequences (RefSeq): A curated
non-redundant sequence database of genomes,
transcripts and proteins. Nucleic Acids Res.
35:D61-D65.
Safran, M., Solomon, I., Shmueli, O., Lapidot,
M., Shen-Orr, S., Adato, A., Ben-Dor, U.,
Esterman, N., Rosen, N., Peter, I., Olender,
T., Chalifa-Caspi, V., and Lancet, D. 2002.
GeneCards 2002: Towards a complete, objectoriented, human gene compendium. Bioinformatics 18:1542-1543.
Sherry, S.T., Ward, M.H., Kholodov, M., Baker,
J., Phan, L., Smigielski, E.M., and Sirotkin, K.
2001. dbSNP: The NCBI database of genetic
variation. Nucleic Acids Res. 29:308-311.
Wishart, D.S., Knox, C., Guo, A.C., Shrivastava,
S., Hassanali, M., Stothard, P., Chang, Z., and
Woolsey, J. 2006. DrugBank: A comprehensive
resource for in silico drug discovery and exploration. Nucleic Acids Res. 34:D668-D672.
Wu, C.H., Apweiler, R., Bairoch, A., Natale,
D.A., Barker, W.C., Boeckmann, B., Ferro, S.,
Gasteiger, E., Huang, H., Lopez, R., Magrane,
M., Martin, M.J., Mazumder, R., O’Donovan,
C., Redaschi, N., and Suzek, B. 2006. The Universal Protein Resource (UniProt): An expanding universe of protein information. Nucleic
Acids Res. 34:D187-D191.
Scripture, C.D. and Figg, W.D. 2006. Drug interactions in cancer therapy. Nature Rev. 6:546558.
Cheminformatics
14.7.17
Current Protocols in Bioinformatics
Supplement 23
Exploring Human Metabolites Using the
Human Metabolome Database
UNIT 14.8
Ian J. Forsythe1 and David S. Wishart2
1
Genome Alberta, Department of Computing Science, University of Alberta, Edmonton,
Alberta, Canada
2
Departments of Computing Science and Biological Sciences, University of Alberta, and
The National Institute of Nanotechnology (NINT), National Research Council, Edmonton,
Alberta, Canada
ABSTRACT
The Human Metabolome Database (HMDB) is a Web-based bioinformatic/cheminformatic resource with detailed information about human metabolites and metabolic
enzymes. It can be used for fields of study including metabolomics, biochemistry, clinical
chemistry, biomarker discovery, medicine, nutrition, and general education. In addition to
its comprehensive literature-derived data, the HMDB contains an extensive collection of
experimental metabolite concentration data for plasma, urine, CSF, and/or other biofluids The HMDB is fully searchable, with many tools for viewing, sorting and extracting
metabolite names, chemical structures, biofluid concentrations, enzymes, genes, NMR
or MS spectra, and disease information. Each metabolite entry in the HMDB contains
an average of 90 separate data fields including a comprehensive compound description,
names and synonyms, chemical structure information, physico-chemical data, reference
NMR and MS spectra, normal and abnormal biofluid concentrations, tissue locations,
disease associations, pathway information, enzyme data, gene sequence data, and SNP
and mutation data, as well as extensive links to images, references and other public
C 2009 by John Wiley & Sons,
databases. Curr. Protoc. Bioinform. 25:14.8.1-14.8.45. Inc.
Keywords: Database r metabolomics r bioinformatics r cheminformatics r
biochemistry r genomics r proteomics r systems biology r pathways r spectra
INTRODUCTION
The Human Metabolome Database (HMDB) is a unique Web-based bioinformatic/
cheminformatic resource with detailed information about human metabolites and the
enzymes that metabolize them. It is designed to be used for a variety of applications
and fields of study including metabolomics, biochemistry, clinical chemistry, biomarker
discovery, medicine, nutrition, and general education. The HMDB currently contains
more than 2900 human metabolite entries that are linked to more than 28,000 different synonyms. These metabolites are further connected to some 77 nonredundant
pathways, 3364 distinct enzymes, 103,000 SNPs, and 862 metabolic diseases (genetic
and acquired). Much of this information was gathered manually or semi-automatically
from thousands of books, journal articles, and electronic databases. In addition to its
comprehensive literature-derived data, the HMDB contains an extensive collection of
experimental metabolite concentration data for plasma, urine, CSF, and/or other biofluids for more than 960 compounds. The HMDB also has about 570 compounds for which
experimentally acquired “reference” 1 H and 13 C NMR and MS/MS spectra have been
collected.
The HMDB is fully searchable, with many built-in tools for viewing, sorting and extracting metabolite names, chemical structures, biofluid concentrations, enzymes, genes,
Cheminformatics
Current Protocols in Bioinformatics 14.8.1-14.8.45, March 2009
Published online March 2009 in Wiley Interscience (www.interscience.wiley.com).
DOI: 10.1002/0471250953.bi1408s25
C 2009 John Wiley & Sons, Inc.
Copyright 14.8.1
Supplement 25
NMR or MS spectra, and disease information. Each metabolite entry (called a “MetaboCard”) in the HMDB contains an average of 90 separate data fields including a comprehensive compound description, names and synonyms, chemical structure information,
physico-chemical data, reference NMR and MS spectra, normal and abnormal biofluid
concentrations, tissue locations, disease associations, pathway information, enzyme data,
gene sequence data, and SNP and mutation data, as well as extensive links to images,
references and other public databases including the Kyoto Encyclopedia of Genes and
Genomes (KEGG; UNIT 1.12; Kanehisa et al., 2004), PubChem (Wheeler et al., 2005),
Chemical Entities of Biological Interest (ChEBI; Brooksbank et al., 2005), MetaCyc
(UNIT 1.17; Krummenacker et al., 2005), Protein Data Bank (PDB; UNITS 1.9 & 14.3), SwissProt (Bairoch et al., 2005), and GenBank (Wheeler et al., 2005). In this unit, readers will
be shown how to effectively navigate through and retrieve data from the HMDB Web
site (Basic Protocol 1), how to perform chemical structure similarity searches (Basic
Protocol 2), and how to identify metabolites via spectral matching (Basic Protocol 3).
Basic Protocols 2 and 3 take advantage of the HMDB’s extensive collections of chemical
structures and spectra (NMR, MS, and GC-MS), respectively.
BASIC
PROTOCOL 1
NAVIGATING THE HUMAN METABOLOME DATABASE WEB SITE
The Human Metabolome Database (HMDB) can be accessed at: http://www.hmdb.ca/.
It is compatible with most up-to-date Web browsers as long as they are equipped with
a Java interpreter. The HMDB Web site is navigated using hyperlinked menus or text.
The appearance and functionality of the HMDB Web site should be the same regardless
of the user’s browser or operating system. On the home page, and nearly every page of
the HMDB Web site, there is a menu bar located at the top of the page. This menu bar
contains hyperlinks that allow the user to navigate between specific display or search
pages within the Web site. For most searches, text is typed or pasted into standard text
boxes and the search function is launched by clicking the mouse pointer on a Search or
Submit button. The home page provides a text search box as well as an overview of the
database and some of its key features. This protocol describes in detail how to find, view,
interpret, and retrieve data from the HMDB Web site.
Necessary Resources
Hardware
Computer with Internet access
Software
An up-to-date Web browser, such as Internet Explorer
(http://www.microsoft.com/ie/), Firefox (http://www.mozilla.com/), Netscape
(http://browser.netscape.com/), Opera (http://www.opera.com/), or Safari
(http://www.apple.com/safari/). The Web browser must be capable of handling
Java applets (i.e., equipped with a recent version of the Java interpreter).
Files
None
Standard MetaboCard Overview
1. With your preferred Web browser, visit the Human Metabolome Database (HMDB)
Web site at http://hmdb.ca/.
Exploring Human
Metabolites Using
the Human
Metabolome
Database
The HMDB home page (Fig. 14.8.1) has a light gray menu bar located near the top of
the page with fourteen clickable links: Home, Browse, Biofluids, Tissues, ChemQuery,
TextQuery, SeqSearch, DataExtractor, MS/MS Search, MS Search, GC/MS Search, NMR
Search, Download, and Explain. The menu bar allows the user to easily navigate the
HMDB’s browsing and search utilities. Below the menu bar is a text box next to which
14.8.2
Supplement 25
Current Protocols in Bioinformatics
Figure 14.8.1 A screen shot of the HMDB home page. At the top of the page is a menu bar (light gray) with
fourteen clickable menu choices (in black). This menu bar allows users to take advantage of the HMDB’s rich
selection of browsing and searching utilities. Below the menu bar, information about how to use, contact, and
reference the HMDB are provided.
appear the words “Search HMDB for:”. This text search utility is prominently displayed
near the top of nearly every HMDB Web page and allows the user to search for all
metabolite entries or MetaboCards with matching text. The user can match by three
different criteria: common name, synonyms, all text fields, or any combination of the
three. Below the text search box is a brief description of the HMDB, how to use its
features, and how to reference it.
2. Click in the text search box near the top of the home page to the right of the text
“Search HMDB for:”. Once the cursor appears, type histidine and make sure
that Common Name and Synonyms are checked, but not All Text Fields. Click on the
Search button. Within a few seconds a four-column table should be displayed with all
MetaboCards containing “histidine” within the Common Name and Synonym fields
(Fig. 14.8.2). Column one contains the HMDB accession numbers (hyperlinked)
while column two displays the common names for all matching human metabolites. Columns three and four display the chemical formulas and molecular weights,
respectively.
HMDB text searches are not case-sensitive and support a variety of searches (i.e., complete
words, numbers, multiple words, phrases, and partial words). For example, if the user
searches the HMDB using the query terms hi, his, hist, histid, histidine,
or histidine with the common name and synonyms check boxes checked, the number
of hits varies from 457 using hi to 23 using his, to 19 using hist. However, searching
for the more specific term histidine returns only 12 hits. If the user performs the
same search for histidine with all three checkboxes checked (i.e., common names,
synonyms, and all text fields), the number of hits increases dramatically to 173. In this
latter case, by selecting all fields, the user is searching through most text in the database
Cheminformatics
14.8.3
Current Protocols in Bioinformatics
Supplement 25
Figure 14.8.2 A screen shot showing the HMDB search results for the word histidine. The HMDB
accession numbers on the left side of the table are hyperlinked. Each accession number corresponds to a
human metabolite in the database.
including gene and protein names for metabolic enzymes. It is important to note that the
actual sequence text is not searched. The HMDB’s text search function is performed using
a rapid, index-based query tool called GLIMPSE (Manber and Bigot, 1997). When no
hits are found, the text search engine uses a text similarity function to see if the query
word has some similarity to a known common name or chemical synonym. For instance,
if a user types hystidine, the query engine will return a message with “Sorry, cannot
find what you are looking for. Did you mean Histidine?” The proposed compound name
is also hyperlinked. Clicking on the hyperlink will launch a text search for Histidine.
3. Click on the hyperlinked accession number for 1-Methylhistidine (HMDB00001).
A new window should appear containing the “MetaboCard” for 1-methylhistidine
(Fig. 14.8.3).
Exploring Human
Metabolites Using
the Human
Metabolome
Database
For every metabolite in the Human Metabolome Database, there is one MetaboCard.
This design is analogous to the very successful DrugCards concept used in DrugBank
(Wishart et al., 2006). Each MetaboCard entry contains more than 90 data fields, with
the first half of the information being devoted to chemical and clinical data and the
other half devoted to enzymatic or biochemical data (see Table 14.8.1). The MetaboCard
information is laid out as follows: (1) metabolite nomenclature; (2) chemical/physical
properties; (3) structural data; (4) spectral data; (5) location data (cellular, biofluid,
and tissue); (6) concentration data; (7) associated disorders data; (8) pathway data; (9)
enzyme data; and (10) SNP data for each metabolizing enzyme. If a metabolite has more
than one metabolizing enzyme, the genetic and protein data fields are repeated for each
metabolizing enzyme. In addition to providing comprehensive numeric, sequence, and
textual data, each MetaboCard also contains hyperlinks to other databases, abstracts,
digital images, and interactive applets for viewing molecular structures.
14.8.4
Supplement 25
Current Protocols in Bioinformatics
Figure 14.8.3
A screen shot of the MetaboCard for 1-methylhistidine.
4. To survey the type of information that is displayed in a typical MetaboCard, use
the scroll bar on the right side of your browser’s window to scroll down the
1-methylhistidine MetaboCard page. Basically the MetaboCard consists of two
columns, a left column shaded in gray and a right column shaded in white. The gray
column contains the field names while the white column contains metabolite-specific
information. The upper portion of each MetaboCard provides detailed information
about the names, synonyms, chemical structure, and other physical-chemical information regarding the metabolite. Some of the data fields on the right contain hyperlinks (indicated in light blue text). Scroll down to the PubChem (Wheeler et al., 2005)
Compound or Substance ID fields and click on one of the hyperlinks on the right.
Doing so will open a PubChem Compound or Substance entry for 1-methylhistidine.
(You may have to hit the back button to return to the 1-methylhistidine MetaboCard.)
Click on the METLIN ID hyperlink to open the METLIN (Smith et al., 2005) page
for 1-methlyhistidine. Be sure to hit the Back button to return to the 1-methylhistidine
MetaboCard.
In assembling the chemical and biological information contained in the HMDB, more
than two dozen textbooks, several thousand journal articles, nearly 30 different electronic databases, and at least 20 in-house or Web-based programs were individually
searched, accessed, compared, written, or run over the course of 2 years. The original
team of HMDB contributors and annotators included three organic chemists, six NMR
spectroscopists, five mass spectroscopists, two separation specialists, three physicians,
and fourteen bioinformaticians with dual training in computing science and molecular
biology/chemistry (Wishart et al., 2007). Manual updates of the database are continuing,
although many annotation fields are now being automatically updated and added using
customized text-mining programs.
Cheminformatics
14.8.5
Current Protocols in Bioinformatics
Supplement 25
Table 14.8.1 Summary of the Data Fields or Data Types Found in Each MetaboCarda
Metabolite or compound information
Metabolic enzyme information
Common Name
Enzyme Name
Synonyms
Enzyme Synonyms
Chemical IUPAC Name
Enzyme Protein Sequence
Chemical Structure
Enzyme no. of Residues
Chemical Formula
Enzyme Molecular Weight
Chemical Taxonomy
Enzyme pI
Chemical Source
Enzyme Gene Ontology
Molecular Weight
Enzyme General Function
SMILES String
Enzyme Specific Function
KEGG/BioCyc/BiGG/Wikipedia Links
Enzyme Pathways
METLIN/PubChem/ChEBI Links
Enzyme Reactions
CAS Registry no.
Enzyme Pfam Domains
InChI Identifier
Enzyme Signal Sequences
Synthesis Reference
Enzyme Transmembrane Regions
Melting Point
Enzyme Metabolic Importance
Water Solubility
Enzyme EC Link
Physiological Charge
Enzyme GenBank Protein ID
State
Enzyme SwissProt ID
LogP or Hydrophobicity
Enzyme PDB ID
MSDS Link
Enzyme GeneCards ID
MOL/SDF/PDB Text Files
Enzyme Genatlas ID
MOL/PDB Image Files
Enzyme HGNC ID
NMR/MS Spectra
Enzyme 3D Structure
Cellular/Biofluid/Tissue Locations
Enzyme Cellular Location
Normal/Abnormal Concentrations
Enzyme DNA Sequence
Associated Disorders
Enzyme GenBank ID Gene Link
OMIM/Metagene Links
Enzyme Chromosome Location
Pathway Names
Enzyme Locus
KEGG/SimCell Pathway Images
Enzyme SNPs/Mutations
General References
Enzyme General References
Macromolecular Interacting Partners
Enzyme Metabolite References
a A more complete listing is provided on the HMDB home page.
Exploring Human
Metabolites Using
the Human
Metabolome
Database
5. To view an editable 2-D image of 1-methylhistidine, scroll down to the data field
on the MetaboCard page called MOL File (Image) and click on the hyperlinked
button called View 2D Structure. This launches Advanced Chemistry Development’s (ACD/Labs) ChemSketch Java applet. After a few seconds, an image of
1-methylhistidine should appear in the applet window (Fig. 14.8.4). If it does not, this
likely indicates that your browser lacks the Java Virtual Machine and needs upgrading. To download the necessary Java software, visit http://www.java.com/getjava/.
The ChemSketch applet used to display this image allows the user to interactively
14.8.6
Supplement 25
Current Protocols in Bioinformatics
Figure 14.8.4 A 2-D image of the structure of 1-methylhistidine as displayed using the ChemSketch Java
applet. The image may be manipulated for different display purposes.
alter, view, rotate, or zoom into the structure and to cut/paste the image (or altered
image) into other files.
In addition to structural images of the metabolite, MOL and SDF text files are also
available. MOL and SDF files are standard formats used by chemists to exchange and
render 2-D chemical structure information. These files can be downloaded by the user
and used to display or rerender the structures using higher-end commercial chemistry
software packages like ChemDraw, ChemSketch, or ISIS/Draw.
6. A 3-D structure of 1-methylhistidine can also be viewed by clicking on the hyperlinked button View 3D Structure contained in the PDB File Calculated (Image)
field. This launches the WebMol (Walther, 1997) interactive 3-D viewing applet
(Fig. 14.8.5). The Calculated 3-D structure is generated via CORINA (Sadowski and
Gasteiger, 1993).
CORINA is a rule-based structure generation program that has been shown to generate
very accurate 3-D structures from 2-D chemical sketches. These calculated structures
◦
typically differ from the experimentally determined structures by no more than 0.4 A. The
same WebMol applet that is used to display metabolites in the HMDB can also be used
to display protein structures of the metabolic enzymes. WebMol is a fast, flexible viewing
tool that allows users to rotate, zoom, color, stereoview, measure, label, and selectively
display different parts of a molecule. More information about WebMol and how to use it
can be found at http://www.cmpharm.ucsf.edu/∼walther/webmol.html.
7. Continue to scroll down the 1-methylhistidine MetaboCard. You should see numerous fields containing detailed nuclear magnetic resonance (NMR) spectral data
Cheminformatics
14.8.7
Current Protocols in Bioinformatics
Supplement 25
Figure 14.8.5 An image of the 3-D structure of 1-methylhistidine as displayed using the WebMol Java applet.
Users may manipulate the image for better viewing or further analysis.
(Experimental 1 H NMR Spectrum, Experimental 13 C NMR Spectrum, Experimental 13 C HSQC Spectrum (Fig. 14.8.6), Predicted 1 H NMR Spectrum,
Predicted 13 C NMR Spectrum, etc.). Click on these to see what NMR spectral
information is available on 1-methylhistidine. The user can also review the experimental conditions by clicking on the View Experimental Conditions hyperlink or
download the raw FID (free induction decay) file by clicking on the Download FID
hyperlink for each spectrum. The FID files come in either Varian or Bruker formats
depending on the metabolite and type of spectrum (i.e., 1 H or 13 C). The FID files are
the raw binary files used by NMR spectroscopists to render, assign, and manipulate
their spectral data. Remember to hit the Back button, once you have viewed the
spectral data, to return to the 1-methylhistidine MetaboCard.
Exploring Human
Metabolites Using
the Human
Metabolome
Database
The Human Metabolome Database (HMDB) is particularly notable for the amount of
NMR spectral information it provides about known human metabolites. Over 1400 experimentally collected 1 H and 13 C NMR spectra have been assembled for 875 pure
compounds (most were collected in water at pH 7.0; 10 mM for 1 H, 50 mM for 13 C). In
addition, there are over 2500 HMDB compounds with predicted 1 H and 13 C NMR spectra
(more than 5000 predicted NMR spectra in total). The predicted spectra are generated
using ACD/HNMR and ACD/CNMR software from Advanced Chemistry Development,
Inc., with validated MOL files used as the input for each prediction. As will be seen later,
these spectra are particularly useful for metabolite identification and verification. While
other NMR spectral databases do exist, such as NMRShiftDB (Steinbeck et al., 2003) and
the Spectral Database for Organic Compounds (http://riodb01.ibase.aist.go.jp/sdbs/),
these are not specific to metabolites, nor are their data typically collected in water near
physiological conditions.
14.8.8
Supplement 25
Current Protocols in Bioinformatics
Figure 14.8.6
An image of the 2-D HSQC NMR spectrum and peak list for the metabolite 1-methylhistidine.
8. Below the NMR spectral data is the mass spectrometry data for the 1-methylhistidine
MetaboCard. For many of the metabolites in the HMDB, MS/MS (triple quadrupole)
spectral data are provided at three collision energies (low, medium, and high). The
user can also review the experimental conditions by clicking on the View Experimental Conditions hyperlink for each collision energy. For an example of a mass
spectrum for 1-methylhistidine, see Figure 14.8.7.
The HMDB is also notable for the amount of mass spectral data it provides about known
human metabolites. Over 1900 experimentally acquired MS/MS (triple quadrupole) spectra have been cataloged for over 660 pure compounds. In total, there are over 2100
MS/MS spectra. In addition to its MS/MS data, the HMDB also includes a GC-MS library
with 311 EI spectra and retention times corresponding to 281 metabolites and 30 TMSderivitization variants. As with the NMR data, these spectra are particularly useful for
metabolite identification and verification, as will be shown in Basic Protocol 3.
9. Scroll down further through the 1-methylhistidine MetaboCard. Below the mass
spectral, simplified TOCSY spectral, and BMRB spectral data, you should find
Cellular Location, Biofluid Location, and Tissue Location. These fields are very
useful for anyone wanting to know the location of a particular metabolite within the
cell, in the various biofluids (e.g., urine, blood, cerebrospinal fluid, saliva, etc.), or
within the different tissue types (e.g., brain, heart, lung, kidney, liver, etc.) throughout
the human body. For the cellular location, 1-methylhistidine is normally found in the
cytoplasm, while its biofluid locations are in the blood, cerebrospinal fluid (CSF),
cellular cytoplasm, saliva, and urine. Its tissue location is limited to muscle and more
specifically skeletal muscle.
Cheminformatics
14.8.9
Current Protocols in Bioinformatics
Supplement 25
Figure 14.8.7
Exploring Human
Metabolites Using
the Human
Metabolome
Database
An image of the MS/MS spectrum at low energy for the metabolite 1-methylhistidine.
10. Scroll down below the location fields to enter into the concentration data section.
The right-hand white column is now split into two subcolumns with the sub-fields
on the left in bold font (Biofluid, Value, Age, Sex, Condition, and References).
For any given MetaboCard, the concentration section can be quite large with many
concentration data entries from various literature sources. If you scroll through this
section, you will notice that the concentration section has two main fields Concentration (Normal) and Concentration (Abnormal). For the normal concentrations,
there are sixteen separate literature-derived concentration values with eight from
urine, five from blood, one from cerebrospinal fluid (CSF), one from saliva, and
one from cellular cytoplasm. For the abnormal concentrations, there are only three
14.8.10
Supplement 25
Current Protocols in Bioinformatics
Figure 14.8.8 Details of the SNP (single nucleotide polymorphism) metabolizing enzyme information contained in the MetaboCard for 1-methylhistidine.
separate entries, two from blood and one from CSF. Another informative field is the
Associated Disorders field, just below the abnormal concentrations. This section
lists different Conditions that have been linked to a particular metabolite and provides PubMed and OMIM (Online Mendelian Inheritance in Man; Hamosh et al.,
2005) Reference hyperlinks.
11. As you scroll down below the Associated Disorders field, you will notice a section
listing information about known pathways. This information is very useful for anyone wanting to think of the metabolites in terms of their involvement with specific
biochemical pathways. The major fields that make up the pathway section include
Pathway Names, KEGG Images, SimCell Pathway Images, SimCell Pathway
Graphs, and SimCell Pathway SBMLs (View and Download). The Pathway
Names field often provides a succinct two- to four-word descriptor of the pathway
that a specific metabolite is involved in. For the visually inclined, the KEGG Images field hyperlinks to pathway maps from the KEGG database (Kanehisa et al.,
2004). The KEGG pathway maps are generally stored as Graphics Interchange Format (GIF) image files. The next section involves cellular simulation using SimCell
(http://wishart.biology.ualberta.ca/SimCell/). This program allows users to simulate
cellular and biochemical processes using a Dynamic Cellular Automata algorithm
(Wishart et al., 2005). In the case of the HMDB, the user can look at simulations of
various biochemical pathways involving their metabolite of interest. The SimCell
Pathway Images field contains hyperlinks to pathway image files that can be used
in SimCell to view their metabolite in a simulated pathway. The SimCell Pathway
Graphs field provides hyperlinks to images of graphs showing the change in the
number of molecules of pathway components over time. The SimCell Pathway
SBMLs View and Download fields are more advanced fields that take advantage of
Cheminformatics
14.8.11
Current Protocols in Bioinformatics
Supplement 25
Figure 14.8.9 A screen shot of the HMDB Browser. Note the tabular format and the sorting and display
options at the top of the Browser page.
the Systems Biology Markup Language (SBML) to describe models of biochemical
reaction networks.
12. Scrolling down further on the 1-methylhistidine MetaboCard, one of the last fields
in the first half of the MetaboCard is the General References field. This section
provides a list of papers that focus on the particular metabolite that is being described,
in this case 1-methylhistidine. For each reference, there is a brief citation with author,
title, journal, date, volume, number, pages, and, in many cases, a hyperlink to the
PubMed entry for the cited reference. At this point, as you scroll down below the
General References field, you will notice a clearly marked section with the title
Metabolic Enzyme 1. This section represents the start of the second half of the
MetaboCard that is devoted to enzymatic or biochemical data. In other words, this
section describes the enzymes that act on the metabolite of interest.
Exploring Human
Metabolites Using
the Human
Metabolome
Database
13. As you scroll down the 1-methylhistidine MetaboCard into the Metabolic Enzyme 1
section, you will notice that this section describes the nomenclature (enzyme name,
gene name, synonyms, etc.), gene and protein sequences, other physical properties (e.g., molecular weight and theoretical pI), gene ontology classification, links to
external databases, e.g., KEGG pathways (UNIT 1.12), Pfam domains (UNIT 2.5; Bateman
et al., 2004), GenBank (Wheeler et al., 2005), Swiss-Prot (Bairoch et al., 2005), PDB
(UNIT 1.9), GeneCards (Rebhan et al., 1998), Genatlas (Frézal, 1998), Human Gene
Nomenclature Database (HGNC; Wain et al., 2002), etc. As you scroll down past
these external links, you will notice a field called Metabolic Enzyme 1 SNPs.
Click on the hyperlink View SNPs to open up a new browser window with a table
summarizing many of the known single nucleotide polymorphisms (SNPs) for the
14.8.12
Supplement 25
Current Protocols in Bioinformatics
Figure 14.8.10 A screen shot of how the HMDB Browser page should appear when sorting by Common
Name and displaying 200 metabolites per page.
metabolizing enzyme of interest, in this case for β-Ala-His dipeptidase (Fig. 14.8.8).
This five-column table provides a hyperlink to the refSNP ID, the type of SNP (synonymous or non-synonymous), level of validation, base changes, SNP position, the
resulting amino acid changes (if applicable), the amino acid position (if applicable),
and the allele frequencies in different populations. The SNP information is particularly important for understanding the origins of certain diseases, the propensity for
individuals to get certain diseases, and the type of base changes that are observed in
the population as a whole.
Using the Human Metabolome Database Browsers
The following part of the protocol involves learning how to use the different Human
Metabolome Database (HMDB) browsing and search tools listed in the HMDB menu
bar.
14. Scroll to the top of the MetaboCard for 1-methylhistidine. Click on the Browse hyperlink on the left side of the HMDB menu bar (second from the left) to launch the
HMDB Browser (Fig. 14.8.9).
15. Near the top of the Browser page is a dark gray rectangular box that serves as the
Browser’s sorting and display option interface. On the left side of this box appear
the words Sorted by. If you click on the right side of this box, on the downward
arrow, a pull-down menu appears with different sorting options. Users may sort any
given HMDB Browser page by HMDB accession code, common name, chemical
IUPAC name, molecular formula, molecular weight, CAS registry number, or biofluid
location. Using the Display pull-down menu, users may choose to display 20, 50,
Cheminformatics
14.8.13
Current Protocols in Bioinformatics
Supplement 25
Figure 14.8.11 Here is the result that was obtained with the Chemical Class Browser example (amino acids,
display 200 metabolites per page).
100, or 200 metabolites per page. A user may also quickly jump from one page to
another using the hyperlinked page numbers or the arrows at the bottom of this box.
Sort the table by Common Name and use the Display tab to show 200 metabolites
per page. The results should appear as shown in Figure 14.8.10.
16. Return to the top of the Browser page and click on the Browse the HMDB Chemical
Class Table hyperlink that appears near the top on the right side of the page. This will
open the Chemical Class Browser page that allows the user to view metabolites by
chemical class. On the Chemical Class Browser page, the user has different display
options. A dark gray box appears near the top of the page with the options Select a
Chemical Class and Display. As with the Browser page, the user can also select to
display 20, 50, 100, or 200 metabolites per page. The user can also jump to any page
using the page numbers and arrows at the bottom of this box. Click on the pull-down
menu at the right of the text Select a Chemical Class to browse the compounds by
chemical class. Select the Amino Acids chemical class and choose to display 200
metabolites per page. The results should fit on two pages since there are a total of
248 metabolites that belong to the amino acid class (Fig. 14.8.11). Note the Amino
Acids (total=248) that appears on the first page of the Chemical Class Browser
table.
Exploring Human
Metabolites Using
the Human
Metabolome
Database
There are more than 40 different chemical classes in the HMDB such as amino acids,
metal ions or salts, steroids and steroid derivatives, short chain fatty acids, hydroxy acids,
alcohols, dicarboxylic acids, etc. Each compound in the HMDB was manually inspected
and assigned to a specific chemical class. As yet, there is no definitive taxonomy for
metabolites and their corresponding chemical classes. The choice of chemical class
assignment was made on the basis of a consensus set of terms commonly used by clinical
chemists and metabolomics specialists in the published literature.
14.8.14
Supplement 25
Current Protocols in Bioinformatics
Figure 14.8.12 1-methylhistidine appears in five different biofluids. This result was obtained using a search
for this particular metabolite in different biofluids from the Biofluid Browser page.
17. Click on the Biofluids hyperlink (third from the left) on the HMDB menu. This
will open the HMDB Biofluid Browser. As with the other two HMDB Browsers,
the Biofluid Browser includes many options. With this Browser, the user can search
for specific metabolites by biofluid location or by concentration range. In terms of
display options, the user may display metabolites by biofluid type and sort the results
by common name (ascending or descending order), normal concentration (ascending
or descending order), or associated condition (ascending or descending order). The
different biofluid locations include: plasma/serum, urine, saliva, gallbladder, cerebrospinal fluid (CSF), intracellular, and breast milk. In the text box that appears to
the right of the text Search Biofluid for, type 1-methylhistidine and hit the
Search button to display a table listing all of the biofluid locations for this particular
metabolite. The results should show that 1-methylhistidine appears in five different
biofluids: plasma, urine, saliva, CSF, and intracellular (Fig. 14.8.12).
18. Return to the Biofluid Browser home page (http://hmdb.ca/scripts/
Biofluid browse.cgi) by clicking on the Biofluids hyperlink on the HMDB
menu. Below the search fields appears a gray box with Select Biofluid Type and
Sorted by. Click on the downward arrow to the right of Select Biofluid Type to
select “Gallbladder” and click on the downward arrow to the right of Sorted by to
select “Associated Condition (ascending).”
This exercise should reveal a select list of metabolites from gallbladder bile with
associated disorders: cholesterol, bilirubin, lecithin, L-lactic acid, and palmitic acid
(Fig. 14.8.13).
19. The HMDB Tissue Browser allows users to browse the database by tissue. Scroll
back up to the top of the Biofluid Browser home page and click on the Tissues
Cheminformatics
14.8.15
Current Protocols in Bioinformatics
Supplement 25
Figure 14.8.13 Restricting the search to metabolites from gallbladder bile with associated disorders limits
the number of metabolites to a total of five.
hyperlink just to the right of Biofluids on the HMDB menu bar. This will open up
the HMDB Tissue Browser page. By default, all of the metabolites in the HMDB
are displayed in a table with three columns: HMDB ID, Name, and Tissue. Note that
above each column header there are empty boxes. Users can input their query data
in these boxes and press the Search button to launch their search. Clicking on one
of the column headers sorts the column by that field (one click sorts by ascending
order and two clicks by descending order). For example, if a user clicks on the
HMDB ID, all of the metabolites are sorted in ascending order, from HMDB00001
to HMDB05176. If one wanted to look at all metabolites with the word “thyroid”
in the tissue field, then thyroid should be typed in the third column header query
field, and the Search button should be clicked. In this case, the Tissue Browser returns
a total of 53 matches (Fig. 14.8.14). The user can navigate the hit results using the
First, Previous, Next, and Last arrows near the top of the page. The user can also
select to display 50, 100, or 500 metabolites per page. The data can also be exported
to Microsoft Excel by clicking on the Export XLS hyperlink.
Exploring Human
Metabolites Using
the Human
Metabolome
Database
20. Scroll back up to the top of the Tissue Browser home page and click on the TextQuery
hyperlink located just to the right of the ChemQuery hyperlink on the HMDB Menu.
This will open the HMDB Text Search page. This page provides many user options
including text or numerical searches by common name, synonym, or all text fields.
The user can also select case sensitivity, partial matches, and up to two misspellings.
In addition, the user can choose to display the top 10, 20, 50, 100, 200, 500, or 1000
hits. For instance, users interested in finding out which metabolites are associated
14.8.16
Supplement 25
Current Protocols in Bioinformatics
Figure 14.8.14
In this example of the HMDB Tissue Browser, only metabolites from the thyroid are displayed.
with obesity would type obesity in the Search for: text box, making sure that the
Common Name, Synonym, and All Text Fields boxes are checked. Note that Partial
Match can be checked or unchecked, with no change in the results. After hitting the
Submit button, a new browser window should open with a table of 58 metabolites
that match this text query (Fig. 14.8.15). If one wanted to limit a search, the search
could be repeated as above, but this time typing obesity AND stroke. This
would generate a list of metabolites that contain “obesity” and “stroke” somewhere
in the MetaboCard. This time, the TextQuery Browser returns only two matches,
cholesterol and taurine.
21. At this point, the user will learn how to use the HMDB Data Extractor. This tool allows
users with no database experience to build powerful Structured Query Language
(SQL)-based queries without having to know SQL. SQL is the computer language
used to provide an interface to relational databases (see UNIT 9.2). To begin, we need
to scroll back up to the HMDB menu near the top of most HMDB pages. Click on the
Data Extractor hyperlink in the middle of the HMDB menu. This will open a new
window with two frames; the frame on the left allows users to select various fields
that they would like to use to search the database. For example, if a user wanted to
build a query form that allowed them to search for all metabolites with a molecular
weight that is between 145 and 155 Da, a melting point between 0◦ and 100◦ C, a
biofluid location that is blood, and a tissue location that is erythrocyte (red blood
cell), they would select the following fields: “molecular weight,” “melting point,”
“biofluid location,” and “tissue location,” holding down the control (Ctrl) key to
Cheminformatics
14.8.17
Current Protocols in Bioinformatics
Supplement 25
Figure 14.8.15 In this example of the HMDB TextQuery Tool, only metabolites that contain text with the word
obesity are displayed.
select noncontiguous fields. Once the fields of interest are selected, the user must
click on the Go button to build the query form (Fig. 14.8.16). The form will appear
in the right-side frame. With this form, a user may enter values in the boxes that
appear on the right. In the molecular weight boxes, enter 145 and 150, while in the
melting point fields, enter 0 and 100. For the biofluid location and tissue location
fields, enter blood and erythrocyte, respectively. Hit the Submit button to
launch the query. A new window opens in the right frame with the results. There is
only one hit from the database that matches this complex query: spermidine. In a
similar way, users can build complex queries to search the metabolic enzymes and
macromolecular interacting partners that make up the other important half of the
database.
Exploring Human
Metabolites Using
the Human
Metabolome
Database
Using the download page
22. Return to the HMDB menu at the top of the right frame of the Data Extractor page
and click on the Download hyperlink. The Download page window as shown in
Figure 14.8.17 should appear. This page provides access to much of the HMDB’s
downloadable content including protein and DNA sequences in FASTA format (redundant and nonredundant sets), MetaboCard flat files and MetaboCard hyperlinks,
structure files in various formats (SDF, MOL, PDB, canonical SMILES strings), and
spectral files (MS and NMR). Toward the bottom of this page, up-to-date statistics
about the HMDB downloadable content is provided, as shown in Figure 14.8.18.
14.8.18
Supplement 25
Current Protocols in Bioinformatics
Figure 14.8.16
The HMDB Data Extractor can be used to build complex queries as shown here.
Figure 14.8.17 The HMDB Download page provides access to many large, downloadable text files containing
much of the HMDB’s content.
Cheminformatics
14.8.19
Current Protocols in Bioinformatics
Supplement 25
Figure 14.8.18 Near the bottom of the HMDB Download page, up-to-date statistics about the HMDB downloadable content is provided.
BASIC
PROTOCOL 2
CHEMICAL STRUCTURE SIMILARITY SEARCHING
In cheminformatics, metabolite searches based on chemical structure similarity are analogous to sequence searches based on sequence similarity or structural searches based on
similarity to 3-D structures such as those found in the Protein Data Bank (PDB; UNIT 4.9).
Chemical structure similarity searches may be especially useful for organic chemists and
analytical chemists wanting to determine whether a newly synthesized or newly identified
compound shows similarity to a known metabolite. Chemical structure similarity searches
may also prove to be very useful when looking at compounds with the same parent compound or from the same chemical class. In some cases, chemical structure similarity
searching can be more powerful than text-based searching. Often, the naming conventions for various metabolites are inconsistent, and there are sometimes spelling errors
that can make text-based searching challenging. In many cases, searching for a precise
chemical structure match or similar chemical structure match can lead to very informative results, while some text-based searches may yield no adequate results. This protocol
describes some of the features of the HMDB’s chemical structure-based search methods.
Necessary Resources
Hardware
Computer with Internet access
Software
Exploring Human
Metabolites Using
the Human
Metabolome
Database
An up-to-date Web browser, such as Internet Explorer
(http://www.microsoft.com/ie/), Firefox (http://www.mozilla.com/), Netscape
(http://browser.netscape.com/), Opera (http://www.opera.com/), or Safari
(http://www.apple.com/safari/). The Web browser must be capable of handling
Java applets (i.e., equipped with a recent version of the Java interpreter).
14.8.20
Supplement 25
Current Protocols in Bioinformatics
Figure 14.8.19 In this particular view of the HMDB ChemQuery home page, the chemical structure drawing
applet window is shown.
Files
None
Using ChemQuery
1. Go to the Human Metabolome Database Web site at http://hmdb.ca/.
The HMDB home page should appear along with the light gray menu bar located near
the top of the page with fourteen clickable links: Home, Browse, Biofluids, Tissues,
ChemQuery, TextQuery, SeqSearch, DataExtractor, MS/MS Search, MS Search, GC/MS
Search, NMR Search, Download, and Explain.
2. Click on the ChemQuery hyperlink on the HMDB menu (fifth hyperlink from
the left). A window should appear with a pull-down menu and the ACD/Structure
Drawing Java applet (Fig. 14.8.19). The pull-down menu (Search HMDB Via)
allows users to select the type of chemical structure search. Users can search by
Chemical Structure, Molecular Weight, Chemical Formula, or SMILES String.
The ChemQuery tool provides a wide variety of chemical structure query options. Using
the “Search HMDB Via:” pull-down menu, users can either draw chemical structures
using the ACD/Structure Drawing applet, enter a range of molecular weights (using text
boxes), type the chemical formula with flexibility in being able to search for compounds
matching a range of chemical formulas, or enter a SMILES string (Weininger, 1988). Mass
spectroscopists are generally interested in searching for compounds by chemical formula
or molecular weight ranges, since the data generated by mass spectrometers (MS) are
typically mass ranges and approximate chemical formulas. SMILES string and chemical
structure searching are typically more useful for organic and natural product chemists as
well as biochemists. The SMILES (Simplified Molecular Input Line Entry Specification)
string unambiguously describes the structure of chemical compounds using short ASCII
strings. Most molecule editors can be used to import SMILES strings and convert them
into 2-D drawings or 3-D molecular models.
Cheminformatics
14.8.21
Current Protocols in Bioinformatics
Supplement 25
Figure 14.8.20
requirements.
A variety of chemical structure templates are available to reduce some of the manual drawing
Drawing a chemical structure using ChemQuery
This particular part of the protocol will use the ChemQuery tool to look for small
molecules that are similar in chemical structure to the neurotransmitter dopamine. The
user should leave the ChemQuery pull-down menu on the default setting (Chemical
Structure).
3. To begin drawing the chemical structure for dopamine, look for the row of buttons
above the structure drawing applet window and click on what looks like a stack of
index cards (third button from the right). This will open up a template of available
chemical structures. A separate window should appear with a list of different structure
template names (Rings, Chains, Groups, Aromatics, etc.) on the left side (see
Fig. 14.8.20).
Exploring Human
Metabolites Using
the Human
Metabolome
Database
The ACD (Advanced Chemistry Development)/Structure Drawing applet is relatively
easy to use. On the left side of the applet is a column of buttons for adding the commonly
used chemical elements (carbon, hydrogen, nitrogen, oxygen, phosphorus, sulfur, chlorine,
bromine, and fluorine). Above the C (carbon) is a button that gives access to the remaining
chemicals from the periodic table of elements. At the top of the applet are a number of
buttons for drawing, erasing, moving, zooming, undoing, redoing, and clearing different
drawing elements or drawings. When the user mouses over each of these buttons, a brief
one or two word description of the button appears in the upper right corner of the applet.
Clicking on the About hyperlink in the upper right corner opens a new window with
more details about the ACD/Structure Drawing applet. The easiest way to quickly draw
structures is to take advantage of the chemical structure templates collection (the button
that looks like a stack of index cards).
4. Select the Aromatics template gallery by clicking on the word Aromatics, listed
fourth on the template list. In the right pane of the template window, a collection
14.8.22
Supplement 25
Current Protocols in Bioinformatics
Figure 14.8.21
ring.
At this stage of the chemical structure drawing exercise, we have managed to draw a benzene
of eleven aromatic ring structures should appear. A benzene ring should appear on
the upper left corner of this pane. Click anywhere on the benzene ring to copy this
structure and click just to the left of center in the structure drawing applet window to
paste the six-carbon ring structure. The chemical structure drawing window should
now appear as shown in Figure 14.8.21.
If a mistake is made, the user can easily undo the previous action by clicking on the undo
button (cyan arrow curving up to the left, third button from the left). To the left of this button
is a button that looks like a blank sheet of paper with the corner folded down. This button
allows the user to start over and clear the drawing area. When using the chemical structure
templates, two elements from different templates are usually joined at the elements to form
a bond. However, it is possible to inadvertently join an element from one template structure
to the middle of a bond of another template structure by clicking on a bond rather than
an element (or vice versa). This type of structure is unrealistic and undesirable.
5. At this point, the user will draw in the rest of the atoms by hand using the vertical
column of element buttons (C, H, N, O, P, S, etc.) on the left side of the drawing
applet. Start with the oxygen atoms; click on the O to start adding oxygens. Add the
first oxygen by clicking at a 45◦ angle above and to the left of the carbon at position
6. To draw the bond between the oxygen and carbon, mouse over the oxygen; a box
should appear around the oxygen. Click and drag toward the carbon at position 6
until a box outlines this carbon. Upon release of the mouse button, a bond is drawn.
Similarly, click at a 45◦ angle below and to the left of the carbon at position 5. Draw
the bond as described above. Your drawing should look like the drawing shown in
Figure 14.8.22. In a similar fashion, we will now add two carbons (by clicking on the
C button) branching off from the carbon at position 3 and a nitrogen atom at the end
of the two-carbon chain. The applet looks after the details in terms of the number of
Cheminformatics
14.8.23
Current Protocols in Bioinformatics
Supplement 25
Figure 14.8.22 Our dopamine drawing is beginning to take shape. At this point, we have added two oxygens
to the benzene carbons at positions 5 and 6.
appropriate hydrogen atoms. The finished chemical drawing should appear as shown
in Figure 14.8.23.
6. Scroll down the ChemQuery page and click on the button labeled CLICK TO
CONVERT TO MOL FILE. Clicking on this button will generate a MOL file that
should automatically appear in the text box below the button (Fig. 14.8.24).
The newly created MOL file text data can be copied and pasted into a text editor and
stored for future use. The file conversion program Babel converts the MOL file data to
a SMILES string that unambiguously describes the chemical structure drawing that was
completed in this exercise.
7. Scroll down the ChemQuery page to the bottom and click on the button labeled
CLICK TO SUBMIT QUERY. Within a few seconds, the search results window
should replace the query page. The results page provides a ranked list of small
molecules with similar chemical structures, with the best matches appearing near the
top of the page. The results table looks very much like the HMDB Browser table.
One notable exception is the assignment of a score that appears below the HMDB
ID in the results table, with higher scores indicating better matches. Dopamine is
a precursor to epinephrine (adrenaline) and norepinephrine (noradrenaline), both of
which appear on the list of chemically similar structures (Fig. 14.8.25).
Exploring Human
Metabolites Using
the Human
Metabolome
Database
This action takes the newly generated MOL file and converts it to a SMILES string.
This SMILES string is then used as the query against a database of SMILES strings for
all metabolites in the HMDB. This search is equivalent to a “text search” or a simple
sequence alignment (such as BLAST). The ChemQuery search engine essentially identifies
similar chemical structures by looking for shared SMILES substrings. A heuristic scoring
method is used to prioritize and rank the substring matches and generate an overall
matching score.
14.8.24
Supplement 25
Current Protocols in Bioinformatics
Figure 14.8.23
At this stage, the completed dopamine drawing is shown.
Figure 14.8.24
button.
The MOL file text is automatically copied to the window below the CONVERT TO MOL FILE
Cheminformatics
14.8.25
Current Protocols in Bioinformatics
Supplement 25
Figure 14.8.25
Here is the chemical similar search result obtained for our hand-drawn example.
Using the SMILES string option from ChemQuery
This protocol has described the use of a chemical drawing tool to draw a chemical
structure and the use of this structure to search the Human Metabolome Database.
However, the user can also use ChemQuery to search by SMILES string (Weininger,
1988) as mentioned in step 2 above.
8. Return to the ChemQuery window by clicking on the ChemQuery hyperlink on the
HMDB menu. To search by SMILES string, select “SMILES String” (the last menu
item) in the SEARCH HMDB Via pull-down menu. A new window should appear
with a pull-down menu and a text box. Leave the pull-down menu at SMILES String
and copy and paste a known SMILES string into the text box. In this case, the user
enters the SMILES string for dopamine (NCCC1=CC=C(O)C(O)=C1) and clicks
on the Search button to obtain the result. It is clear from this example that searching
by SMILES string provides a much quicker, more convenient method of searching
for similar chemical structures than manually drawing a structure.
9. Chemical structure similarity searches may also be performed from the HMDB’s
MetaboCards. At the upper right-hand corner of every MetaboCard (Fig. 14.8.26),
directly below the Human Metabolome Project (HMP) logo, is a button labeled Show
Similar Structure(s). Clicking on this button should open a new window displaying
a table of small molecules with similar chemical structures (Fig. 14.8.27). With this
search method, users can freely browse the HMDB for chemical structures of interest
and then use this feature to compare their structure with other related structures.
Exploring Human
Metabolites Using
the Human
Metabolome
Database
Both “Show Similar Structures” and ChemQuery use a locally developed SMILES string
comparison method to identify related structures and to perform structure similarity
searches. All structures are converted to SMILES strings, and a substring matching
program (similar to BLAST) is used to identify similar structures. The scoring scheme is
14.8.26
Supplement 25
Current Protocols in Bioinformatics
Figure 14.8.26
HMDB.
The Show Similar Structure(s) button appears at the top right of each MetaboCard in the
Figure 14.8.27
MetaboCard.
Here are the results obtained using the Show Similar Structure(s) button from the dopamine
Cheminformatics
14.8.27
Current Protocols in Bioinformatics
Supplement 25
based simply on the number of character matches for the longest matching substring. A
more robust substructure matching algorithm based on subgraph isomorphisms and the
Tamimoto index is currently under development.
BASIC
PROTOCOL 3
METABOLITE IDENTIFICATION VIA SPECTRAL MATCHING
This protocol describes how users may browse, search, and query the spectral databases
in the HMDB. One of the key challenges in metabolomics is being able to identify
metabolites from NMR, LC-MS, or GC-MS spectra collected from biofluids and tissues.
Typically the spectra collected from these biological samples contain dozens to thousands
of peaks (depending on the technology, the biosample, and the separation methods used).
In some cases, the compound of interest has been purified, and so the spectrum may
only contain a small number of peaks. Regardless of whether the NMR/GC-MS/LCMS spectra are collected from a mixture or from a purified preparation, the best way of
identifying an unknown compound or mixture of compounds is through comparison of the
sample’s peak positions (chemical shift, retention time, m/z value) to a library of standard
or reference spectra (Wishart, 2007). In the case of compound identification via NMR,
MS/MS, or GC-MS methods, typically one must match multiple peaks and peak patterns
to confirm the existence or identity of a compound. In the case of compound identification
by high-resolution MS methods (such as FT-MS or OrbiTrap) it is sometimes sufficient
to identify a compound by matching a single mass peak (the parent ion) and a retention
time.
While a number of spectral libraries do exist, including NMRShiftDB (Steinbeck
et al., 2003), Spectral Database for Organic Compounds (SDBS; http://riodb01.
ibase.aist.go.jp/sdbs/), Golm Metabolome Database (Kopka et al., 2005), and the NIST
Spectral Database (http://www.nist.gov/srd/nist1a.htm; Ausloos et al., 1999), many contain spectra collected in organic solvents (for NMR) or are mostly populated with spectra
from compounds that are not metabolites or, at least, not mammalian metabolites. One
of the strengths of the HMDB is the fact that it contains spectra of hundreds of common metabolites that were collected in aqueous conditions (especially for NMR) under
controlled and clearly defined conditions. The HMDB NMR libraries contain 722 1 H
experimental NMR spectra, 709 13 C HSQC NMR experimental spectra, 2515 1 H predicted NMR spectra, and 2511 13 C predicted NMR spectra. The HMDB GC-MS library
contains 311 EI spectra with retention times corresponding to 281 metabolites and 30
TMS-derivitization variants. The HMDB MS/MS library contains 2137 MS/MS spectra
collected on a Waters Quattro LC triple quadrupole mass spectrometer from 667 compounds at three different collision energies. Protocols describing the sample collection
conditions and parameters are available at http://www.metabolomics.ca/News/sops.htm.
Brief synopses of the data collection conditions for each metabolite are also available in
the corresponding compound’s MetaboCard.
The HMDB’s reference spectra may be viewed within each MetaboCard (see Basic
Protocol 1) or they may be viewed and searched using the corresponding GC-MS Search,
MS-MS Search, and NMR Search facilities within the HMDB. These spectral search
tools support querying via compound names (common name), synonyms, molecular
weight range, chemical formula and—most importantly—by spectral peak positions.
In particular, the HMDB’s spectral matching tools allow users to identify compounds
from NMR, GC-MS, or LC-MS spectra collected from either pure extracts or complex
mixtures.
Exploring Human
Metabolites Using
the Human
Metabolome
Database
Necessary Resources
Hardware
Computer with Internet access
14.8.28
Supplement 25
Current Protocols in Bioinformatics
Figure 14.8.28 The spectral search pages (NMR, MS/MS, and GC-MS) include a convenient drop-down
menu that allows users to search by Common Name, Synonyms, Chemical Formula, Molecular Weight, or
respective peak list.
Software
An up-to-date Web browser, such as Internet Explorer
(http://www.microsoft.com/ie/), Firefox (http://www.mozilla.com/), Netscape
(http://browser.netscape.com/), Opera (http://www.opera.com/), or Safari
(http://www.apple.com/safari/). The Web browser must be capable of handling
Java applets (i.e., equipped with a recent version of the Java interpreter).
Files
None
Browsing and searching the HMDB’s spectral databases
The HMDB spectral database search pages (NMR, MS/MS, and GC/MS) share a common
user interface. Each page has a pull-down menu labeled Search By with the following
five options: “Common Name,” “Synonyms,” “Chemical Formula,” “Molecular Weight,”
and “Peaklist Data” (NMR, MS/MS, or GC/MS). This convenient interface allows the
user to search all of the NMR, MS/MS, or GC/MS available spectra by common name,
synonym, chemical formula, molecular weight, or peak list. As an example, the interface
for the NMR Search page is shown in Figure 14.8.28.
Single compound identification via NMR search
1. Open your local Web browser and go to the HMDB home page at http://hmdb.ca/.
The HMDB home page should be visible as should the light gray menu bar located
near the top of the page with fourteen clickable links: Home, Browse, Biofluids, Tissues,
ChemQuery, TextQuery, SeqSearch, DataExtractor, MS/MS Search, MS Search, GC/MS
Search, NMR Search, Download, and Explain.
Cheminformatics
14.8.29
Current Protocols in Bioinformatics
Supplement 25
Figure 14.8.29 The NMR Search page allows users to search for a variety of NMR spectral types (1D 1 H,
1D 13 C, 2D HSQC, and 2D TOCSY).
2. Click on the NMR Search link (third from the right). After a few seconds the
NMR default search page should appear as in Figure 14.8.28. Click on the pulldown menu to the right of Search By and select NMR Peaklist Data. After a few
seconds, a window should appear with four pull-down tabs as well as two text
boxes that accept numerical input for Chemical Shift Tolerance (±) and Chemical
Shift Library (Fig. 14.8.29). The second pull-down menu (Search Type) allows
users to select the type of NMR data (All, Experimental, or Predicted). The third
pull-down menu (Spectral Database) allows users to select the spectral database to
be searched (1D 1 H NMR, 1D 13 C NMR, 2D HSQC, or 2D TOCSY). The fourth
pull-down menu (Top Matches Returned) allows users to select the number of
matches to be displayed (5, 10, 20, or 100). In the first text box (Chemical Shift
Tolerance), users enter a number representing how tightly they want the input peak
list to match the peaks in the database. Lower numbers specify tighter matches
while higher numbers specify looser matches. In the second text box (Chemical
Shift Library), users enter all of the peaks that they can read from their NMR
spectrum.
Exploring Human
Metabolites Using
the Human
Metabolome
Database
Entering some experimental NMR data
This particular part of the protocol will use the NMR Search link to take experimental
NMR data and look for molecules with matching NMR peaks. Therefore, the user should
leave the following three pull-down menus with their default selections (Search Type,
Spectral Databases, and Top Matches Returned). It is important to note that the Search
By pull-down menu must be set to “NMR Peaklist Data.”
14.8.30
Supplement 25
Current Protocols in Bioinformatics
Figure 14.8.30 As you scroll down on the MetaboCard for 1-methylhistidine, the Experimental 1 H NMR
Spectrum field will appear as shown.
3. For this example, we will use the Experimental 1 H NMR spectral data for 1methylhistidine. In a separate browser window or tab, go to the HMDB home
page (http://hmdb.ca). In the text search box near the top of the home page, enter 1-methylhistidine. Click on the 1-methylhistidine hyperlink to go to
the 1-methylhistidine MetaboCard. Scroll down the page to the Experimental 1 H
NMR Spectrum field (Fig. 14.8.30). Click on the Download Spectrum link to
view the spectrum in a new browser window (Fig. 14.8.31). This page provides
the experimental proton NMR data about 1-methylhistidine, including an image
of the NMR spectrum as well as a table of peaks. Scroll down to the table of
peaks (Fig. 14.8.32) and enter the Chemical Shift values from the (ppm) column
in your NMR search Chemical Shift Library text box. The values to be entered
are 3.04, 3.06, 3.07, 3.09, 3.14, 3.15, 3.17, 3.18, 3.68, 3.95,
3.95, 3.96, 3.97, 7.00, and 7.68.
Each value must be entered on its own line with no non-numeric characters (e.g.,
whitespace).
4. The completed chemical shift library query data should appear as shown in
Figure 14.8.33. After entering all of the values from the (ppm) column of the Table
of Peaks, hit the Submit button.
5. Within a few seconds your search results should appear below the search area. As
expected, the top hit should be 1-methylhistidine. The results appear as a table
with several clickable hyperlinks including the HMDB ID, Peaklist, and Spectra
(Fig. 14.8.34). Other fields are also displayed in this table including the name of the
matching metabolites and the Category (Experimental or Predicted). If we click on
the Peaklist hyperlink for 1-methylhistidine, a new window should open with the
Current Protocols in Bioinformatics
Cheminformatics
14.8.31
Supplement 25
Figure 14.8.31
Here is the Experimental 1 H NMR Spectrum for 1-methylhistidine.
peak list data for this compound. An identical match to our input peak list has been
found. If you view the peak lists for the other matches, note that only a portion of
these peak lists match the query peak list.
Exploring Human
Metabolites Using
the Human
Metabolome
Database
Multiple compound or mixture ID via NMR search
6. In this example, the user will use NMR Search to identify compounds from a
mixture of compounds. Scroll back up to the top of the NMR Search page and
ensure that Search By “NMR Peaklist Data” is selected. In the second drop-down
menu (Search Type), select “Experimental.” Leave the third (Spectral Database)
and fourth (Top Matches Returned) drop-down menus as well as the Chemical
Shift Tolerance on the default settings. Select the numerical data in the Chemical
Shift Library text box and hit the backspace or delete button to delete this text.
14.8.32
Supplement 25
Current Protocols in Bioinformatics
Figure 14.8.32
Here is the Table of Peaks for 1-methylhistidine.
With the cursor in this text box, type in the following spectral peak data representing
experimental 1D 1 H NMR data for three metabolites: 0.804, 1.020, 1.206,
1.400, 1.642, 1.866, 2.071, 2.357, 3.663, 5.739, 2.68, 3.73,
4.14, 3.24, 3.05, 7.28, 7.40, 7.34, 7.40, 7.28, 3.665, 3.744,
7.349, 7.377, and 7.412. Enter each value on a separate line by hitting the
Enter key after typing each value. The NMR Search window should appear as
shown in Figure 14.8.35. Hit the Submit button to obtain the results.
7. After a few seconds, a results table should appear at the bottom of the NMR Search
page. Scroll down the page to view these results. The results should appear as shown
in Figure 14.8.36. The top three hits are testosterone, aspartame, and phenylacetylglycine. In this example, NMR Search has been used to successfully identify three
compounds from a mixture of compounds. Note that the three compounds identified
have relatively high scores (10/10, 8/8, and 5/5, respectively) as listed in the far
right column. In the case of testosterone, ten peaks from the query peak list matched
Cheminformatics
14.8.33
Current Protocols in Bioinformatics
Supplement 25
Figure 14.8.33
shown.
The completed chemical shift library query data for 1-methylhistidine should appear as
the peak list for testosterone in the HMDB NMR spectral library. As in the single
compound identification section of this protocol, the results table is sortable by column. To sort by column, simply click on the column heading hyperlink. Thus, the
table is sortable by HMDB ID, Name, Category (Experimental or Predicted), and
Score. The text boxes above each column heading allow users to search for a specific
compound by HMDB ID, Name, Category, or Score. In the table, the following
fields contain hyperlinks: HMDB ID and Peaklist, allowing for convenient access to
the MetaboCard and peak list data. The user can navigate the results table using the
convenient hyperlinked arrows on the top right of the table (First, Previous, Next,
Last). The user can also choose to display 50 or 100 rows and can export the results
table to Microsoft Excel using the hyperlinked Export XLS icon or text.
Compound identification via MS search
8. Scroll back up to the top of the NMR Search page and click on the MS/MS Search
hyperlink on the menu bar just to the right of center. You should now see the MS/MS
Search page. From this page, users can perform MS/MS searches, MS searches, peak
list searches, and GC/MS searches. Click on the top pull-down menu to view the
different MS search options.
Exploring Human
Metabolites Using
the Human
Metabolome
Database
9. From the top pull-down menu, click once on MS Search. Within a few seconds
the MS Search page should appear as shown in Figure 14.8.37. Below the Find
Metabolites button, the user can select which databases to search (HMDB, Theoretical MS/MS, FooDB, DrugBank, or All Databases). FooDB is the Food Component Database with over 1900 food components (http://www.foodbs.org/foodb)
14.8.34
Supplement 25
Current Protocols in Bioinformatics
Figure 14.8.34
Here is the results table for the 1D 1 H NMR search using the peak list for 1-methylhistidine.
Figure 14.8.35
as shown.
For the multiple compound identification example, the NMR Search window should appear
while DrugBank (http://www.drugbank.ca/) is a database with over 4700 drugs. Below the database field are two text boxes, one for the MW of Parent Ion and the
other for the MW Tolerance. The user can type or copy/paste numerical data into
these text boxes. The MW of Parent Ion represents the molecular weight in daltons
of the unfragmented compound. The MW Tolerance field allows the user to specify
the “stringency” of the search, with lower numbers specifying tighter matches to the
query value. In this example, we will check off only the HMDB database, enter 129
in the MW Parent Ion text box, keep the default MW Tolerance value of 0.1 Da,
and press the “Find Metabolites” button.
Cheminformatics
14.8.35
Current Protocols in Bioinformatics
Supplement 25
Figure 14.8.36 Of the five hits that appear in the results table, the top three represent the three compounds
that make up the mixture of compounds.
Figure 14.8.37
Exploring Human
Metabolites Using
the Human
Metabolome
Database
The MS Search page can be used to look for metabolites with matching molecular weight.
10. After a few seconds, the results should appear below the search area as a four-column
table as shown in Figure 14.8.38. The four columns in this table are Rank, HMDB
ID, Name, and Isotopic MW. The HMDB ID fields in this table are hyperlinked
and clicking on one of these HMDB ID hyperlinks opens up the corresponding
MetaboCard.
14.8.36
Supplement 25
Current Protocols in Bioinformatics
Figure 14.8.38 The MS Search results should appear as a four-column table with Rank, HMDB ID, Name,
and Monoisotopic Molecular Weight.
Compound identification via MS/MS search
11. Now, the user will proceed to the MS/MS Search page by clicking on MS/MS
Search from the top pull-down menu. A new browser window should open with the
MS/MS Search page. Click on the pull-down menu to the right of Search by and
select MS/MS Peaklist Data. A new browser window should appear with four text
boxes (m/z of Parent Ion, m/z Tolerance, Fragment Ion Tolerance, and Content of MS/MS Data File) and four pull-down menus (Search By, Instrument
Type, CID Energy Level, and Ionization Mode); a Browse button to the right of
a text box should appear on the row marked MS/MS Data File. For the Search
By pull-down menu, the user can choose between five different options (“Common Name,” “Synonyms,” “Chemical Formula,” “Molecular Weight,” or “MS/MS
Peaklist Data”). For the Instrument Type pull-down menu, there are four different
choices (“Triple Quad,” “QTOF,” “FTMS,” or “Ion Trap”). For the CID Energy
Level pull-down menu, there are four possible choices (“Low Energy,” “Medium
Energy,” “High Energy,” or “All”). For the Ionization Mode pull-down menu, users
can choose between three options (“Negative,” “Positive,” or “N/A”). The Browse
button allows a user to upload an MS/MS data file from the local computer or a
network file server.
12. In this example, we will use the data for the small molecule aconitic acid. In a
separate browser window or tab, open up the Human Metabolome Database home
page (http://hmdb.ca/). In the text search box at the top of the home page, enter
aconitic acid and hit the Submit button. In a few seconds, the text search
results should appear with two hits, cis-Aconitic acid and trans-Aconitic acid. Click
on the cis-Aconitic acid link to view its MetaboCard. Scroll down to the Mass
Spectrum field and click on the View Experimental Conditions link to the right
of the Download File (Low Energy) hyperlink. A new browser window will appear
Cheminformatics
14.8.37
Current Protocols in Bioinformatics
Supplement 25
Figure 14.8.39 The MS/MS Search page should appear as shown with all the fields as default settings
except for the ionization mode and the Search By pull-down menu set at MS/MS Peaklist Data.
with details on the experimental conditions. Note the Instrument Type and the
Ionization Mode; in this case, Quatro QQQ or Triple Quad for the Instrument Type
and positive for the Ionization Mode. With this information, return to the MS/MS
Search page and use the defaults for m/z Parent Ion, m/z Tolerance, Instrument
Type (default is Triple Quad), Fragment Ion Tolerance, CID Energy Level (default
is Low Energy), and the Content of MS/MS Data File (the default is aconitic acid).
It is important to note that the Search By pull-down menu should be set to MS/MS
Peaklist Data. The user just needs to change the Ionization Mode from Negative to
Positive using the pull-down menu. The MS/MS Search page with the appropriate
values and selections made should appear as shown in Figure 14.8.39. Click on the
Find Metabolites button to launch the search.
13. In a few seconds, a new window should appear with the search results at the bottom
of the page. The search results should appear as shown in Figure 14.8.40. The results
appear in an eight-column table with the following columns: Rank, HMDB ID,
Name, Fit(%), RFit(%), Purity(%), Energy Level, and Data. The HMDB ID column contains hyperlinks to the MetaboCards for the matching HMDB compounds,
while the Data column contains two separate hyperlinks to a matching Peaklist and
Spectrum. Note that there are two compounds (trans-Aconitic acid and cis-Aconitic
acid) with RFit(%) values of 1, indicating two identical matches. An RFit(%) value
of 1 indicates a perfect match. They have identical masses since they are cis-trans
stereoisomers.
Exploring Human
Metabolites Using
the Human
Metabolome
Database
Compound identification via GC/MS search
14. In this last part of the protocol, the user will learn more about the GC/MS Search page.
From the MS/MS Search page, scroll back up to the top of the page and click on the
top pull-down menu to the right of Perform. Click on the GC/MS hyperlink to open
the GC/MS Search page. Click on the Search By pull-down menu and select GC/MS
Peaklist Data to open a new browser window. This page is quite a bit simpler than
the MS/MS Search page. Except for the Perform and Search By pull-down menus,
there are no pull-down menus on this search page. However, there are six text boxes
14.8.38
Supplement 25
Current Protocols in Bioinformatics
Figure 14.8.40
column table.
The MS/MS Search results appear at the bottom of the MS/MS Search page as an eight-
Figure 14.8.41
The filled out GC/MS Search page for L-lactic acid should appear as shown.
(Parent Mass of Derivatized Compound, Parent Mass Tolerance, Retention
Index, Tolerance for Retention Index, Peaklist of GC/MS Data, and Tolerance
for Peaks). The Parent Mass of Derivatized Compound represents the molecular
weight of the compound of interest after chemical modification. For example, in
the case of L-lactic acid with a monoisotopic mass of 90.03169 Da, the derivatized
compound is bis(trimethylsilyl)lactate with a parent mass of 234 Da.
Cheminformatics
14.8.39
Current Protocols in Bioinformatics
Supplement 25
Figure 14.8.42
The GC/MS Results should appear in a multicolumn table below the query form.
15. In this example, we will look at L-lactic acid as the query compound. In the Parent
Mass of Derivatized Compound field, enter 234. For the other values, we will stick
with the default values. If there are no values in the Peaklist of GC/MS Data field,
enter the following values by typing each number and then clicking the Enter key, so
that each value appears on a separate line: 73, 147, 117, 190, 191, 148,
66, and 75. The query page should appear as shown in Figure 14.8.41. Press the
Find Metabolites button to launch the search.
16. After a few seconds, the results page should appear as shown in Figure 14.8.42.
The results appear in a multi-column table with the following columns: HMDB ID,
Common Name, Derivatized Name, Retention Index, Parent Mass, and Score.
This table is easily sorted by clicking on the column header hyperlinks. The user can
also search by any of the column fields by entering the query data into the text boxes
that appear above each column name. In this case, with L-lactic acid as the query
compound, there is only one hit (to itself). The HMDB column provides hyperlinked
text which, if clicked, takes the user to the corresponding MetaboCard. The user is
able to see the common name of the matching compounds as well as the name of the
derivatized compound. The Score column on the far right indicates the number of
query peaks that match the peak list for the compound in the database—in this case, 8
query peaks matched 8 peaks for L-lactic acid. As with the MS results tables, large hit
lists can easily be navigated with the convenient arrow bars (First, Previous, Next,
and Last) that appear above the results table. The user has the option of displaying
50, 100, or 150 rows at a time. The results table can also be exported as an Excel
table by clicking on the Export XLS text or icon.
GUIDELINES FOR UNDERSTANDING RESULTS
Exploring Human
Metabolites Using
the Human
Metabolome
Database
Basic Protocol 1
This particular protocol was designed to show users how to explore the Human Metabolome Database (HMDB) and to learn about a given metabolite (1methylhistidine), the enzymes that metabolize it, and the macromolecular partners that
interact with it. The intent is to give users a broad overview of the data content and
the capabilities of the HMDB. To summarize, steps 1 to 2 provide a brief description
of the HMDB home page and its text search tool. Steps 3 to 13 take the user on a tour
of a standard MetaboCard, highlighting the layout, content, and important visualization
and display tools. Steps 14 to 19 describe how to use the HMDB Browser, Chemical
Class Browser, Biofluid Browser, and Tissue Browser, while step 20 demonstrates how
14.8.40
Supplement 25
Current Protocols in Bioinformatics
the TextQuery tool can be used. Step 21 shows how the Data Extractor can be used
to construct very specific and elaborate searches about certain metabolites or metabolic
enzymes/macromolecular interacting partners, while step 22 highlights the content and
information that can be obtained from the HMDB’s Download page. Overall, the aim of
this protocol is to provide sufficient grounding and rationale to allow users to more fully
explore the HMDB on their own. It is also worth noting that this protocol did not cover
every aspect of the HMDB’s search and query capabilities. In particular, the ChemQuery
and the spectral search (NMR Search, MS/MS Search, and GC/MS Search) options
or their potential applications were not discussed. These query tools were discussed in
separate protocols (Basic Protocols 2 and 3).
Basic Protocol 2
This protocol outlines the procedures for using the HMDB’s chemical similarity search
routines. Steps 3 to 5 describe how to use the HMDB’s chemical structure drawing tools,
specifically its ChemSketch Java applet. This series of steps illustrates how ChemQuery
can be used find metabolites that are structurally related to other metabolites. Additionally
steps 8 to 9 outline some of the other available chemical structure search utilities available
in the HMDB, including the Show Similar Structures button that is available at the top
of every MetaboCard. This feature allows users to identify other compounds in the
HMDB that are structurally similar to their metabolite of interest. This kind of query
is particularly useful for researchers wishing to do comparative metabolite analysis or
comparative pathway analysis. It is worth noting that ChemQuery’s structure similarity
search will not find all metabolites related to dopamine. This result demonstrates one
of the algorithmic limitations of the ChemQuery search. Since the program only uses
SMILES strings and SMILES substrings as part of its query process, it can sometimes
miss structurally similar compounds. Furthermore, because SMILES strings depend
on the atom ordering in the MOL file, the sequence in which one draws the query
molecule in ChemSketch can change the syntax of the SMILES string. As a result, the
scoring/ordering of compounds generated via a ChemQuery structure search of a known
metabolite will differ from the scoring/ordering of compounds generated via a Show
Similar Structures search. To address these problems, the ChemQuery search algorithm
makes use of molecular weight, chemical formula, and identified chemical functionalities
as part of its scoring scheme. More sophisticated structure search tools are available that
use graph theory (subdirected graph isomorphisms) and structural superpositioning to
identify similar compounds. PubChem, in particular, offers an excellent on-line structure
query tool that employs these techniques.
Basic Protocol 3
This protocol outlines the procedures for identifying metabolites using the HMDB’s
spectral search routines. The intent is to give users a broad overview of the different
types of spectral matching that are available to HMDB users. To summarize, steps 1
to 5 provide a concrete example of how to identify a single compound, in this case
1-methylhistidine, using NMR Search, while steps 6 to 7 demonstrate how to identify
a mixture of compounds using NMR Search. Steps 8 to 10 outline the procedure for
identifying compounds via MS Search. Steps 11 to 13 take the user through an example
of how to perform an MS/MS search, while steps 14 to 16 illustrate how to search
for metabolites using GC/MS Search. Overall, it is hoped that this protocol provides
a sufficient sampling of the HMDB’s spectral search capabilities, and that users will
explore these capabilities further using query data that is relevant to their research.
One of the HMDB’s great strengths is that it contains spectra of hundreds of common
metabolites collected under controlled and clearly defined, aqueous conditions. There
are many other spectral databases, for example, NMRShiftDB (Steinbeck et al., 2003),
Spectral Database for Organic Compounds (SDBS; http://riodb01.ibase.aist.go.jp/sdbs/),
Cheminformatics
14.8.41
Current Protocols in Bioinformatics
Supplement 25
Golm Metabolome Database (Kopka et al., 2005), and the NIST Spectral Database
(Ausloos et al., 1999), that contain spectra collected in organic solvents or spectra
from compounds that are not metabolites, or, at least, not mammalian metabolites. It
is useful to note that the HMDB has a comprehensive collection of NMR spectra (724
metabolites), MS/MS spectra (667 metabolites), and GC/MS spectra (231 metabolites),
making it a valuable resource for the identification of metabolites by spectral matching.
The usefulness of the HMDB’s spectral search capabilities will only improve as the size
of the spectral libraries increases.
COMMENTARY
Background Information
Exploring Human
Metabolites Using
the Human
Metabolome
Database
Enabling metabolomics research
Metabolomics is a relatively new addition to the “omics” sciences. As a consequence it is still evolving some of its basic
computational infrastructure (Wishart, 2007).
Whereas most data in the field of proteomics,
genomics, or transcriptomics is readily available and easily analyzed through on-line electronic databases, most metabolomic data is
still housed in books, journals, and other paper
archives. Metabolomics also differs from the
other “omics” sciences because of its strong
emphasis on chemicals and analytical chemistry techniques such as NMR, GC-MS, or LCMS. As a result, the analytical software used
in metabolomics is often quite different than
most of the software used in genomics, proteomics, or transcriptomics (Wishart, 2007).
The field of metabolomics is not only concerned with the identification and quantification of metabolites, it is also concerned with relating metabolite data to genes, proteins, pathways, physiology, and phenotypes. As a result,
metabolomics requires that whatever chemical
information it generates must be linked to both
biochemical causes and physiological consequences. This means that metabolomics must
combine two very different fields of informatics: bioinformatics and cheminformatics.
Despite these differences, metabolomics
still shares many of the same computational
needs with genomics, proteomics, and transcriptomics. All four “omics” techniques require electronically accessible and searchable databases, all of them require software
to interpret or process data from their own
high-throughput instruments, and all require
software tools to predict or model properties, pathways, and processes. These shared
computational needs are the common thread
that links metabolomics with all of the other
“omics” sciences, and ultimately to systems
biology.
A central focus of metabolomics is on characterizing dozens of metabolites at a time and
then using these metabolites or combinations
of metabolites to identify disease biomarkers or model large-scale metabolic processes.
As a result, metabolomics researchers need
databases that can be searched not just by
pathways or compound names, but also by
NMR spectra, MS spectra, GC-MS retention indices, chemical structures, or chemical concentrations. In addition to these query
requirements, metabolomics researchers routinely need to search for metabolite properties, tissue/organ locations, or metabolitedisease associations. Therefore, metabolomics
databases require information not only about
compounds and reaction diagrams, but also
data about physico-chemical properties, compound concentrations, biofluid or tissue locations, subcellular locations, known disease
associations, nomenclature, descriptions, enzyme data, mutation data, and characteristic MS or NMR spectra. These data need to
be readily available, experimentally validated,
fully referenced, easily searched, and readily
interpreted, and they need to cover as much of
a given organism’s metabolome as possible.
These are very tall orders, but the HMDB
was constructed in an attempt to address all of
the above-mentioned database needs. Indeed, a
key feature that distinguishes the HMDB from
other metabolic resources is its extensive support for higher-level database searching and
selection functions. As seen in the tutorials
provided here, the HMDB offers a wide variety of searching and browsing tools including
a Boolean text search (Basic Protocol 1), a relational data extraction tool (Basic Protocol 1),
a chemical structure search utility (Basic
Protocol 2), a local BLAST search that
supports both single and multiple sequence
queries, an MS spectral matching tool (Basic
Protocol 3), a GC-MS spectral matching facility (Basic Protocol 3), and an NMR spectral
search tool (Basic Protocol 3). These spectral
query tools are particularly useful for identifying compounds via MS or NMR data from
other metabolomic studies.
14.8.42
Supplement 25
Current Protocols in Bioinformatics
One of the most obvious trends in computational metabolomics is the growing alignment or integration of metabolomics with systems biology. This integration will require
that metabolomics methods and data reduction techniques will have to become much
more quantitative. While chemometric methods for spectral analysis will likely continue
to be popular among some groups for certain
types of applications, the long-term trend in
metabolomics seems to be toward rapid/highthroughput compound identification and quantification. These so-called targeted or quantitative methods will require greater reliance
on spectral libraries and spectral standards
and will, no doubt, lead to the appearance of
organism-specific metabolite databases. This
trend towards large-scale metabolite identification and quantification will likely encourage
metabolomics researchers to adopt many of the
analytical approaches commonly used in transcriptomics and proteomics, where transcript
and protein levels are routinely quantified,
compared, and analyzed. Given the importance that bioinformatics has played in establishing genomics and proteomics, it is likely
that continuing developments in bioinformatics will have an equally profound impact on
metabolomics and, ultimately, in its role in
systems biology.
use (or abuse). If users experience consistent problems with either Web site access or
program performance, they are encouraged to
contact the HMDB staff or the authors of this
unit.
The HMDB is a curated database, not an
archival database. This means that the data in
the HMDB are compiled, assessed, and entered by trained curators. Every effort is made
to ensure the data in the HMDB is as correct,
complete, and as current as possible.
However, as with any database, the HMDB
contains some errors. These may be errors arising from data entry, metabolite deaccessioning
(removing a metabolite but leaving the HMDB
link in place), or recent revisions to our knowledge about a particular compound or associated enzyme. If any users believe they have
identified an error, we would encourage them
to contact the HMDB staff as soon as possible.
Usually, errors can be confirmed and corrected
within a few days. Likewise, users may find
that some data are missing in certain MetaboCards. In many cases, the information (melting point, solubility, pKa , enzyme, or transporter) has never been collected or is not yet
known. However, if users become aware of a
new source of information that fills in a missing data field, they are encouraged to contact
the HMDB staff.
Critical Parameters and
Troubleshooting
Acknowledgements
To facilitate consistency and simplicity, the
HMDB has relatively few user-settable parameters. One component of the HMDB that can
cause users some problems is the Data Extractor tool. This relational query system requires that the users know something about the
content in different HMDB fields, including
number ranges (for molecular weight or pKa ),
or type of textual content. Obviously, typing
in a negative molecular weight, a misspelled
or nonsense word, a number where a word
is expected, or a word where a number is expected will cause some unpredictable behavior
in the search engine. If a questionable result
is generated or if a query seems to “hang” for
more than 1 min, users are requested to doublecheck the query to make sure it contains none
of the above errors. Nonresponsiveness can be
a problem with any Web site. This may reflect heavy use, periodic maintenance, server
hardware problems, or the submission of an
erroneously structured query that, in effect,
searches and grabs all data in the database. The
HMDB is heavily used and certainly its performance may be compromised by this heavy
The authors wish to thank Genome Alberta
and Genome Canada for financial support in
the development and maintenance of the Human Metabolome Database.
Literature Cited
Ausloos, P., Clifton, C.L., Lias, S.G., Mikaya, A.I.,
Stein, S.E., Tchekhovskoi, D.V., Sparkman,
O.D., Zaikin, V., and Zhu, D. 1999. The critical evaluation of a comprehensive mass spectral
library. J. Am. Soc. Mass Spectrom. 10:287-299
[Published erratum appears in J. Am. Soc. Mass
Spectrom. 10:565].
Bairoch, A., Apweiler, R., Wu, C.H., Barker, W.C.,
Boeckmann, B., Ferro, S., Gasteiger, E., Huang,
H., Lopez, R., Magrane, M., Martin, M.J.,
Natale, D.A., O’Donovan, C., Redaschi, N., and
Yeh, L.S. 2005. The Universal Protein Resource
(UniProt). Nucleic Acids Res. 33:D154-D159.
Bateman, A., Coin, L., Durbin, R., Finn, R.D.,
Hollich, V., Griffiths-Jones, S., Khanna, A.,
Marshall, M., Moxon, S., Sonnhammer, E.L.,
Studholme, D.J., Yeats, C., and Eddy, S.R. 2004.
The Pfam protein families database. Nucleic
Acids Res. 32:D138-D141.
Brooksbank, C., Cameron, G., and Thornton,
J. 2005. The European Bioinformatics Institute’s data resources: Towards systems biology.
Nucleic Acids Res. 33:D46-D53.
Cheminformatics
14.8.43
Current Protocols in Bioinformatics
Supplement 25
Frézal, J. 1998. Genatlas database, genes and development defects. C. R. Acad. Sci. III. 321:805817.
Wishart, D.S. 2007. Current progress in computational metabolomics. Brief. Bioinform. 8:279293.
Hamosh, A., Scott, A.F., Amberger, J.S., Bocchini,
C.A., and McKusick, V.A. 2005. Online
Mendelian Inheritance in Man (OMIM), a
knowledgebase of human genes and genetic disorders. Nucleic Acids Res. 33:D514-D517.
Wishart, D.S., Yang, R., Arndt, D., Tang, P., and
Cruz, J. 2005. Dynamic cellular automata: An
alternative approach to cellular simulation. In
Silico Biol. 5:139-161.
Kanehisa, M., Goto, S., Kawashima, S., Okuno,
Y., and Hattori, M. 2004. The KEGG resource
for deciphering the genome. Nucleic Acids Res.
32:D277-D280.
Kopka, J., Schauer, N., Krueger, S., Birkemeyer,
C., Usadel, B., Bergmüller, E., Dörmann,
P., Weckwerth, W., Gibon, Y., Stitt, M.,
Willmitzer, L., Fernie, A.R., and Steinhauser, D.
2005. [email protected]: The Golm Metabolome
Database. Bioinformatics 21:1635-1638.
Krummenacker, M., Paley, S., Mueller, L., Yan,
T., and Karp, P.D. 2005. Querying and computing with BioCyc databases. Bioinformatics
21:3454-3455.
Manber, U. and Bigot, P. 1997. USENIX Symposium on Internet Technologies and Systems (NSITS’97), Monterey, Calif., pp.231-239.
USENIX, Berkeley, Calif.
Rebhan, M., Chalifa-Caspi, V., Prilusky, J., and
Lancet, D. 1998. GeneCards: A novel functional genomics compendium with automated
data mining and query reformulation support.
Bioinformatics 14:656-664.
Sadowski, J. and Gasteiger, J. 1993. From atoms to
bonds to three-dimensional atomic coordinates:
Automatic model builders. Chem. Rev. 93:25672581.
Smith, C.A., O’Maille, G., Want, E.J., Qin, C.,
Trauger, S.A., Brandon, T.R., Custodio, D.E.,
Abagyan, R., and Siuzdak, G. 2005. METLIN:
A metabolite mass spectral database. Ther. Drug
Monit. 27:747-751.
Steinbeck, C., Krause, S., and Kuhn, S. 2003.
NMRShiftDB-constructing a free chemical information system with open-source components. J. Chem. Inf. Comput. Sci. 43:1733-1739.
Wain, H.M., Lush, M., Ducluzeau, F., and Povey,
S. 2002. Genew: The human gene nomenclature
database. Nucleic Acids Res. 30:169-171.
Walther, D. 1997. WebMol—a Java-based PDB
viewer. Trends Biochem. Sci. 22:274-275.
Weininger, D. 1988. SMILES 1. Introduction and
encoding rules. J. Chem. Inf. Comput. Sci.
28:31-38.
Exploring Human
Metabolites Using
the Human
Metabolome
Database
Wheeler, D.L., Barrett, T., Benson, D.A., Bryant,
S.H., Canese, K., Church, D.M., DiCuccio,
M., Edgar, R., Federhen, S., Helmberg, W.,
Kenton, D.L., Khovayko, O., Lipman, D.J.,
Madden, T.L., Maglott, D.R., Ostell, J., Pontius,
J.U., Pruitt, K.D., Schuler, G.D., Schriml,
L.M., Sequeira, E., Sherry, S.T., Sirotkin,
K., Starchenko, G., Suzek, T.O., Tatusov, R.,
Tatusova, T.A., Wagner, L., and Yaschenko, E.
2005. Database resources of the National Center
for Biotechnology Information. Nucleic Acids
Res. 33:D39-D45.
Wishart, D.S., Knox, C., Guo, A., Shrivastava, S.,
Hassanali, M., Stothard, P., and Woolsey, J.
2006. DrugBank: A comprehensive resource for
in silico drug discovery and exploration. Nucleic
Acids Res. 34:D668-D672.
Wishart, D.S., Tzur, D., Knox, C., Eisner, R.,
Guo, A.C., Young, N., Cheng, D., Jewell, K.,
Arndt, D., Sawhney, S., Fung, C., Nikolai, L.,
Lewis, M., Coutouly, M.-A., Forsythe, I., Tang,
P., Shrivastava, S., Jeroncic, K., Stothard, P.,
Amegbey, G., Block, D., Hau, D.D., Wagner,
J., Miniaci, J., Clements, M., Gebremedhin, M.,
Guo, N., Zhang, Y., Duggan, G.E., MacInnis,
G.D., Weljie, A.M., Dowlatabadi, R., Bamforth,
F., Clive, D., Greiner, R., Li, L., Marrie, T.,
Sykes, B.D., Vogel, H.J., and Querengesser,
L. 2007. HMDB: The Human Metabolome
Database. Nucleic Acids Res. 35:D521-D526.
Internet Resources
http://hmdb.ca/
Human Metabolome Database.
http://www.genome.jp/dbget-bin/
www bfind?compound
KEGG Ligand Database for Chemical Compounds.
http://biocyc.org/META/server.html
BioCyc.
http://bigg.ucsd.edu/
BiGG Database.
http://en.wikipedia.org/wiki/Main Page
Wikipedia.
http://metlin.scripps.edu/metabo search.php
Metlin.
http://pubchem.ncbi.nlm.nih.gov/
PubChem.
http://www.ebi.ac.uk/chebi/
ChEBI.
http://www.acdlabs.com/products/java/sda/
ACD/Structure Drawing Applet.
http://www.cmpharm.ucsf.edu/∼walther/webmol.
html
WebMol Web site.
http://www.rcsb.org/pdb/home/home.do
PDB.
http://www.bmrb.wisc.edu/
BMRB.
http://www.ncbi.nlm.nih.gov/pubmed/
PubMed.
http://www.ncbi.nlm.nih.gov/omim/
OMIM.
http://www.metagene.de/programm/
tdb.prg?esp=index
Metagene.
14.8.44
Supplement 25
Current Protocols in Bioinformatics
http://www.genome.jp/dbget-bin/
www bfind?pathway
KEGG Pathway Database.
http://wishart.biology.ualberta.ca/SimCell/
SimCell.
http://www.ncbi.nlm.nih.gov/Genbank/
GenBank.
http://expasy.org/sprot/
Swiss-Prot.
http://www.geneontology.org/
Gene Ontology.
http://pfam.sanger.ac.uk/
Pfam.
http://www.genome.jp/dbget-bin/
www bfind?enzyme
KEGG Ligand Database for Enzyme Nomenclature.
http://www.genecards.org/index.shtml
GeneCards.
http://www.dsi.univ-paris5.fr/genatlas/
Genatlas.
http://www.genenames.org/
HUGO Gene Nomenclature Committee (HGNC).
http://www.ncbi.nlm.nih.gov/projects/SNP/
dbSNP.
http://nmrshiftdb.ice.mpg.de/
NMRShiftDB.
http://www.nist.gov/srd/nist1a.htm
NIST Spectral Database.
http://riodb01.ibase.aist.go.jp/sdbs/
Spectral Database for Organic Compounds.
http://csbdb.mpimp-golm.mpg.de/
Golm Metabolome Database.
Cheminformatics
14.8.45
Current Protocols in Bioinformatics
Supplement 25
ChEBI: An Open Bioinformatics and
Cheminformatics Resource
UNIT 14.9
Kirill Degtyarenko,1 Janna Hastings,1 Paula de Matos,1 and Marcus Ennis1
1
European Bioinformatics Institute, Wellcome Trust Genome Campus, Hinxton,
Cambridgeshire, United Kingdom
ABSTRACT
Chemical Entities of Biological Interest (ChEBI) is a freely available dictionary of
molecular entities focused on “small” chemical compounds. This unit provides a detailed
guide to browsing, searching, downloading, and programmatic access to the ChEBI
C 2009 by John Wiley & Sons,
database. Curr. Protoc. Bioinform. 26:14.9.1-14.9.20. Inc.
Keywords: chemical compound r chemical nomenclature r InChI r InChIKey r
IUPAC r molecular entity r ontology r substructure search r similarity search r
Web Services
INTRODUCTION
One cannot describe any entity or process in molecular biology without referring to
molecular entities. Although bioinformatics came into existence primarily to serve
the molecular biology community and traditionally was focused on biological macromolecules (proteins and nucleic acids), chemical entities are referred to frequently within
biological databases. For instance, the molecules bound to a polypeptide chain are
listed in the feature table of the UniProt database (http://www.uniprot.org); the names
of substrates and products of enzymatic reactions populate the reaction field of IntEnz
(http://www.ebi.ac.uk/intenz/); and drugs and mutagens affect the patterns of gene expressions and are reported as experimental conditions in microarray experiments deposited in
ArrayExpress (http://www.ebi.ac.uk/arrayexpress; UNIT 7.13). However, since small chemical compounds are not the core data in these databases, they are typically present as
free text in annotations. Free-text annotations are easy for a human audience to read and
understand, but are difficult for computers to parse, can vary in quality from database
to database, and can use different terminology to mean the same thing (even within the
same database, if for example different annotators have used different terminology).
In addition to problems common to any free-text annotations, chemical entities pose
a particularly difficult problem for annotation. Chemical names, especially common
names, may contain ambiguity as to the exact structure of the molecular entity that is
intended by the use of the name. For instance, the stereodescriptors are often dropped
from the names of canonical amino acids; thus, the name “alanine” is frequently used
instead of (presumably) L-alanine even though D-alanine is also synthesized in living
organisms. On the other hand, there may be several valid names corresponding to the
same compound. This derives from the use of different naming systems (Degtyarenko
et al., 2007).
Chemical Entities of Biological Interest (ChEBI) is a freely available dictionary of
molecular entities focused on such “small” chemical compounds. Molecules directly
encoded by the genome (such as nucleic acids, proteins, and peptides derived from
proteins by cleavage) are not as a rule included in ChEBI, as these are amply represented
in other databases.
Cheminformatics
Current Protocols in Bioinformatics 14.9.1-14.9.20, June 2009
Published online June 2009 in Wiley Interscience (www.interscience.wiley.com).
DOI: 10.1002/0471250953.bi1409s26
C 2009 John Wiley & Sons, Inc.
Copyright 14.9.1
Supplement 26
ChEBI provides standardized descriptions of molecular entities that enable other
databases at the EMBL-EBI and worldwide to annotate their entries in a consistent
fashion. ChEBI focuses on high-quality manual annotation, nonredundancy, and provision of a chemical ontology rather than full coverage of the vast chemical space. In
addition to molecular entities, ChEBI contains groups (parts of molecular entities) and
classes of entities. A major feature of ChEBI is that it includes a chemical ontology,
which allows the relationships between molecular entities or classes of entities and their
parents and/or children to be specified in a structured way.
ChEBI uses nomenclature, symbolism, and terminology endorsed by the International
Union of Pure and Applied Chemistry (IUPAC) and the Nomenclature Committee of
the International Union of Biochemistry and Molecular Biology (NC-IUBMB). All the
data in ChEBI is nonproprietary or derived from a nonproprietary source and is therefore
freely available to anyone. In addition, each data item is fully traceable and explicitly
referenced to the original source.
ChEBI aims to address the problems of chemical annotation within biological databases
by providing a definitive reference controlled vocabulary and ontology of chemical
entities which are of relevance to the biological community.
BASIC
PROTOCOL 1
NAVIGATION AND SIMPLE SEARCH
ChEBI can be searched using a text query via a simple or advanced search. This protocol
demonstrates how to perform a text search and familiarizes the user with the ChEBI Web
pages.
Necessary Resources
Hardware
A computer with Internet access
Software
Internet browser, e.g., Internet Explorer (http://www.microsoft.com/ie), Netscape
(http://browser.netscape.com/), Firefox (http://www.mozilla.org/firefox/), or
Safari (http://www.apple.com/safari); Java version 5 or higher
Getting started
1. Use the Internet browser to open the ChEBI home page (http://www.ebi.ac.uk/chebi/;
Fig. 14.9.1).
This page is the starting point for exploring ChEBI. The body of the page contains an
introduction to the scope of ChEBI, the featured Entity of the Month, a note on data sources,
the list of data fields, the official ChEBI publication to cite, and Acknowledgements. The
menu on the left of the main page facilitates the navigation through the ChEBI Web site.
In the space under this menu, the latest news, updates, and developments are announced
via an RSS Feed.
ChEBI: An Open
Bioinformatics
and
Cheminformatics
Resource
2. To change the user settings, click on Preferences in the left-hand side menu or use
a link (http://www.ebi.ac.uk/chebi/userSettingsForward.do). Currently, the ChEBI
Preferences menu allows the user to choose the language using a drop-down menu
(from English, French, German, Russian and Spanish); the chemical structure view
(static image or applet) using radio buttons; and the ChEBI Ontology view (“parents
and children” only or tree view) using radio buttons. For this protocol, we recommend
that Applet be chosen. After choosing the Preferences, click on the Submit Preferences
button. The browser will remember the user settings for this and subsequent sessions.
14.9.2
Supplement 26
Current Protocols in Bioinformatics
Figure 14.9.1
The ChEBI home page.
3. To use the simple text search, just enter (type or copy) your search query into the
search box located at the top left of the ChEBI front page. The search query may be
any data associated with an entity such as a name, formula, CAS Registry Number,
InChI, or InChIKey string (Heller and McNaught, 2009). For instance, type the
formula C6H12O6 into the search box.
4. Click on the Search button and view the list of search results (entitled ChEBI Results).
When there are multiple results returned from a search, the search takes you to a search
results page. Search results may be exported for import into other applications. When
there is only one result, the search takes you directly to the entity result page,
bypassing the search results table.
Cheminformatics
14.9.3
Current Protocols in Bioinformatics
Supplement 26
Wildcards are available for both the simple and the advanced search. The wildcard
character is “%”. A wildcard character allows you to find compounds by typing in a
partial name. The search engine will then try to find names matching the pattern you
have specified using the wildcard character. To match terms that start with your search
term, add the wildcard character to the end of your query. For example, searching for
aceto% will find compounds such as acetochlor, acetophenazine, and acetophenazine
maleate. To match terms that end with your search term, add the wildcard character to
the start of your query. For example, searching for %azine will find compounds such
as 2-(pentaprenyloxy)dihydrophenazine, acetophenazine, and 4-(ethylamino)-2-hydroxy6-(isopropylamino)-1,3,5-triazine. Any number of wildcard characters may be used within
a search term, thus affording considerable scope within the search facility. To match
terms that contain your search term, add the wildcard character to the start and the
end of your query. For example, searching for %propyl% will find compounds such as
(R)-2-hydroxypropyl-CoM, 2-isopropylmaleic acid, and 2-methyl-1-hydroxypropyl-TPP.
View a ChEBI entry page
5. On the ChEBI Results page, click on any of the ChEBI identifier hyperlinks to
navigate to the individual ChEBI entry. A sample ChEBI entry (Main page) is shown
in Figure 14.9.2.
The main page of a typical ChEBI entry may contain: (1) a unique, unambiguous, recommended ChEBI name (e.g., cisplatin) and an associated stable unique identifier (e.g.,
CHEBI:27899), (2) molecular formula (e.g., H6Cl2N2Pt), (3) a diagram of the chemical structure, where appropriate (particular compounds and groups, but generally not
classes), as well as data derived from chemical structures, such as InChI, InChIKey and
SMILES strings, charge and mass, (4) a definition where appropriate (mostly for classes),
(5) a collection of synonyms, including the IUPAC recommended name for the entity where
appropriate, and brand names and INNs for drugs. Flags are used to indicate different
languages, where synonyms are not in English, (6) a collection of cross-references to other
databases (where these are sourced from non-proprietary origins) and Registry Numbers,
and (7) links to the ChEBI ontology.
6. To see the automatic cross-reference page, click on the Automatic Xrefs tab at the
top of the main entry view screen (see Fig. 14.9.3).
A number of databases are automatically cross-referenced to ChEBI entities for each
release, and these automatic cross-references are found in the Automatic Xrefs page.
This page contains the “EB-eye”-style (http://www.ebi.ac.uk/inc/help/search help.html)
classification of the databases by categories.
7. The chemical structure of the entry is shown in the upper-left corner of the main
entry page. Some ChEBI entries contain more than one representation of the same
chemical structure. Use entry CHEBI:48095 as an example. To see all structures, click
on “more structures >>.” To manipulate the structures, double-click on a structure of
interest. This will invoke the MarvinView applet in a separate window (Fig. 14.9.4).
The MarvinView visualization is especially useful for 3-D structures.
8. To save a structure of interest in MDL .mol format, click on the Molfile link next
to the diskette icon. For instance, find corrin (CHEBI:33221) and save the default
structure. ChEBI automatically assigns file name ChEBI 33221.mol.
9. To print out the ChEBI entry, use the Printer Friendly View option on the ChEBI
menu.
ChEBI: An Open
Bioinformatics
and
Cheminformatics
Resource
Navigating the ChEBI ontology
10. The ChEBI ontology can be used to navigate to related entries within ChEBI via the
ChEBI ontology section within an entry page. To determine whether an entity is an
instance of another entity, look for the “is a” relationship in the ChEBI Ontology
under the Parents sub-heading. For example, find chloroform (CHEBI:35255) and
you can determine that chloroform is a chloromethane (CHEBI:23148) by the use of
the is a relationship in the ChEBI Ontology section. Click on chloromethanes and
14.9.4
Supplement 26
Current Protocols in Bioinformatics
Figure 14.9.2
The main page of a sample ChEBI entry.
you see that “chloromethanes” is itself an instance of chloroalkanes (CHEBI:23128).
You can continue navigating the ontology by clicking on the is a relationships in the
Parents section.
Is a implies that Entity A is an instance of Entity B.
11. You can determine parthood within the ChEBI ontology by using the
“has part” relationship. For example, find the entry tetracyanonickelate(2–)
(CHEBI:49928) and scroll down to the ChEBI Ontology section. Click on
potassium tetracyanonickelate(2–) (CHEBI:30071), which you can see has part
tetracyanonickelate(2–) (CHEBI:49928).
Has part is used to indicate the relationship between the whole and a part of it.
Cheminformatics
14.9.5
Current Protocols in Bioinformatics
Supplement 26
Figure 14.9.3
The Automatic Xrefs page of a sample ChEBI entry.
12. By using the “is conjugate acid of” and “is conjugate base of” relationships, you
can find entries that are related via their conjugate acids or their conjugate bases. For
example, find the neutral pyruvic acid (CHEBI:32816) and scroll down to the ChEBI
Ontology section. You can determine that pyruvic acid is the conjugate acid of the
pyruvate anion (CHEBI:15361), while as a corollary pyruvate is the conjugate base
of the acid.
Is conjugate base of and is conjugate acid of are cyclic relationships used to connect
acids with their conjugate bases.
13. The “is tautomer of” relationship allows you to find related compounds interconnected via the chemical reaction called tautomerization. Find the entry L-serine
(CHEBI:17115) and scroll down to the ChEBI Ontology section to view its tautomer zwitterion (CHEBI:33384), indicated by the is tautomer of relationship.
ChEBI: An Open
Bioinformatics
and
Cheminformatics
Resource
Is tautomer of is a cyclic relationship used to show the interrelationship between two
tautomers, where the differences between the structures are significant enough to warrant
their separate inclusion in ChEBI. Tautomers are defined as isomers that differ only in the
positions of hydrogen atoms and electrons, the remainder of the skeletons being the same.
14.9.6
Supplement 26
Current Protocols in Bioinformatics
Figure 14.9.4
The MarvinView applet.
14. You can use the “is enantiomer of” relationship to find mirror images of a chemical
structure. Find the entry D-alanine (CHEBI:15570) and scroll down to the ChEBI
Ontology section. Click on L-alanine (CHEBI:16977), which is related via the is
enantiomer of relationship and note that the chemical structures are mirror images
of each other.
Is enantiomer of is a cyclic relationship used when two entities are mirror images of and
nonsuperposable upon each other.
15. The “has functional parent” relationship allows you to find related molecular entities
based on whether an entity has one or more characteristic groups from which the other
Cheminformatics
14.9.7
Current Protocols in Bioinformatics
Supplement 26
can be derived from functional modification. Find the entry 16α-hydroxyprogesterone
(CHEBI:15826) and scroll down to the ChEBI Ontology section. Here you can see
that 16α-hydroxyprogesterone can be derived by functional modification (in this case,
16α-hydroxylation) of progesterone (CHEBI:17026).
Has functional parent is used to denote the relationship between two molecular entities
(or classes of entities), one of which possesses one or more characteristic groups from
which the other can be derived by functional modification.
16. Find the entry 1,4-naphthoquinone (CHEBI:27418) and scroll down to the ChEBI
Ontology section. Here you can see that 1,4-naphthoquinone (CHEBI:27418), via the
“has parent hydride” relationship, has as its parent hydride the cyclic hydrocarbon
naphthalene (CHEBI:16482).
Has parent hydride denotes the relationship between an entity and its parent hydride. The
parent hydride is defined by IUPAC as “an unbranched acyclic or cyclic structure or an
acyclic/cyclic structure having a semisystematic or trivial name to which only hydrogen
atoms are attached” (http://goldbook.iupac.org/P04405.html).
17. You can find substituent groups related to an entity by using the “is substituent
group from” relationship. Find the entity L-valino group (CHEBI:32854) and scroll
down to the ChEBI Ontology section of the entry. Here you can see that the Lvalino group (CHEBI:32854) is derived by a proton loss from the N atom of L-valine
(CHEBI:16414).
Is substituent group from indicates the relationship between a substituent group (or atom)
and its parent molecular entity, from which it is formed by loss of one or more protons or
simple groups such as hydroxy groups.
18. The “has role” relationship allows you to see the particular behavior that the entity of
interest may exhibit. Find the entry pseudoephedrine (CHEBI:51209) and scroll down
to the ChEBI Ontology section. Here you can see that pseudoephedrine has roles of
sympathomimetic agent (CHEBI:35524), bronchodilator agent (CHEBI:35523), and
anti-asthmatic drug (CHEBI:49167).
Has role is used to denote the relationship between a molecular entity or a subatomic
particle and a role it may play, either naturally or by means of human application. This is
the only relationship that is allowed between the Molecular Structure and Role ontologies,
or between the Subatomic Particle and Role ontologies.
Browse ChEBI via the Periodic Table
19. Click on the left-hand menu item labeled Browse to expand the browse menu, and
then click again on the Periodic Table link to open up the periodic table browser
interface. Click on the symbol for Oxygen to browse the classes of molecular entities
containing Oxygen.
20. The Periodic Table browser differentiates between molecular entities and the elements. Click on the header tab Elements to open the Periodic Table browser for the elements. Clicking on Oxygen now takes you to the entry page for the Oxygen element.
ChEBI: An Open
Bioinformatics
and
Cheminformatics
Resource
Browse ChEBI via the ontology
21. Click on the Browse Ontology menu in the left-hand corner of the page.
This link will take you to the Ontology Lookup service (Côté et al., 2006;
http://www.ebi.ac.uk/ontology-lookup/), which will allow you to browse the data in
ChEBI via its three sub-ontologies, namely molecular structure, role, and subatomic
particle.
ChEBI Ontology is subdivided into three separate sub-ontologies: (1) Molecular Structure,
in which molecular entities or parts thereof are classified according to composition and
structure, e.g., hydrocarbons, carboxylic acids, tertiary amines; (2) Role, which classifies
14.9.8
Supplement 26
Current Protocols in Bioinformatics
entities either on the basis of their role within a biological and chemical context (e.g.,
antibiotic, antiviral agent, coenzyme, hormone, acid, base) or on the basis of their intended
use by humans (e.g., pesticide, antirheumatic drug, fuel); and (3) Subatomic Particle, which
classifies particles which are smaller than atoms, e.g., electron, photon, nucleon.
22. Expand the molecular structure sub-ontology by clicking on the + (plus) icon to
the left of the term. You will see that molecular structure is sub-divided into two
classes, namely molecular entities and groups. You can navigate further by similarly
expanding any child terms within the ontology.
23. Expand the following path: “molecular entities,” “inorganic molecular entities,” “inorganic salt,” “inorganic chloride salt,” and then click on the child term “zinc dichloride.” On the right-hand side of the screen, a number of synonyms will appear relating
to this term (zinc dichloride). Scroll down the browser page to the Term Hierarchy
graphical display, which is on the right-hand side of the screen, below the synonyms
and cross-references box. The diagram shows all paths to the ChEBI ontology root
from the selected term (zinc dichloride, in this example).
ADVANCED SEARCH
The advanced search provides for additional granularity of category to search in, as well
as the option of using the Boolean operations when searching. The structure (substructure
and similarity) search allows a chemical diagram to be used as a search query. Both text
and structure search can be combined within a single query. This protocol demonstrates
how to perform both an advanced text search and a structure search.
BASIC
PROTOCOL 2
Necessary Resources
Hardware
A computer with Internet access
Software
Internet browser, e.g., Internet Explorer (http://www.microsoft.com/ie), Netscape
(http://browser.netscape.com/), Firefox (http://www.mozilla.org/firefox/), or
Safari (http://www.apple.com/safari); Java version 5 or higher
Structure-based search
The structure-based search facility within ChEBI allows you to search for structures in
the database based on a provided structure, which may be drawn or uploaded.
1. Use the Internet browser to open the ChEBI home page (http://www.ebi.ac.uk/chebi/;
Fig. 14.9.1).
2. To access the advanced search, select the Advanced Search link from the left-hand
menu. This will open a screen showing the search box shown in Figure 14.9.5.
3. Use the ChemAxon MarvinSketch applet to enter structures.
The top menu bar allows access to most of the available functionality of the sketching applet, grouped into menus for file manipulation, general editing functionality such
as copy/paste, viewing manipulations such as display and color options, and various
structure-drawing utilities. In addition to the top menu bar, various structure-drawing
tools and utilities are available from the left-hand graphical button menu bar, various
atom options from the right-hand-side button menu bar, and structure templates from the
bottom-button menu bar. To upload the structure in one of the chemical formats, such
as .mol or .pdb, go to File→ Open and navigate through your file system to choose
the file. A comprehensive collection of animations illustrating the use of MarvinSketch,
including structure drawing and file operations, is available at the ChemAxon Web site
(http://www.chemaxon.com/anim/marvin/sketch bond/drawbond.html).
Cheminformatics
14.9.9
Current Protocols in Bioinformatics
Supplement 26
Figure 14.9.5
The Advanced Search page.
4. After the structure is drawn or uploaded, choose one of three available search options:
Substructure, Similarity, or Identity.
5. For example, upload the structure of corrin (ChEBI 33221.mol) saved in Basic
Protocol 1, choose Identity, and click on the Search button. As expected, the search
brings just one result, viz. CHEBI:33221.
Identity searches are based on the InChI, which means that an InChI is generated from
the drawn or uploaded structure, and the database is then searched for exact matches
to that InChI. This means that the identity search is subject to the same limitations as
the uniqueness of InChIs. For example, searching for structures identical with cisplatin
(CHEBI:27899) returns both cisplatin and transplatin (CHEBI:35852), since these have
identical InChIs. However, in most cases an identity search will take you directly to the
entry page for the single structure you have drawn, if it exists in the database.
6. You can reuse your structural query simply by hovering with the pointer over the
structure diagram. This time, choose the Substructure search and left-click.
ChEBI: An Open
Bioinformatics
and
Cheminformatics
Resource
Chemical substructure and similarity searches within ChEBI are based on the Chemistry
Development Kit (CDK) fingerprints (Steinbeck et al., 2006; http://cdk.sourceforge.net). A
fingerprint of a chemical structure is a way of representing special characteristics of that
structure in an easily searchable form. For substructure searching, fingerprints are used as
effective screening devices to narrow the set of candidates for a full substructure search. If
all bits in a query fingerprint are also present in the target fingerprint of a stored database
structure, this structure is subjected to the computationally expensive subgraph-matching
algorithm. These bit operations are very fast and independent of the number of atoms in
a structure due to the fixed length of the fingerprint.
14.9.10
Supplement 26
Current Protocols in Bioinformatics
Figure 14.9.6
An Advanced Search result page.
7. On the Result page (Fig. 14.9.6), clicking on the relevant ChEBI accession hyperlinked under the search result image takes you to the entry page for that entity. In
addition, further structure-based searches may be performed by hovering the pointer
over any of the displayed images in the Results page (including the image of the
original structure query) and clicking on one of the search options, which passes that
structure directly to the search facility. For example, place the pointer over the image
of the original structure query and choose the Similarity search.
For similarity searching in ChEBI, fingerprints are used as input to the calculation of the
similarity of two molecules in the form of the Tanimoto coefficient, which is calculated as
the ratio:
T(a,b) = c/(a + b – c)
where c is the count of bits “on” (i.e., 1 not 0) in the same position in both of the two
fingerprints, a is the count of bits on in object A, and b is the count of bits on in object B
(Kochev et al., 2003). The Tanimoto coefficient varies in the range 0.0 to 1.0, with a score
of 1.0 indicating that the two structures are very similar (i.e., their fingerprints are the
same).
Text-based search
The text-based search facility in the Advanced Search allows you to combine your search
terms in order to narrow down your results. In addition, you can combine search terms
with the structure-based search.
Cheminformatics
14.9.11
Current Protocols in Bioinformatics
Supplement 26
8. The operator “All of these words” (AND) allows you to find a compound that contains
all of your search terms. For example, if you are searching for an organic acid with
formula C6H12O6, specifying acid C6H12O6 as the search term and selecting
All of these words as the search option will retrieve several acids including fuconic
acid and rhamnonic acid.
ChEBI provides the standard Boolean operators when searching for compounds. All search
terms need to be separated by a blank space.
9. The operator “Any of these words” (OR) allows you to type two or more words. It
then tries to find a compound that contains at least one of these words. For example,
if you wanted to find all compounds that contain either “silver” or “argent” as part of
their names or synonyms, type in the search string %silver% %argent%.
10. Sometimes, common words can be a problem when searching, as they can provide
too many results. The “Excluding words” (NOT) option can be used to limit the
result set. For example, if you were looking for a compound related to chlorine but
excluding acidic compounds, you could specify %chlor% as your search string but
qualify the search by specifying acid in the excluding words field.
The results of an advanced search are displayed in a grid. The results are paginated if
>15 results are retrieved, and if only one result is returned then the entry page for that
entity is loaded directly.
Searching in categories
This option allows you to narrow down your search by using the categories provided.
The categories include:
All: this allows you to search all the categories.
ChEBI ID: allows searching for specific ChEBI identifiers.
ChEBI Name: will search only for ChEBI names matching your search term.
Synonym: will search in all the synonyms available for this compound.
IUPAC Name: will search for IUPAC names.
Database Accession: allows searching for accession numbers from other sources.
Formula: will search for formula.
Registry Number: will search for CAS, Beilstein, or Gmelin Registry Numbers
matching your search criteria.
InChI/InChIKey: will search for InChI/InChIKey(s) matching your search criteria.
SMILES: will search for SMILES matching your search criteria.
Comment: allows searching for comments provided by the ChEBI annotators.
11. For example, type 007 and choose category Database Accession.
Searching with structures and text
This option allows you to narrow down your result set by combining your structure-based
search and your text-based search as a Boolean AND operation.
ChEBI: An Open
Bioinformatics
and
Cheminformatics
Resource
12. For example, go to the entry 1H-pyrrole (CHEBI:19203). Copy the chemical structure
into your clipboard by double clicking on the applet and selecting the Edit menu with
the option to Copy. Navigate to the Advanced Search page and paste the chemical
structure into the applet using the Edit menu on the applet. Type in %N2% and select
the category Formula to narrow down your search to include two nitrogen atoms.
Only substructures that have two nitrogen atoms in their formula will be returned as
part of the result set.
13. You may narrow down your search by selecting a cross-referenced database (default
is “All databases”). Use the structure of 1H-pyrrole to make a substructure search and
choose Beilstein database. The word Beilstein appears over the selection menu. Use
14.9.12
Supplement 26
Current Protocols in Bioinformatics
the same menu to choose ChemIDplus database. The word ChemIDplus appears over
the selection menu. The default Boolean operation is AND, therefore only the entries
that have 1H-pyrrole as a substructure and have both Beilstein Registry Numbers
and cross-references to ChemIDPlus will be returned as part of the result set. (If
you choose the Boolean operation OR, only the entries which have 1H-pyrrole as
a substructure and have either Beilstein Registry Numbers or cross-references to
ChemIDPlus will be returned as part of the result set.)
ACCESSING ChEBI VIA WEB SERVICES
The ChEBI Web Service provides a means for programmatic access to the ChEBI dataset.
This allows users to create their own applications, which query the ChEBI dataset from
within their application, without having to download and locally incorporate the full
dataset every time there is a new release. Web services are implemented as server
applications, to which many clients may connect over the Internet.
BASIC
PROTOCOL 3
Necessary Resources
Hardware
A computer with Internet access
Software
Internet browser, e.g., Internet Explorer (http://www.microsoft.com/ie), Netscape
(http://browser.netscape.com/), Firefox (http://www.mozilla.org/firefox/), or
Safari (http://www.apple.com/safari); Java version 5 or higher
Suitable programming language editor such as Eclipse
1. Go to the ChEBI Web Services page, which may be accessed from the menu on
the left-hand side of the main page or directly via a link (http://www.ebi.ac.uk/
chebi/webServices.do). This page describes the ChEBI Web service implementation
and allows you to test the methods available on the Web service and examine the
output.
There are four methods provided with which to access data. They are getLiteEntity,
which retrieves a LiteEntityList and takes as parameters a search string and a search
category (which may be null to search across all categories); getCompleteEntity, which
retrieves the full data for an entity including synonyms, database links and structures,
and which takes as parameter the ChEBI identifier; getOntologyParents, which retrieves
the parents of the given entity (specified by ChEBI identifier) in the ChEBI ontology; and
getOntologyChildren, which retrieves the children of the given entity (specified by ChEBI
identifier) in the ChEBI ontology.
package test.webapps;
import uk.ac.ebi.chebi.webapps.chebiWS.client.ChebiWebServiceClient;
public class TestChebiWebService {
public static void main(String[] args) {
ChebiWebServiceClient client = new ChebiWebServiceClient();
//client provides entry to web service methods
}
}
Figure 14.9.7
Java code illustrating the construction of the ChEBI Web Service client.
Cheminformatics
14.9.13
Current Protocols in Bioinformatics
Supplement 26
package test.webapps;
import
import
import
import
import
uk.ac.ebi.chebi.webapps.chebiWS.client.ChebiWebServiceClient;
uk.ac.ebi.chebi.webapps.chebiWS.model.ChebiWebServiceFault_Exception;
uk.ac.ebi.chebi.webapps.chebiWS.model.LiteEntity;
uk.ac.ebi.chebi.webapps.chebiWS.model.LiteEntityList;
uk.ac.ebi.chebi.webapps.chebiWS.model.SearchCategory;
public class TestChebiWebService {
/**
* @param args
*/
public static void main(String[] args) {
ChebiWebServiceClient client = new ChebiWebServiceClient();
try {
LiteEntityList benzenes =
client.getLiteEntity("benzene", SearchCategory.ALL);
for (LiteEntity le : benzenes.getListElement() ) {
System.out.println( le.getChebiAsciiName()
+ ", " + le.getChebiId() );
}
} catch (ChebiWebServiceFault_Exception e) {
e.printStackTrace();
}
}
}
Figure 14.9.8
Java code illustrating the Web Service search capabilities.
Thus, the search entry point into the dataset is the getLiteEntity method, which allows you
to specify a search string and use it to search the database across one or all categories.
Allowed search categories are (available as the SearchCategory enumeration in the domain
model) listed above step 11 of Basic Protocol 2.
The search method returns a LiteEntityList, which may contain many LiteEntitys. For each
LiteEntity contained in the list, the ChEBI ID may then be used to retrieve the full dataset
by passing it as a parameter to the getCompleteEntity method. The Entity object, which is
then returned contains the full ChEBI dataset linked to that identifier, including structures,
database links and registry numbers, formulae, names, synonyms, and parent and children
ontology relationships.
Navigating the ontology, without retrieving a complete Entity for each data item in the
ontology, is accomplished by using the methods getOntologyParents (for navigating up towards the root) and getOntologyChildren (for navigating downwards towards the leaves).
Note that an OntologyDataItem represents a relationship, specifying the ChEBI ID of the
related term and the type of the relationship. The ChEBI ID can then be used to access the
complete Entity if required. Some relationship types are cyclic, in which case the flag cyclicRelationship will be set to true. Cyclic relationships should be ignored for purposes of navigation, or if navigating them is required, care should be taken to traverse them only once.
ChEBI: An Open
Bioinformatics
and
Cheminformatics
Resource
2. Download the client (Java or Perl) or generate your own client based on the ChEBI
WSDL (http://www.ebi.ac.uk/webservices/chebi/webservice?wsdl). Place the client
in the class path for your custom Web service client application. An example Java
application is shown in Figure 14.9.7.
14.9.14
Supplement 26
Current Protocols in Bioinformatics
package test.webapps;
import
import
import
import
uk.ac.ebi.chebi.webapps.chebiWS.client.ChebiWebServiceClient;
uk.ac.ebi.chebi.webapps.chebiWS.model.ChebiWebServiceFault_Exception;
uk.ac.ebi.chebi.webapps.chebiWS.model.DataItem;
uk.ac.ebi.chebi.webapps.chebiWS.model.Entity;
public class TestChebiWebService {
/**
* @param args
*/
public static void main(String[] args) {
ChebiWebServiceClient client = new ChebiWebServiceClient();
try {
Entity benzene = client.getCompleteEntity("CHEBI:16716");
for (DataItem link : benzene.getDatabaseLinks()) {
System.out.println(link.getData());
}
} catch (ChebiWebServiceFault_Exception e) {
e.printStackTrace();
}
}
Figure 14.9.9
Java code illustrating the full retrieval of a ChEBI entry.
package test.webapps;
import
import
import
import
uk.ac.ebi.chebi.webapps.chebiWS.client.ChebiWebServiceClient;
uk.ac.ebi.chebi.webapps.chebiWS.model.ChebiWebServiceFault_Exception;
uk.ac.ebi.chebi.webapps.chebiWS.model.OntologyDataItem;
uk.ac.ebi.chebi.webapps.chebiWS.model.OntologyDataItemList;
public class TestChebiWebService {
/**
* @param args
*/
public static void main(String[] args) {
ChebiWebServiceClient client = new ChebiWebServiceClient();
try {
traverseOntologyParents(client, "CHEBI:16716");
} catch (ChebiWebServiceFault_Exception e) {
e.printStackTrace();
}
}
private static void traverseOntologyParents(ChebiWebServiceClient client,
String chebiId) throws ChebiWebServiceFault_Exception {
OntologyDataItemList parents = client.getOntologyParents(chebiId);
if (parents.getListElement().size()==0) {
System.out.println("THE END");
}
for (OntologyDataItem parent : parents.getListElement()) {
if (!parent.isCyclicRelationship()) {
System.out.println(parent.getChebiName());
traverseOntologyParents(client, parent.getChebiId());
break;
//Just find one path to root
}
}
}
Figure 14.9.10
Java code illustrating the navigation of the ChEBI ontology.
14.9.15
Current Protocols in Bioinformatics
Supplement 26
3. Ensuring your application can connect to the internet, execute the
method
ChebiWebServiceClient.getLiteEntity("benzene",
SearchCategory.ALL). The result of this execution will be a LiteEntityList,
which contains several elements. Traverse the list and print out the names and
identifiers of all the returned results. An example Java application is shown in Figure
14.9.8.
4. Get the full entity details for the entity benzene, by executing the method
ChebiWebServiceClient.getCompleteEntity("CHEBI:16716").
This will return an object of type Entity, from which you can access the full entity
data. Navigate the list of database links attached to this entity and for each, print
them out. An example Java application is shown in Figure 14.9.9.
5. The ontology can be navigated by repeated execution of the methods getOntologyParents and getOntologyChildren. Write a client application that traverses the ontology
parents starting with the entity benzene (CHEBI:16716) up to the root of the ontology,
printing out the name of each entity along the path. An example Java application is
shown in Figure 14.9.10.
BASIC
PROTOCOL 4
DOWNLOADING ChEBI
Many users prefer to download the whole ChEBI database and use it locally. ChEBI is
released monthly; therefore, it is important to check that the latest version of the database
is used. The entire ChEBI dataset is available for download in several formats.
Necessary Resources
Hardware
A computer with Internet access and 5 Gb of hard disk space available
Software
Internet browser, e.g., Internet Explorer (http://www.microsoft.com/ie), Netscape
(http://browser.netscape.com/), Firefox (http://www.mozilla.org/firefox/), or
Safari (http://www.apple.com/safari)
An RDBMS such as Oracle 9i, MySQL 5 or PostgreSQL
A spreadsheet application such as OpenOffice Calc (http://www.openoffice.org/)
A compression/decompression utility that can handle gzip-compressed files
(WinZip for Windows, http://www.winzip.com; gzip, http://www.gnu.org/
software/gzip/gzip.html, for Linux and other Unix systems)
1. Go to the ChEBI Downloads page. Downloads may be accessed from the menu on
the left-hand side of the main page or directly via this link (http://www.ebi.ac.uk/
chebi/downloadsForward.do).
The entire ChEBI dataset is available for download in the following formats:
i. Flat file, tab delimited. With this format, the data can easily be imported into a
spreadsheet application such as OpenOffice Calc, and from there it can be imported
into a relational database. It could also be parsed from the flat file and inserted into a
custom database structure as required.
ChEBI: An Open
Bioinformatics
and
Cheminformatics
Resource
ii. Oracle binary dumps. This is the straightforward Oracle format and it should be
imported directly into an Oracle database.
iii. Generic SQL insert statements, which could be executed on any SQL database.
Table creation scripts for use in creating the schema, which corresponds to the SQL
insert statements, are provided for MySQL and PostgreSQL databases.
14.9.16
Supplement 26
Current Protocols in Bioinformatics
iv. OBO file format for import into the OBO-edit application.
v. SDF file format for visualizing chemical structures and associated data.
Flat file, tab delimited
Data can be imported into a spreadsheet application to be viewed.
2. Click on the Flat file and tab delimited link to download ChEBI in a spreadsheet
format. Save the file compounds.tsv to your hard disk. Open compounds.tsv
with your spreadsheet application to view the compound data information.
Relational database management system
ChEBI data may be imported into a relational database management system enabling
powerful querying against the data.
3. If you have the Oracle relational database management system available, click on
the Oracle binary table dumps link to download ChEBI in Oracle table dump format.
Download all files in the Oracle dumps directory, and execute the Oracle imp
command to import the data as follows:
imp database name/database password@Instance name
PARFILE=import.par
4. If you have the MySQL relational database management system, click on the Generic
SQL (Structured Query Language) table dumps link to download ChEBI in the form
of generic SQL statements. Log into your MySQL command line terminal and execute
the mysql create tables.sql script as follows:
mysql> source mysql create tables.sql
5. Unzip the archive generic dump.zip downloaded from the Generic SQL (Structured Query Language) table dumps link on the ChEBI Downloads page. Import the
compounds.sql file into the database by using the command
mysql> source compounds.sql
Import all the files contained in the zip file into the database by replacing the file
name in each case, using the command above as an example. For example to import
the names table, replace the compounds.sql file with names.sql as follows:
mysql> source names.sql
6. If you have the PostgreSQL relational database management systems installed, click
on the Generic SQL (Structured Query Language) table dumps link to download
ChEBI in the form of generic SQL statements. Log into your PostgreSQL command
line terminal and execute the pgsql create tables.sql script as follows:
postgres=# \i pgsql create tables.sql
7. Unzip the archive generic dump.zip downloaded from the Generic SQL (Structured Query Language) table dumps link on the ChEBI Downloads page. Import the
compounds.sql file into the database by using the command
postgres=# \i compounds.sql
Import all the files contained in the zip file into the database by replacing the file
name in each case, using the command above as an example. For example to import
the names table replace the compounds.sql file with names.sql as follows:
postgres=# \i names.sql
Current Protocols in Bioinformatics
Cheminformatics
14.9.17
Supplement 26
8. Once you have imported the ChEBI data into your RDBMS, you can execute
SQL queries against the database and extract the relevant information in which
you are interested. Refer to the figure (found on the ChEBI Developer Manual
page) for an illustration of the ChEBI domain model in which the data is stored
(http://www.ebi.ac.uk/chebi/developerManualForward.do).
The Compound table is the main entry point into the data, referenced by all the other data
items. Additionally, it stores the ChEBI recommended name and definition. The Compound
table also contains a reference to itself, which is used when duplicate entities within the
database are merged.
The DatabaseAccession table contains manually annotated references to other databases,
such as database links and registry numbers.
The CompoundName table contains various types of names such as systematic names,
synonyms, and brand names.
The ChemicalData table contains formulae and additional chemical data such as charge
and mass.
The Comments table contains various comments, which may be associated with items in
the database.
The Reference table contains the automatically generated cross-references to other
databases, which are displayed on the Automatic Xrefs tab on the ChEBI Web site.
The Structure table contains chemical structures in Molfile, InChI, InChIKey, and SMILES
formats. Most entities that have a chemical structure will have one Molfile structure
selected as the default. The ID of this default structure will then be present in the
DefaultStructure table. The IDs of the InChI, InChIKey, and SMILES structures are present
in the AutogenStructure table as these are automatically generated from the Molfile
structure.
The OntologyModel describes all the ontologies stored in ChEBI.
Relationships within the ChEBI ontology are represented in the Relation table as a directed
association between two vertices (represented in the Vertice table). Vertices are, in turn,
then linked to entries in the Compound table.
9. To obtain a list of all KEGG accession numbers contained in the ChEBI database
along with the name of the entity and the primary ChEBI accession to which they are
linked, execute the following SQL query:
select NVL(com.parent id, com.id), com.name,
da.accession number
from database accession da, compounds com
where da.compound id = com.id
and da.type = 'KEGG COMPOUND accession'
and da.status in ('C','E');
The Compound ID forms part of the ChEBI accession, which is the primary identifier that
we encourage use of to refer uniquely to a given chemical entity. Once publicly released,
we ensure that the ChEBI accession will be maintained and it will continue to refer to
that particular entity. However, as ChEBI is a living and actively maintained database,
changes to the dataset do occur, and particularly in cases where duplicate entities in
the dataset are merged (e.g., when these entities have been loaded from different source
databases).
ChEBI: An Open
Bioinformatics
and
Cheminformatics
Resource
All related accessions are maintained in the Compounds table as children of a parent
compound. This is implemented by the self-referencing parent id column in the Compound
table. The parent id contains the ID for the compound specifying the main accession of a
merged group of compounds.
14.9.18
Supplement 26
Current Protocols in Bioinformatics
This means that when trying to retrieve the compound accession from a data item such as
a database accession or compound name, the relevant entry in the Compounds table must
also be retrieved and the parent id field examined. If the parent id is not empty, then it
links to the compound containing the primary identifier for this merged group of entities.
10. To download the ChEBI dataset in OBO ontology format, click on the OBO file
link. The OBO file format is defined by the OBO (Open Biomedical Ontologies; http://www.obofoundry.org/) group and is described in detail at http://www.
geneontology.org/GO.format.obo-1 2.shtml. The file may then be opened in the tool
OBO-edit available from http://oboedit.org/?page=download.
11. To download the ChEBI dataset in SDF format, click on the SDF file link. The SDF file
format is defined by the Symyx and is described in detail at http://www.symyx.com/
downloads/public/ctfile/ctfile.pdf. The file may be opened with a number of tools
such as Bioclipse available from http://www.bioclipse.net/.
COMMENTARY
Background Information
ChEBI was originally intended to serve
as a controlled vocabulary for a variety of
molecular biology databases at the EMBLEBI and the whole of the biological community. Over time, further data were added to
ChEBI, namely molecular structures (in the
form of mol files), a chemical ontology, and automatic cross-references (Degtyarenko et al.,
2008). Since its first public release (July 21,
2004), ChEBI has grown to represent >17,000
molecular entities, groups, and classes.
ChEBI Maintenance
Automatic initial loading of data
ChEBI systematically combines information on small molecular entities, which are automatically loaded as preliminary data from
three main sources: (1) IntEnz database of
Table 14.9.1 Frequently Encountered Problems in ChEBI
Problem
Possible cause
Solution
I can’t find the compound using
its name
There is no exact text match
with the query term
Try using a fragment of the name in
combination with wildcards
Why can’t I find a known entry in
ChEBI even if I use its ChEBI ID
as a query?
This ChEBI entry has
preliminary status
Send request to the ChEBI team to check
this entry
I can’t see the structure in the
ChEBI entry
Java is not installed
Install Java version 5 or higher
I can’t see the structure clearly in the
ChEBI entry
The structure of an entity is
too complex to be viewed
clearly as a static image
Clicking on the Applet button will open an
interactive MarvinView applet, which allows a
structure to be manipulated. Double-clicking on
the applet itself or selecting Window in the
drop-down menu opens this as a new window,
which can be resized, allowing the structure to
be viewed at a higher magnification. Other
options in the drop-down menu allow different
representations of the structure to be viewed,
rotated, etc. Clicking on Image restores the
original image view.
When I click Search on the Advanced Javascript is not enabled in
Search page the response is that I have your browser
not submitted any parameters although
I have drawn a chemical structure
Enable Javascript in your browser
Cheminformatics
14.9.19
Current Protocols in Bioinformatics
Supplement 26
enzymes (EMBL-EBI), (2) KEGG COMPOUND database, and (3) MSDchem database
of ligands (also EMBL-EBI).
Preliminary entries are not publicly searchable until they have been manually annotated
and checked; however, they may be directly
accessed if the identifier is known, or browsed
if they are linked to the ontology. They are
clearly indicated as preliminary entries in the
interface.
Manual annotation
Each preliminary entity is then manually
checked and annotated. A unique and unambiguous name is selected as the recommended ChEBI name, the structure is created
or checked, an IUPAC name is assigned, and
relevant synonyms and database links are annotated.
A number of subsidiary freely accessible sources are manually annotated and integrated, such as ChemIDplus (http://chem.sis.
nlm.nih.gov/chemidplus/), the NIST Chemistry WebBook (http://webbook.nist.gov/),
KEGG DRUG (http://www.genome.ad.jp/
kegg/drug/), and DrugBank (UNIT 14.4; http://
www.drugbank.ca/).
User requests
Users of ChEBI are encouraged to place requests for additions to the dataset via SourceForge (http://sourceforge.net/projects/chebi/).
Critical Parameters and
Troubleshooting
Table 14.9.1 summarizes some “frequently
encountered problems” with suggested solutions.
Acknowledgements
ChEBI has been supported by the European Commission grants BioBabel and Felics.
ChEBI acknowledges the software support of
ChemAxon.
Literature Cited
Côté, R.G., Jones, P., Apweiler, R., and Hermjakob,
H. 2006. The ontology lookup service,
a lightweight cross-platform tool for controlled vocabulary queries. BMC Bioinformatics
7:97.
Degtyarenko, K., Ennis, M., and Garavelli, J. 2007.
“Good annotation practice” for chemical data in
biology. In Silico Biol. 7:S1, 06.
Degtyarenko, K., de Matos, P., Ennis, M., Hastings,
J., Zbinden, M., McNaught, A., Alcántara, R.,
Darsow, M., Guedj, M., and Ashburner, M.
2008. ChEBI: A database and ontology for
chemical entities of biological interest. Nucl.
Acids Res. 36:D344-D350.
Heller, S.R. and McNaught, A.D. 2009. The IUPAC International Chemical Identifier (InChI).
Chem. Int. 31:7-9.
Kochev, N., Monev, V., and Bangov, I. 2003.
Searching chemical structures. In Chemoinformatics (J. Gasteiger and T. Engel, eds.) pp. 291318. Wiley-VCH, Weinheim, Germany.
Steinbeck, C., Hoppe, C., Kuhn, S., Floris, M.,
Guha, R., and Willighagen, E.L. 2006. Recent
developments of the Chemistry Development
Kit (CDK): An open-source java library for
chemo- and bioinformatics. Curr. Pharm. Des.
12:2111-2120.
Key References
Degtyarenko et al., 2008. See above.
Explains main principles of ChEBI. This paper
should be used to cite ChEBI.
Kochev et al., 2003. See above.
An excellent introduction to the principles of substructure and structure similarity search.
Internet Resources
http://www.ebi.ac.uk/chebi/
The ChEBI home page.
http://www.ebi.ac.uk/chebi/faqForward.do
ChEBI Frequently Asked Questions.
http://www.ebi.ac.uk/chebi/userManualForward.do
ChEBI User Manual.
http://www.ebi.ac.uk/chebi/tutorialForward.do
ChEBI Tutorials.
http://www.ebi.ac.uk/chebi/
annotationManualForward.do
ChEBI Annotation Manual. This manual is designed to enable an annotator (curator) to follow the sequence of steps involved in checking and
amending entries in ChEBI.
http://www.ebi.ac.uk/chebi/downloadsForward.do
ChEBI Downloads. Contains the latest ChEBI release in several formats.
http://sourceforge.net/projects/chebi/
ChEBI project at SourceForge.
http://cdk.sourceforge.net
The Chemistry Development Kit project at SourceForge.
http://www.chemaxon.com/marvin/
ChemAxon Marvin documentation page.
ChEBI: An Open
Bio- and ChemoInformatics
Resource
14.9.20
Supplement 26
Current Protocols in Bioinformatics