1
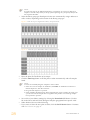
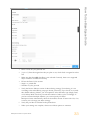
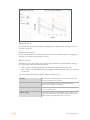
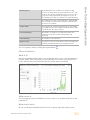
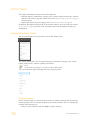
The median Q-Score for each tile over all bases for the
th
current cycle. These charts are generated after the 25 cycle.
This plot is best used to examine the Q-scores of your run as
it progresses. Bear in mind that the %Q30 plot can give an
over simplified view due to its reliance on a single threshold.
Error Rate
The calculated error rate, as determined by a spiked in PhiX
control sample. If no PhiX control sample is run in the lane,
this chart is not available.
Perfect Reads
The percentage of reads that align perfectly, as determined
by a spiked in PhiX control sample. If no PhiX control sample
is run in the lane, this chart is all gray.
Corrected Intensity
The intensity corrected for cross talk between the color
channels by the matrix estimation and phasing and
prephasing.
Called Intensity
The intensity for the called base.
Signal to Noise
The signal to noise ratio is calculated as mean called intensity
divided by standard deviation of noncalled intensities.
You can expand a chart by clicking the expand button.
QScore Distribution
What is it?
The QScore Distribution Plot shows a bar graph that allows you to view the number of
bases by quality score. The quality score is cumulative for current cycle and previous
cycles, and only bases from reads that pass the quality filter are included.
When to use it.
Use it to judge the QScore distribution for a run, which is an excellent indicator for run
performance.
When not to use it.
Do not use the QScore Distribution Plot to look at metrics other than quality scores.
BaseSpace Onsite v2.0 System Guide
39
How To Use BaseSpace Onsite
Median Q-Score