1
Simulation of drilling riser disconnection
- Recoil analysis
Arild Grønevik
Marine Technology
Submission date: June 2013
Supervisor:
Carl Martin Larsen, IMT
Norwegian University of Science and Technology
Department of Marine Technology
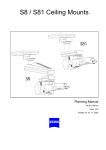
NTNU Norwegian University of Science and Technology Department of Marine Technology Scope of work M.Sc. thesis 2013 for Stud. tech. Arild Grønevik SIMULATION OF DRILLING RISER DISCONNECTION – RECOIL ANALYSIS Drilling risers may have to disconnect in situations with large waves or due to unexpected events. The elastic energy in the riser that is linked to the tension at lower end will lead to stress waves immediately after disconnecting. This stress wave may lead to compression and even beam buckling. Another issue is that the heave compensator must be able to adjust upper end tension in order to avoid an uncontrolled and dramatic pull-‐in that may lead structural damage. Another problem of importance is the motions of the free end. It is of outmost importance that the end does not hit the blow-‐out preventer, but is given a controlled uplift to a safe position. Dynamic analysis of drilling risers after disconnecting is mandatory when planning drilling operations. This type of analysis is often referred to as “recoil analysis”. The purpose of this project is to describe a typical disconnection procedure, identify critical events and carry out recoil analyses by the use of the computer program Riflex. The work might be divided into tasks as follows: Literature study and selection of risers and cases to be subjected to analyses. Part of this task was carried out as a pre-‐project during fall 2012, but some additional work might still be relevant Apply RIFLEX to simulate various disconnection situations by varying time for disconnection relative to the dynamic position of the platform. Parameters like water depth and riser tension may also be varied. Further details should be agreed with the supervisor during the execution of the project. The work may show to be more extensive than anticipated. Some topics may therefore be left out after discussion with the supervisor without any negative influence on the grading. NTNU Norwegian University of Science and Technology Department of Marine Technology The candidate should in her/his report give a personal contribution to the solution of the problem formulated in this text. All assumptions and conclusions must be supported by mathematical models and/or references to physical effects in a logical manner. The candidate should apply all available sources to find relevant literature and information on the actual problem. The report should be well organised and give a clear presentation of the work and all conclusions. It is important that the text is well written and that tables and figures are used to support the verbal presentation. The report should be complete, but still as short as possible. The final report must contain this text, an acknowledgement, summary, main body, conclusions and suggestions for further work, symbol list, references and appendices. All figures, tables and equations must be identified by numbers. References should be given by author name and year in the text, and presented alphabetically by name in the reference list. The report must be submitted in two copies unless otherwise has been agreed with the supervisor. The supervisor may require that the candidate should give a written plan that describes the progress of the work after having received this text. The plan may contain a table of content for the report and also assumed use of computer resources. From the report it should be possible to identify the work carried out by the candidate and what has been found in the available literature. It is important to give references to the original source for theories and experimental results. The report must be signed by the candidate, include this text, appear as a paperback, and -‐ if needed -‐ have a separate enclosure (binder, DVD/ CD) with additional material. Supervisor at NTNU is Professor Carl M. Larsen Carl M. Larsen Submitted: January 2013 Deadline: 17 June 2013 II NTNU Norwegian University of Science and Technology Department of Marine Technology Preface This report represents the work done for the Master Thesis in the Discipline of Marine Hydrodynamics Engineering at NTNU, Trondheim. This thesis has been carried out individually in the spring of 2013. The objective of this thesis can be divided into two parts. Firstly literatures study of the theory, components and procedures concerning emergency disconnection of a drilling riser. Secondly apply this knowledge to model and simulate the emergency disconnection in the software SIMA RIFLEX developed by NTNU/MARINTEK. Unfortunately I made an error in the mud discharge problem of the thesis. This error was discovered to late to and no time was available to re-‐run all the analysis. The friction forces are added in positive z-‐direction of the riser, and not in negative z direction, as they should have been. I would like to thank my supervisor Professor Carl M. Larsen for giving me this interesting thesis, which I had little prior knowledge on. For the support and hand out of data. I would also like to thank Ronny Sten and Aker Solutions for providing me with a specific riser system, and learning through his PhD thesis. Dolphin Drilling for giving me an insight in their procedures. Guttorm Grytøyr for his previous work. Andreas Amundsen for troubleshooting with SIMA RIFLEX. And at last thanks to the guys at the office for motivation and support. Institute for Marine Technology, Trondheim June, 2013 _______________________ Arild Grønevik III NTNU Norwegian University of Science and Technology Department of Marine Technology Summary The emergency disconnection system and recoil analysis is required for every offshore drilling unit. Situations can occur where the vessel needs to disconnect from the well, it can be to large forces that are being transferred to the wellhead or that the vessel is unable to maintain its position over the well. When the tensioned riser is released between the BOP and LMRP it will accelerate upwards due to released tension and unbalanced force from the tensioners, this is referred to as riser recoil. The riser tensioner system is essential for understanding the recoil and it is presented in this thesis. This system gives the force variation when the riser retracts and contains the shut-‐off valves used in the anti recoil system for slowing down the riser. This thesis has focused on the use of SIMA RIFLEX as the tool for making a complete recoil analysis. Modelling issues are discussed on how well the physical phenomena of the recoil can be implemented in RIFLEX. Special attention have been given to force variation and damping in the riser tensioner system. Mass loss and friction forces when the high density mud inside the riser discharges. Slowing down the riser with the anti recoil system. None of these issues can be modelled directly in RIFLEX, and requires pre processing and simplifications. Two models were developed for the use in RILFEX, one for 500 meters water depth and one for 1500 meters water depth simulating a drift-‐off scenario. Impact between the BOP and LMRP is an issue if the riser does not achieve enough lift off after disconnection. A worst-‐case scenario was set up for the 500 m model in irregular waves. No impact occurred for different disconnection timings in the selected wave. However it was found that an impact could be plausible in larger waves. In the drift-‐off simulation resulting bending moments on the BOP and wellhead is of focus. The built in slug model in RIFLEX was attempted used for modelling of the mass loss. It was found that the slug model does not work for a complex riser, and an alternative model was developed. By specifying dynamical nodal forces in the global system, forces can be saved to the nodes of the riser. Then both the mass and the force representing the mass loss will be saved to the same nodes, but in different matrices. The alternative model provided a good lift off from the BOP, but does not change the actual mass of the system. Compression will be another problem induced by the forces lifting the riser. SIMA RIFLEX proved to lack some modelling options to serve well for a recoil analysis. IV NTNU Norwegian University of Science and Technology Department of Marine Technology Sammendrag (Norwegian summary) Nød avkobling system og rekyl analyse er påkrevd for alle offshore boreskip og plattformer. Situasjoner kan oppstå der fartøyet trenger å koble av fra brønnen, dette kan være på grunn for store krefter som blir overført til brønnhodet og/eller at fartøyet ikke lengre kan holde posisjonen sin. Når det strekkbelasta stigerøret blir frakobla mellom utblåsingssikring (BOP) og nedre del av stigerør (LMRP) vil den akselereres oppover. Dette er på grunn av frigjort strekk og kraft ubalanse i strekkmaskinen. Dette blir referert til som en stigerørs rekyl. Strekkmaskin systemet er viktig for forståelsen av denne rekylen og er presenter i denne oppgava. Systemet gir kraftvariasjonen når stigerøret trekker seg opp, og inneholder viktige komponenter som avstengingsventiler brukt i anti rekyl systemet for å senka farten til stigerøret. Denne oppgava har fokusert på bruken av programvaren SIMA RIFLEX som verktøy for å gjøre en komplett stigerørs rekyl analyse. Det er diskutert rundt modellerings problematikk og hvor tilfredsstillende en kan implementere fysikken til og rundt stigerørs rekylen. Spesielt viktig er kraftvariasjon og demping fra strekkmaskinen. Massetap og friksjonskrefter fra utstrømming av borevæske når den nedre enden av stigerøret blir eksponert til det lavere trykket i omgivelsene. Senke farten til stigerøret med et anti rekyl system. Ingen av disse problemene kan modelleres direkte i RIFLEX, og krever forhands analyser og forenklinger. To modeller har blitt utvikla i SIMA RIFLEX, en med vanndyp på 500 meter og en med vanndyp på 1500 meter som skal simulere en avdrift av fartøyet. Krasj mellom utblåsingssikring og nedre del av stigerør etter avkoblinga kan være en risiko. Hvis ikke stigerøret får nok løft etter avkobling kan det oppstå en kollisjon som skader viktig utstyr. Et ekstremtilfelle ble sett opp for modellen med vanndyp på 500 meter i irregulære bølger. Resultatene viste ingen kollisjon for forskjellige avkoblings tidspunkt. Men trenden viste at hvis bølgene eller bevegelsene til fartøyet er store nok så kan det være mulig. I avdrift simulasjonen er det resulterende bøyemoment på BOP og brønnhode som er det kritiske. For å modellere massetapet i stigerøret ble det forsøkt å bruke den innebygde ”slug” modellen i RIFLEX. Denne modellen fungerer ikke på et komplekst stigerør system. En alternativ modell ble utviklet med å sette på spesifiserte globale node krefter i dynamisk kalkulasjon. Massen og kreftene som etterligner massetap vil da bli lagret i de samme nodene, men i forskjellige matriser. Denne alternative modellen viste gode resultat, men krever en bedre validering. V NTNU Norwegian University of Science and Technology Department of Marine Technology Table of Contents CHAPTER 1 INTRODUCTION 1.1 PREVIOUS WORK AND CONTRIBUTIONS 1.2 MOTIVATION – THE MACONDO ACCIDENT 1.3 ORGANIZATION OF THE THESIS 1 2 3 4 CHAPTER 2 THE HEAVE COMPENSATED MARINE DRILLING RISER 2.1 MARINE RISER 2.2 RISER TENSIONERS 2.3 TELESCOPIC JOINT AND TENSIONER RING 2.4 FLEX JOINTS 2.5 PRESSURE SYSTEM 2.5.1 Nitrogen / oil accumulators skid 2.5.2 Shut-‐off valve skid 2.5.3 Nitrogen control skid 2.5.4 Nitrogen pressure vessels 2.6 MARINE RISER COMPONENTS DATA 6 8 8 10 11 12 12 12 13 13 14 CHAPTER 3 THE EMERGENCY DISCONNECTION SEQUENCE AND RISER RECOIL 3.1 REASONS FOR DISCONNECTING 3.1.1 Drift-‐off 3.1.2 Drive-‐off 3.1.3 Storm 3.1.4 Mooring failure 3.1.5 Shallow gas expansion 3.2 PROCEDURES AND ACTIVATION OF THE SYSTEM 3.2.1 Automatic mode function (AMF) 3.2.2 Drift-‐off 3.3 BLOWOUT PREVENTER AND LOWER MARINE RISER PACKAGE 3.3.1 Blind shear rams 3.4 THE EVENTS OF THE RECOIL 3.5 DIFFERENT ASPECTS NEEDED IN A RECOIL ANALYSIS 3.5.1 Impact between BOP and LMRP 3.5.2 Compression and buckling 3.5.3 Hang-‐off dynamics 3.6 ANTI RECOIL SYSTEM 3.6.1 Anti recoil for DAT cylinders 15 15 15 15 16 16 16 16 17 17 19 20 20 22 22 22 23 23 23 CHAPTER 4 RECOIL ANALYSIS AND MODELLING IN SIMA RIFLEX 4.1 GENERAL MODELLING IN SIMA RIFLEX 4.1.1 LMRP connector 4.1.2 Connecting tensioners to the riser 4.1.3 Flex joints 4.1.4 Drift-‐off 4.1.5 Telescopic joint 4.2 MUD DISCHARGE 25 25 25 25 26 26 26 26 VI NTNU Norwegian University of Science and Technology Department of Marine Technology 4.2.1 Modelling of mass loss and frictional forces 4.3 MODELLING OF TENSIONERS 4.3.1 Tension variation 4.3.2 Riser tension distribution 4.4 ANTI RECOIL SYSTEM 4.5 HYDRODYNAMIC LOADS 4.6 VESSEL MOTION 4.7 MODEL 1 – DISCONNECTION TIMING 4.7.1 Objective 4.7.2 Comments 4.7.3 Results pre processing 4.8 MODEL 2 – DRIFT OFF IN ULTRA DEEP WATER 4.8.1 Objective 4.8.2 Comments 4.8.3 Results pre processing 27 30 31 35 35 35 36 37 38 39 39 40 41 41 42 CHAPTER 5 RESULTS RECOIL ANALYSIS 5.1 MASS LOSS DUE TO DISCHARGE OF MUD 5.2 MODEL 1 – DISCONNECTION TIMING 5.3 MODEL 2 – DRIFT OFF SIMULATION 5.4 NEW MODEL WITH CORRECT FORCES, 500 M WATER DEPTH 5.5 SCREENSHOTS FROM THE SIMULATIONS 44 45 47 52 57 61 CHAPTER 6 DISCUSSION AND SHORTCOMINGS 6.1 MISTAKE IN THE FRICTION FORCE ANALYSIS 6.2 TENSIONER SYSTEM. 6.3 MUD DISCHARGE ANALYSIS. 6.4 SLUG MODEL AND MASS LOSS. 6.5 VALIDATION OF RESULTS WITHOUT SLUG LOAD 6.6 ALTERNATIVE MODELLING OF MASS LOSS 6.7 INFLUENCE OF MASS 63 63 63 64 64 66 67 67 CHAPTER 7 CONCLUSION 71 CHAPTER 8 FURTHER WORK 73 CHAPTER 9 REFERENCES 74 CHAPTER 10 APPENDIX 1 VII NTNU Norwegian University of Science and Technology Department of Marine Technology List of Figures Figure 1.1: Schematic model of marine riser system, direct acting tensioner cylinders [Grytoyr et al. 2011] 2 Figure 1.2: Blowout preventer at the Macondo accident 4 Figure 2.1 -‐ Schematic model of the riser tensioner system 7 Figure 2.2 -‐ Typical riser joint with foam buoyancy elements [13] 8 Figure 2.3 -‐ Schematic model of wire line tensioner system [Grytoyr et al. 2011] 9 Figure 2.4 -‐ DAT system with tensioner ring [14] 11 Figure 3.1 -‐ Blowout preventer and Lower Marine Riser Package 19 Figure 3.2 Blind shear rams [20] 20 Figure 3.3 -‐ Sequence of events [Yin, 2013] 21 Figure 3.4 -‐ Closure curve for shut-‐off valve 24 Figure 4.1 -‐ Modelled riser tensioner connection 26 Figure 4.2 Mud discharge velocity, the maximum velocity is 18m/s after 6 seconds 29 Figure 4.3 Friction forces acting on the riser, 1700 N/m at the most 29 Figure 4.4 -‐ Different tensioner models 31 Figure 4.5 -‐ Tension variation for 2 and 5 m stroke length as function of initial pressure setting 32 Figure 4.6 Tension variation for 30 bar tension setting as function of elongation 33 Figure 4.7 -‐ Stroke velocity for regular waves 14s period, 12 meter amplitude, corresponds to a cylinder stroke of around +-‐5meters, this is close to the maximum the system can handle. 34 Figure 4.8 -‐ Transfer function for heave, head sea 37 Figure 4.9 -‐ Mud discharge velocity 39 Figure 4.10 -‐ Lenght of mud column 40 Figure 4.11 -‐ Friction forces on riser N/m 40 Figure 4.12 -‐ Tension variation for 70 bar setting (single tensioner) 42 Figure 4.13 -‐ Mud discharge velocity 42 Figure 4.14 -‐ Length of mud column 43 Figure 4.15 -‐ Friction forces on riser N/m 43 Figure 5.1 -‐ Dynamics of the LMRP after disconnection. 45 Figure 5.2 -‐ Velocity of the tensioners retracting after disconnection. 46 Figure 5.3 -‐ Tension below tensioner ring. Blue represent constant mass loss force, red is without mass loss, green is with seawater. 47 Figure 5.4 -‐ Heave amplitude for the condition 48 Figure 5.5 -‐ Elevation of the LMRP for different disconnection points. Yellow and dark blue (lowest in description) are for the 300kN setting. 49 Figure 5.6: Retraction speed of the LMRP 50 Figure 5.7 -‐ Tension below the tensioner ring for high tension setting and low tension setting 50 Figure 5.8 -‐ Tension below the tensioner ring 51 Figure 5.9 -‐ Compression in the riser for different vertical coordinates 52 Figure 5.10 -‐ Heave amplitude for the vessel 53 Figure 5.11 -‐ Bending moments acting on the BOP before disconnection 53 Figure 5.12 -‐ Tension in riser at -‐460 meter for different disconnection timings. 54 Figure 5.13 -‐ Telescopic joint upper and lower end 55 Figure 5.14 -‐ Heave amplitude of vessel compared with tensioner motion in hang off mode 56 VIII NTNU Norwegian University of Science and Technology Department of Marine Technology Figure 5.15 -‐ Dynamics of LMRP in hang off mode, red line with force description of mass loss, blue without mass loss 56 Figure 5.16 -‐ Elevation of LMRP after disconnection 57 Figure 5.17 -‐ Elevation of LMRP with disconnection timings of 67, 68, 69 and 70 seconds. 58 Figure 5.18 – Elevation of LMRP. Shows the difference in results from model in 5.1 (blue) and the corrected model (red) 59 Figure 5.19 -‐ Tensioning system before disconnection and after 61 Figure 5.20 BOP and LMRP disconnected in the drift-‐off simulation 62 Figure 5.21 -‐ LMRP lifting off BOP with both vertical and horizontal movement 62 Figure 6.1 vertical movement of the tensioners, blue represent riser with mud, red is the empty riser 69 Figure 6.2 Horizontal movement for top of buoyancy element (-‐60m) for riser with mud, seawater and empty, blue, red, green. 70 IX NTNU Norwegian University of Science and Technology Department of Marine Technology List of Tables Table 2.1 -‐ Tensioner system for Aker Spitsbergen .......................................................................................... 12 Table 2.2 -‐ Marine riser components [Sten, 2012] ............................................................................................ 14 Table 4.1 -‐ Geometry for pressure change calculation ..................................................................................... 32 Table 4.2 -‐ Used drag coefficients [Grytoyr et al. 2011] ................................................................................... 36 Table 4.3 -‐ Marine Riser stack up, 506 m water depth ..................................................................................... 38 Table 4.4 -‐ Marine riser stack up, 1506 m water depth ................................................................................... 41 Table 6.1 -‐ Natural axial periods for 500m riser model .................................................................................. 68 Table 6.2 -‐ Natural axial periods for 1500m riser model ................................................................................ 68 X NTNU Norwegian University of Science and Technology Department of Marine Technology Nomenclature MODU – Mobile offshore drilling unit LMRP – Lower Marine Riser Package BOP – Blowout preventer WH – Wellhead EDS – Emergency disconnection sequence AMF – Automatic mode function NPV – Nitrogen pressure vessel LP NPV – Low pressure nitrogen pressure vessel RKB – Rotary Kelly bushing RAO – Response amplitude operator ROV – Remotely Operated vehicle DAT – Direct acting tensioner PLC – Programmable logic controller N2 – Nitrogen gas WT – Wall thickness ID – Internal diameter OD – outer diameter Ft – feet WD – water depth Symbols All explanations are given below each particular equation XI NTNU Norwegian University of Science and Technology Department of Marine Technology Chapter 1 Introduction Oil explorations and drilling are moving towards greater and greater depths. Deep water is normally defined as more than 500 meter, and ultra deep water as more than 2000meter. The increased drilling depth imposes big challenges and requirements to the equipment due to the extreme hydrostatic pressures and distance between drilling unit and the seabed. For large depths a dynamical positioned drilling unit is normally used due to the increase in cost and dimension for mooring systems. Greater depths means larger and heavier drilling riser, more top tension, large quantities of drilling mud. Safety becomes more important due to the difficulties in solving the problem if something goes wrong in ultra deep water. This was painfully experienced with the Deepwater Horizon / Macondo accident. Every mobile offshore drilling unit is required to have a procedure and system both for planned and emergency disconnecting of the marine riser. Disconnecting the lower marine riser package from the blowout preventer will cause the riser to recoil upwards due to tension in the system. Hence the name recoil analysis. This thesis will focus on the emergency disconnection, the system around it and the recoil that happens afterwards. The emergency disconnection is a much more critical event then a planned disconnection due to the short time period. This means that there is no time for retrieving the drill string, circulate out the drilling mud, or lowering the tension in the system. If the emergency disconnection is activated, blind shear rams in the BOP will cut through the drill pipe and seal the well. The LMRP connector will be released freeing the LMRP and the riser from the BOP. A recoil analysis needs to study the dynamics of the riser after it is released. The LMRP needs to be lifted clear from the BOP without coming down again and causing an impact. The recoil needs to be slowed down so it does not come crashing up in the drill deck. Stopping the riser without causing compression requires an anti recoil system. Compression in the riser can cause buckling and severe damage. 1 NTNU Norwegian University of Science and Technology Department of Marine Technology Figure 1.1: Schematic model of marine riser system, direct acting tensioner cylinders [Grytoyr et al. 2011] 1.1 Previous work and contributions [Gronevik, 2012] In my project work I conducted a literature study of the emergency disconnection system and recoil analysis. It also included a short description on how the modelling can be done in SIMA RIFLEX. The project gave an overall understand of the emergency disconnection system, the vital components and special modelling problems. No recoil analysis was carried out in the project. Some parts of the literature study are presented again in this thesis (chapter 3) to give the reader the full understanding of the subject. [Grytoyr et al. 2011] Presents an article about methodology for dynamic analysis and recoil, using general purpose riser FEA programs. This article provided good help and understanding of the modelling issues. It presents solutions for tensioner modelling, mud discharge and some results for regular waves. Some of the shortcomings in this article are including damping values, anti recoil system and vessel specific configuration. 2 NTNU Norwegian University of Science and Technology Department of Marine Technology [Sten, 2012] This PhD thesis concerns the forces and accelerations working on direct acting tensioner that are subjected to wave loads. Some of the work Sten made was an improved model in RIFLEX to get a better force description. This thesis provided me with specific riser data, RAO for the semi submersible Aker Spitsbergen, a good description of the riser tensioner system, anti recoil system and force variation data for validation of my input. 1.2 Motivation – The Macondo accident The Deepwater Horizon or the Macondo accident is the largest marine catastrophe in newer times. It resulted in 11 fatalities and over 4 million barrels oil spilled into the Gulf of Mexico in 2010. The accident was a result of various events that went wrong, both human and mechanical errors. One crucial part of the accident involves the BOP and the emergency disconnection system. Our responsibilities as engineers are to prevent any accidents like this to happen. Reading about the Macondo accident gave a lot of motivation for studying the marine riser and emergency disconnection. The accidents will be explained briefly here, with focus on the sealing problem of the well. Information was found from videos explaining the events of the accident published by Transocean and the investigation committee [10][11] and the homepage of Transocean [12] The cementation of the well was completed 14 hours before the accident. The crew were working hard to complete the well since the project already was behind on the schedule. During the negative pressure testing of the well there was a pressure increase on the drill pipe, this was wrongly assumed to be the result of “bladder effect” and the BOP was opened. The driller continued to pump seawater into the well instead of mud to raise the hydrostatic pressure difference. The increase in pressure came from the release of hydrocarbons. When the crew realised the problem they activated the upper annular to seal the flow. The annular did not successfully stop the flow due to large pressures and that a tool joint was placed at the position of the annular. When the mud together with hydrocarbons reached the topside, a separation system was activated to separate out the gas. The system was not able to handle the large amounts of hydrocarbons and a gas cloud started spreading around on the rig. Eventually this gas came into the air-‐intake for the engines and made the engines over-‐rev. An explosion happened in the engine room and the Deepwater Horizon lost all power and positioning ability. When the order was given to activate the emergency disconnection system the platform had no longer communication with the BOP. The communication was most likely lost due to the explosion. As a result the automatic mode function (AMF) activated the blind 3 NTNU Norwegian University of Science and Technology Department of Marine Technology shear rams. When the blind shear rams closed, a section of the pipe got trapped outside of the area of the shearing blades. The blind shear rams was then unsuccessful in cutting the pipe and the well was not sealed. When the rig could not disconnect from the well, the order to abandon ship was given. After burning for 36 hours the semisubmersible sank. Sinking made the marine riser to come down all buckled up. The riser burst a few meters above the LMRP, and high pressure oil from the reservoir was flowing out at a rate of over 35000 barrels per day. It took 87 days to successfully seal the flow. The main problems were due to the water depth of 1600 meters, and high pressure from the deep well 10 000 meters below the seabed. Figure 1.2: Blowout preventer at the Macondo accident 1.3 Organization of the thesis •
Chapter 2: Gives a detailed explanation of the heave compensated marine drilling riser and all of its components. Special attention is given to the riser tensioners and pressure system. 4 NTNU Norwegian University of Science and Technology Department of Marine Technology •
•
•
•
•
Chapter 3: Presents the emergency disconnection system and riser recoil, why it is needed and its vital components. Chapter 4: Presents how the recoil analysis is planned, modelling aspects , pre-‐
processing and the final models. Chapter 5: Presents all the results and some comments Chapter 6: Presents the discussion, problems and shortcomings of the thesis. Chapter 7: Conclusion 5 NTNU Norwegian University of Science and Technology Department of Marine Technology Chapter 2 The heave compensated marine drilling riser Essential for all offshore well operations is the heave compensating system. Whenever there are waves a platform or vessel will have relative motion to the sea bottom. Since a drilling rig is physical connected to the seabed with the marine riser it needs a system that compensates for the relative motion. A general understanding of how this system works is needed to understand the emergency disconnection and recoil. This chapter explains the major components involved, their function and how it works together. The blow out preventer and the lower marine riser package are introduced in chapter 3. The recoil analysis executed in this thesis is based on riser and system data from the Aker Solutions semi sub “Aker Spitsbergen”. This data is presented last in this chapter and was given to me through the PhD thesis of Ronny Sten. [Sten, 2012] At the lower end of the marine riser we have the blowout preventer (BOP), lower marine riser package (LMRP) and lower flex joint. Up through the water column the marine riser consist of riser joints connected together building up the total riser length. The upper end of the riser consists of tensioner ring, telescopic/slip joint (inner and outer barrel) spacer joint and upper flex joint. The telescopic joint allows for relative motion, the tensioners are connected to the tensioner ring, and the flex joints allow small rotations on each end of the riser due to environmental loads. Figure 2.1 shows a schematic model of the marine riser with the tensioner system. 6 NTNU Norwegian University of Science and Technology Department of Marine Technology Figure 2.1 -‐ Schematic model of the riser tensioner system 7 NTNU Norwegian University of Science and Technology Department of Marine Technology 2.1 Marine riser The marine riser or drilling riser can come in many different shapes. The dimensions will mainly depend on water depth and buoyance needed. The traditional drilling riser is a large steel pipe with two smaller pipes on the outside (kill and choke). It can also have some smaller piping for electric or hydraulic control. The main pipe is for drill pipe and drilling mud, while the choke and kill line are high-‐pressure lines for well control. The total riser length consists of smaller joint in standard lengths connected together. The typical joints can vary in standard lengths from 10 to 25m. One riser joint alone is a fairly stiff construction, but when they are put together for deep water drilling they have little global stiffness and depends on tension to guarantee a straight riser column. A straight column is critical for letting the drill pipe pass through and to not bend or buckle the construction. The application of tension to the riser happens by normally 4 or more hydraulic tensioners. Figure 2.2 -‐ Typical riser joint with foam buoyancy elements [13] 2.2 Riser tensioners There are mainly two types of riser tensioners used, the direct acting tensioner (DAT) and a wire line tensioner system. Both systems utilizes hydraulic pulling cylinders, DAT 8 NTNU Norwegian University of Science and Technology Department of Marine Technology are directly connected between the tensioner ring and drilling unit. The cylinders on the wire line system are placed on deck and connected to the tensioner ring through blocks and wires. Typical stroke lengths for a world wide drilling unit are 16meters. Total tension applied to the riser can be in the range of 2000-‐8000kN. The DAT system is demonstrated in figure 2.1. The following figure gives a simple schematic model the wire line tensioners. Figure 2.3 -‐ Schematic model of wire line tensioner system [Grytoyr et al. 2011] The main function of the riser tensioners is to keep a nearly constant tension in the marine riser. The tensioners ensure enough global stiffness to keep the column within the limits (degrees at upper and lower flex joint) and to never have local compression. The total tension needed will depend on the condition, water depth, mud weight and buoyancy of the drilling riser. An equation for the minimum top tension required is given by the American Petroleum Institute [API 16Q]. !!"# =
!!"
!"#
!
!! (!!!)
Eq. 2.1 Where; T!"!"# = W! f!" − B! f!" + A! d! H! − d! H! = Minimum slip ring tension 9 NTNU Norwegian University of Science and Technology Department of Marine Technology W! = Submerged riser weight above the point of consideration f!" = Submerged weigt tolerance factor (minimum value = 1.05 unless accurately weighed) B! = Net lift buoyancy material above the point of consideration f!" = Buoyancy loss and tolerance factor resulting from elastic compression, long term water absorption and manufacturing tolerance (maximum value = 0.96 unless accurately known by submerged weighing under compression at rated depth) A! = Internal cross section area of riser including choke, kill and auxiliary fluid lines d! = Drilling fluid weight density H! = Drilling fluid column to the point of consideration d! = Seawater weight density H! = Seawater column to point of consideration N = Number of tensioners supporting the riser n = Number of tensioners subject to sudden failure R ! = Reduction factor relating vertical tension at the slip ring to tensioner setting to account for fleet angle and mechanical efficiency (usually 0.9 – 0.95) This involves a fairly large amount of variables and constants. A simplified tension requirement is that the resulting tension between the BOP and LMRP should be between 30– 60 tonnes [Grytoyr et al. 2011]. The tension is optimal when it holds the riser column straight, ensures a safe lift-‐off from the BOP in a disconnection and does not transfer any tension force to the wellhead. The latter is ensured by the large weight of the BOP. However, the wellhead will be subjected to some bending moments. 2.3 Telescopic joint and tensioner ring The upper end of the riser is connected to the platform slightly below the drill deck. The relative vertical movement between vessel and the seabed needs to be compensated. This happens through the telescopic joint (also called slip joint). It is made up from two pipes allowing for vertical movements between them (outer and inner barrel). 10 NTNU Norwegian University of Science and Technology Department of Marine Technology The free lower ends of the tensioners are connected with shackles to the tensioner ring. The ring again goes around the outer barrel of the telescopic joint, and completing the tension application to the riser. Seen from pictures or models of the tensioner system, the ring itself looks like a very small part of the system. The following picture shows a tensioner ring under construction, and demonstrates the massive dimensions of the system. Figure 2.4 -‐ DAT system with tensioner ring [14] 2.4 Flex joints Both current and horizontal displacement of the riser will cause curvature in the riser. To not transfer potential harmful bending moments to the riser, flex joints are used at the upper end of the riser and at the lower end above the LMRP. These flex joints are special designed to withstand high tension, allow drill pipe and mud to pass through and allow for small rotations. The upper flex joint makes sure that the roll or pitch motion of the vessel does not get transferred to the riser [15]. 11 NTNU Norwegian University of Science and Technology Department of Marine Technology 2.5 Pressure system The hydraulic cylinder needs to be pressurised to provide tension. The pressure system is designed to give the cylinders a nearly constant spring force at a required pressure setting. The pressure used in the system depends on the tension needed and can vary from 20 to over 100 bar. Since the cylinders are pulling, they need inflow to retract and outflow to extend. Due to large dimensions, retracting and extending requires large volumes of hydraulic oil. Having large volumes of compressed nitrogen will reduce the pressure variation due to volume change in the cylinders. The schematics of the system can be seen in figure 4 presented earlier in this chapter. The following table gives the details for the system on Aker Spitsbergen [Sten, 2012]. Component number 1 2 3 4 5 6 7 8 9 Component Number of Size Riser tensioner cylinder Nitrogen/oil accumulator skids Shut-‐off valve skids Nitrogen control skids Workings NPV’s Standby NPV’s Low pressure NPV’s Nitrogen generator Nitrogen HP compressor 6 Ø560/Ø230x16300stroke 2 6*4000 litres (two bottles for each cylinder) 6x8” shut-‐off valves 3x4” high pressure lines 2 2 24 10 2 2 2 2250 litres/207 bar 1940 litres/310bar 2000 litres/10bar 2x100N m3/h N2 generator 100N m3/h @310 bar compressor Table 2.1 -‐ Tensioner system for Aker Spitsbergen 2.5.1 Nitrogen / oil accumulators skid The accumulators are vertically mounted pressurised tanks containing oil and nitrogen. The cylinders are supplied with hydraulic oil from the bottom, and the top is connected to the nitrogen pressure vessels. As the fluid level changes, nitrogen goes in and out of the system to maintain a close to constant pressure [Sten, 2012]. 2.5.2 Shut-‐off valve skid A shut-‐off valve is installed for each cylinder on the hydraulic piping between the tensioning cylinder and the accumulator. Their purpose is to be able to shut off the hydraulic supply to the cylinders if needed. The valves are PLC (programmable logic controlled) in a closed loop. In the event of a disconnection, riser failure, rod break or a 12 NTNU Norwegian University of Science and Technology Department of Marine Technology ring break the valves will close. Dependant on the failure they will immediately reduce the oil supply and slow them down to not cause high-‐speed impacts [Sten, 2012]. 2.5.3 Nitrogen control skid The nitrogen control skid is located on the piping between the oil accumulators and the nitrogen pressure vessels. The main purpose is to monitor and control the supply of nitrogen. Both the high pressure and low pressure system goes through the skid. It can increase or decrease the pressure in the nitrogen pressure vessels [Sten, 2012]. 2.5.4 Nitrogen pressure vessels In total there are three different kinds of pressure vessels with different purposes in the pressure tensioning system. The working NPV’s provides pressure to the tensioners and acts like a pneumatic spring. Large volumes will minimalize the tension variations to the cylinders [Sten, 2012]. The common pressure vessel or low pressure NPV is connected to the low-‐pressure side of the cylinder (push side). The function is to keep a low constant pressure of nitrogen on this side. Nitrogen (together with some oil to lubricate) will protect the inside of the cylinder from corrosion. The external connection between cylinders and the NPV is by a 2” ball valve. This small bore will act as a cushion when the cylinder retraction speed is high. Nitrogen cannot escape as fast as the piston is moving and results in a pressure build up on the piston side working against the pressure on the rod [Sten, 2012]. The standby NPV’s gives a redundancy to the system, they store quick accessible high-‐
pressure nitrogen. They provide extra pressure to the system if needed [Sten, 2012]. 13 NTNU Norwegian University of Science and Technology Department of Marine Technology 2.6 Marine riser components data Type Marine riser BOP LMRP Marine riser with buoyancy Telescopic joint Tensioner ring Upper flex-‐joint Lower flex-‐joint Description WT OD ID OD ID Mass dry Mass submerged OD ID Mass dry Mass submerged Max OD Joint length Volume, per joint Mass Length Mass Maximum stroke Friction OD (outer barrel) WT (outer barrel) OD (inner barrel) WT (inner barrel) Mass Rotational stiffness Max working tension Max compression Max angular deflection Rotational stiffness Max working tension Max angular deflection Values 22.225 mm 533.4 mm 488.95 5.5 m 476 mm 226 740 kg 197 264 kg 4.5 m 476 mm 116 433 kg 101297 kg 1371.6 mm 22.86 m 21.2 m3 31 000 kg 32.0 m 24 200 kg 18.3 m +/-‐ 100kN 660.4 mm 25.4 mm 527.3 mm 19.1 mm 10 000kg 12.88 kNm/deg 8900 kN 90 kN +/-‐ 10deg 92.2 kNm/deg 8900 kN +/-‐ 10deg Comments Ex. tensioner ring Midstroke Outer barrel ex. Tensioner ring Table 2.2 -‐ Marine riser components [Sten, 2012] 14 NTNU Norwegian University of Science and Technology Department of Marine Technology Chapter 3 The emergency disconnection sequence and riser recoil The emergency disconnection sequence (EDS) makes it possibly for a mobile offshore drilling unit (MODU) to securely disconnect the riser from the blowout preventer. The need for disconnecting can come from several different scenarios, but it is mainly when the drilling unit can no longer maintain its position over the well and to not damage the wellhead by transferring large forces. The disconnection happens between the BOP and LMRP, at the LMRP connector. The BOP remains over the wellhead and seals it off. The LMRP and riser are lifted clear and the platform can move freely. If there is a drill pipe in the well, blind shear rams will cut through the pipe and seal the well. This system is required for all dynamical positioned and moored drilling units [Kavanagh et al. 2002]. 3.1 Reasons for disconnecting The main reason to disconnect is when the platform cannot hold its position over the well. Large offsets can cause stroking out of the telescopic joint or the tensioners. To avoid damage to the wellhead and the equipment the emergency disconnection is activated. Many different unpredictable scenarios might happen to a platform that will make it need to disconnect, for example the Macondo accident. 3.1.1 Drift-‐off Drift-‐off is when the dynamical positioning system of the platform no longer can keep the platform in place. As the platform will not be put to operation in harsher environment then the DP system can handle, this is a problem normally caused by loss of power, malfunction in the system, engine breakdown, mechanical or human errors. When the DP system no longer can hold the position, the forces will be transferred to the riser connected to the wellhead. This will cause a lot of pulling and horizontal forces (due to the offset of the rig) that will or might damage the well [Kavanagh et al. 2002]. 3.1.2 Drive-‐off A drive-‐off is much the same as a drift-‐off, but the cause is different. It comes from a malfunctioning in the DP system causing the rig to drive off from its location. This can be a very critical event due to higher velocities. This gives a short available time to activate the EDS before the horizontal offset gets to large [Kavanagh et al. 2002]. 15 NTNU Norwegian University of Science and Technology Department of Marine Technology 3.1.3 Storm Generally the MODU will disconnect from the well before a storm is fully developed. If the storm forecasted is larger then the operational limits for the drilling unit, then it need to disconnect both for safety of rig and not to cause damage to the wellhead. This is called a planned disconnection. The Gulf of Mexico is an area with a lot of dynamical positioned deep-‐water drilling. When there is a storm warning the drilling unit will pull up the drill pipe and disconnect. For large depths this sequence can take up to 2-‐3 days and causes a lot of downtime for the rigs. However if the storm is larger than anticipated or takes the vessel by surprise a disconnection in the storm is needed. Even if the mooring or dynamical positioning can hold the vessel in position it needs to disconnect to not damage equipment or the wellhead [Kavanagh et al. 2002] [C. Nguyen et al. 2006]. Limits for disconnection vary for different vessels and system design. Some operational drilling limits from Dolphin Drilling are given as examples here [17]. Blackford Dolphin, Aker H3 semisub, drilling conditions: •
•
Hs 8.4 m Max wind 100 knots Bolette Dolphin drillship, drilling conditions: •
•
•
•
Hs = 6.7 m Tp = 10-‐13 s, Vwind = 25 m/s Vcurrent = 0.8 m 3.1.4 Mooring failure Severe mooring failure can cause the vessel to drift off from its position, and it will then need to disconnect in the same way as for a drift-‐off [Kavanagh et al. 2002]. 3.1.5 Shallow gas expansion When gas leaks out of the well or seabed and expands upwards through the sea column it endangers the buoyancy of the vessel. [Dolphin Drilling, 2013] has a procedure called “Shallow gas and emergency pull of procedure” (internal classified document). If the gas leak cannot be stopped the rig needs to disconnect and pull off location. The pull of procedure can be split into controlled pull off and emergency pull off. The name pull off comes from the mooring of the rig where it uses the winches to pull off the location. 3.2 Procedures and activation of the system Since the emergency disconnection is case dependant, there is no easy way to describe the general procedure. It will depend on why the disconnection is needed and the state 16 NTNU Norwegian University of Science and Technology Department of Marine Technology of the vessel. Every emergency system needs to be redundant and generally there are three different ways to initiate the disconnection: Manually from the bridge or control room, automatic mode function (AMF) and through ROV intervention locally at the BOP. Activating the EDS will lead to a sequence of events. One example was found in [Bernard et al. 2004]. a) b) c) d) Close all side outlet valves, shutdown mud pumps; Pick pipe up off bottom for preparation to hang off; Close pipe rams; Hang off pipe, balance pipe load for neutral weight shear to avoid main block recoil; Lock pipe rams; Close shearing rams (may also be sealing shear/blind rams); Pick up pipe; Close blind rams, if different from shear rams; Lock blind rams; Vent all pod to stack pressure connections; Vent LMRP annular preventer(s); Unlatch LMRP connections, main connector, mini connectors, if fitted; Activate riser recoil system. e) f) g) h) i) j) k) l) m) More generally it can be said that the EDS will cut the drill pipe, seal the well, open annular for mud release (if closed) and disconnect the LMRP connector. Activation of anti recoil system can happen manually or automatically depending on system. Time from EDS activation to disconnection of the riser can be around 60 seconds. 3.2.1 Automatic mode function (AMF) The EDS is designed to activate automatic if the communication between the bridge and BOP is lost. This is called the automatic mode function. The surface vessel has both hydraulic and electric communication with the BOP. If these two lines are damaged and the connection with the BOP is lost it activates. The BOP is equipped with battery and hydraulic power to function without power from the bridge. This system activated the disconnection for the Deepwater Horizon platform, but it was unsuccessful to seal the well and disconnect due to other circumstances. The AMF has also led to cases of unplanned emergency disconnections [West Engineering services Inc. 2003]. 3.2.2 Drift-‐off For drift-‐off normally 2 alert circles define the EDS activation. A yellow alert circle includes a procedure for discontinuing drilling and hanging the drill pipe off in the BOP stack. The red alert circle signals the captain or driller to “activate the red button” to start the automatic sequence. These circles will be defined by the drift-‐off speed of the vessel, the time disconnection takes and the exceedance of limits in the riser. The 17 NTNU Norwegian University of Science and Technology Department of Marine Technology limiting factor can be the top riser angle, bottom riser angle, telescopic joint stroke, wellhead moment and/or conductor moment [Chakrabarti, 2005]. For the disconnection the vessel can be considered to be in one of the two following modes: “drilling operation” where the conditions are suitable for drilling, and “state for readiness” where conditions prohibit drilling operation. Due to more time demanding sequence for disconnecting in the drilling operation, the alert circles can vary between these two modes. The alert circles are normally given in percent horizontal offset of water depth. An example is given for the Gulf of Mexico for an environment condition with 95% non-‐exceedance limit used for drilling operation [Chakrabarti, 2005]. 4500 ft - Red Alert Circle = 225 ft (5% WD); Yellow Alert Circle = 72 ft (1.6% WD) 9000 ft - Red Alert Circle = 360 ft (4% WD); Yellow Alert Circle = 180 ft (2% WD) In these examples, the results in 4500 ft of water are governed by yield of the conductor pipe; whereas the results in 9000 ft of water are governed by stroke-‐out of the slip joint. 18 NTNU Norwegian University of Science and Technology Department of Marine Technology 3.3 Blowout preventer and lower marine riser package Figure 3.1 -‐ Blowout preventer and Lower Marine Riser Package The blowout preventer, BOP or BOP-‐stack is one of the most important tools in oil drilling. It consists of various types of blowout preventers on top of each other and therefore the name BOP-‐stack. The BOP is made to prevent blowouts from the high-‐
pressure reservoirs during drilling. The main tool to keep a well under control is by equalising the pressure with the weight of the drilling mud. Annulars and rams are a second solution to seal off the well when it is needed. Rams are hydraulically driven steel rams with rubber gaskets designed for different purposes, some seal off the flow around the drill pipe, while others can cut the drill pipe and seal the flow by completely shutting the area. Annular uses pistons to push an elastic rubber material into place, 19 NTNU Norwegian University of Science and Technology Department of Marine Technology which can seal around a pipe or seal the empty area. The types and numbers of annulars and rams on a BOP can vary. LMRP stands for Lower Marine Riser Package and is the upper part of the BOP. Here the control pods are located, Choke and kill lines connected, and upper and lower annular can be located here. During a disconnection the LMPR is disconnected from the BOP and leaves the BOP alone on the seabed to control the well. With an annular located in the LMRP, the mud column can be retained during an emergency disconnection. It is said that retaining the mud can give unwanted dynamical properties of the riser and it is normally discharged. 3.3.1 Blind shear rams The blind shear rams are two hydraulically driven rams/blades that can cut through the drill pipe and seal off the well. The blind shear rams are not designed for cutting off the drill pipe on the tool joint. Figure 3.2 Blind shear rams [20] 3.4 The events of the recoil Disconnecting the tensioned riser from the BOP will lead to a series of events. The riser can be looked at as a tensioned spring where the axial stiffness of the riser represents the spring stiffness. The elastic elongation can be up to 0.4m for a riser length of 1000 meters [Gronevik, 2012]. This will create an elastic pulse traveling up the length of the riser when it is released at the lower end, but this not a dominating effect. 20 NTNU Norwegian University of Science and Technology Department of Marine Technology “The elastic energy stored in the riser due to the over pull at the LMRP connector is released and travels along the length of the riser as an elastic pulse. This is usually not a dominating effect” [Grytoyr et al. 2011]. The energy stored in the riser and the tension from the tensioners will accelerate the riser upwards. The magnitude of the acceleration will depend on the total tension in the system and the tension released at the connecter (normally 300 – 600kN). Due to the pressure difference of the sea bed and the actual drilling depth, the mud column will discharge and following we have a loss off mass in the riser, and a friction force working opposite of the mud discharge. To slow down the riser the vessel needs to be equipped with anti recoil system. This system is designed to absorb the impact from the sudden force imbalance in the riser. The following figure shows a detailed sequence of events and was a part of Decao Yin’s trial lecture on the subject. Figure 3.3 -‐ Sequence of events [Yin, 2013] 21 NTNU Norwegian University of Science and Technology Department of Marine Technology 3.5 Different aspects needed in a recoil analysis 3.5.1 Impact between BOP and LMRP With large heave motions on the vessel and bad disconnection timing, the result can be that the platform is moving down with a great velocity while the riser recoils. If the down movement of the platform gets larger than the retraction velocity of the riser, a collision between the BOP and LMRP can occur and cause damage to the well and equipment. The reason for disconnecting is most often the drilling units inability to keep inside of a certain radius of the well. This means that (most likely) the drilling unit will not be positioned above the well during the disconnection. When the marine riser then is released it will be a pendulum effect. The LMRP will then be cleared horizontally away from the BOP. Due to guesstimated large damping in a system like this, the pendulum will not come back and hit the BOP. 3.5.2 Compression and buckling When the riser recoils upwards it has to be slowed down to not come crashing into the drill deck. The slowing down happens through an anti recoil system and large damping forces. First all the length of the riser is accelerated upwards, then it will be slowed down mainly due to force variation and damping of the tensioner system. This exposes the upper part of the riser to possible compression forces. The tension in this area should be large because of the hanging weight of the riser below. But being decelerated from the tensioners at the top and having the mass of the lower part of the riser coming from the bottom can cause compression if the anti recoil system is not well tuned. The Euler load for buckling of a beam (free to rotate at upper and lower end): !! = !! !"
!!
Eq. 3.1 Where EI is the bending stiffness and L is the length of beam. With this equation it becomes apparent that the load required to buckle a long connection of riser joints is very small. The bending stiffness is 2.45*108 for the riser cross section. The actual buckling load might be smaller; the upper end has rotational stiffness, while the lower end is somewhat free to move. Some example of buckling force without accounting for the flanges: •
•
1 riser joint, 22m, buckling load: 4995kN 5 riser joints, 110m, buckling load: 199kN 22 NTNU Norwegian University of Science and Technology Department of Marine Technology •
10 riser joints, 220m, buckling load: 50kN This shows the tendency that if a large length of the riser gets compression forces, it is likely to buckle. 3.5.3 Hang-‐off dynamics The term hang-‐off refers to any time the marine riser is hanging freely from the vessel, i.e. not connected to the seabed. The different cases are often termed “running/retrieval” and “storm hang-‐off.” In the running case the purpose is to lower down and connect the BOP to the wellhead, retrieval when disconnecting the BOP from the well and retrieving the marine riser. The hang off mode concerning the recoil analysis is the storm hang-‐off, where the BOP is left on the wellhead and the LMRP hangs in the riser. This can either be a hard or soft hang-‐off, the difference is if the riser is suspended from the Rotary Kelly Bushing (RKB) or from the tensioners. After the recoil the riser will be suspended from the tensioners. The soft hang off mode is better then the hard hang off for a storm situation. This is because of the difference in the fundamental Eigenperiod in the axial direction of the riser. The soft hang-‐off has the spring stiffness of the tensioners, while the hard hang-‐off is directly connected to the vessel motions. The hang off mode imposes a challenge due to the open end of the riser. The fluid inside the riser will contribute to the inertial forces in the radial direction, but not directly in the axial direction [Chakrabarti, 2005]. This is further discussed in chapter 6. 3.6 Anti recoil system If the riser is free to recoil without any form of damping or slowing down the riser is likely to come crashing into the drill deck and can damage valuable equipment. Therefore anti recoil systems have been developed and are crucial to safely disconnection the high tensioned riser. One example system, the EDS includes an automatic command to close air pressure vessels (NPVs) normally kept open to maintain small tension variations during operations. This causes a sudden increase in the system’s vertical stiffness [Chakrabarti, 2005]. 3.6.1 Anti recoil for DAT cylinders A big advantage with direct acting tensioners is the ability to control the upward movement for the riser. The loss of tension in the riser when the LMRP is disconnected from the BOP will cause the cylinder to retract. As the cylinders are designed, retraction means that oil will flow from the accumulators and into the riser. The shut off valves between the cylinders and pressure accumulators control this flow, the retraction can be controlled by gradually closing this valve [Sten, 2012]. 23 NTNU Norwegian University of Science and Technology Department of Marine Technology Figure 3.4 -‐ Closure curve for shut-‐off valve The anti recoil systems main components are a cylinder position measuring system and the PLC controlled shut-‐off valves. The PLC system monitors for speed and position combination that is unlikely to occur. After processing this information the PLC system can enter different scenarios like single cylinder failure, riser disconnect or planned disconnect. If the flow is reduced to rapidly the riser can start to go in compression and buckle, so as the cylinder position is reducing the shut-‐off valve are proportionally reduced, when the cylinders are completely retracted the shut off valves are normally over 80% closed. 24 NTNU Norwegian University of Science and Technology Department of Marine Technology Chapter 4 Recoil analysis and modelling in SIMA RIFLEX To cover the different cases for analysis, three different RIFLEX models were developed. A model with direct acting tensioners on 500m water depth, one wire tensioner system for 500 meter water depth, and one ultra deep water with direct acting tensioner on 1500 meter water depth. Doing a recoil analysis in RIFLEX requires some pre processing and is presented here. 4.1 General modelling in SIMA RIFLEX In RIFLEX one can chose to model one of the standard systems (SA SB SC SD) or an arbitrary system. The standard systems covers seabed to vessel, seabed to vessel with tangential touch down, free upper end and free lower end. The arbitrary system is used for modelling of the marine riser because it gives more flexibility in the modelling. The model itself is made up of supernodes, lines, line types and cross sections. Coordinates and boundary conditions are given to the supernodes. Lines provides the topology definition in the model i.e. connecting the supernodes together. Line types provide length, number of elements and used cross section for each line. Cross sections provide all data for stiffness, mass, damping and hydrodynamic coefficients. 4.1.1 LMRP connector A time given boundary change in the dynamic calculation simulates the disconnection between the BOP and LMRP. Normally 3 nodes will model the BOP and LMRP, where the lower node of the BOP is fixed, one between them and one at the top of the LMRP. To be able to disconnect one cannot “free” a node that is already free. Fixing the lower node of the LMRP will solve the problem, but the forces in the BOP will be zero. The system is then modelled with a double supernode between the BOP and LMRP with a master – slave relation. Setting the slave node to free at the wanted time activates the disconnection. 4.1.2 Connecting tensioners to the riser The lower end of the piston rods are connected to the tensioner ring that goes around and secures the riser. The tensioner ring in RIFLEX is only modelled as a nodal body with mass. The tensioners are connected to the riser with master slave relationship. This transfers all the forces, without a physical connection. A “ball joint” at each end of the tensioner rod allows for rotations. The tensioners are modelled vertically, the upper end moves into place in the static configuration. 25 NTNU Norwegian University of Science and Technology Department of Marine Technology Figure 4.1 -‐ Modelled riser tensioner connection 4.1.3 Flex joints Upper and Lower flex joints are crucial to a model with current and horizontal offset. SIMA RIFLEX provides a built in model for flex joints where free, linear and non-‐linear stiffness can expressed. Flex joints can also be modelled by a beam element with the correct bending stiffness and this was used for the 500 m model. Built inn flex joints were used for the 1500 m model. The stiffness of the joints is presented in table 2.1. 4.1.4 Drift-‐off To simulate drift-‐off the support vessel was given a horizontal offset in the static calculation. The vessel is stationary in the dynamical calculation. A better model would be to calculate the drift-‐off velocity of the vessel and have it included in the dynamical calculation. This option is not implemented in SIMA RIFLEX, but could be done in batch mode of RIFLEX. 4.1.5 Telescopic joint The telescopic joint is modelled by giving the beam close to zero axial stiffness. It is then free to elongate and retract. This model has the weakness of not having an elongations limit (stroke out of the joint). But can be controlled by the tensioner’s stiffness variation. 4.2 Mud discharge The mud can be retained in the riser by closing the annular in the LMRP. This is not wanted due to the dynamical response properties for the marine riser. With the mud retained the period for the fundamental natural frequency changes with increasing mud weight and enters into the periods for the waves. It has been shown that the sea state 26 NTNU Norwegian University of Science and Technology Department of Marine Technology required for buckling of the riser is greatly reduced when retaining the mud column [Young et al. 1992]. The drilling mud is then discharged after the disconnection. The pressure difference at the seabed and inside the marine riser can be very large for deep water. Example with a depth of 500 meter and mud with density 1600 kg/m3 gives a hydrostatic pressure difference of !!"# − !!"#$#%"& = !ℎ !!"# − !!"#$#%"& = 2820375!" = 28.2 !"# Eq. 4.1 This will cause a rapid outflow of the mud. Friction will slow the flow down and add forces to the riser. The discharged mud needs to be replaces with seawater which will reduce the weight of the riser as it is being discharged. The frictional force from the mud discharge and water refill is a slow acting force over longer time compared to force unbalance that occurs at the tensioners. Another effect from the mud discharge is the inverse water hammer effect. The water hammer effect is when you rapidly close a valve, and the momentum of the fluid motion is stopped in a short period of time by compressibility in the fluid and elastic deformation of the pipe. When the end off the marine riser is exposed to the lower surrounding pressure, a pressure impulse will travel through the mud, and can lead to vaporisation pressure inside the marine riser when seawater cannot be filled fast enough, this can lead to collapse of the risers [Miller et al. 1998]. To avoid collapse of riser, several refill valves can be needed and are placed along the length of the riser. For large water depths these are critical to avoid riser collapse. This effect is not included in this thesis, and it’s assumed that the seawater is refilled at the top position. Mud discharging from a riser that is accelerating upwards is a very complex fluid dynamical problem and the calculations here are simplifications only trying to include the major effects such as friction and mass loss. This will be discussed more in chapter 6. 4.2.1 Modelling of mass loss and frictional forces In the recoil analysis the two major effects needs to be accounted for. Mass loss and friction forces. [Grytoyr et al. 2011] proposed that the slug model with constant velocity gives the best reproduction of the mass loss. The slug is modelled with the same length as the riser, and has a mass expressed by the density of seawater and internal volume of the riser. The slug model gives no contribution to forces. Friction forces are added as user specified dynamical nodal forces. In RIFLEX dynamical forces are expressed either as a constant force, linear increasing force or constant force with time on and time off. This gives a lot of possibilities in modelling forces. 4.4.2 Calculation of mud discharge velocity and friction forces. 27 NTNU Norwegian University of Science and Technology Department of Marine Technology MATLAB was used to perform a time wise rigid body analysis of the mud column for the mud discharge, [Appendix]. It is based on dynamical equilibrium between hydrostatic pressure at the lower end of the riser, friction forces and the weight of the mud. It is assumed that the water refill rate at the top matches the mud discharge. The friction forces from the seawater are included until the all the mud is discharged. The hydrostatic pressure difference at the lower end of the riser will vary with the length of the mud column and density of mud. The weight will decrease as the mud is being replaced by seawater. The friction forces are proportional to the velocity squared. The theory for calculating friction forces is taken from [White, 2008]. The pressure drop or head loss is found from the Darcy-‐Weisbach formula: !" = !! ! !"
!!
Eq. 4.2 Where ! is the density of the fluid, U the velocity, f the frictional coefficient, L the length, and D the internal diameter of the pipe. The frictional coefficient can be found from the Moody chart, but since the flow velocity is changing, the Haaland formula was used instead. !
!
!!
!.!
= −1.8log !!!
!
!
+
!.!!
!.!
Eq. 4.3 !
Where ! is the relative roughness and Re is the Reynolds number for the fluid. These equations only calculate the pressure drop due to the frictional forces on the mud. As input for RIFLEX the friction forces working on the riser are needed. Head loss can be written as: ℎ! =
!!! !
!"#
!"
= !" Eq. 4.4 Where ℎ! is the head loss [m], !! is the wall shear stress [N/m2]. By rearranging the two last terms, we can express the shear stress with the pressure drop. !
!! = !" !! Eq. 4.5 The shear stress works at the inside surface area of a pipe, multiplying by !"# as the surface gives: !
!!"#$%#&' = !" !! × !"# = !"
!! !
!
Eq. 4.6 Which relates the pressure drop in the riser due to friction, and the resulting force working on the riser. The following figures shows example results for the discharge; water depth is 500m and density of mud 1600 kg/m3. 28 NTNU Norwegian University of Science and Technology Department of Marine Technology Figure 4.2 Mud discharge velocity, the maximum velocity is 18m/s after 6 seconds Figure 4.3 Friction forces acting on the riser, 1700 N/m at the most 29 NTNU Norwegian University of Science and Technology Department of Marine Technology From the figure one can see that the mud column uses around 6 seconds to accelerate to the maximum velocity of 18 m/s. After the top, the friction forces are greater than the resulting force from mud weight and hydrostatic pressure. This will slow the flow down. At 6 seconds the riser has already recoiled due to the unbalanced force from the tensioners. A MATLAB script [Appendix] takes the friction force and writes to a text code that is copied into the sima_dynmod.inp file. RIFLEX has input for the user specified dynamical forces, and can be set to the local or global coordinate system. Using the local system adds the forces to the elements, the global saves the forces to the nodes [RIFLEX user manual]. The global system is used in this analysis, and the force is divided up to nodes with short interval throughout the length of the riser. To describe the force variation in a best possible way 3 different forces are applied. One linear increasing, one constant and one linear decreasing force. 4.3 Modelling of tensioners Two different types of riser tensioners are used in the industry. Direct acting tensioners (DAT) and wire line tensioners. The difference for a recoil analysis is that the wire line tensioners will go slack if exposed to compression forces (can make them jump off the blocks), while the direct acting tensioners can provide more controlled recoil of the riser through flow control. Tensioners can be modelled in different ways. RIFLEX offers a pipe in pipe modelling option. This means that the rod enters into the cylinder, and contact forces between these two elements are calculated. A simpler model uses one beam element as a cylinder and one beam element as the rod. The rod is given the needed pre tensions in mid position and elongation characteristics calculated from a change of volume in the nitrogen pressure vessels. 30 NTNU Norwegian University of Science and Technology Department of Marine Technology Figure 4.4 -‐ Different tensioner models 4.3.1 Tension variation Top tension needs to be tuned to give an effective tension between the BOP and LMRP of 30-‐60 tons to safely remove the LMRP. The top tension needed from the tensioners will then depend on the riser configuration and usage of buoyancy elements. The static top tension applied is based on the tensioner rod in mid position, i.e. halfway inside the cylinder. RIFLEX needs input for axial force to relative elongation [-‐] for the beam element acting as tensioner rod. The tension variation as a function of stroke length can be calculated when the internal area, and pressure needed to give the tension in mid position is know. The up and down movement of the tensioner rod will give a change of volume in the oil/nitrogen accumulator and nitrogen pressure vessels. This change of volume is regarded an adiabatic process i.e. without change of heat between the system and its environment. The following equation gives the relationship between the pressure and volume of system. The pressure on the low-‐pressure side of cylinder is neglected in this calculation, however the effective pressure on the piston in the cylinder would be a few bar smaller. !×! ! = !"#$%&#% Eq. 4.7 Where P is the pressure in the system, V the volume, ! is the adiabatic gas constant, which is 1.404 for N2 at 15 degrees [White, 2008]. 31 NTNU Norwegian University of Science and Technology Department of Marine Technology !!"# =
!
!!"!#!$% !!"!#!$%
!
!!"#
Eq. 4.8 An excel sheet was used to calculate the tension variation for different NPV initial pressure settings. Internal diameter cylinder Diameter piston rod 0.560m 0.230m Internal area (pressure area) Volume change 1m stroke Volume NPV’s + half accumulator volume 0.205 m2 0.205m3 9+4 = 13m3 Table 4.1 -‐ Geometry for pressure change calculation Tension variation for stroke lengths 350 Tension variation [kN] 300 +2 meter stroke 250 -‐2 meter stroke 200 150 +5 meter stroke 100 -‐5 meter stroke 50 0 410 (20) 820 (40) 1230 (60) 1640 (80) 2050 (100) 2460 (120) Tension setting [kN] (bar) Figure 4.5 -‐ Tension variation for 2 and 5 m stroke length as function of initial pressure setting 32 NTNU Norwegian University of Science and Technology Department of Marine Technology Tension variation for 30bar 750.0 Tension [kN] 700.0 650.0 600.0 550.0 450.0 -‐7.5 -‐7 -‐6.5 -‐6 -‐5.5 -‐5 -‐4.5 -‐4 -‐3.5 -‐3 -‐2.5 -‐2 -‐1.5 -‐1 -‐0.5 0 0.5 1 1.5 2 2.5 3 3.5 4 4.5 5 5.5 6 6.5 7 7.5 500.0 Elongation [m] Figure 4.6 Tension variation for 30 bar tension setting as function of elongation The pressure drop or tension variation calculated includes only the pressure change due to volume change as the piston goes in and out. An additional pressure drop will come from the friction from the flow in the pipes. This pressure drop is described by the Darcy-‐Weisbach formula. !" = !! ! !"
!!
Eq. 4.9 Where ! is the density of the hydraulic fluid, U the fluid flow ! is the dimensionless friction factor, L is the length of piping and D is the diameter in the pipe. The frictional coefficient can be found from a moody diagram once the fluid flow and Reynolds number are known. The length of the piping is system dependant but can be assumed to be around 20-‐30 meters. The fluid flow will be depending on the stroke velocity i.e. dependent of the condition, heave amplitude and period. A run was made in RIFLEX to get a picture of how the stroke velocity varies. The heave transfer functions shows very little heave amplitude below wave periods of 10 seconds, therefore a 12 second period was chosen to get some large motions. 33 NTNU Norwegian University of Science and Technology Department of Marine Technology Figure 4.7 -‐ Stroke velocity for regular waves 14s period, 12 meter amplitude, corresponds to a cylinder stroke of around +-‐5meters, this is close to the maximum the system can handle. Calculation of flow in pipes: The volume needed to move the piston 2m equals 0.410m3 and the volume flow is then 0.410m3/s. The piping diameter that supplies the hydraulic oil to the cylinder is assumed the same as the diameter for the shut-‐off valves. There are 2 supplies per cylinder. This gives a velocity in the supply pipes to the cylinder of, !
!!!!"#$%& = !!
!!"#$
!"#$%"&'
!
= 6.3!/! Eq. 4.10 The Reynolds number will vary from 103 to 105 depending on flow velocity and temperature of hydraulic oil (viscosity for oil is highly temperature dependant). Relative !
roughness ! is very close to the smooth pipe, ! = (0.01 − 0.05!!). The Moody chart then gives a frictional coefficient of 0.04 (low Re) to 0.025 (higher Re) Darcy – Weisbach formula then gives for high velocity case !" = !! ! !"
!!
= !"""×!.!! ×!.!"×!" !×!×!.!"#$
= 6.10×10! !" = 6.1 !"# Eq. 4.11 This pressure loss will reduce the force from the tensioners, but is not proportional to the stroke displacement, but to the velocity of the stroke squared. And will then act as a damping force. This can be added in RIFLEX as axial damping force to the tension-‐
elongation beam element. And will be proportional to the strain rate squared. A pressure loss of 6.1 bars equals a tension loss of 125kN from each cylinder. This shows that the system has large tension variations when the heave amplitude gets large and 34 NTNU Norwegian University of Science and Technology Department of Marine Technology the period is short. The cylinders are designed for an upper limit of 2 m/s stroke velocity [Sten, 2012]. [Sten, 2012] calculated through SimulationX that the tension variation is +-‐ 108 kN from the mean 617kN for heave amplitude of 2 meters and a period of 12 seconds for the 30 bar tensioner setting. Same condition will in the simplified condition only give +-‐ 60kN. The simplified condition is conservative, and pressure change on the low-‐pressure side should be included and a coupled analysis is needed. 4.3.2 Riser tension distribution The tension will normally vary along the depth for the marine riser. A riser with a lot of buoyancy elements can be close to natural buoyant. Then the tension applied at the top will be close to the same above the LMRP. However if the riser consist of joints without buoyancy and contains heavy mud a lot of top tension is required to carry the weight of the riser and give enough tension at the LMRP connector. The LMRP itself is a heavy structure and can be over 100 tonnes in submerged condition. The models used in this thesis have over 2/3 of the length built up by buoyancy elements. 4.4 Anti recoil system Anti recoil system is a vessel specific component and comes in many different set-‐ups and can involve manual or automatic control systems. The anti recoil system specified in this thesis controls the inflow of hydraulic fluid to the cylinder, i.e. controls the velocity the piston can retract with. This is attempted to model with an increasing damping force as the length of the tension-‐elongation element moves towards zero length. The damping is set to 500 Ns2/m2 for +/-‐ 2-‐meter elongation. When the piston retracts and reaches -‐0.8 and -‐0.9 of relative elongation this value is set to respectively 105 and 106. These values are tuned through testing, to high damping gives compression in the cylinder and riser. To low value will cause a large impact and make the tensioner elements go unstable 4.5 Hydrodynamic loads Including hydrodynamic loads due to wave and current is a standard part of RIFLEX. They are described by Morison’s equation. ! = !"
!!
!
!
!! !! + ! !! ! ! ! Eq. 4.12 ! is the density of seawater, D the outer diameter of the riser, !! the mass coefficient, a the acceleration, !! the drag coefficient and u the velocity from waves and current. 35 NTNU Norwegian University of Science and Technology Department of Marine Technology Inputs needed are the drag coefficients and the geometry. In the recoil analysis the drag forces in the vertical direction will be of importance, friction forces for the marine riser (tangential) and the LMRP will create drag. A riser subjected to a current can lead to vortex induces vibrations. This will not be taken into account in this paper. Component Riser joint Buoyant riser joint LMRP Tangential drag 0.1 0.1 2.0 Transverse drag 1.0 1.0 2.0 Drag diameter 0.6 1.0 4.5 Table 4.2 -‐ Used drag coefficients [Grytoyr et al. 2011] 4.6 Vessel motion The vessel motions in SIMA RIFLEX are described by transfer functions that are imported to a support vessel. The upper nodes of the tensioner cylinders and the marine riser have boundaries fixed to the vessel motion. The specific vessel used in the recoil analysis is the semi submersible Aker Spitsbergen (now Transocean Spitsbergen). This is an Aker H-‐6e sixth generation dual activity dynamically positioned DP Class 3 semi submersible designed for water depths up to 2300m. Comparing the transfer functions for head and beam sea shows that head sea is likely to be the preferred condition. It gives slightly less heave for most periods and less drift. One can see from the transfer function in heave that the phase difference is close to zero for periods of 11-‐16 seconds. Which means that choosing the disconnection point referring to wave elevation or heave amplitude is roughly the same. 36 NTNU Norwegian University of Science and Technology Department of Marine Technology Figure 4.8 -‐ Transfer function for heave, head sea 4.7 Model 1 – Disconnection timing •
•
•
•
•
•
•
Water depth: 500 meters Tensioning system: Direct acting tensioners, 30 bar setting. Total top tension applied: 3600kN Tension at LMRP connector: 300kN Condition: Irregular waves, JONSWAP spectre, Hs = 13m, Tp = 12s, no current (see comments for discussion about the waves) Mud density: 1600kg/m3 Objective: Collision between LMRP and BOP. 37 NTNU Norwegian University of Science and Technology Department of Marine Technology Description Drill floor Tensioner hang-‐off location Upper flex joint Spacer joint 60’ telescopic joint 75’ telescopic joint Tensioner ring Mean water level Riser joints Riser joints (buoyant) Riser joints Lower flex joint LMRP BOP BOP lower end Seabed Elevation [m] 40 37.15 35.5 34.2 22.2 10.4 9.9 0 -‐12.5 -‐62.5 -‐442,5 -‐493.7 -‐494 -‐498.5 -‐504 -‐506 Build up length [m] 1.3 12.04 11.79 22.86 50 380 50.2 1.3 4.5 5.5 Table 4.3 -‐ Marine Riser stack up, 506 m water depth 4.7.1 Objective The main objective of this analysis is to look at collision between LMRP and the BOP. [Grytoyr et al. 2011] studied this case, and showed no impact for different disconnection phases on a regular wave, but an increase in heave amplitude and a disconnection phase of 270 and 315 degrees gave the results closest to impact. 270 and 315 degrees are respectively when the platform are on a wave top, and halfway down the wave top. The goal is to replicate this in irregular sea, and demonstrate how the disconnection point can be critical. A JONSWAP spectre with a peak period with 12 seconds and significant wave high of 13meters was chosen to have large heave motions and steep waves. The MODU is placed directly over the BOP to not have a horizontal offset after disconnection. This is analysis is meant to be a worst-‐case scenario to get an impact after the LMRP is supposed to be lifted clear from the BOP. Tension failure and a 100-‐year wave will of course be the worst, so the scenario is designed within reasonable limits. To find the most critical wave in an irregular sea state, long simulations are required. This will take up a lot of computation time and it is unpractical to wait hundreds of seconds before disconnecting. Different shorter time series will be performed instead until a satisfying point is identified. This is the first test setup for recoil analysis and will be used to tune and test the general set up. Some changes needed to be done and are presented in comments below. 38 NTNU Norwegian University of Science and Technology Department of Marine Technology 4.7.2 Comments The JONSWAP spectre is expected to be a reasonable model for [DNV, 2010] 3.6 < !!
!!
< 5 Eq. 4.13 The present condition is on the lower side of this interval; the period should be larger than the significant wave height. The condition was not changed. Due to the harsh environment, large tension variations at the LMRP occurred, and the low-‐tension setting is not likely to be used in this scenario. Disconnections were performed with both low tension and a higher tension setting resulting in 595kN at the connector. The slug model in SIMA RIFLEX was not able to reproduce the mass loss in the riser. This is discussed to length in chapter 6.3 and 6.4. The results are assumed to be valid in the first 10 after the disconnection and not in hang off mode. 4.7.3 Results pre processing Figure 4.9 -‐ Mud discharge velocity 39 NTNU Norwegian University of Science and Technology Department of Marine Technology Figure 4.10 -‐ Lenght of mud column Figure 4.11 -‐ Friction forces on riser N/m 4.8 Model 2 – Drift off in ultra deep water •
•
•
•
•
•
•
Water depth: 1500 meters Tensioning system: Direct acting tensioners, 70 bar setting. Total top tension applied: 8760kN Tension at LMRP connector: 415kN before drift off Waves: JONSWAP spectre, Hs = 12m, Tp = 14s Current: 1m/s at surface, linear decrease to zero current at seabed Mud density: 1600kg/m3 40 NTNU Norwegian University of Science and Technology Department of Marine Technology •
•
Objective: Simulate drift off in harsh weather Horizontal offset: 75m Description Drill floor Tensioner hang-‐off location Upper flex joint Spacer joint 60’ telescopic joint 75’ telescopic joint Tensioner ring Mean water level Riser joints Riser joints (buoyant) Riser joints Lower flex joint LMRP BOP BOP lower end Seabed Elevation [m] 40 37.15 35.5 34.2 22.2 10.4 9.9 0 -‐12.5 -‐262.5 -‐1262,5 -‐1492.7 -‐1494 -‐1498.5 -‐1504 -‐1506 Build up length [m] 1.3 12.04 11.79 22.86 250 1000 230.2 1.3 4.5 5.5 Table 4.4 -‐ Marine riser stack up, 1506 m water depth 4.8.1 Objective In the drift-‐off or drive-‐off simulation the vessel is assumed to loose its ability to maintain its position over the well. The emergency disconnection procedure is initiated at a 4 % horizontal offset of the water depth. The procedure can take up to 1 minute to complete and it is assumed that the horizontal offset have reached 5 % when the LMRP is released from the BOP. Impact between the BOP and LMRP is not likely in this case due to horizontal movement away from the BOP after disconnection. Horizontal offset of 75 meters increases the length of the riser by 2 meters and is compensated by the tensioners. It is critical that the EDS is activated in a drift-‐off scenario to avoid damaging the well head, large moments will be transferred to the BOP due to the horizontal component of the tension. Riser compression and buckling is another danger in high-‐
tension recoil. If the top vessel is a drill ship, collision in the moon pool area is another danger due to the angle of the riser. The moon pool collision is not looked into here. 4.8.2 Comments There are some uncertainties connected to the friction forces and mass loss in the riser. The calculation indicates that the discharge takes 110 seconds to complete. A riser this long will require to have various refill valves to avoid the negative water hammer effect and refill seawater fast enough. The friction forces and mass loss will vary along the 41 NTNU Norwegian University of Science and Technology Department of Marine Technology length of the riser. The simplifications made have only time varying forces. One calculation will look at the different dynamics of mass loss and without. 4.8.3 Results pre processing Tension variation 70 bar 1800 Tension [kN] 1700 1600 1500 1400 1300 1200 -‐7.5 -‐6.5 -‐5.5 -‐4.5 -‐3.5 -‐2.5 -‐1.5 -‐0.5 0.5 1.5 2.5 3.5 4.5 5.5 6.5 7.5 Elongation [m] Figure 4.12 -‐ Tension variation for 70 bar setting (single tensioner) Figure 4.13 -‐ Mud discharge velocity 42 NTNU Norwegian University of Science and Technology Department of Marine Technology Figure 4.14 -‐ Length of mud column Figure 4.15 -‐ Friction forces on riser N/m 43 NTNU Norwegian University of Science and Technology Department of Marine Technology Chapter 5 Results recoil analysis Analyses have been done for two different models with different objectives. One separate mass loss modelling was also performed due to difficulties with the slug model in SIMA – RIFLEX. The results are fairly easy to see and interpret; the commenting is therefore kept short. This thesis does not perform a recoil analysis for a specific case problem. Its objective is as much the use of SIMA RIFLEX for this type of problem, as it is the findings in the recoils analysis. For simplicity, the riser contains mud, without a drill pipe inside. Modelling issues and validation are presented in chapter 6 -‐ discussion and shortcomings. •
•
•
•
Results 5.1 – Dynamics due to different mass of the riser, friction force is applied in the wrong direction, but after the transition the results are valid. Show different dynamics for riser with mud and riser with seawater inside. Results 5.2 – Disconnection timing for possible impact with BOP. These results are invalid, friction forces are applied in wrong direction, and mass loss is not included. The effects of the different disconnection timings are somewhat correct. Results 5.3 – Drift off simulation. Friction force here is applied in the wrong direction, and mass loss is modelled as a slow force representing the difference in weight between mud and seawater. Results are accurate before the disconnection, looking at stroke out of telescopic joint and bending moments on the BOP. The hang off dynamics are presented after the friction force is over. Results 5.4 – Repeats the recoil analysis in 5.1, but with friction force applied in the correct direction. Due to large friction forces the riser will be pulled down if mass loss is assumed to be a slow process. Alternative model was set up with instant mass loss. The fluid inside the riser is assumed to have no contributions to the weight in the axial direction of the riser once it is disconnected. 44 NTNU Norwegian University of Science and Technology Department of Marine Technology 5.1 Mass loss due to discharge of mud The slug force model in SIMA – RIFLEX proved unable to model the mass loss in the riser. This was not known to be an issue before late in this thesis. A separate analysis was performed to see the consequences of not discharging the mud and to find other modelling options. The results are presented here, while the discussion and explanation are found in chapter 6.3, 6.4 and 6.5 The model used for this analysis is the same as for disconnection timing. 500 meters water depth and 1600kg/m3 mud density. Friction forces are included. Figure 5.1 -‐ Dynamics of the LMRP after disconnection. Green represents no mass loss, blue and red (low damping) represents a constant force equal to the mass loss, yellow and dark blue (low damping) contains seawater instead of mud. The figure above represents 3 different cases: No mass loss in the riser, a force upwards representing the mass loss and a riser that contains seawater instead of mud. The anti recoil system represents large damping values when the cylinder is retracted, and two tests with low damping are also included. When studying only the hang off mode of the riser, one can see that the dynamics are very similar. It is only the vertical mean value that is affected by retaining the mud 45 NTNU Norwegian University of Science and Technology Department of Marine Technology comparing to seawater or the mass loss force. The model with seawater gives the most violent recoil, this due to much higher tension at the LMRP connector. The high damping values at the retracted position had little influence on the dynamics. In chapter 3 it is written that retaining the mud causes unwanted dynamics of the riser after disconnection due to the fundamental period is closer to the wave periods. This effect is not seen clearly here. The largest double amplitude in the hang off mode happens at 130 seconds. For the condition without mass loss it is slightly larger then the others. Figure 5.2 -‐ Velocity of the tensioners retracting after disconnection. Green is with seawater, red is without mass loss and blue is with a force describing the mass loss. The figure shows clearly the higher retraction velocity for the riser with seawater. Seawater can only be used for purposes of studying the hang off situation, and not the recoil itself, since the tensioner setting is designed for the weight of the system with mud inside. The seawater model gets the same dynamics as the model represented with a force describing the mass loss. Here the different dynamics becomes clearer. 46 NTNU Norwegian University of Science and Technology Department of Marine Technology Figure 5.3 -‐ Tension below tensioner ring. Blue represent constant mass loss force, red is without mass loss, green is with seawater. The figure shows the tension values for the element just below the tensioner ring. The recoils here are performed for low tension and before waves have any amplitude. This gives a”soft” recoil. The tension rises again after the first drop. The seawater model and the model with mass loss configuration join together after the recoil is over. The condition without mass loss has higher tension due to more weight in the riser. 5.2 Model 1 – Disconnection timing Different time series for the heave amplitude of the vessel were studied. Changing the seed number under dynamic calculation in SIMA – RIFLEX provides different wave generation. The following time series was chosen to perform the disconnection. It was found that the tension at the LMRP was to low in a condition like this (close to zero tension in the dynamical variation). The disconnection was performed both for 300 kN and 595 kN tension setting at the connector. 47 NTNU Norwegian University of Science and Technology Department of Marine Technology Figure 5.4 -‐ Heave amplitude for the condition The heave amplitude selected has a top at 66.5s second with following bottom at 73 second with double amplitude of 4.9m. Disconnection points at 67,68 and 69 were tested. The period for the retraction of the riser after disconnection is found to be around 5 seconds from prior test runs. This will give the most likely impact between the BOP and LMRP. 48 NTNU Norwegian University of Science and Technology Department of Marine Technology Figure 5.5 -‐ Elevation of the LMRP for different disconnection points. Yellow and dark blue (lowest in description) are for the 300kN setting. There was no impact between the BOP and LMRP for this condition, but the figure demonstrates very well what happens when the disconnection occurs while the vessel is moving down from a wave top. Disconnecting at the wave top (67s) makes the LMRP to lift off and have a little drop down before it goes back up, this drop happens when the vessel is moving fast downwards to the wave trough. Disconnecting at 69 seconds is the most critical. The elevation of the LMRP is just above 1 meter the first 3 seconds after disconnecting. This demonstrates that the disconnection timing can be critical, if the heave amplitude is large enough and the vessel is moving down when the disconnection occurs, a collision between the BOP and LMRP is plausible. However for this to actually occur is highly unlikely, a disconnection should be performed long before a storm develops into a dangerous sea state. Horizontal offset will also safely remove the LMRP from the BOP. 49 NTNU Norwegian University of Science and Technology Department of Marine Technology Figure 5.6: Retraction speed of the LMRP Figure 5.7 -‐ Tension below the tensioner ring for high tension setting and low tension setting Figure 5.6 shows the retraction speed for disconnection with one second time interval. The speed is lowest for 69 seconds, i.e. the relative movement between vessel and tensioner retraction is at its highest. Figure 5.7 shows the dynamic variation of tension at the LMRP connector. The low tension setting (300 kN) have zero tension at 60 50 NTNU Norwegian University of Science and Technology Department of Marine Technology seconds, this is in a wave trough. Disconnection at this instant gives a clear lift off because the vessel is moving upwards. Figure 5.8 -‐ Tension below the tensioner ring Disconnecting the marine riser on the top of the heave amplitude will create a “violent” recoil. The tensioners are more stretched out meaning higher tension in the system, and the relative motion between vessel and riser work negatively. Only the disconnection timing of 67 seconds gives compression values in the riser for a short period of time (less than 0.5 seconds). Compression over the length of the riser will make the riser buckle and damage it. The anti recoil systems are designed for this to not happen. 51 NTNU Norwegian University of Science and Technology Department of Marine Technology Figure 5.9 -‐ Compression in the riser for different vertical coordinates To find the severity of the compression, different vertical coordinates in the riser were studied. The upper line represent ~ 185m above the seabed, red line ~310m, green ~435m, yellow~465m and the other blue~491m. The compression occurs for different time throughout the riser (limited within 0.5s). Approximately the upper 250meters of the riser are in compression at 69,7 seconds. This is not when the cylinders are completely retracted, but when the velocity of the retraction is at its highest of ~1.8 m/s. This means that there are large damping forces causing the compression in the riser. And that maybe the anti recoil system is not modelled optimally. The graphic interface in SIMA shows no tendency of riser buckling, probably due to the short time interval. For a riser length of 250 meter the required buckling force is less than 50kN. 5.3 Model 2 – Drift off simulation Different disconnection timings are also used in the drift-‐simulation. The first disconnection occurs at 35 seconds, later the wave series is shifted for disconnection at 38, 44 and 47 seconds. The time line for the figures will be the one for 35 seconds. To get the actual time for the other disconnection phases the difference in time need to be added. 52 NTNU Norwegian University of Science and Technology Department of Marine Technology Figure 5.10 -‐ Heave amplitude for the vessel First disconnection occurs at a wave top, second halfway down the wave, third close to a wave trough and fourth almost up on a wave top. Figure 5.11 -‐ Bending moments acting on the BOP before disconnection Before the waves start to act the bending moment due to the horizontal offset alone is ~3800kNm. With the wave dynamics the moment reaches a max value of 4200kNm. This is large moments and the reason for disconnecting becomes clear. These moments 53 NTNU Norwegian University of Science and Technology Department of Marine Technology will be transferred by the BOP and into the wellhead and casing. How much a typical wellhead can tolerate is not known in this thesis. Figure 5.12 -‐ Tension in riser at -‐460 meter for different disconnection timings. The disconnection timing has a great influence for the risk of compression in the riser. No compression occurred for the drift-‐off model, but disconnection at 47 seconds was close to going in zero tension. The vertical point were the tension drop was highest is between 2/3 and 3/4 up the riser length. 54 NTNU Norwegian University of Science and Technology Department of Marine Technology Figure 5.13 -‐ Telescopic joint upper and lower end Before the waves starting to act the telescopic joint is stretched to around 13.8 meters (neutral length is 11.8m). With the movement of the vessel the largest stroke is close to 15 meters, 3 meters away from the maximum limit for the system. Larger waves or further horizontal drift-‐off would have caused the telescopic joint to stroke out. 55 NTNU Norwegian University of Science and Technology Department of Marine Technology Figure 5.14 -‐ Heave amplitude of vessel compared with tensioner motion in hang off mode Comparing the heave amplitude for the vessel with the stroke of the tensions shows a roughly 1 to 1 relation of the motion. This can indicate that the spring stiffness is large compared to the weight of the riser. This dynamics in hang off mode are further discussed in chapter 6. Figure 5.15 -‐ Dynamics of LMRP in hang off mode, red line with force description of mass loss, blue without mass loss The riser with mass loss and riser with mud retained show similar dynamics in the hang off mode. The main difference is the higher retraction for the mass loss model, and a 56 NTNU Norwegian University of Science and Technology Department of Marine Technology phase difference of close to 45 degrees. The riser with mass loss is subjected to higher damping values due to modelled anti recoil system. 5.4 New model with correct forces, 500 m water depth Late in this thesis it was discovered that the dynamics in the recoil analysis was not correctly put together. The resulting friction force acts downwards on the riser. If the simplifications and assumptions are correct this force has a maximum of ~850 kN working on the riser 6 seconds after disconnection. In a relative low tension setting resulting in 300 kN at the LMRP connector this force will be so large that the LMRP will crash in the BOP after disconnection. But this is not how the real system behaves. Figure 5.16 -‐ Elevation of LMRP after disconnection The LMRP gets a lift-‐off the first seconds before the flow have developed. Later the friction forces are greater than the tension released from the connection (300kN) and the riser gets pulled down and crashes with the BOP. If the LMRP is released with the annular(s) open, the fluid inside the riser will not be a part of the mass in axial direction. [Grytoyr et al. 2012] discussed how the mass loss could be modelled using a slug model with constant velocity as the mud discharges. This could correctly describe the mass loss in the radial direction of the riser, but will not be correct in the axial direction. Using a fluid inside the riser in RIFLEX adds to the mass matrix. When doing a recoil analysis it is the axial direction of the riser that is of concern, and the mass loss should not be modelled with the speed of the mud discharge. 57 NTNU Norwegian University of Science and Technology Department of Marine Technology Almost instantly when the LMRP is disconnected, the lower end of the riser will be open, and the mass inside it has no contribution to the weight of the riser. (Some friction and inertia effects can occur in a long riser with curvature). To get the correct recoil in the riser, the mass loss is modelled with dynamical nodal forces in the global coordinate system. The total mass of the mud contained in the riser is calculated, and spread as a vertical force over the length of the riser. This results in an upward force of 1475kN, this force is added over a period of 2 seconds before it is constant. Figure 5.17 -‐ Elevation of LMRP with disconnection timings of 67, 68, 69 and 70 seconds. These results shows the same tendency as in 5.1, but the forces behind it is different. No collision occurs for this wave amplitude. 58 NTNU Norwegian University of Science and Technology Department of Marine Technology Figure 5.18 – Elevation of LMRP. Shows the difference in results from model in 5.1 (blue) and the corrected model (red) This figure give an comparison of the elevation of the LMRP for the result in 5.1 and the new where the friction force is working downwards and the mass loss is almost instant. The curves are very similar, but for different reasons. 59 NTNU Norwegian University of Science and Technology Department of Marine Technology Figure 5.19 -‐ Compression in the riser Modelling the mass loss as a nodal force over the length of the riser can lead to higher compression values. The 4 different lines represent disconnection timings of 67, 68, 69 and 70 seconds. Only 67 and 68 have compression in the riser, and demonstrates the effect of when the disconnection occurs. In 5.1 compression values were much less, this way of modelling the mass loss will forces and compression in the riser that is not really there. There was unfortunately not enough time to re-‐do all analysis, and to develop a better working mass loss modelling. 60 NTNU Norwegian University of Science and Technology Department of Marine Technology 5.5 Screenshots from the simulations Figure 5.20 -‐ Tensioning system before disconnection and after 61 NTNU Norwegian University of Science and Technology Department of Marine Technology Figure 5.21 BOP and LMRP disconnected in the drift-‐off simulation Figure 5.22 -‐ LMRP lifting off BOP with both vertical and horizontal movement 62 NTNU Norwegian University of Science and Technology Department of Marine Technology Chapter 6 Discussion and shortcomings RIFLEX is a well-‐documented program and is one of the best software’s for flexible riser engineering. It has been proved to give accurate results when comparing to full-‐scale analysis. The use of RIFLEX for a recoil analysis seems to be a fairly new use of the software, and the validity of the results will depend on how well the major effects can be modelled. The major effects can be summed up to tension variation, damping, frictional forces and mass loss from mud discharge and anti recoil system. 6.1 Mistake in the friction force analysis An error was made in implementing the friction forces from the mud discharge. The force is calculated correctly (within the assumptions and simplifications) but it was added as an upward force on the riser, and not downward as it should be. This problem was discovered same day as the thesis is delivered, so there was no time to correct and re-‐run the analysis. All the results within the time period of the force are incorrect. This will specially affect the dynamics for the LMRP elevation after disconnection, and a collision is more likely to occur. The compression problem is reduced since the forces will “stretch” out the riser. The friction force related to the mud discharge problem was first assumed to be analogous to a fire hose. It was assumed that the friction force was among the forces pushing the fireman backwards. This idea was transferred to the mud discharge, resulting in a force directed upwards on the riser. This seemed logical and the force direction was not studied further. The friction force works opposite the flow when drawing a figure, but it is a force the riser is exerting on the mud. Newton’s third law then states that the force works downwards on the riser. 6.2 Tensioner system. To do a recoil analysis one first needs a good model of the drilling riser and the tensioner system. Tensioners can be modelled in several different ways in RIFLEX, but only the tensioners themselves and not the whole system that provides the force characteristics. A separate analysis is needed to acquire force and damping variation. Software such as SimulationX or simplified calculations can provide this. The simplified calculations made for tension variation in chapter 5 were compared up to the values obtained by SimulationX [Sten, 2012]. The values obtained by the simplified 63 NTNU Norwegian University of Science and Technology Department of Marine Technology calculations proved to give less tension variation than obtained by SimulationX. Coupled analysis is needed to get the right variation. In RIFLEX these two effects have separate input. Force variation is given as function of elongation in axial stiffness for the element, while the flow velocity provides axial damping as function of strain rate squared for a given elongation. Using beam elements with pipe in pipe contacts (cylinder/rod) for modelling of the tensioners makes the model closest to the real geometry. For the recoil analysis the right tension and lift up after disconnection are of most importance. Beam elements without pipe in pipe contacts were assumed sufficient. The already complex model gets a little bit simpler and the forces between cylinder and rod were not an objective of this thesis. 6.3 Mud discharge analysis. There are a lot of uncertainties connected with the mud discharge analysis. It is a complex fluid mechanical problem. And the calculation done in MATLAB is a very simplified solution where Newton’s second law is applied to the mud column as a rigid body. The calculations used dynamical equilibrium between mud weight, hydrostatic pressure difference, frictional forces (both from mud and water) and the mass and acceleration of the system. Professor Carl M. Larsen informed that there had been experimental tests on this, where they could not establish a model explaining the dynamics of the situation. 6.4 Slug model and mass loss. The slug load in RIFLEX proved to be unable to model the mass loss in the riser. With a lot of troubleshooting and help from Andreas Amundsen and Elizabeth Passano from MARINTEK it was concluded that the slug model is inadequate for a complex system. It was tested in both SIMA RIFLEX and in RIFLEX alone without any difference. The slug force is indented for relative simple flexible riser systems. Applying the slug load to a complex system like the heave compensated drilling riser with connector release, multiple tensioners, flexible joints and telescopic joint causes unexpected problems with no clear solution. [RIFLEX user manual] gives this restrictions and assumptions for the slug force: E4 Slug force calculations This data group is only given for INDINT=2 (data group E1.4), and slug forces can only be specified for single risers. 64 NTNU Norwegian University of Science and Technology Department of Marine Technology E4.1 Data group identifier, one input line Restrictions 1. Slug flow applies for standard systems only 2. The main riser line has to be modelled by beam elements 3. Consistent formulation (Lumped mass option is prohibited) Assumptions 1. The total slug mass is constant, MS. Initial length is LS0. 2. The specified velocity refers to the gravity centre of the slug, initially at the half length. 3. The slug specification is superimposed on the riser mass, including any internal fluid flow. 4. The internal cross-‐section area is not used in the slug modelling 5. The slug length is divided into sections. Initially the sections are of equal length dlS,0. The density, (mass per unit length) is constant within each section. Initially the mass per unit length is m0=MS/LS0 Single risers SA-‐ SB-‐ SC-‐ SD-‐ Seafloor to surface vessel. One point seafloor contact. The Steep Wave, Steep S and Jumper flexible riser configurations are special cases of the SA system. Seafloor to surface vessel. Seafloor tangent and/or additional seafloor attachment point. The Lazy Wave and Lazy S flexible riser configurations are special cases of the SB system. The SB system is also convenient for modelling of anchor lines with sea-‐ floor contact at lower end. Free lower end. Riser during installation etc. Free upper end. Buoyed riser, loading system, etc. Data group E1.4 means that the slug is only available for non-‐linear analysis and single risers. This is the case of a recoil analysis. Restriction 1 limits the slug force model to the standard systems of RIFLEX. These standard systems does not include all modelling elements in RIFLEX, for example master – slave relationship and pipe in pipe elements are only available in the arbitrary system, and thus the AR system is the preferred for modelling a drilling riser. The slug model can be used in an AR system if a main riser line configuration is defined. Using a main riser line will overwrite the data for any given fluid specification in the riser [RIFLEX user manual]. My model uses a double super node between the BOP and LMRP with master – slave relationship for the disconnection. The main riser line configuration does not accept lines starting and ending in different nodes. An alternate model with fixed LMRP would be needed to make the disconnection, but then the forces before the disconnection point are not transferred to the BOP. Restrictions 2 and 3 can easily be met, but poses some changes to the modelling of lumped mass as the riser tensioner ring, and mass above the telescopic joint. But in the end the slug model does not work for the complex model. During the analysis the slug model can fool you, because by setting up the main riser line correctly, the slug load gets accepted and the dynamical calculation is completed without error messages. It looks 65 NTNU Norwegian University of Science and Technology Department of Marine Technology like the slug load is included from reading the dynmod.res file, but it has no effect on the results. i.e. the high density mud is still in the riser and there is no change of weight in the system. That there is no effect of the slug load can be difficult to notice in the instant after disconnection when there are a lot of forces acting simultaneously. The effect comes apparent in the hang off mode analysis. One simple model was made during the testing and trouble shooting of the slug load. It consists of one line from sea bottom to surface and one tensioner element connected with a master slaver relation. Here the slug model proved to work and gave a linear decrease of tension in the system as the slug entered. 6.5 Validation of results without slug load There were already uncertainties to the slug model and on how well this “alternative use” of a modelling tool replicated the real situation. The slug goes into the bottom of the riser, changing the mass from the bottom to the top. In the real discharge the mass is changed from top to bottom, and in this transient window the slug is not does not replicate the physics well, but will not affect the recoil by much. As stated, the validity and accuracy of the results are correlated to how well the actual physics can be reproduced in RIFLEX. As the LMRP is disconnected it will recoil upwards, firstly due to over pull at the connector due to positive tension values in the range 300-‐ 600kN. Studying the behaviour or the riser after disconnection means to look at a relative short time interval. The time from disconnection to the tensioners are completely retracted are in the vicinity of 5 seconds. The mass loss is a slow change in mass in the riser, and a relative linear process. The process takes around 30 seconds for the 500 m model, with a mud density of 1600 kg/m3. The riser mass will be reduced with 54 050kg after the discharge. This mass represents a weight of 530 kN leaving the system which is in the same order of magnitude as the tension at the LMRP connector. This will most likely leave the tensioners completely retracted (will of course be case dependant on mud weight, tensioner variation and buoyancy of riser). One can see that the mass loss will then play a crucial role on the dynamics of the riser, counting from 10 – 15 seconds after the disconnection. After the recoil is finished it goes over to hang freely from the tensioners, this is called soft hang off mode. Without modelling the mass loss the dynamics here will be completely wrong. An alternative way to model the mass loss is needed if RIFLEX is to be used for a recoil analysis including the hang off after disconnection. 66 NTNU Norwegian University of Science and Technology Department of Marine Technology 6.6 Alternative modelling of mass loss An alternative way is needed to model the mass loss of the riser if one wants to have accurate results for the hang off after disconnection. Unfortunately there is no easy way to do this. Hang off mode only: One can set up the riser with seawater and run a separate hang off analysis. Running RIFLEX without the SIMA user interface: In batch mode of RIFLEX there is possible to read flow data from a file, and here the density is included, one can then change the density throughout the file and reproduce the mass loss. Amundsen informs that there is limited access to this option and it is not implemented to SIMA RIFLEX. User defined forces: can be used to give the riser first a linear lift and then a constant lift force that equals the weight loss in the riser. The user-‐defined forces are saved to the nodes if the global coordinate system is used. The mass and force representing mass loss will then be saved to the same nodes, but in different matrices. The force representing the mass loss will provide the same lift up of the riser as the real mass loss, but the mass is technical still the same. The lift up force will keep the tensioners close to completely retracted and will have large damping for the movements due to the modelled anti recoil system. 6.7 Influence of mass The alternative dynamical nodal force mass loss gave very good results in Chapter 5.1, were a riser containing seawater was tested against the modelled mass loss. Calculating the natural axial period for the riser system provides an answer to how much mass loss affects the different dynamics. Natural Eigenperiod in axial direction: !! =
!!
!
!!!
Eq. 6.1 Where k is the spring stiffness (tensioner stiffness, riser is looked at as rigid), M is mass and A is added mass. Added mass in axial direction for the riser will be very low, mostly coming from the LMRP structure and some buoyancy elements and is assumed to be only 5% of the mass. The spring stiffness will vary with the tensioner pressure setting and the position of the piston (tension variations are presented in chapter 4.3). 67 NTNU Norwegian University of Science and Technology Department of Marine Technology Spring stiffness k 66 kN/m (retracted) 78 kN/m mid position Mass with mud 800 tonnes T0 = 21.87s Mass with seawater 743 T0 = 21.08s Mass empty 650 tonnes T0 = 19.7s T0 = 20.12s T0 = 19.4s T0 = 18.14s Table 6.1 -‐ Natural axial periods for 500m riser model Spring stiffness k 156 kN/m (retracted) 198 kN/m mid position Mass with mud 2036 tonnes T0 = 22.7 Mass with seawater 1874 T0 = 21.77s Mass empty 1585 tonnes T0 = 20.0s T0 = 20.14s T0 = 19.33s T0 = 17.8s Table 6.2 -‐ Natural axial periods for 1500m riser model These calculations show very little difference in the natural axial period for the riser model with mud or seawater inside. However, an increase in weight in the system will make the natural period further away from the wave spectre. The damping values are not included here, and will make the periods somewhat larger. Especially for the retracted position due to high damping. 68 NTNU Norwegian University of Science and Technology Department of Marine Technology Figure 6.1 vertical movement of the tensioners, blue represent riser with mud, red is the empty riser In the figure the vertical movement of the lowest part of the tensioners is shown. A riser filled with mud and an empty riser. The tension is tuned to give the same resulting tension at the LMRP connector (300kN). The stiffness of the system is kept the same, which means that the stiffness that is set for the empty riser is higher than the system would be at the actual pressure setting. The dynamics in axial direction is not greatly affected by the density of fluid inside in this case, except from the vertical mean position from the mass loss. 69 NTNU Norwegian University of Science and Technology Department of Marine Technology Figure 6.2 Horizontal movement for top of buoyancy element (-‐60m) for riser with mud, seawater and empty, blue, red, green. The difference in response in radial direction, the empty riser has generally more response, but varies with the different waves. For the wave at 40-‐50 seconds, the riser with mud has the largest amplitude. The point of interest was chosen to obtain some distance from the vessel, but stay in the area where the waves are acting. The results shows that the mass affects the radial response. 70 NTNU Norwegian University of Science and Technology Department of Marine Technology Chapter 7 Conclusion The emergency disconnection of a marine drilling riser and riser recoil is a complex dynamical reaction. A tensioned riser is released in the lower end, and a force unbalance will occur. The elastic energy in the riser, the unbalanced force from the tensioners, mud discharging from the open lower end, movement of the vessel and the response and damping of the tensioner system will all influence the dynamics of the riser after disconnecting. Final element method software has to be able to capture all these physical effects to perform a riser recoil analysis with good results. SIMA RIFLEX offers no direct modelling options for hydraulic systems or flow out from an open end. These effects will then require simplifications and an alternative modelling method. Tensioners can be modelled in RIFLEX with a specified tension-‐elongation curve and damping values as a function of strain rate. The damping comes from friction in the hydraulic oil supply to the tensioners and gradually closed valves when the riser is disconnected. High damping values are used when the tensioner retracts to simulate the closure curve in the anti recoil system. The lower end of the riser will normally be open when the disconnection occurs. This will cause the drilling mud inside the riser to discharge, and impose friction forces and mass loss to the riser system. The mass of the fluid inside the riser will no longer contribute to the mass in axial direction. In radial direction the mass will reduce as the high-‐density mud is replaced by seawater. There is no easy way to model this in RIFLEX, a slug model can be used to make a fluid with user specified density enter the riser and replace the original fluid. The slug model proved to not work for a complex riser build up. An alternative solution is proposed using global dynamic nodal forces to give the riser the correct lift due to the mass loss. This will not change the mass of the riser, but only give the right upward trajectory for the riser. This force is likely to give more compression in the riser than the real situation. A case study showed only small differences in dynamic response for the riser with mud and an “empty” riser in axial direction. Two models were developed for recoil analysis in SIMA RIFLEX. One model for a water depth of 500 meter, simulating collision between the LMRP and the BOP by disconnecting when the vessel is moving down from a large wave top. The second model simulates the drift-‐off scenario at 1500 meters water depth. The results are somewhat uncertain due to difficulties around the mud discharge problem. SIMA RIFLEX is not an optimal software package for recoil analysis. Modelling options for changing the fluid inside the riser is needed in dynamic calculation to simulate the 71 NTNU Norwegian University of Science and Technology Department of Marine Technology mass loss. A coupled analysis with software such as SimulationX will provide a better force variation, damping values and anti recoil system modelling. And for this it seems that Orcaflex is the preferred software used in the industry [17]. 72 NTNU Norwegian University of Science and Technology Department of Marine Technology Chapter 8 Further work The results in this thesis are somewhat untidy. The dynamics happening at the recoil were not fully understood, and resulted in some differences for each model. It was discovered to late, and not enough time was available to “clean” it up. Help and guidance from someone working with recoil analysis should have been acquired to clear up the different theories. When all the confusion was cleared, the different recoil analysis should have been performed again. This would give clearer and more coinciding results. The mud discharge problem is a weak point of this thesis. This is a complex flow problem where a fluid flow software or CFD analysis should have been performed. This would have provided a better understanding of the forces and how they are acting. Perform a recoil analysis in another slender marine structure FEM program such as Orcaflex to get a comparison of results and modelling options. 73 NTNU Norwegian University of Science and Technology Department of Marine Technology Chapter 9 References [API 16Q] American Petroleum Institute “Recommended practice for design, selection, operating, and maintenance of marine drilling riser system” API 16Q, Washington, DC 2001 [Dolphin Drilling, 2013] Dolphin drilling internal documents, Stavanger 2013 [Chakrabarti, 2005] S.K.Chakrabarti “Handbook of Offshore Engineering Volume 2” Offshore Structure Analysis Inc. Illinois, USA, 2005 [DNV, 2010] DNV – Recommended practice DNV-‐RP-‐C205, Eviromental conditions and environmental loads, October 2010. [Gronevik, 2012] Arild Gronevik “Simulation of drilling riser disconnection – recoil analysis” NTNU, institute for marine technology, Trondheim 2012 [Grytoyr et al. 2011] G.Grytoyr, P.Sharma, S.Vishnubotla ”Marine drilling riser disconnect and recoil analysis” AADE-‐11-‐NTCE-‐80, Houston 2011 [Kavanagh et al. 2002] K.Kavanagh,M.Dib,E.Balch,P.Stanton ”New revision of drilling riser recommended practice” OTC 14263, Houston 2002. [Miller, 1998] J.E.Miller, M.J.Stahl,C.J.Matice ”Riser collapse Pressure Resulting from release of Deepwater Mud Columns” OTC 8853 [Nguyen et al. 2006] C. Nguyen, R. Thethi, F. Lim, 2H offshore “Storm-‐Safe deepwater drilling” IADC/SPE 103338 2006 [RIFLEX user manual] RIFLEX user manual_37_rev5 [Sten, 2012] Ronny Sten IMT-‐2012-‐80, Trondheim, 2012 [West Engineering services Inc. 2003] West Engineering services inc. “Evaluation of secondary intervention methods in well control” 2003 [White, 2008] Frank M. White – Fluidmechancis sixth edition [Yin, 2013] Decao Yin “Simulation of Marine Riser Disconnect and Recoil”, trial lecture presentation, CESOS, NTNU, Trondheim 2013 [Young et al. 1992] R.D Young, C.J Hock,G.Karlsen,J.E.Miller,”Analysis and design of anti recoil system for emergency discoonec of a deepwater Riser” OTC6891, Houston, 1992 [10] http://www.youtube.com/watch?v=kBQdTv7bspM&feature=related [11] http://www.youtube.com/watch?v=zE_uHq36DLU&feature=related [12] http://www.deepwater.com/_filelib/FileCabinet/pdfs/08_TRANSOCEAN_Ch_3-‐4.pdf [13] http:// www.evergreen-‐maritime.com [14] http://www.dril-‐quip.com/ [15] http://petrowiki.spe.org/MODU_riser_and_mooring_systems [16] http://www.dolphindrilling.no/fleet [17] Castor drilling solution -‐ www.cds.as
74 NTNU Norwegian University of Science and Technology Department of Marine Technology Chapter 10 Appendix %----------------------------------------------------------%
Recoil analysis of drilling riser
%
%
Master thesis by Arild Gr¯nevik
%
%
script - muddischarge.m
%---------------------------------------------------------%
%
Description:
%
Calculates muddischarge velocity and frictional
%
forces acting on the riser as the drilling mud flows
%
out of the riser at the LMRP. Results are input for
%
the recoil analysis in Riflex
%---------------------------------------------------------clear all
clc
%
Riser input data
%---------------------------------------------------------L = 500 ;
%Water depth
D = 0.489 ;
%internal diameter
e = 5e-5;
%roughness parameter
g = 9.81 ;
%gravity
rho_sw = 1025;
%density sea water
rho_mud = 1600 ;
%density drilling mud
v_mud = 1e-4 ;
%viscosity mud (typical values: 3-30cP)
v_sw = 1.15e-6 ;
%viscosity seawater
ed = e/D ;
%relativ roughness
area = pi*D^2/4 ;
%internal area of riser
M_mud = rho_mud*area; %mass per unit length of mud
M_sw = rho_sw*area ; %mass per unit length of seawater
%---------------------------------------------------------------------%
Dynamical equilibrium between mass, frictional forces, and
%
hydrostatic pressure.
%---------------------------------------------------------------------%initial values
timestep = 0.05;
i=2;
vel(1,1)=0;
time(1,1)=timestep;
acc(1,1)=0;
L(1,1) = L;
%loop acting while there is mud in the riser
while L(i-1,1) > 0
time(i,1) = timestep*i ;
%velocity of discharge
vel(i,1) = vel(i-1,1) + acc(i-1,1)*timestep ;
%length of mud and water column
L(i,1) = L(i-1,1) - vel(i-1,1)*timestep ;
L_water(i,1) = L(1,1) - L(i,1) ;
%friction coefficient for mud and seawater
Re_mud(i,1) = vel(i,1)*D/v_mud ;
haaland_mud = -1.8*log10(6.9/Re_mud(i,1) + (ed/3.7)^1.11);
1 NTNU Norwegian University of Science and Technology Department of Marine Technology f_mud(i,1)=1/(haaland_mud^2);
Re_sw(i,1) = vel(i,1)*D/v_sw ;
haaland_sw = -1.8*log10(6.9/Re_sw(i,1) + (ed/3.7)^1.11);
f_sw(i,1)=1/(haaland_sw^2);
%hydrostatic pressure and pressure drop due to friction
p_hydro(i,1) = (rho_mud-rho_sw)*g*L(i,1) ;
p_mudfriction(i,1) = f_mud(i,1)*L(i,1)/D*vel(i,1)^2*rho_mud /2 ;
p_waterfriction(i,1) = f_sw(i,1)*L_water(i,1)/D*vel(i,1)^2*rho_sw /2 ;
p_friction(i,1) = p_mudfriction(i,1) + p_waterfriction(i,1) ;
%Gravity force on mud column
G(i,1) = (rho_mud-rho_sw)*g*L(i,1)*area ;
%Newtons second law
sum_forces(i,1) = p_hydro(i,1)*area + G(i,1) - p_mudfriction(i,1)*area p_waterfriction(i,1)*area ;
acc(i,1) = sum_forces(i,1) / ( (M_mud*L(i,1)) + M_sw*L_water(i,1) );
%resulting total friction force working on riser
f_friction(i,1)= (p_mudfriction(i,1) + p_waterfriction(i,1) ) *area/ L(1,1) ;
i = i+1 ;
end
time_discharge = max(time)
figure(1)
plot(time,vel) ;
xlabel('time [s]')
ylabel('velocity [m/s]')
title('Mud discharge velocity')
figure(2)
plot(time,p_friction) ;
xlabel('time [s]')
ylabel('pressure [Pa]')
title('Frictional pressure loss')
figure(3)
plot(time,L)
xlabel('time [s]')
ylabel('length [m]')
title('Length of mud column')
figure(4)
plot(time,f_friction);
xlabel('time')
ylabel('friction [N/m]')
title('Friction forces working on the riser')
2 NTNU Norwegian University of Science and Technology Department of Marine Technology %-----------------------------------------------------------------%
Recoil analysis of drilling riser
%
%
Master thesis by Arild Gr¯nevik
%
%
script - w_dyn_force.m
%-----------------------------------------------------------------%
%
Description:
%
script that write user specified nodal forces to
%
to a text file. The code is then copied into the relevant
%
sima_dynmod.inp file.
%-----------------------------------------------------------------%
Main riser data
%-----------------------------------------------------------------n_seg = 3;
%number of segments in line
n_elements1 = 40 ;
%number of elements in segment
n_elements2 = 304 ;
n_elements3 = 40 ;
n_elementstot = n_elements1 + n_elements2 + n_elements3 ;
timeon = 67 ; %disconnection time
l_elem = 1.25; %code is currently for elements with equal lengths
%forces divided into working on every n_nodes
%total forces (3 each written node)
n_nodes=4 ;
%n_forces = n_elementstot/n_nodes*3+3;
%if mass loss included
n_forces = n_elementstot/n_nodes*5+5;
%identifying the maximum force and time for it
[f_max,time_max] = findpeaks(f_friction) ;
time_max = time_max*timestep ;
%to replicate the force in a best possible way, 1 linear increasing
%force, 1 constant force and 1 decreasing linear force starting at
%different times are used, force is written in kN
%---------------------------------------------------------p1_up = f_max/time_max*n_nodes*l_elem/1000; %ramp force (linear)
timemax = floor(timeon+time_max) ;
%time for maximum force
timeoff = floor(timeon+time_discharge);
%end time
p_max = f_max*n_nodes*l_elem/1000;
%constant force (max)
p1_down= f_max/(time_discharge-time_max)*l_elem *n_nodes/1000 ;
%ramp force, linear decreasing
%
printing simplefied mass loss
%----------------------------------------------------------------time_m_max = 35 ;
massloss= (M_mud-M_sw)*L(1,1) ;
p1_m_ramp = massloss/L(1,1)*g *n_nodes*l_elem /time_m_max/1000 ;
p1_m_const = massloss/L(1,1)*g *n_nodes*l_elem /1000 ;
%
Prints to file (inlcuding dummy code)
%-------------------------------------------------------------------
3 NTNU Norwegian University of Science and Technology Department of Marine Technology fid = fopen('dynamic_nodal_forces.txt','w+');
fprintf(fid,'DYNAMIC NODAL FORCES') ;
fprintf(fid,'\n ''----------------------------fprintf(fid,'\n ''ndcomp \t cinput \t chfloa ')
fprintf(fid,'\n %i \t NOFILE ',n_forces) ;
fprintf(fid,['\n ''line-id \t ilseg \t ilnod \t
'\t iforty \t timeon \t timeoff \t
') ;
;
ildof \t chicoo '...
p1 \t p2 \t p3 ']) ;
ilseg = 1;
for j=1:n_seg
if j == 1
n_elements = n_elements1 ;
elseif j == 2
n_elements = n_elements2 ;
elseif j== 3
n_elements = n_elements3 ;
end
for i = 1:n_nodes:n_elements
ilseg = j;
%printing ramp force
fprintf(fid,'\n %s \t %i \t %i \t %i \t %s \t %i \t %f \t %f \t %f\t %i
\t %i','line4', ilseg, i, 3, 'GLOBAL', 3, timeon, timemax, -p1_up, 0, 0 );
%printing ramp force mass loss
fprintf(fid,'\n %s \t %i \t %i \t %i \t %s \t %i \t %f \t %f \t %f\t %i
\t %i','line4', ilseg, i, 3, 'GLOBAL', 3, timeon, (timeon+time_m_max),
p1_m_ramp, 0, 0 );
%printing constant force
fprintf(fid,'\n %s \t %i \t %i \t %i \t %s \t %i \t %f \t %f \t %f\t %i
\t %i','line4', ilseg, i, 3, 'GLOBAL', 1, timemax, timeoff, -p_max, 0, 0) ;
%printing constant force mass loss
fprintf(fid,'\n %s \t %i \t %i \t %i \t %s \t %i \t %f \t %f \t %f\t %i
\t %i','line4', ilseg, i, 3, 'GLOBAL', 1, (timeon+time_m_max), 220,
p1_m_const, 0, 0) ;
%printing negative ramp force
fprintf(fid,'\n %s \t %i \t %i \t %i \t %s \t %i \t %f \t %f \t %f\t %i
\t %i','line4', ilseg, i, 3, 'GLOBAL', 3, timemax, timeoff, p1_down, 0, 0) ;
end
end
4