1
mle 2.1 manual
2
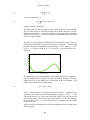
1.8
1.6
1.4
1.2
1
0.8
0.6
0.4
0.2
0
7
6
5
0
4
1
2
3
3
4
2
5
6
1
7 0
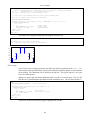
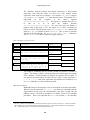
Multiple plots
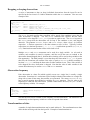
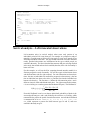
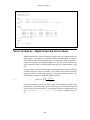
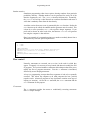
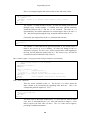
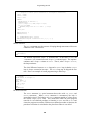
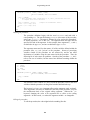
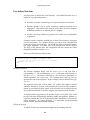
Multiple plots can be placed on a single page with the MULTIPLOT...END statement. The form of
the statement is:
MULTIPLOT( <xplots> <yplots> )
<statements>
END
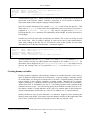
The two arguments determine the number of plots that are placed across the page (<xplots>) and
vertically down the page (<yplots>). In this way, <xplots> by <yplots> pages of plots are
generated. Once a page is filled, a new page is automatically generated.
The <statements> are any valid mle statements, including PLOT...END statements (typically two or
more PLOT statements are executed). The PLOT...END statements may be executed within a userdefined procedure call.
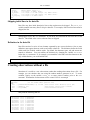
The PLOTFILE() procedure must be called before the MULTIPLOT statement.
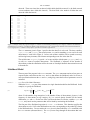
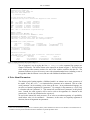
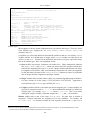
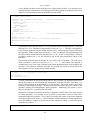
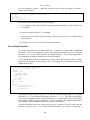
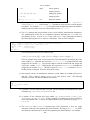
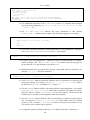
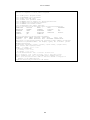
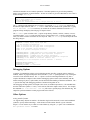
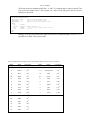
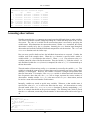
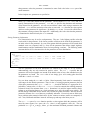
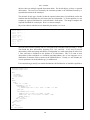
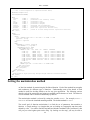
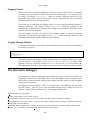
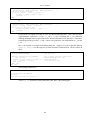
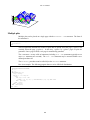
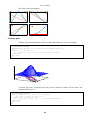
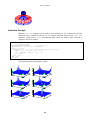
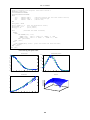
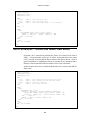
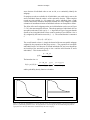
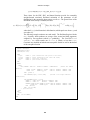
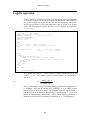
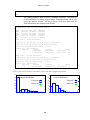
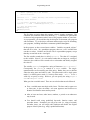
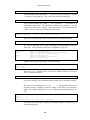
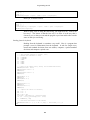
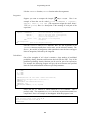
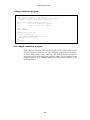
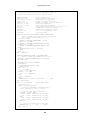
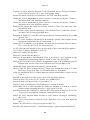
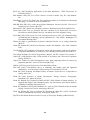
Here is an example. The following program shows a series of Weibull distributions.
MLE
PLOTFILE(DEFAULTPLOTNAME)
nx = 3
ny = 2
MULTIPLOT(nx, ny)
totp = nx*ny
FOR mu = 1 to totp DO
PLOT
FOR sig = 1 TO 3 DO
CURVE t (0, 10, 50) t, PDF WEIBULL(t) mu, sig END
END {for sig}
END {plot}
END {for mu}
END {multiplot}
END {mle}
95
END