1
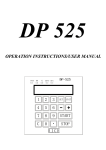
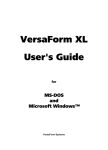
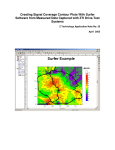
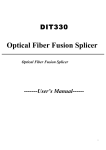
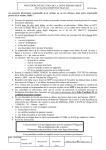
SUPPLEMENT
DSS5600T/H Differences Document
For DriveTest Release 24 and above
INTRODUCTION: ................................................................................................................................................1
DSS5600T/H SYSTEM DIFFERENCES:............................................................................................................1
DRIVETEST CHANGES ......................................................................................................................................3
JOB EDITOR ..........................................................................................................................................................3
Job Editor: Configure DVBTH Decoder..........................................................................................................5
FIGURE OF MERITS RECORDED TO DATA FILE: .....................................................................................................6
Meter FOM’s ...................................................................................................................................................6
Diversity DVB-T/H Decoder FOM’s (NEW) ...................................................................................................6
GPS FOM’s......................................................................................................................................................8
SPECTRUM DISPLAY .............................................................................................................................................8
PLOT ................................................................................................................................................................... 10
DVB-T/H DIVERSITY DECODER SPECIFICATIONS: ............................................................................... 20
ANTENNA SELECTOR SWITCH .................................................................................................................... 21
Diversity Antenna Calibrated RF Switch – Antenna Factor .......................................................................... 21
Introduction:
Congratulations on your purchase of your DVB-T/H DriveTest system from Z Technology. Your new
system has it’s roots in the Z Technology DSS5600a DriveTest system for DVB measurement. Over
time and as technology has allowed, the product has been upgraded from a generic COFDM decoder
in the DSS5600a to a DVB-T diversity terrestrial decoder in the DSS5600T, then again to a DVB-T/H
diversity decoder in your DSS5600T/H. Refer to the DSS5600a User Manual for the basic operation
of your new DriveTest system. This document will identify and describe the differences you need to
know about specifically for your DSS5600T/H DriveTest system.
DSS5600T/H System differences:
The DSS5600T/H is the same as the DSS5600a with the following differences:
•
The COFDM decoder of the DSS5600a is superseded with a DVB-T/H Diversity
Receiver/Decoder. The new dual input diversity Receiver/Decoder supports measurement
and decoding of both the DVB-T Terrestrial DVB signal, and the DVB-H Handheld DVB signal
and is auto sensing between the two. The Reciever/Decoder supports 2 ASI outputs The unit
is a TeamCast model TCM-RXH0-1020.
•
A new more powerful laptop PC has been integrated to the system. The laptop supports more
USB ports. At the time of this writing the new laptop is a 2GHz dual core processor, with 2 GB
RAM, and a120GB HD.
•
The new laptop communication to devices is different then the original setup. The laptop now
communicates with the meter by it’s own built in serial port on COM1. Communication to the
new DVB-T/H decoder is by a USB to Serial adapter. Communication to the GPS is also by
USB. Since the USB ports are sometimes on the back of the laptop and difficult to access, a
USB extender cord may have been added to bring the USB port GPS receiver to an easy to
Page 1 of 22
Supplement: DSS5600T/H Differences Document
Supplement to DSS5600a User Manual
access area next to the left side of the PC. Use the Windows Device manager for further
information on the mapping of these communication ports. DriveTest is configured to use the
mapping assigned by windows. The mapping assignments in DriveTest are in the file:
C:\Program Files\Z Technology\DriveTest 2\SysSetup.ssp.
•
A Diversity Antenna Calibrated RF Switch is added. This is an active device. Its purpose is to
allow the R-507 Field Strength Meter input to be connected to one of the two antenna inputs.
The user selects which antenna input (ANT1 or ANT2) is fed to the meter by a toggle switch
between the two antenna inputs. The switch is designed for 50 Ohm input on it’s N
connectors. Both antenna inputs have 50 ohm to 75 ohm impedance matching before the
signal is fed into the DVB-T/H diversity decoder. The path to the meter is all 50 ohm. The
switch has been characterized so that it can be used in the RF path to the meter and still
result in traceable, calibrated RF power measurements. The RF loss from the
characterization is added to the Antenna factor in the DriveTest Software.
•
An additional 12VDC power block has been added to power the DVB-T/H decoder, and the
Diversity Antenna Calibrated RF Switch. The original 15VDC power block still powers the
meter.
•
The RS-232 serial interface Trimble 6 channel GPS receiver has been replaced with a USB
interface 12 channel GPS receiver with WAAS capability. This eliminates the need for a
second RS-232 port on the laptop, and provides a newer generation, more robust GPS
solution. Note the USB interface GPS receiver creates a virtual COM port when plugged in.
The COM port shows up in the Windows Device Manager. DriveTest uses the assigned COM
port to communicate with the GPS receiver. The USB GPS receiver must be connected
before DriveTest software is started in order for DriveTest to recognized it.
•
A single switch controls instrumentation power. The switch is located in the left side of the
case next to power indicator LEDs. It controls DC power to all the instrumentation in the
case. 15VDC and 12VDC indicator lights indicate when respective power blocks are on and
working. There is no instrumentation battery in the system. (The meter battery is
disconnected by a jumper on the back of the instrument that connects pin 5 & 7 of the
accessories connector. See R-507 User Manual Section 13: Rear Panel Connectors for
details). If the 12VDC to 220VAC power inverter looses power, the instrumentation will turn
off. The PC and USB interface GPS receiver however will remain running from the laptop
internal battery.
•
If your system was upgraded from a DSS5600a system, The RF splitter in the meter used to
feed RF to the old COFDM decoder of the DSS5600a has been removed and the meter recalibrated with out it. The RF path to the new DVB-T/H decoder is through the Diversity
Antenna Calibrated RF Switch. New DSS5600T/H systems use a standard R-507 field
strength meter without the optional internal RF splitter.
•
The buttons on the R-507 Field Strength Meter front panel are back. This allows the user to
use the R-507 as a stand-alone meter as described in the R-507 User Manual. Remove the
jumper from pins 5 & 7 of the accessory connector to allow the meter to use it’s internal
battery. Charging for 24 hours in the system with the system plugged in and turned on is
necessary to charge the battery. A 15 VDC wall charger with “+” on the center pin of a barrel
connector may also be used. To remove the meter from the case, first disconnect the DC
power and RS-232 cables from the back of the meter. Second, gently lift the rear of the meter
about 1mm. You will hear the tearing of the velcro attachment to its chassis. Slide the meter
to the left about 2.5mm to align its feet to the opening of the keyhole mount in the chassis.
Third take the meter out of Remote mode by pressing the Power switch twice. When the
meter is place back in the system, the pin 5 to pin 7 jumper on the Accessory connector must
Page 2 of 22
Supplement: DSS5600T/H Differences Document
Supplement to DSS5600a User Manual
be re-inserted to make the meter power up properly, and put the meter in “F90” automatic
remote mode as described below.
Note: When shipped from the factory the meter is “F90” automatic
remote mode. Upon power up the meter automatically goes into
remote mode, “1 Port” showing on the display. If the Power
button on the meter or the Function button on the meter is
pressed, the meter comes out of “F90” automatic remote mode.
To put the meter back into “F90” automatic remote mode 1. Press
the Function button. 2. Rotate the Tune knob counter clockwise
until “F 90” appears on the display. 3. Press and release the Tune
knob. “1 Port” should appear on the meter front panel screen.
•
The DriveTest Job editor has changed in order to control the new setup features of the DVBT/H decoder. See DriveTest Changes later in the document.
•
The recorded Figures of Merit have changed to reflect the values available from the DVB-T/H
diversity decoder. See DriveTest Changes later in this document.
•
The procedures for running DriveTest remain the same. The Sample Once, Sample
Continuous, Record Once, and Record Continuous buttons operate the same. The
process to create a new job remain the same, though there are new features to select for the
new DVB-T/H diversity decoder. The functions of the PLOT tab remain the same except there
are new Figures of Merit to plot from the DVB-T/H diversity decoder. The process to Export
data remains the same, but there is more decoder data to export.
•
The Decoder portion of the Spectrum Display screen has been re-designed to display DVBT/H decoder Figures of Merit (FOM’s) from ANT1 and ANT2 inputs. As with the DSS5600a if
not recording you can also set DVB-T/H settings. Constellation tab and Impulse response
tabs have been added to the decoder section. The Time Plot function has been moved into a
Time Plot tab in the decoder section.
DriveTest Changes
Job Editor
The job editor has changed to support the new signal types. The old COFDM signal types have been
replaced with DVBTH signal types. Their configuration windows have been updated to reflect the
change. The system now supports DVBTH 5 MHz, DVBTH 6 MHz, DVBTH 7 MHz, and DVBTH 8
MHz signal types. Below is the Job Editor frequency list selection screen with the DVBTH 6MHz
signal type selected. Notice the Configure DVBTH 6 MHz button.
Page 3 of 22
Supplement: DSS5600T/H Differences Document
Supplement to DSS5600a User Manual
Figure 1: Job Editor - Configure DVBTH Signal Type
Click on the Configure DVBTH 6 MHz button.
Figure 2: DVBTH 6 MHz Configuration
This window appears when DVBTH signal type is selected followed by selecting the Configure DVBTH
button. The parameters on this screen are:
• Post Delay: Sets the delay following each frequency measurement.
• Decoder: Enables or disables the DVBTH decoder. When enabled, the Configure DVBTH
Decoder button is available.
• Configure DVBTH Decoder: See next page.
Page 4 of 22
Supplement: DSS5600T/H Differences Document
Supplement to DSS5600a User Manual
•
•
•
•
Modulation: Selection for measuring a wideband digital signal or an analog signal. Digital
should be selected for a Digital Television signal type and Normal is used for signals such as
analog television and FM broadcast signals. Selecting Digital Modulation corrects the
measurement for signals modulated in such a way as to simulate a gausian noise type signal.
This is the case for such modulation schemes as 8VSB, DVBTH5, DVBTH6, DVBH7, DVBH8
and ISDB.
Auto Range: Allows the DriveTest software to automatically control the field strength meter
gain and attenuation to select the proper setting for each measurement. Disable (uncheck)
Auto Range to allow faster measurements but at a reduced dynamic range.
Amplification: Allows the user to lock in a gain/attenuation level for the field strength meter
when Auto Range disabled.
Sweep Width/IFBW: Selects the sweep width and IF bandwidth of the field strength meter.
The choices are: 5MHz/15KHz, 10MHz/15KHz, 10MHz/150KHz, and 20MHz/150KHz.
Note: The DSS5600T/H is calibrated for accurate RF measurements when in
the 10MHz/150KHz Sweep Width. Other settings are for viewing signals but
not for accurate RF readings.
•
Marker Widths: Sets the inner and outer markers for the Spectrum Analyzer display.
Integrated power is measured between outer markers. Other RF measurement parameters
are measured between inner markers. These include tilt, high/low difference, peak power and
standard deviation.
Job Editor: Configure DVBTH Decoder
Figure 3: Configure DVBT Decoder
The DVBT Decoder configuration consists of the followingInput Mode:
• Diversity: See description in TCM-RXH0-1020 decoder specification.
• Redundant: See description in TCM-RXH0-1020 decoder specification.
Correction Algorithms:
• Mobile Operation: See description in TCM-RXH0-1020 decoder specification.
• Impulse Noise Killer: See description in TCM-RXH0-1020 decoder specification.
Frequency Offset:
• None: See description in DVBT decoder specification.
Page 5 of 22
Supplement: DSS5600T/H Differences Document
Supplement to DSS5600a User Manual
•
•
Stream
•
•
Negative (-167 kHz): See description in TCM-RXH0-1020 decoder specification.
Positive (+167 kHz): See description in TCM-RXH0-1020 decoder specification.
Priority:
High: See description in TCM-RXH0-1020 decoder specification.
Low: See description in TCM-RXH0-1020 decoder specification.
Figure of Merits Recorded to Data File:
Meter FOM’s
•
Integrated Power, Peak Power, High Low Difference, Tilt, Standard Deviation.
Diversity DVB-T/H Decoder FOM’s (NEW)
•
Antenna, FFT, Guard, FMT, Alpha, HP Code Rate, LP Code Rate, OUTFMT[Bytes], AGC
Lock1, Carr Lock1, TPS Lock1, Vit Lock1, MPEG-Sync Lock1, MPEG-Data Lock1, Bad MPEG
Pkt1, QEF1, Cell ID1, MER1[dB], BER1, PER1[/sec], SNR1[dB], SQI1, DVBH SIG1, HP TSL1,
HP MF1, LP TSL1, LP MF1, AGC Lock2, Carr Lock2, TPS Lock2, Vit Lock2, MPEG-Sync
Lock2, MPEG-Data Lock2, Bad MPEG Pkt2, QEF2, Cell ID2, MER2[dB], BER2, PER2[/sec],
SNR2[dB], SQI2, DVBH SIG2, HP TSL2, HP MF2, LP TSL2, LP MF2
(See TCM-RXH0-1020 decoder specification for description of these FOM’s)
DVB-T/H Diversity Decoder FOMs
NOTE 1: Any metric with a “1” suffix is from to RF path 1
NOTE 2: Any metric with a “2” suffix is from to RF path 2
NOTE 3: a value of 255 indicates metric was indiscernible.
Antenna
0 ==> RF Input 1 is selected
1 ==> RF Input 2 is selected
FFT
0 ==> DVB-T/H mode – 2K
1 ==> DVB-T/H mode – 8K
2 ==> DVB-T/H mode – 4K
Guard
0 ==> DVB-T/H mode – Guard interval = 1/32
1 ==> DVB-T/H mode – Guard interval = 1/16
2 ==> DVB-T/H mode – Guard interval = 1/8
3 ==> DVB-T/H mode – Guard interval = 1/4
FMT
0 ==> DVB-T/H mode – Constellation = QPSK
1 ==> DVB-T/H mode – Constellation = 16 QAM
2 ==> DVB-T/H mode – Constellation = 64 QAM
Alpha
0 ==> DVB-T/H mode – Non Hierarchique
1 ==> DVB-T/H mode – Hierarchique with
2 ==> DVB-T/H mode – Hierarchique with
3 ==> DVB-T/H mode – Hierarchique with
=1
=2
=4
HP Code Rate
0 ==> DVB-T/H mode – Code rate = 1/2
1 ==> DVB-T/H mode – Code rate = 2/3
2 ==> DVB-T/H mode – Code rate = 3/4
3 ==> DVB-T/H mode – Code rate = 5/6
4 ==> DVB-T/H mode – Code rate = 7/8
Page 6 of 22
Supplement: DSS5600T/H Differences Document
Supplement to DSS5600a User Manual
LP Code Rate
0 ==> DVB-T mode – LP code rate = 1/2
1 ==> DVB-T mode – LP code rate = 2/3
2 ==> DVB-T mode – LP code rate = 3/4
3 ==> DVB-T mode – LP code rate = 5/6
4 ==> DVB-T mode – LP code rate = 7/8
OUTFMT
0 ==> Output Format at 204 bytes
1 ==> Output Format at 188 bytes
Interleaver
0 ==> Native inner interleaver
1 ==> IN-depth inner interleaver
AGC Lock
0 ==> AGC Not Locked
1 ==> AGC Locked
Carr Lock
0 ==> Carrier Not Locked
1 ==> Carrier Locked
TPS Lock
0 ==> TPS Not Locked
1 ==> TPS Locked
Vit Lock
0 ==> Viterbi Not Locked
1 ==> Viterbi Locked
MPEG-Sync Lock
0 ==> MPEG Synchronization Not Locked
1 ==> MPEG Synchronization Locked
MPEG-Data Lock
0 ==> MPEG Data Not Locked
1 ==> MPEG Data Locked
Bad MPEG Packet
0 ==> No uncorrected MPEG Packets
1 ==> Uncorrected MPEG Packet(s)
CellID
- Cell Id for RF Path as defined in ETS 300744
QEF
0 ==> PreRS BER => 2E-4
1 ==> PreRS BER < 2E -4
MER
– Modulation Error Ratio expressed in dB
BER
– Pre Reed Solomon Bit Error Rate expressed in 10-8
PER
– Packet Error Rate expressed in error packets per second
SNR
- Signal to Noise Ratio Value of the C/(N+I) in dB
SQI
- Signal Quality Indicator 0 to 100
SQI Calculation
If the Reed Solomon Core is LOCKED and SNR > 28 then
SQI =100
Page 7 of 22
Supplement: DSS5600T/H Differences Document
Supplement to DSS5600a User Manual
If the Reed Solomon Core is LOCKED and SNR <= 28 then
SQI = 50+ ( ((SNR-modf)*50) / (28-modf) )
Where : modf=6 for QPSK signals, 11 for 16QAM, and 16 for 64 QAM.
If the Reed Solomon Core is UNLOCKED and AGC_Gain < 85 then
SQI = 50
If the Reed Solomon Core is UNLOCKED and if AGC_Gain >= 85 then
SQI = 50 – ( ((AGC_Gain-85)*50) / (15)
Where: AGC_Gain is a scaled 11 bit number.
DVBH SIG
0 ==> DVB-H signaling is not performed
1 ==> DVB-H signaling is performed
HP TSL
0 ==> Time slicing is not used on HP stream
1 ==> Time slicing is used on HP stream
HP MF
0 ==> MPE FEC is not used on HP stream
1 ==> MPE FEC is used on HP stream
LP TSL
0 ==> Time slicing is not used on LP stream
1 ==> Time slicing is used on LP stream
LP MF
0 ==> MPE FEC is not used on LP stream
1 ==> MPE FEC is used on LP stream
GPS FOM’s
•
Latitude, Longitude, Altitude, Altitude Units, Heading, Heading Units, Speed, Speed Units,
Quality, Satellites, HDOP.
Spectrum Display
An alternative to view measurement data is to bring up the Spectrum Display screen. On the “View”
menu select “Spectrum Display” or just press “Shift + F12”
Figure 4: Select "Spectrum Display" from the "View" menu
The top portion of the Spectrum Display screen shows a spectrum of the current signal, and the
associated measured parameters. The bottom portion by default shows the Constellation Tab for the
DVB-T/H decoder. Click the Maximize button at the top right to make full screen. Note that you can
size the top and bottom screens by dragging the center dividing line up or down.
Page 8 of 22
Supplement: DSS5600T/H Differences Document
Supplement to DSS5600a User Manual
Figure 5: Spectrum display with DVB Constellation
Drag the separator bar up to make the Constellation pane larger.
Figure 6: Spectrum Display screen is an alternative way to view measured parameters
Page 9 of 22
Supplement: DSS5600T/H Differences Document
Supplement to DSS5600a User Manual
Figure 7: Time plot of SNR1
Click on the Time Plot tab to see a plot of any measured DVBTH parameter. Above is a time plot of
SNR1 vs Time.
Click on the Impulse Tab to view the Impulse response of both ANT1 and ANT2.
Figure 8: ANT 1 and ANT 2 Impulse Response
Plot
The “PLOT” tab remains much the same as on the DSS5600a, however with the DVB-T/H decoder
there are many more FOM’s available to plot. Below is an example of making the most of using the
Plot tab once some measurements have been recorded. Clicking on the Plot tab. If this is the first
Page 10 of 22
Supplement: DSS5600T/H Differences Document
Supplement to DSS5600a User Manual
time you have looked at the Plot, A map of the world appears. If you have looked at the Plot before
your last view is displayed.
Figure 9: Plot Tab displays measured data on a world map
Click on the “Zoom to Current Country” button. The current country appears.
Figure 10: DriveTest data in country view of map
Zoom in Closer by clicking on the “Zoom to DriveTest Data” button.
Page 11 of 22
Supplement: DSS5600T/H Differences Document
Supplement to DSS5600a User Manual
Figure 11: Data added to the plot as drive taking place
Zoom out to show more of drive. On the right side of the screen the “Properties” Tab is displayed
showing a drop down box with the Signal Name “DVB” If there were more than one frequency being
recorded in this job you can select which frequency to plot by selecting it’s signal name. Next the
Signal type is “DVBTH 6 MHz”. Next the FOM or “Figure Of Merit” that is plotted. Only one FOM is
plotted at a time. Use the down arrow on the box to select which FOM to plot. Each FOM has it’s own
palette. FOMs who’s value can cover a large range are by default shown with 10 color palettes. The
Palette thresholds are formed by the high and low recorded values divided into tenths. FOM’s that
have just ON or OFF values default to two color palettes.
Figure 12: “Integrated Pwr” FOM data display zoomed in.
Add a transmitter to the map by clicking on the “Transmitter” button in the tool bar then clicking on the
map at the desired location of the transmitter.
Page 12 of 22
Supplement: DSS5600T/H Differences Document
Supplement to DSS5600a User Manual
Figure 13: Adding a Transmitter to the map
The “Edit Transmitter” screen appears, the default name is “Tower 1” Click the “OK” button.
Figure 14: Edit Transmitter
The “Map Properties” screen appears. Under “Map Features” highlight “Transmitters”. Make sure the
“Show” box is checked under “Display of Transmitters”. Make sure the “Label” box is checked. Click
on the “OK” button to close the screen.
Page 13 of 22
Supplement: DSS5600T/H Differences Document
Supplement to DSS5600a User Manual
Figure 15: Map Properties screen
Back at the Plot screen click the “Map Tracking” button.
Figure 16: Click the Map Tracking button
The Map Tracking screen appears. Verify that both the Bullseye, and Bearing boxes are checked then
click “OK”
Figure 17: Map Tracking screen
A transmitter location is shown on the map and the bullseye has an arrow through it pointing in the
direction to the transmitter, text displays from the bullseye to the transmitter, an arrow show the
direction to the transmitter. Park the cursor over a measurement and a text pops up that shows the
value at that measurement location and the distance to the transmitter from that location. The
distance can be displayed in Miles, Kilometers, or Nautical miles by selection in the Job Editor
“Settings” tab.
Page 14 of 22
Supplement: DSS5600T/H Differences Document
Supplement to DSS5600a User Manual
Figure 18: Park the cursor on a dot, a text pop up displays measurement value
and distance to transmitter.
To see all the measurements for a particular location move the cursor over a dot then click the right
mouse button. DriveTest will “Drill down” on that dot and show all the data associated with that
measurement. The “Properties” tab at the right side of the screen containing the color palette is
replaced with the “Drill Data” Tab.
Figure 19: Right click on a dot to drill down and display "Drill Data"
To see a plot of any of the other measured data, forinstance to see a plot of the ANT 1 input Signal to
Noise Ratio (SNR1). 1. Click on the “Properties” tab to get back to showing the FOM drop down box.
2. Click on the FOM drop down arrow. 3. Select “SNR1”
Page 15 of 22
Supplement: DSS5600T/H Differences Document
Supplement to DSS5600a User Manual
Figure 20: Select the SNR1 FOM (Figure of Merit ) for plotting
Below is a plot of the Signal to Noise Ratio on the diversity decoder Channel 1 input.
Figure 21: Plot of SNR1
To change the color thresholds click on the “New” button in the “Properties” tab.
Page 16 of 22
Supplement: DSS5600T/H Differences Document
Supplement to DSS5600a User Manual
Figure 22: Edit Palette colors and thresholds
There is a palette for each FOM. You can define as many palettes as you like each with a unique
name. You cannot use a palette defined for one FOM on a different FOM. In other words if you define
a palette for “Integrated Pwr” and name it “My Int Power”, you can not select the “My Int Power” palette
when displaying SNR1.
Finally use the “Cross Filter” tab to filter out measurements you do not want to see. For instance you
may want to see all the measurements that are above a certain value, or you may want to see all the
measurements that are below a certain value, or all the measurements where Integrated Power is
above a certain value and SNR1 is above a different value. Many different combinations can be
displayed using the Cross Filter tab.
Page 17 of 22
Supplement: DSS5600T/H Differences Document
Supplement to DSS5600a User Manual
Figure 23: Using Cross Filter to display only measurements where Integrated
Power is above –50.0 dBm
Un-check the Cross Filter box in the Cross filter tab, then click on the Properties tab to select the
BER1 FOM.
Figure 24: Plot of BER1 (channel 1 BER)
Click the Cross Filter tab, then re-check the Cross Filter box. The result is a plot of BER1 where
Integrated Pwr is greater than –50dBm
Page 18 of 22
Supplement: DSS5600T/H Differences Document
Supplement to DSS5600a User Manual
Figure 25: Plot of BER1 where Integrated Power is greater than -50 dBm
Page 19 of 22
Supplement: DSS5600T/H Differences Document
Supplement to DSS5600a User Manual
DVB-T/H Diversity Decoder Specifications:
Page 20 of 22
Supplement: DSS5600T/H Differences Document
Supplement to DSS5600a User Manual
Antenna Selector Switch
Figure 26: Diversity Antenna Calibrated RF Switch
Diversity Antenna Calibrated RF Switch – Antenna Factor
Below is an example of the Diversity Antenna Calibrated RF Switch characterization table located
in the Antenna section of the System User Manual.
Page 21 of 22
Supplement: DSS5600T/H Differences Document
Supplement to DSS5600a User Manual
Figure 27: Example RF Switch Characterization
To calculate the number to be entered into the Antenna Factor field in the Job Editor add the
absolute value of the following numbers:
1. The Antenna Factor from the Antenna at the frequency of use
2. The loss of the cable connecting the antenna to the RF switch at the frequency of use
3. The loss of the RF switch at the frequency of use.
For instance if we are measuring a signal at 600 MHz we might use the following numbers.
1.
25 dB from the Antenna Factor table in the Antenna Section of the System Manual
2.
2 dB from the Cable Loss table in the Antenna Section of the System Manual
3.
5.2 dB from the RF Switch Characterization table in the Antenna Section of the System
Manual
For this example the Antenna Factor entered in the Job Editor Antenna Factor Field is 32.2 dB.
25 dB + 2 dB + 5.2 dB = 32.2 dB
Page 22 of 22