1
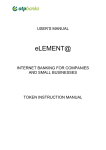
Latvijas Banka
Statistical Database
User Manual
Version 2.03
Riga, July 2015
Latvijas Banka Statistical Database. User Manual
2
Table of contents
1.
GENERAL PRINCIPLES............................................................................................................................................................. 3
1.1. LAYOUT OF THE USER INTERFACE .............................................................................................................................................. 3
1.2. LANGUAGE SELECTION AND OTHER OPTIONS ............................................................................................................................... 3
1.3. LEFT-HAND SIDE MENU ........................................................................................................................................................... 4
2.
STATISTICAL DATA AND CHARTS PRESENTATION AREA ...................................................................................................... 5
2.1. DATA PRESENTATION AREA ..................................................................................................................................................... 5
2.1.1.
Statistical data .......................................................................................................................................................... 5
2.1.2.
Data table ................................................................................................................................................................. 7
2.1.3.
Row or column fields of a data table ........................................................................................................................ 7
2.1.4.
Data fields of the data table ..................................................................................................................................... 8
2.1.5.
Sorting and filtering of row or column fields ............................................................................................................ 9
2.1.6.
Additional functionality ............................................................................................................................................ 9
2.1.6.1.
Unlinking of row or column fields and data fields ........................................................................................... 9
2.1.6.2.
Menu of column and row values...................................................................................................................... 9
2.1.6.3.
Information about a cell ................................................................................................................................ 10
2.1.6.4.
Selection of columns and rows ...................................................................................................................... 11
2.2. CHART PRESENTATION AREA .................................................................................................................................................. 12
2.2.1.
Selection of charts .................................................................................................................................................. 12
2.2.2.
Chart settings ......................................................................................................................................................... 13
2.2.2.1.
Opening and hiding the chart settings........................................................................................................... 13
2.2.2.2.
Collapsing and expanding the groups of chart settings ................................................................................. 14
2.2.2.3.
Saving and cancelling chart settings .............................................................................................................. 15
2.2.2.4.
Settings common for all types of charts ........................................................................................................ 15
2.2.2.5.
Settings for charts with X and Y axes ............................................................................................................. 17
2.2.2.6.
Settings for line charts ................................................................................................................................... 19
2.2.2.7.
Settings for pie and area charts ..................................................................................................................... 20
2.2.2.8.
Inner radius of a doughnut chart ................................................................................................................... 20
DIVI.STATDB.PJD.LLC.ENG.V02.03.2015.07.02
Latvijas Banka Statistical Database. User Manual
3
1. General principles
1.1. Layout of the user interface
The user interface consists of three parts:
menu and
language selection and other options,
statistical data and charts presentation area.
1.2. Language selection and other options
Latvian language switcher
English language switcher
RSS feed menu. Clicking on this icon opens a window where
one can subscribe to RSS messages on all data changes or
changes in a definite statistical area.
Link to the homepage of the statistical database
Link to Latvijas Banka's website
DIVI.STATDB.PJD.LLC.ENG.V02.03.2015.07.02
left-hand side
Latvijas Banka Statistical Database. User Manual
4
1.3. Left-hand side menu
The left-hand side menu allows the user to find and select the necessary data. The menu is organised
in three levels:
Statistical areas
Data categories
The name of the data category is followed by the date of the last update.
Data tables
One or several data tables defined by the Bank of Latvia are available for each data category. To open
the table, click on its title. To open a blank data table, click on the link Create your table.
To open a sub-level, click on the title of a level or the icon
.
Where necessary, the left-hand side menu can be hidden by clicking on the icon
side menu is hidden and it is necessary to unhide it, click on the icon
DIVI.STATDB.PJD.LLC.ENG.V02.03.2015.07.02
. If the left-hand
at the title "Data categories".
Latvijas Banka Statistical Database. User Manual
5
User Manual and Video Help are available in the left-hand side menu. To open it, click on the menu
.
2. Statistical data and charts presentation area
2.1. Data presentation area
This area shows data of the selected data table. The sections Statistical data and Charts are available
on the upper toolbar of the data presentation area.
2.1.1. Statistical data
In the section Statistical data you can see and change the data of the selected data table and
perform the toolbar actions.
Save
Open
Undo
Redo
Filters
Saves the data tables created by the user on his/her PC. The file is saved in the Internet
explorer default download folder.
Opens the previously saved data tables. A window opens where the user selects the
location of the file and clicks on the Upload button.
Erases the last change to the data table, reverting it to an older state. Where no changes
have been made to the data table, the icon is inactive with a grey arrow on it.
The system stores the last five changes.
Reverses the undo and restores the change made to the data table.
Where no undo actions have been made, the icon is inactive with a grey arrow on it.
Filters the data in the table using different criteria. For each data field, you can define
whether the value sought equals "=", does not equal "<>", is larger
than ">" or smaller than "<" the value entered in the next column. To find a value in a
particular range, choose the filter type "Between" and enter the range in the adjacent
boxes.
Where the row or column and data fields are changed, the filter is cancelled.
DIVI.STATDB.PJD.LLC.ENG.V02.03.2015.07.02
Latvijas Banka Statistical Database. User Manual
6
Gives information on a data category or a table. Where there is no additional
Information information, the icon is not available.
Offers guidance for working with the statistical database.
Help
Prints the data table.
Print
Saves the data table in a PDF format.
PDF
Saves the data table in an MS Excel format.
MS Excel
Saves the data in an MS Excel format without table descriptions.
MS Excel
(unformatted)
Saves the data table in a CSV format.
CSV
Saves the data table in an RTF format.
RTF
DIVI.STATDB.PJD.LLC.ENG.V02.03.2015.07.02
Latvijas Banka Statistical Database. User Manual
7
2.1.2. Data table
The principle of pivot tables is used for presenting data. A data table is created from the available
row or column fields and data fields. It presents data in different breakdowns and allows users to select
data according to their needs. The selected data are presented in a table, arranged in rows and columns.
Data table containing the selected data
Column field area
Row field area
Hierarchical rows and columns are hidden in a data table. To see sub-levels, click on the icon .
To collapse sub-levels, click on the icon .
2.1.3. Row or column fields of a data table
Row or column fields show the possible data breakdowns (for the definition of "data fields", see
Section 2.1.4). In data tables, the row or column field is presented as follows:
.
Area of row or column fields not linked to the table. All row or column fields available in the data
category but not used in the data table are located here.
Filter area. The row or column fields used as data filters are located in (dragged to) this area.
Column field area. The row or column fields forming the data table columns are located in (dragged
to) this area.
Row field area. The row or column fields forming the data table rows are located in (dragged to) this
area.
The user can easily modify the data table. To use row or column fields in the data table, select a field
from the available list of row or column fields and drag it to the relevant area. To do that, click the left
DIVI.STATDB.PJD.LLC.ENG.V02.03.2015.07.02
Latvijas Banka Statistical Database. User Manual
8
mouse button once on the relevant row or column field and, holding it down, drag the field to the row
or column field area or the filter area. When the field has been dragged to the required area, two
arrows appear indicating the location where the field will be placed.
Then the mouse button can be released, as the field has been linked. If any row or column fields already
are placed in the area, the sequence of the fields depends on the location of the field (the field can be
located at the beginning, in the middle or at the end).
Unlinking of row or column fields is performed in an analogous way. To do that, drag a row or column
field from the linked position to the area of row or column fields not linked to the table.
Where a pin icon is located next to the row or column field, the field cannot be moved.
2.1.4. Data fields of the data table
Data fields show the available values.
In data tables, data fields are presented as follows:
Area of data fields not linked to the table. All available data fields that have not been used in the
data table are located here.
Data field area. Data fields that must be presented in the data table are located in (dragged to) this
area.
The data table is modified in the same way as in the case of row or column fields (see Section 2.1.3).
Click the left mouse button on the required data field and, holding it down, drag the field to the data
field area.
Where more than one data field is selected, a pop-up window with a list of the selected data fields
appears.
When a data field has been dragged to the required area, two arrows appear and the mouse button can
be released.
The data field has been linked to the list.
To unlink a data field, drag it back to the area of data fields not linked to the table.
DIVI.STATDB.PJD.LLC.ENG.V02.03.2015.07.02
Latvijas Banka Statistical Database. User Manual
9
2.1.5. Sorting and filtering of row or column fields
Row or column field values can be sorted in an ascending or descending order and filtered. Sorting is
performed by clicking on the triangle icon in a row or column field:
sorting in an ascending order,
sorting in a descending order.
To filter row or column values, click on the icon .
A list of available row or column field values opens. The row or column field shows all values by
default. Where all values are not required in the data table, they are filtered by unchecking boxes at the
unnecessary values. Where individual values are selected in the row or column field filter, an additional
icon . It means that all row or column field values are not shown (selected).
2.1.6. Additional functionality
2.1.6.1. Unlinking of row or column fields and data fields
By clicking once the right mouse button on a row or column field and a data field, you can unlink that
field. To do that, click on Hide. A row or column field or a data field can also be unlinked by dragging it
to the area of fields not linked to the table.
2.1.6.2. Menu of column and row values
By clicking once the right mouse button on the row or column values, you can do the following.
or
Expand – expands the hierarchy of the selected row or column.
Collapse – collapses the hierarchy of the selected row or column.
DIVI.STATDB.PJD.LLC.ENG.V02.03.2015.07.02
Latvijas Banka Statistical Database. User Manual
10
Expand all – expands the hierarchy of all rows or columns.
Collapse all – collapses the hierarchy of all rows or columns.
Sort "…" by this column – rearranges data according to the values in the selected column. By default,
sorting is done in an ascending order. To sort data in a descending order, click on the sorting icon .
Where sorting has been applied to a column, the icon
appears at the column header.
No sorting by column has been applied.
Sorting by the first column has been applied.
Sort "…" by this row – rearranges data according to the values in the selected row. By default, sorting is
done in an ascending order. To sort data in a descending order, click on the sorting icon
in
the
column field selected for sorting. Where sorting has been applied to a row, the icon
appears at the
row header.
Before sorting by row
After sorting by the first row
2.1.6.3. Information about a cell
The data table provides information about each cell. It can be seen, moving the cursor to the value of
the respective cell but not clicking on it. An information field with row and column field values opens.
DIVI.STATDB.PJD.LLC.ENG.V02.03.2015.07.02
Latvijas Banka Statistical Database. User Manual
11
2.1.6.4. Selection of columns and rows
The column or row containing a particular cell can be selected and marked in the data table. To do
that, move the cursor to the respective cell and double-click on it.
The selection regime is cancelled by double-clicking on the selected cell.
DIVI.STATDB.PJD.LLC.ENG.V02.03.2015.07.02
Latvijas Banka Statistical Database. User Manual
12
2.2. Chart presentation area
2.2.1. Selection of charts
The section Charts allows the user to create a chart for the data presented in the data table. Opening
the section Charts for the first time, the user obtains information about the chart presentation area.
Clicking on the selected type of the chart creates a chart for the open data table.
Presents data in a bar chart.
Bar
Presents data in a 100% stacked bar chart.
100% stacked bar
Presents data in a line chart.
Line
Presents data in a pie chart.
Pie
Presents data in a doughnut chart.
Doughnut
Presents data in an area chart.
Area
Presents data in a 100% stacked area chart.
100% stacked area
Presents data in a bubble chart.
Bubble
Dynamic
Presents data in a dynamic chart. Dynamic charts can only be created for
the tables with defined time (date) values. Where the data table has no
such values, a dynamic chart cannot be created. In such a case, a notice
stating that the data table does not contain time values will appear.
Prints the chart.
Print
Saves the chart in a PDF format.
PDF
Saves the chart in a JPG format.
JPG
DIVI.STATDB.PJD.LLC.ENG.V02.03.2015.07.02
Latvijas Banka Statistical Database. User Manual
13
2.2.2. Chart settings
2.2.2.1. Opening and hiding the chart settings
The user can change the chart settings depending on the type of the chart. To see which settings of
the chart can be changed, click on the icon
To hide the chart settings, click on the icon
DIVI.STATDB.PJD.LLC.ENG.V02.03.2015.07.02
next to the title "Chart settings".
.
Latvijas Banka Statistical Database. User Manual
14
2.2.2.2. Collapsing and expanding the groups of chart settings
Chart settings are arranged in groups. To collapse a group of chart settings, click on the title of the
group or the icon .
To open a group of chart settings, click on the title of the group or the icon
DIVI.STATDB.PJD.LLC.ENG.V02.03.2015.07.02
:
Latvijas Banka Statistical Database. User Manual
15
2.2.2.3. Saving and cancelling chart settings
Chart settings are saved by clicking on the button
to the default chart settings, click on the button
. After saving, a chart is formed. To revert
.
2.2.2.4. Settings common for all types of charts
These chart settings are available for all types of charts, except the dynamic chart.
Title
Alignment
Inserting a line
break
The title of the chart. It can consist of up to 150 characters.
Select the type of text alignment.
Indicate whether the text is to be split into several lines.
Colour palette
Select the colour palette to be used in the chart.
DIVI.STATDB.PJD.LLC.ENG.V02.03.2015.07.02
Latvijas Banka Statistical Database. User Manual
Show the legend
Direction
Horizontal
alignment
Max horizontal size
Vertical alignment
Max vertical size
Show labels
Show tooltip
16
Add or remove the legend in the chart.
Select the direction for arranging the elements of the legend.
Select the location of the legend along the horizontal line.
Select the maximum size that the legend can occupy of the total chart size along
the horizontal line.
Select the location of the legend along the vertical line.
Select the maximum size that the legend can occupy of the total chart size along
the vertical line.
Add or remove labels in the chart.
Add or remove a tooltip that appears when the cursor points to a value in the
chart.
DIVI.STATDB.PJD.LLC.ENG.V02.03.2015.07.02
Latvijas Banka Statistical Database. User Manual
17
Top N and others
Use to display only the largest results that correspond to the selected criteria.
For example, this chart shows the Top 3 largest values, and the total of other
values is presented by the bar "Others".
Type
Show "Others"
"Others"
argument
Select the criterion for displaying the results.
Indicate whether to show other values that do not meet the "Top N" criterion.
Add the title for the other values.
2.2.2.5. Settings for charts with X and Y axes
These settings are available in the group of chart settings "Axes", when selecting the bar, 100%
stacked bar, line, area, 100% stacked area or bubble charts.
X axis name
Alignment
Word wrap
Y axis name
Alignment
Word wrap
The name of the x axis. It can consist of up to 150 characters.
Select the type of text alignment.
Indicate whether the text is to be split into several lines.
The name of the y axis. It can consist of up to 150 characters.
Select the type of text alignment.
Indicate whether the text is to be split into several lines.
DIVI.STATDB.PJD.LLC.ENG.V02.03.2015.07.02
Latvijas Banka Statistical Database. User Manual
Resolve
overlapping for
axis labels
18
Indicate whether the position of axis labels is to be automatically changed. Where axis
labels cannot be arranged in one line, they are rotated so that they do not overlap and
are legible.
"Resolve overlapping for axis labels" is turned off
"Resolve overlapping" is turned on
Indent
Set the size of the indent between axis labels to calculate the position of labels. The
larger the number, the larger the indent between labels.
The indent is set at "30":
Logarithmic
scale
Logarithmic
base
The indent is set at "–10":
.
The option "Indent" is functional if the option "Resolve overlapping for axis labels" is
selected.
Select to change the axis to a logarithmic scale.
Select the value of the logarithmic base.
DIVI.STATDB.PJD.LLC.ENG.V02.03.2015.07.02
Latvijas Banka Statistical Database. User Manual
Scale breaks
19
Add or remove scale breaks to the Y axis.
2.2.2.6. Settings for line charts
If a line chart is selected, the below settings are available in the group of chart settings "Other
settings".
Line label
overlapping mode
Line length
Indent
Select the mode for presenting labels in the line chart.
Set the length of a line for labels.
Set the size of the indent for labels to calculate the position of labels in the line
chart.
DIVI.STATDB.PJD.LLC.ENG.V02.03.2015.07.02
Latvijas Banka Statistical Database. User Manual
20
2.2.2.7. Settings for pie and area charts
If a pie or doughnut chart is selected, the below settings are available in the group of chart settings
"Other settings".
Label position in
pie and doughnut
charts
Labels with name
Value as percent
Exploded points
Select the position of labels in the pie and doughnut charts.
Indicate whether to display labels with names in pie and doughnut charts.
Indicate whether to display values as a percentage in pie and doughnut charts.
Select values to be emphasized in pie and doughnut charts.
2.2.2.8. Inner radius of a doughnut chart
If a doughnut chart is selected, the below settings are available in the group of chart settings "Other
settings".
Hole radius
Select the inner radius of a doughnut chart.
DIVI.STATDB.PJD.LLC.ENG.V02.03.2015.07.02
Latvijas Banka Statistical Database. User Manual
21
USEFUL TIPS
To zoom into or out of the image of the information located in the data area, we suggest
using the combination of the Ctrl key and the mouse wheel.
To increase the letters and digits on the screen, click the Ctrl key and, holding it down, scroll the
wheel upwards.
To decrease the size of letters and digits, e.g., to display more information on the screen, click the
Ctrl key and, holding it down, scroll the wheel downwards.
We suggest scrolling the wheel slowly, waiting for the internet explorer to adjust.
DIVI.STATDB.PJD.LLC.ENG.V02.03.2015.07.02