1
D4.3 Prototype Software (Documentation)
TELL ME project – GA: 278723
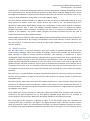
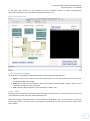
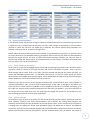
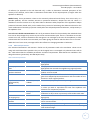
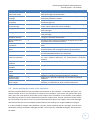
The model simulates two types of behaviour: vaccination (V) and other protective nonvaccination
behaviours such as hand washing (NV). The four ‘Behaviour’ sliders denote the efficacy and threshold for
each of these behaviours. Efficacy is the reduction in epidemic infectivity if the behaviour is adopted, so a
higher value will result in a smaller epidemic (if people adopt the behaviour). The threshold is the
behaviour score which must be reached for a person to adopt the behaviour, so a higher value will make it
harder to reach the required score and lead to a smaller number of people adopting the behaviour.
The ‘Epidemiology’ sliders denote the R0 (basic reproductive ratio), latency period, and recovery period of
the disease being simulated.
The ‘Localisation’ sliders give the values for proportion of the population using social media, in the ‘target
group’, against vaccination, and the number of healthcare workers per 1000 population.
At the bottom of the screen, there is also a slider for ‘num-messages’ which controls the maximum number
of messages available in the Communications Plan tab (see section 2.4.2).
2.2.5 Orientation to the TELL ME simulation outputs
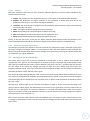
The main outputs of the simulation are all found in the interface tab. This section explains what outputs
there are, with more detail on interpreting results in section 2.5.
2.2.5.1 World
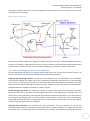
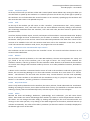
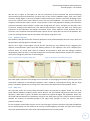
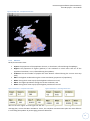
The most immediately eye-catching output is the map view. Once you have clicked ‘setup’ this shows the
country that is currently being simulated. The view is split into small squares called patches. The map view
is updated during the simulation and, at any point of simulated time, will provide broad information about
the epidemic status of regions and protective behaviour adopted by simulated people within each region.
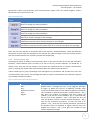
The colour of patches indicates epidemic progress (red for ‘active’, blue for ‘not yet reached’ and green for
‘post epidemic’). When blue or green, the darker the shade of the patch the higher the population. When
red, the shade indicates whether the prevalence is high or low. Each patch also has a small circle which
indicates whether the majority of simulated people in the region have (purple) or have not (white) adopted
protective behaviour.
2.2.5.2 Plots
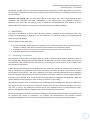
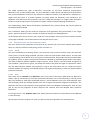
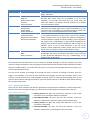
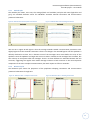
Next, there are the ‘Attitude’ and ‘Behaviour’ plots (on the left of the screen underneath the ‘Behaviour’
sliders), split by Vaccination (V) and other protective behaviours such as hand washing or wearing masks
(NV). The attitude for each agent (simulated person) is scored between 0 and 1 for each behaviour type,
and the display shows the average attitude score over all agents towards the categories of behaviour. The
behaviour plot shows the proportion of the population who have adopted each behaviour, with an extra
plot (in red) for the proportion of those ‘Exposed’ and ‘Infected’ that have adopted other protective
behaviours.
To the right, there is the ‘Epidemic Rates’ plot, which shows the incidence and prevalence of the epidemic
in each time step.
All three plots show the outputs over time, you will see new points plotted as the simulation runs.
12