1
D4.3 Prototype Software (Documentation)
TELL ME project – GA: 278723
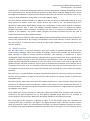
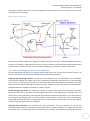
2.5.1 Attitude plot
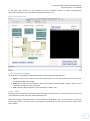
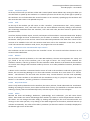
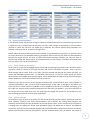
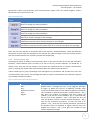
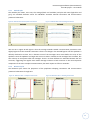
The attitude plot shows, over time, the average (black and mid-blue) and plus and minus (light-blue and
grey) one standard deviation values for individuals’ attitudes towards vaccination and nonvaccination
protective behaviours.
Figure 8: Attitude Plot with Complete Comms Plan
Figure 9: Attitude Plot with One Msg Comms Plan
We can see in Figure 8 and Figure 9 that the average attitude toward nonvaccination protection starts
slightly higher than that towards vaccination. There is no change in the attitude figures until the epidemic is
officially declared at tick 54. This is because none of the messages were active before the start of the
epidemic. Once the epidemic has begun we see an increase in attitude as the messages have an effect, but
then a decay as time passes after the messages. There is no clear difference in attitudes between the two
scenarios, suggesting the regular mass media message common to both scenarios is the most important
component of the more complex communications plan with respect to effect on attitudes.
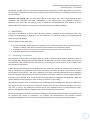
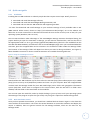
2.5.2 Behaviour plot
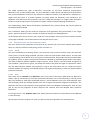
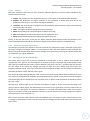
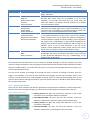
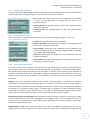
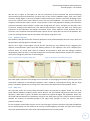
The behaviour plot shows the proportion of the population adopting vaccination and nonvaccination
protective behaviours through time.
Figure 11: Behaviour Plot – Complete Comms Plan
Figure 10: Behaviour Plot – One Msg Comms Plan
24