1
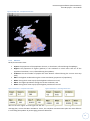
D4.3 Prototype Software (Documentation) TELL ME project – GA: 278723 Run the simulation: Click the ‘setup’ button: This transfers all the settings on the sliders to the internal model variables and creates a small number of infections to start the epidemic. You will see the correct country map displayed, with a small light red patch to show where the epidemic is starting. Click the ‘go’ button. Initially let the simulation run at normal speed, but move the slider to the fastest speed so that the run does not take too long to complete. The simulation will take a few minutes to run (and may take a long time to really get going or even die out if you have too low a value for R0). The simulation will stop when the epidemic has finished, or when you click ‘go’ again. Observe the simulation. For this scenario, there is no communication so attitude should not change. This is visible in the attitude plot, with all lines horizontal because nothing changes over time. Furthermore, the thresholds for behaviour adoption have been set to their maximum and agents can’t adopt protective behaviour. This is visible in the behaviour plot, with everything at 0 for the entire run. However, there should be a curve in the epidemic plot, as the epidemic spreads and infects more people but then dies out when most people have become immune. Record the details of the epidemic for comparison with later scenarios: ‘Impact’, ‘Max I’ and its associated ‘When’, and ‘Max P’ and its associated ‘When’. 2.3.2 Scenario 2 – Ineffective The purpose of the second scenario is to show adoption of behaviour, returning the threshold parameters to their default values. The behaviour is ineffective, so it should not influence the epidemic. We also take advantage of the capacity to repeat a simulation (by using the same random seed or sequence of random numbers) with different parameters. Setup instructions: Uncheck the ‘randomise?’ checkbox (on the ‘Advanced parameters’ screen). This makes the simulation use whichever random seed is currently in place (which was randomly generated during the first scenario). Set ‘protectV-threshold’ to 0.3 Set ‘protectNV-threshold’ to 0.25 Set ‘efficacy-vaccine’ to 0. Set ‘efficacy-protect’ to 0. Run the simulation (that is, press the ‘setup’ button and then the ‘go’ button). While the model is running, observe the world view (map). You should see the white dots becoming purple, particularly near the most active epidemic areas. The purple dot indicates that at least half of the agents on the patch have adopted protective behaviour. Observe the attitude plot – it should again be horizontal lines as there is no communication to change people’s attitudes. On the other hand, the behaviour plot should show some patterns. Most likely the blue line increases sharply at the beginning of the simulation, settles for a while then increases during the active epidemic and decreases again as the epidemic dies away. This is people reacting to the epidemic by adopting nonvaccination protective behaviour. The black line (probably) increases much later and then stays at the higher level. This maintenance is because people who seek vaccination are vaccinated and 15