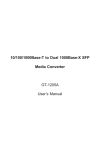
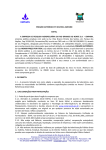
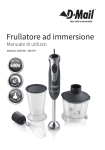
1
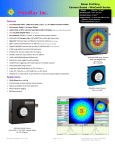
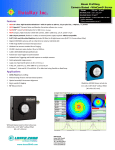
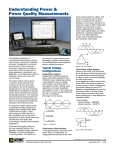
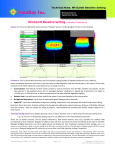
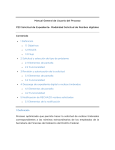
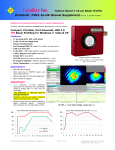
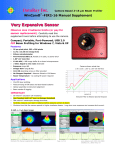
DataR Ray In nc. Camera Based 2-16 µm B Beam Pro ofiler WinC CamD™-FIR216 Man nual Su upplem ment for V Ver. 7.1H21L orr higher O Observe max x irradiance limits (or pay for sensor re eplacement). Carefully read this supplement twice beforre attempting to t use the cam mera. Compactt, Portable, Port-P Powered, USB 2.0 0 F FIR Beam m Profilin ng for Windows 7,, Vista & XP Features 35 µm pix xel pitch, 392 x 296 pixels 13.72 x 10 0.36 mm Ima age Area Silicon microbolometer r Port Powe ered USB 2.0;; flexible 3 m cable, c no powe er brick 1.85” (47 mm) thin 12-bit ADC C, 4 MB image e buffer & on-board microproc cessor >100:1 Signal to rms noise n attainable Imager Ga ain range 4.75 5:1 10:1 ND absorbing screw w-on filter prov vided for 2 -4 µm µ No Choppe er Required - Measure Pulsed or CW Beam ms Room Tem mperature - no cooling/TE power required A Applicatio ons MIR/FIR las ser profiling Field servic cing of MIR/FIR R lasers and las ser-based systtems Optical assembly & instru ument alignment Beam wand der & logging Camera shown actual size 2.40 x 2.65 x 1..85” (x 2.05” witth ND filter) [61 x 67 x 47 mm] IMPORTA ANT 50 mW/cm2 saturation CW W irradiance. Few hundred mW/cm2 burn-in dam mage threshold. TBA mW/cm m2 catastrophic damage thre eshold. Carefully measure m your beam b irradiance e before expos sing camera to beam. Minimize time that the ca amera spends in i higher irradiiance beams. Long-term ove er-exposure ca an increase darrk current. WinCamD-FIR2 2-16 Relative Spe ectral Response 5 mW, λ ≈ 3 µm µ laser imag ge W WinCam-FIR_Ma anual_supplemen nt_1205a.docx Page 1 of 1 13 www.da ataray.com (203 3) 210-5065 DataRa ay Inc., Bella Vistta, CA Observe e max irradi ance limits.. Irradianc ce limits & Damag ge Thresh holds 1) We cannot c stress s strongly enough that th he maximum irradiance liimits mustt be observ ved. To faciilitate this we provide two graphss of APPR ROXIMATE maximum sig gnal versus beam b diametter at 3 & 10 µm. Howe ever, in ourr experience,, many IR lasers beam ms have ‘pe aky’ profilles, rather than t smooth h Gaussian or top hat pixels. Even n on comm mercial laserrs we have seen major profile va riations of p peak inten nsity and pos sition with tim me - see burrnt sensor im mage on prev vious page! V Very Expen nsive Sensor Obsserve max irraadiance llimits (or payy for sensor replacem ment) age threshold d limits are ap pproximatelly 20 times h higher than th he Saturation n power limits. Dama W WinCamD D-FIR Se etup and Use. Softw ware Ver. 7. 1H21L or higher * Warnin ng * Using any type of uncooled u far-IR camera is different from using a sta andard CCD c camera: 2) Like older plasma a televisions,, but more so, s far-IR bo olometric cam meras are su usceptible to ‘burn-in’ dama age because the damage e threshold is close to tthe saturatio on threshold and to the working irradiance range. Slight damag ge may anne eal out, but m major burn-in n is irreparablle. aRay keeps supplies a post p calibrattion referen nce image w with every -F FIR camera,, so that Data any subsequentt damage is simply dete ermined. r of offse et and exposure adjustme ent is lower th han CCD’s, so more care must be take en. 3) The range 4) Neve er start a measuremen m nt unless yo ou know tha at peak bea am irradianc ce is <25 m mW/cm2. i.e. you y have a ca alibrated pow wer meter and an estimatte of your bea am diameterr. See Appendix A for some availab ble meters and filters. 5) Cum mulative expo osure at high h irradiance May M cause bu urn-in and permanently d damage the detector. We recommend r the t use of a shutter or so ome way to block the be eam quickly a and easily in order to limit burn-in/shad ding due to cumulative ex xposure. Even n below saturation, at low w Imager ga ain try to W WinCam-FIR_Ma anual_supplemen nt_1205a.docx Page 2 of 1 13 www.da ataray.com (203 3) 210-5065 DataRa ay Inc., Bella Vistta, CA keep the time per session that the laser is on the imager to minutes, not ten’s of minutes. We may relax this restriction in the future. 6) With the FIR2-16 camera, DataRay includes an ND2.0 (@546 nm) filter which is usefully ND ~1.0 at wavelengths below 4 µm. See Appendix A for the transmission curve. Safety 7) Sensor Safety. IMPORTANT: You are totally responsible for the safety of the expensive sensor. If you damage the sensor the replacement charge is many $1,000’s. See Irradiance limits & Damage Thresholds and Operation, below. 8) Laser Safety. You are totally responsible for your own laser safety and for the safety of your colleagues. Wear appropriate goggles. Use appropriate screens and door interlocks. Installation 9) Before attaching the camera you must install the software, open and close it, in order to install the driver. Install the camera on the computer per the main User Manual. Leave the cap on the camera. Start the software. Study the WinCamD manual & this supplement. Calibration 10) The first time on any particular computer, a Camera not calibrated warning will appear. If a xxxx-yyyyyyyy.uFir_2_cal file is provided on the CD, use Windows Explorer to copy it to the c:\DataRayData directory. Go to Step 16). If no .cal file is provided, go to Step 14). 11) Place the screw-on cap on the camera (or lens cap on optional lens). Go for a break. Return in five minutes after the camera has warmed up. [Required before camera calibration. Recommended before normal use or if the camera temperature has changed.] In the Setup pull-down menu choose Calibrate current Camera to open the FIR2 Calibrate Dialog. 12) Verify that the Serial #, VSK and VFID data in the calibrate dialog corresponds to the label on the top of the camera. If not, enter the camera SN number from the label on top in the dialog. See label example right. Enter the camera bias voltages VSK and VFID from the label on top of the camera. Press Start Calibration. SN: 3552-65808010 VSK = 4.976 VFID = 3.001 ** WARNING ** Start below 0.5 mW/mm2 13) The calibration routine records the image offset maps and optimum VSK value at gain steps of 0.25. After several seconds you will see the line Success: restart calibration? appear in the dialog. Press Save and exit. [The calibration file is saved in c:\DataRayData directory as, this example, 3011-37422055.uFir_2_cal. If you move the camera to another PC, either redo the calibration or also move the file.] WinCam-FIR_Manual_supplement_1205a.docx Page 3 of 13 www.dataray.com (203) 210-5065 DataRay Inc., Bella Vista, CA Reference Image & Damage 14) After calibration, we take a Reference file at Imager Gain = 1, and pressing Ctrl N to show the uncorrected offset map. IMPORTANT: In the event of any claims regarding imager damage, this is the definitive reference image. A copy is kept with DataRay, and a copy accompanies the shipment. Note that there can be both dead and bright pixels, inevitable with microbolometers. See the Defective Pixels Specification in Appendix B. How to identify Damage. Below is an example of a sensor with white burn areas, plus a faint green left to right trail due to overexposure. Such user damage is not covered by warranty and is not repairable. If your beam is small, you can continue to use the good areas of the sensor, but using VSK in Auto mode may be difficult. The good news is that the sensors (if still available) are replaceable at the factory. You do not need to purchase a new camera. WinCam-FIR_Manual_supplement_1205a.docx Page 4 of 13 www.dataray.com (203) 210-5065 DataRay Inc., Bella Vista, CA Operation 15) Press Go. You will see a screen similar to that shown right. The default settings put the Imager Gain to 4.75 and the VSK offset Auto adjust to off. 16) Measure your estimated beam irradiance. It must be <25 mW/cm2. Unscrew the plastic dustcap. 17) First time, carefully & iteratively ‘walk’ the beam in from the side while adjusting the Imager Gain. As the beam saturates, stop walking the beam onto the sensor. As ADC Peak % approaches or exceeds 100%, the screen values will turn Orange as a warning. As the beam saturates first use the middle slider to reduce the Imager Gain. WinCam-FIR_Manual_supplement_1205a.docx Page 5 of 13 www.dataray.com (203) 210-5065 DataRay Inc., Bella Vista, CA 18) Histogram: By default this is not visible, and may confuse more than it helps. This shows the 0 to 100 % distribution of ADC pixel levels in the current screen. These levels are used by the VSK in Auto mode to fine adjust the VSK. To see the histogram, right–click on the 2D image and select Show ADC Histogram (live only). 19) VSK Auto baseline adjust: By default this is now off. When on, the control algorithm uses the lower region of the histogram distribution range to refine the baseline set during calibration in order. Now considered normally unnecessary. [Right-click on the words VSK offset bar enable it, the box right.] 20) Signal level too high? If the Imager Gain is >1 use the middle slider to reduce the Imager Gain. If the Imager Gain is fully to the left and you are still saturated, immediately block the beam and remeasure and reduce the irradiance. See Appendix A for samplers and attenuators. 21) The Integration slider has no effect on performance/sensitivity. A sensor limitation. 22) Signal level too low? Increase Imager Gain at the expense of signal to noise ratio. Alternatively, particularly on scene images, (but not normally recommended on beam images), with the FIR auto base adjust mode disabled, adjust the VSK slider to a level which suits you. 23) Readout in mm? Want to read beam diameter in mm rather than µm. Go to Setup and choose Numeric Display Modes ... . Select XXX.Y mm. 24) Smooth the Beam or See Detail? In the Filter pull-down menu select an Area filter. Area display filters improve visible SNR at the expense of resolution. E.g. the 3x3 pixels filter will improve SNR by a factor of ~3, but increases the effective pixel size from 35 x 35 µm to 105 x 105 µm. This is still ~50 resolution elements across a 5 mm beam. Want mainly to smooth the beam? Use Area filter # ≥ (Beam diameter in mm) x 2 Want to see detail in the beam? Use Area filter # ≤ (Beam diameter in mm) / 2 Want to compromise? Use Area filter # ≈ (Beam diameter in mm) 25) When you have set Imager Gain, irradiance and the options above appropriately you will arrive at something like this: 26) Optionally, in the Average pull-down menu set, e.g., Average 20. WinCam-FIR_Manual_supplement_1205a.docx Page 6 of 13 www.dataray.com (203) 210-5065 DataRay Inc., Bella Vista, CA 27) Background Subtraction is implemented as described in the main User Manual. Remember that after blocking the beam you must allow the software to count back up to the chosen Average # before turning the beam back on again. 28) Optionally, press the normalize button on the toolbar to get this [This can only be done before saving the file; it cannot be done on a previously saved file.]: 29) Press Stop, , and block the beam to reduce the possibility of burn-in. 30) Go File, Save, Save current data as wcf. 31) See or suspect a problem? Send both files to [email protected]. Follow up with a call to 303543-8235. WinCam-FIR_Manual_supplement_1205a.docx Page 7 of 13 www.dataray.com (203) 210-5065 DataRay Inc., Bella Vista, CA Powerful Beam Analysis Software Beam Wander on a drifting Laser Up to 8192 samples at a User Set interval. Mean, RMS and Max. deviation. Replay Fast or Slow. Export to Excel, Paint, Bitmap or Clipboard. With user overrides. Auto-Inclusion Region on an Elliptical Beam Automatically isolates the appropriate analysis region. With user overrides. Standard Linear Profile with Gaussian Fit. Logarithmic Profile The same profile with Averaging & Log 40 dB display reveals structure in the wings of the beam at levels below 1%. WinCam-FIR_Manual_supplement_1205a.docx Page 8 of 13 www.dataray.com (203) 210-5065 DataRay Inc., Bella Vista, CA DataRay Innovation - The company that brought you the first Windows-based CCD beam profiler, the first thin camera for confined spaces, the first software slider exposure and electronic auto-shutter, the first standard window-free CCD for no fringing, the first auto-orientation on the ellipse & the first USB 2.0 beam profiling camera has done it again … Compact, Room Temperature, Port Powered WinCamD-FIR cameras. Features: Digital serial link for EMI immunity XY profiles and centroids Linear and logarithmic displays Gaussian and Top Hat least squares fits Ellipse Angle, Major, Minor, Mean Diameters Background capture and subtraction Image & Intensity Zoom Linear and area filters Image Averaging, 1 to continuous PC Or Mac-Intel Operation WinCamD-FIR Specifications: [Preliminary specifications- subject to change without notice] Wavelength Ranges ~2-16 µm . Interface USB 2.0 for laptops & desktops. 3 m standard thin cable, 5 m option. Certification RoHS, WEEE, CE Measurable Sources CW beams. Pulsed sources: free-running, not triggerable; average pulses over the ≈ 20 ms exposure period or with frame averaging. Mean irradiance limits still apply. Measured Beam Powers See Graph above. Manual Beam Attenuation: See Appendix A. Measurement Accuracy 5 m processing resolution for interpolated diameters. Absolute accuracy is beam profile dependent – ~35 m accuracy is frequently achievable. Centroid accuracy is also beam dependent. It can be as good as ±20 m since it is arithmetically derived from all pixels above the centroid clip level. Measured & Displayed Profile Parameters Beam Diameter: Diameter at two user set Clip levels Gaussian & Second Moment beam diameters Equivalent diameter above a user defined Clip level Equivalent Slit and Knife Edge diameters Beam Fit: Gaussian & Top Hat profile fit & % fit Equivalent Slit profile Ellipticity: Major, Minor & Mean diameters. Auto-orientation of axes. Centroid Position: Relative and absolute Intensity Weighted Centroid and Geometric Center Beam Wander Display and Statistics Smoothing Filter: Triangular running average up to 10% FWHM Displayed Profiles 2-D & 3-D plots 10, 16, 256 or max. colors or gray. Contoured display at 10 and 16 color. X-Y Profiles, 2D, 3D Plots. Zoom to x10 Displayed Plots Processing Options Image & profile averaging, 1, 5, 10, 20, Continuous Background Capture and Subtraction *.job files save all WinCamD custom settings for particular test configurations Pass/Fail display Averaging Log data On-screen, in selectable Pass/Fail colors. Ideal for QA & Production. Beam dimension running average up to 50 samples Up to 4096 samples. Centroid Min., Max., Mean, Standard Deviation. Relative Power Measurement Rolling histogram based on user’s initial input. Units of mW, µJ, dBm, % or user choice (relative to a reference measurement input) Fluence, within user defined area Fluence Weights: Camera Head 320 gm (11 oz) Optional f/1, 35 mm lens 320 gm (11 oz) Minimum PC Requirements: 2 GHz Intel dual-core or higher running Windows 7/Vista/XP (32 or 64 bit); 2 GB RAM; 1 GB Hard Drive space; 1024 x 768 monitor, USB 2.0 hi-power (500 mA) port. WinCam-FIR_Manual_supplement_1205a.docx Page 9 of 13 www.dataray.com (203) 210-5065 DataRay Inc., Bella Vista, CA ORDERING INFORMATION Limited 1 Year Warranty (excludes sensor damage) Free Software Upgrades 30 Day Sale or Return Evaluation PO A Complete System comprises: Camera, Software, 3 m (10 ft) Cable, User Manual. Part Number component descriptions WinCamD-FIR2-16 Complete working USB 2.0 camera system includes manual, cables, and software. 2-16 µm Other DataRay Profiling USB 2.0 Instruments, 190 nm to 3.5 µm options. BeamMap2 Real Time M-Squared Multi-plane profiler 0.1 micron resolution on CW lasers Centroid, Alignment, Divergence, M2, Visible and Telecom wavelengths. Optional Dual Detectors 190-1800 nm Beam’R2 0.1micron resolution on CW lasers, 0.5 micron to 4 mm beam dimensions Optional Dual Detectors 190-1800 nm BeamScope-P8 100 microns to 23 mm, M2 accessory, ISO 11146 Standard Linear scanning slit ,CW or Pulsed (PRR >5 kHz) lasers, up to 23 x 45 mm scanned area WinCamD-UCD12 14 Bit ADC with high resolution ½” CCD array 4.65 x 4.65 µm pixels WinCamD-UCD15 14 Bit ADC with high resolution CCD array 4.4 x 4.4 µm pixels WinCamD-UCD23 14 Bit ADC with high resolution 2/3” CCD array 6.45 x 6.45 µm pixels DualCamD Measure real-time divergence and ratios with cameras at 90 BladeCam 0.65” thin CMOS camera with ½” CMOS sensor, 5.2 x 5.2 µm pixels ̊ WinCamD-FIR2-16 Outline & Mounting – Shown actual size WinCam-FIR_Manual_supplement_1205a.docx Page 10 of 13 www.dataray.com (203) 210-5065 DataRay Inc., Bella Vista, CA A Appendix x A – a non--exhaustive list of related products. 1) Power Meters M for µW to W a. Gentec-eo G XL LP12-1S-H2--DO with P-L Link USB inte erface, µW to o 3 W. 2) Sampler rs & Attenua ators a a. C-mountt Absorbing Glass ND filters f mountted at 3°, orig ginally speciffied for 350 tto 1150 nm silicon CCD systems. The gra aph below sho ows the calcu ulated IR tran nsmission forr these filters s. Stocked by y DataRay as: ND1.0, ND2.0 N and ND3.0. N An ND D2.0 is provi ded with eve ery system. Damage threshold: 1 W/cm2. b. C-mount IR metallic c ND filters on a Ge sub bstrate, flat over 2-14 µm m, ND 0.3, 0.5, 1.0, 2.0, 3.0. Stocked by DataRay as: a FIR-ND0 0.3, FIR-ND0 0.5, FIR-ND D1.0, FIR-ND D2.0 & FIR-N ND3.0. Damage e threshold: TBA W/cm2. May give frin nging due to plane paralle el internal refflection. c. ZnSe FIR Wire Grid Polarizer. Extinction E Rattio: 100 at 3 µm, 300 at 10.6 µm. Ava ailable in a C-mount rotating mount as: FI IR-WGP-RM e threshold: 50 W/cm2; Damage d. 2J/cm2 @ 10 00ns Wedge beamsplitte b ers. ZnSe 3° and CaF2 unm mounted 25 m mm diameterr wedge beam msplitters. Sttocked by DataR Ray as: FIR-W W-CAF2-3, FIR-W-ZnSe F e-3 for unmo ounted wedge es, or FIR-MW W-CAF2-3, FIRMW-ZnS Se-3 for a mo ounted wedge e. Damage e threshold: 50 W/cm2; 5 J/cm2 at 10 0.6 µm, 100 nns, 1 Hz Reflectivity R at a 45° p% s% Ratio Av. % % Ratio CaF2 6.85 0.47 14..6:1 3.66 0.032 3 3115:1 ZnSe 27.9 9.8 3.5 58:1 17.1 2.18 4 46:1 W WinCam-FIR_Ma anual_supplemen nt_1205a.docx o orthogonal wedges Two Page 11 of 13 www.da ataray.com (203 3) 210-5065 DataRa ay Inc., Bella Vistta, CA Beam separation 's' mm 8.0 CaF2 Primary & secondary reflected beam separation vs. distance from wedge 's' mm = 2.46 + (0.0301 x z) 7.0 6.0 5.0 4.0 3.0 2.0 1.0 0.0 0 20 40 60 80 100 'z' mm from wedge center Beam separation 's' mm 8.0 ZnSe Primary & secondary reflected beam separation vs. distance from wedge 's' mm = 1.27 + (0.0582 x z) 7.0 6.0 5.0 4.0 3.0 2.0 1.0 0.0 0 20 40 60 80 100 'z' mm from wedge center e. AR coated wedges. 0.5% reflectivity. TBA. f. C-mount OD 0.30 & 0.76 25.4 mm diameter CaF2 10.6 µm attenuators. Stocked by DataRay as: FIR-CaF2-0D0.3, FIR-CaF2-0D0.76 2 Damage threshold: 50 W/cm2; 5 J/cm WinCam-FIR_Manual_supplement_1205a.docx at 10.6 µm, 100 ns, 1 Hz Page 12 of 13 www.dataray.com (203) 210-5065 DataRay Inc., Bella Vista, CA A Appendix x B – Defecctive Pixels Specificatio on A pixel is considered c non n-operating if: It’s responsivity y is <0.8 x or >1.2 x average e responsivity It’s NETD is 1.5 5 x the average e NETD in the STR A single non-operating pixel p is a non-o operating pixel with no adjace ent non-operatting pixel. Area: THE E FPA is divided into three arreas which hav ve the same op ptical axis: Area A A: the cen ntral zone of 80 0 x 60 pixels Area A B: the cen ntral zone of 32 20 x 240 (i.e. excluding e Area a A) of the arra ay. Area A C: the rec ctangular annulus between th he full 392 x 29 96 image are a and Area B. Cluster: A cluster is deffined as a grou up of at least tw wo non-operatting pixels adja acent by side o or corner. Clustters are defined by y their size in terms t of non-operating pixels s. Non-oper rating row: A row is conside ered non-opera ating if more th han 50% of the pixels in this s row are no-op perating. Non-oper rating column n: A column is considered no on-operating if more than 50% % of the pixels s in this column are nooperating.. Operabiliity specificatiion: The follow wing specification is valid only y within areas A & B: Clustters Areas A & B Max ximum cluster size: 9 non-op perating pixels. Rows s & Columns Area A 0 no on-operating rrow or column Area B ≤1 non-operating n rows & ≤1 non n-operating collumns Areas A & B ≥99 9% Operability W WinCam-FIR_Ma anual_supplemen nt_1205a.docx Page 13 of 13 www.da ataray.com (203 3) 210-5065 DataRa ay Inc., Bella Vistta, CA