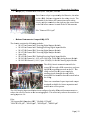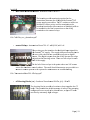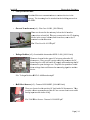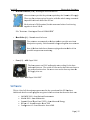
1
z Photovoltaic Simulator User Manual InteGrid Lab – EECL, CSU 2012 InteGrid Photovoltaic Simulator This manual was originally written by Peter Vieira from the 2009-2010 Senior Design Team. Major revisions were made by Andrew Geck from the 2011-2012 Senior Design Team. This manual is intended to provide an overview of the hardware and software associated with the Photovoltaic (PV) Simulator so that anyone unfamiliar with the system can have some understanding of how the system operates, of how to run a simulation, and of how to collect and observe the output data from the system. For more detailed information on the underlying theory and system operation, please consult the following files which should be located on the lab PC in the "C:\PV Simulator Documentation\Reports" folder: PVEmulatorDocumentation.pdf -- "Adapting King’s Model to Design a DC Bus Photovoltaic Emulator." Written by Joel Nelson. Summer 2009. InteGridFinalReport2010.pdf -- "Final Report: InteGrid ~ Photovoltaic Simulator" Written by B. Ambon, M. Fox, J. Taylor, P. Vieira. May 2010. PVFallReport2011.pdf -- "Grid Tied Photovoltaic Simulator" Written by Andrew Geck. Fall 2011. PVSpringReport2012.pdf -- "Grid Tied Photovoltaic Simulator: Final Report" Written by Andrew Geck. Spring 2012. Page | 2 InteGrid Photovoltaic Simulator Table of Contents Safety………………………………………………………………………………………………………………… Lock Out/Tag Outs…………………………………………………………………………………… Circuit Breaker Safety………………………………………………………………………………. Built-in Safety………………………………………………………………………………………….. Warnings………………………………………………………………………………………………… 4 4 4 4 5 System Description…………………………………………………………………………………………… Introduction…………………………………………………………………………………………….. Hardware Components…………………………………………………………………………….. Software………………………………………………………………………………………………….. 6 6 6 15 Setup & Configuration………………………………………………………………………………….…… Bitronics Power Meter Setup ……………………………………………………………………. Summit® DC Power Supply Setup ……………………………………………………………... LabVIEW Program Setup …………………………………………………………………………. Adding Inverters & PV Modules……………………………………………………... Adding Irradiance Data………………………………………………………………….. 16 16 18 19 19 19 Operation………………………………………………………………………………………………………….. Test Preparation/Turn-On Procedure………………………………………………………. PV Simulator LabVIEW GUI ……………………………………………………………………… PV Simulator Walkthrough ………………………………………………………………………. System Turn-Off Procedure ……………………………………………………………………... 20 20 21 23 24 Output Data……………………………………………………………………………………………………… 25 LabVIEW…………………………………………………………………………………………………. 25 Bitronics Interface …………………………………………………………………………………… 26 Appendix: Suggested Maintenance …………………………………………………………………………… 28 Information on Electrical Schematics & Matlab codes………………………………... 28 Glossary/Abbreviations…………………………………………………………………………… 28 Page | 3 InteGrid Photovoltaic Simulator Safety The Photovoltaic Simulator is equipped with safety in all parts of the system in order to protect the system and its operators. It was built according to National Electrical Code. The photovoltaic systems section of the code, Article 690, was used to ensure adequate installation and safety measures. Lock Out/Tag Outs • • The 480VAC PV Simulator 80A Fused Disconnect fed from CBPB01 must be locked out/tagged out whenever the PV Simulator is not in use. Lockout/tagout procedures must be adhered to on all outgoing circuit breakers connected to the power grid or InteGrid when not in use. Circuit Breaker Safety • • All circuit breaker and disconnect doors must be bolted or latched shut at all times to prevent possible harm to operators or the system. The 24V battery supply from the InteGrid switchgear must be connected at all times for the safety circuit to work. Built-in Safety Any of the following actions will activate the safety circuit, triggering the shunt trips on all of the Eaton/Cutler-Hammer AC breakers, thereby powering down and isolating the system from the 480V and 240V sources: • • • • • • Pressing the Emergency-Stop button on the outside of the control cabinet. Pressing the Emergency-Stop button on the LabVIEW front panel while the program is running. Removing the DC or AC connection covers on the Summit® DC Power Supply while power to the 24V circuit is connected. If the 120V power to the PV Simulator control cabinet fails. If the 480V AC input voltage to the Summit® DC Power Supply drops below 354VAC. If the Bitronics power meter is configured to activate a digital output when the AC current exceeds a given limit, it will activate a relay. This limit should be set to the maximum AC output current for the inverter being operated to improve the safety of operation. Page | 4 InteGrid Photovoltaic Simulator Warnings • The fan switch to the Preload Resistor Bank must always be on while DC output power is on in order to cool the resistors and prevent overheating. • Each Preload Resistor Bank (5 resistors each) contains an inline fuse which is located in their respective DC disconnect box. These fuses must be open and the DC disconnect must be open to conduct maintenance on the Preload Resistor Banks. • Check for latent voltage before conducting maintenance on any device. The DC supply and inverters contain large capacitors which store charge and could be dangerous for several minutes after power is removed. • A common ground runs from the 480V Main Distribution Panel to the entire PV Simulator, including the frame, boxes, cabinet, conduit and devices. Do not touch any hot lines to any of these pieces of metal or a short will occur. • Do not operate the output of the Summit® DC Power Supply above 600V nominal. This would exceed the voltage rating of the cables used for the DC connections and the inverter maximum input limits. • The Bitronics power meter must be configured to trip its output relay to the shunt trip circuit at the max AC output current of the inverter under test to ensure maximum safety of operation. • The Bitronics power meter measures non-scaled voltage, therefore caution must be taken when around the voltage terminals on the meter or possible injury could result. These terminals will have 480V or 240V on them when live. Page | 5 InteGrid Photovoltaic Simulator System Description Introduction The Photovoltaic Simulator is an advanced PV emulator that allows for the testing of solar generation systems with the use of simulated photovoltaic arrays and physical grid-tied solar inverters in the range of 2 – 25kW. It is adaptable to inverters with 208VAC, 240VAC, and 480VAC output connections. The controls for the simulator use measured current and voltage signals, and a prerecorded solar irradiance profile to operate the DC power supply. The response of the DC supply is made to behave as though it were a PV array. Each half of the power supply can be connected to a different inverter and can operate independently at up to 25kW. The inverters have their own stand-alone control systems to monitor their DC inputs, convert the DC to AC power, and push the AC power onto the grid connections. The LabVIEW front panel user interface provides a means to setup, initiate, and observe a simulation. The behavior of the DC supply is recorded by the program and saved to a file at the end of the test. The system is also equipped with a Bitronics AC power meter to observe and record the AC output properties of the system. The information from this device can be used to observe the effect of the AC output from the PV Simulator on the rest of the grid to which it is attached. Hardware Components This section describes all the major components of the PV Simulator. An image and some basic information are provided for reference. For more detailed information on the components, manuals and spec sheets can be found on the control PC in the "C:\PV Simulator Documentation\Manuals & Datasheets" folder. If files are available for a component, the file name(s) will be given in the description. Page | 6 InteGrid d Photovo oltaic Simulaator Summit® DC C Power Su upply – 25k kW x 25kW Dual Outp put (S S/N 673426 6, M/N 3152700-204B B) Conveerts incomin ng 480V 3Φ Φ AC into tw wo independ dent DC sourrces. It is controlled by y the N.I. cD DAQ through h the user cables. A serrial cable is conneected to the control PC for setup an nd configurration purpo oses only. In nput: 480V 3Φ AC. Output: O Miniimums: 100 0W, 50V, 1A A Maxiimums: 250 000W (each h side), 1000 0V, 83.3A Filles: "Su ummit 25k kW x 25kW W 57000015 5-00B Usser Manual.P PDF" ummit VFP User Manual.PDF" "Su Front of unit. Back of unit. V rated Fused DC Diisconnects (x2) – 600V Locatted between n the DC outtput of the ssupply and tthe connecttions to the invertters. Exterior of Disconnects. Intterior of Dissconnects. Pagge | 7 Photovo InteGrid d oltaic Simulaator PVPowered P d 30kW Sola ar Inverterr – 480V (S S/N PV0300 0BACF0310 0100299) Conveerts incomin ng DC sourcce to 480V 3 3Φ AC. The inverter haas a Maximum M Po ower Point Tracking T ro outine to moodulate its o own output.. It also automatically matches the t phase an nd frequenccy of what itt sees at thee AC onnection point. p Actuaal output po ower is limitted by the 2 25kW availaable from co th he DC supplly. Inputt: Maximum ms: 600V DC C, 100A DC MPPT Range: 295-50 00V DC Outpu ut: Nominall: 480V 3Φ A AC Maximum ms: 30kW, 4 41A Frequenccy Range: 59.3-60.5 Hzz Power Faactor: 0.95 to 1.0 0kW-480V Inverter I Dattasheet.PDF F" File: "PVP-30 Note: N A printted manual for the PVP P30kW is avvailable with h the physiccal documentatiion. PVPowered P d PVP3500 and a PVP28 800-XV Sola ar Inverterrs - 240V (S S/N PV3524 40041007322 and 280XV111005 5714) Conveert incoming DC sourcee to 240V 1Φ Φ AC. Each inverter haas a Maximum M Po ower Point Tracking T ro outine to moodulate its o own output.. It also automatically matches the t phase an nd frequenccy of what itt sees at thee AC onnection point. p Only the PVP350 00 is conneccted at this ttime. co PVP3500: (on ( left) Inpu ut: Maximu ms: 500V D DC, 26A DC 450V DC MPPT Raange: 200-4 Outp put: Nominaal: 240V 1Φ Φ AC Maximu ums: 3.5kW W, 19A Freque ncy Range: 59.3-60.5 H Hz PVP2800-X XV: (on rightt) Inpu ut: Maximu ms: 500V D DC, 15A DC MPPT Raange: 170-4 450V DC put: Nominaal: 240V 1Φ Φ AC Outp Maximu ums: 2.8kW W, 14A Freque ncy Range: 59.3-60.5 H Hz Files: "PVP2 2800 & 3500 Datasheet.pdf" "PVP2 2800 & 3500 Inverter User U Manuaal.pdf" Note: N A printted manual for the PVP P3500 is alsoo available with the ph hysical documentatiion. Pagge | 8 InteGrid d Photovo oltaic Simulaator AC A Circuit Breakers B – 208V 2 3φ Main (no ot AC 3φ, 240VAC 3φ, 480VAC 3φ A, 480VAC 3 sh hown) – Cutler-Hammeer breakers with shuntt trip accesssory. Th hese are thee points of connection to InteGrid d and th he main AC supply for the simulaator. The sshunt triip modules are activatted by the safety circu uit to iso olate these ssources from the simullator. Files: "C Circuit Breakker-Cutler-H Hammer I.L L.29C101G.P PDF" "Shunt Trip-C Cutler-Hamm mer I.L.29C C140F.PDF" Control C PC The T computeer controls the t simulato or through communicaation with th he N.I. cDAQ Q loccated in the main contrrol cabinet. It also has a serial com mmunication n cab ble connectted to the DC C supply forr configurattion and settup of the lim mits on n the DC sup pply. Insstalled Softw ware: Windo ows 7, Matlaab 2009, Lab bVIEW 2009 9. Fille: "JPK Desktop Compu uter.pdf" 24V Battery y Supply This T is the so ource for the 24V safety y and controol circuits fo or the simulator. he third secction of SG3B in These breakers are llocated in th the basem ment. Theyy are supplieed from a baattery attached to a charger located behind SG3 3B. The sou urce runs fro om this breaaker to the p point of conn nection insiide the main n control cabinet of th he simulatorr. Pagge | 9 InteGrid d Main M Contro ol Cabinet Photovo oltaic Simulaator 1 8 9 2 3 4 6 7 Exterior of Main Con ntrol Cabinet 10 5 11 12 2 13 Interioor of Main C Control Cabiinet. The main n control caabinet contaains the follo owing comp ponents: 1. Stack light indicaator: Illumin nates green when main n AC breakerr is open, an nd red when n main m AC breaaker is closeed. 2. Emergency Stop Push Button: Push in to t activate ssafety circuiit. Pull out tto deactivatte and allow brreakers to be reset. Breeakers havee to be resett manually. 3. Bitron nics meter and a connecttion terminaals: see detaails below. 4. Fuse blocks b for liine voltage feeds f to Bitronics: open n to removee voltage on n Bitronics. 5. 15V DC D power su upply: see details below w. 6. 120V supply to PV P Simulator and receptacle. ply (UPS): see details b below. 7. Unintterruptable Power Supp 8. Conneections to saafety circuitt, relays, and Hall sensoors: see detaails below. 9. National Instrum ments Compaact DAQ (cD DAQ): see deetails below w. 10. Userr Cable Breaakout Board ds: see detaiils below. 11. 24V Supply con nnection and d control relays: see deetails below.. S block terminalls: see detaiils below. 12. CT Shorting 13. Link ksys Etherneet Hub: see details belo ow. The T user sho ould not neeed to open th he control ccabinet und der normal ccircumstancces. Only opeen for mainttenance, con nfiguration during setu up, or troubleshooting. Follow saffety precautions and cheeck for poteentially hazaardous voltaages before doing any w work insidee the cabinet. Pagee | 10 InteGrid d Photovo oltaic Simulaator Bitronics B M572 Powerr Meter The T Bitronics has a digittal input con nnection froom the cDA AQ, a digital output to a saffety circuit rrelay, and an n Ethernet ccable conneected to the t hub in th he cabinet. All the volttage and CT T terrminals on tthe meter haave short ju umpers instaalled to the t terminaals located b below the m meter. If anyy con nnections neeed to be ch hanged, it iss suggested this be done at thee terminals b below ratheer than on th he meeter itself. T The 120V feeed to the meter is also pro otected by a small 3A fu use. Thee meter is p presently co onfigured to o measure th he 480 0V and 240V V AC output. onics M572 Datasheet.p pdf" Files: "Bitro "Bitro onics M57x User Manuaal.pdf" +/+ 15V Pow wer Supply – Phoenix 2938743 2 This su upply takes a 120V AC input i and crreates a possitive and negative 15V V DC supply y for the Hall effect senssors on the DC bus. File: "15V Power P Supplly - Phoenixx 2938743.p pdf" Uninterrupt U tible Power Supply The T UPS is a single phasse 120V backup and surrge protectiion system. The contro ol PC, monitoor, and the Linksys hub b are pluggeed into the batttery backu up ports on tthe UPS. Th he supply fo or the cDAQ is plu ugged into a surge supp pression po ort. This waay, loss of the 120V sourcce removes p power to th he cDAQ, wh hich triggers thee safety circcuit. Pagee | 11 Photovo InteGrid d oltaic Simulaator Relays R (x2) – Siemens 3TX7110-5J 3 JC03 1NO/1 1NC, 24V co oil One of th hese relays is operated d by the Bitrronics, the o other by the cD DAQ. Both aare triggerss for the safeety circuit. The terminalls to the leftt are the con nnections to o the safety circuit, and a the term minals to thee right are tthe connections to the Haall effect sen nsors locateed in the DC C disconnectts. File: "Sieemens3TX7 71.pdf" National N Insstruments CompactDA AQ-9178 The chasssis contains the follow wing modulees: NI 9472 8-Channel 8 24 2 V Sourcin ng Digital Ou utput Modu ule 8 24 2 V Sinkingg/Sourcing Digital Inpu ut Module NI 9422 8-Channel NI 9472 8-Channel 8 24 2 V Sourcin ng Digital Ou utput Modu ule 8 24 2 V Sourcin ng Digital Ou utput Modu ule NI 9472 8-Channel ot Spare Slo 8 24 2 V Sinkingg/Sourcing Digital Inpu ut Module NI 9422 8-Channel 4 +/-10 + V, up to 100 kS/ss, 16-Bit DA AC Analog Output Modu ule NI 9263 4-Channel, 3 +/-10 V, up p to 250 kS//s, 16-Bit AD DC Analog Input Modulle NI 9205 32-Channel ommunicatees with the The cDA Q chassis co control P PC through a USB connection, and runs LabVIEW W programss executed o on the PC. T The cDAQ co ntrols the D DC power su upply by sending signals thro ough the useer cables d to the breaakout board ds located beelow attached the cDAQ Q. nput and outtput There arre a numberr of spare in terminalls available for future eexpansion an nd modificaation of the ssystem. nput modulee has been configured c tto take diffeerential meaasurements to The 9205 Analog In he incomingg signals. T his effectiveely reduces the number of reduce the effects of noise on th nputs to 16.. analog in Files: "NI CompactDAQ Daatasheet.PD DF", "NIcDA AQ-9178.pdff " 2-9474.pdf",, "NI9422.p pdf", "NI926 63.pdf", "NII9205.pdf" "NI9472 Pagee | 12 InteGrid d Photovo oltaic Simulaator User U Cable Breakout B Boards– B WINFORD: BR RK37M Rev C The boaards provid de termination points fo or the connecttions betweeen the cDA AQ and the SSummit® DC C power supply s userr cables. Th he 37 conductor cables are shielded to reduce noise, and the terminaals on the breakou ut boards allso allow seections of sh hielded cablle to be instaalled to the final connecctions on th he cDAQ terminaals or the coontrol relays. File: "brk k37m_rev_cc_datasheet..pdf" Control C Rela ays - Autom mation Direcct 781-1C : 1 1NO/1NC, 2 24V coil Th hese relays are the inteerface for th he digital inp put signals for th he Summit® DC supply. The supplyy interpretss certain pin ns in th he user cable shorted too a common n return pin n as digital in nputs. The digital d outpu uts from thee cDAQ operate the relays to o perform th he shorting action. Theere are six relays for eaach haalf of the supply. o the left of these relayys is the poin nt where th he 24V sourcce To enters the sim mulator con ntrol cabineet. The small fused discconnects are provided as a means m to rem move powerr to the systtem for main ntenance orr troublesho ooting. File: "Au utomationDiirect781-1C Crelays.pdf" CT C Shorting g Blocks (x3 3) – Southerrn Transform mer SB-6TC C, (x1) - SB-4 4TC The shorting blocks provid de a location n to short to ogether the CT lead ds. This prov vides an ad ded measurre of safety if the meterring conffiguration ever needs too be altered d later, as op pen CT lead ds can develop exttremely high h voltages. Pagee | 13 InteGrid d Linksys Ethernet Hub oltaic Simulaator Photovo Providees Ethernet communicaations to vaarious devices in the system. The incom ming feed is attached to o the buildin ng network at CL. the EEC Current C Tra ansformerss (x4) – Flexx-Core AL-10 01, (100:5 R Ratio) Theese are located in the w wireway below the AC b breaker con nnections to o InteGrid. T They are connected to the CT shorrting blocks in the control cabin net, and from there, run n to the CT term minals on th he Bitronicss. Filee: "Flex-Core AL-101 CT Ts.pdf" Voltage V Diviiders (x2) – Sustainablle Automatiion HPVD-3-480, (100:1 Ratio) Thesse are locateed in the up pper DC wireway abovee the DC disco onnects. Th hey provide a point to d directly meaasure the DC bus voltage v for each half off the DC sup pply withoutt having thee DC disco onnects opeen during a test. They ccan also pro ovide a scaleed dow wn voltage th hat could bee used as an n analog sign nal to anoth her device. HPVD-3-480 0 Datasheett.pdf" File: "Voltagee Dividers-H 15, (100A:4 Hall H Effect Sensors S (x2) – Tamura L03S100D1 4V Ratio) These are located on th he positive DC lead in tthe DC disco onnects. Th hey d measu urement of tthe DC bus current thaat is sent to tthe provide a direct analog inpu ut module in n the cDAQ. File: "Hall Effect E Senso or - Tamura L03100D15 5.pdf" Pagee | 14 InteGrid d Preload P Ressistors (x10 0) - Huntinggton Electricc HPK600 Photovo oltaic Simulaator These T resisto ors provide the preload d required b by the Summ mit® DC sup pply. There T are fiv ve resistors wired in seeries, with th he whole strring conneccted in n parallel with w each hallf of the DC bus. Each E resistorr is 50 Ω no ominal, but tthe measureed value of each string to ogether is about 240 Ω. Ω File: "Resisto ors - Huntin ngton Electric HPK600.P PDF" Heat H Sinks (x6) ( – Manu ufactured in-house The resisstors are mo ounted to th he heat sink ks to provide extra heatt dissipation capacity y. Each heatt sink is largge enough fo or two resisstors. One of th he heat sink ks has a therrmocouple p probe attach hed to it forr possible temperaturre monitorin ng. E 9906 Fans (x3) – EBM-Papst The fan ns operate on 120V and d supply exttra cooling ffor the heat sinks an nd resistorss. The switcch to turn on n the fans iss located next to the prelload resisto or box. Be su ure to turn on the fans any time th he DC supp ply is in usee. File: "Fans - EBM E Papst 9906.PDF" Softw ware This is a list of all the majorr programs used u in the operation o of the PV Sim mulator. Additional details on each program p aree given in laater sectionss that descrribe their usse. LabVIIEW 2009 - from National Instrum ments Matlaab 2009 - fro om Mathwo orks Summ mit Virtual Front F Panel (VFP) - from m Advanced d Energy BiView w v2 - from m Bitronics: Areva A T&D Config gurator r3 - from Bitro onics: Arevaa T&D Pagee | 15 InteGrid d Photovo oltaic Simulaator Settup & Co onfigguration n The PV P Simulato or can be mo odified for a number off different cconfiguratio ons of hardw ware, meteering, or datta recordingg. If any chaanges are deesired, conssult the follo owing sectio ons to en nsure safe an nd proper operation. o Bitron nics Pow wer Me eter Settup The Bitronics B M572 power meter can be b configureed to measu ure various values on th he AC ou utput of thee inverters depending d on o specific ttriggers. Th he meter's voltage and C CT conn nections sho ould be wireed accordingg to the AC b bus and invverters in usse, and the softw ware should d be configurred to recorrd the approopriate desiired measurrements. Th he meteer is capablee of both waaveform and d disturbancce recordings. For optiimum safetyy, the digital d outpu ut of the Bitrronics shou uld be configgured to acttivate if the AC current exceeeds the maxximum ratin ng of the inv verter beingg tested. To ru un the configuration prrocess, the spare s comm munication ccable from th he Bitronicss to the open o serial port p on the back b of the control PC n needs to bee plugged in. 1. Go G to Start>A All Program ms>Bitronicss>70 Series> >Configurattor r3, or seelect the sh hortcut icon n on the dessktop. 2. Select “M57X X” under thee Load Data a From secti on. 3. Select “M57X X” under thee Write Data a To section n. 4. Set the conneection to the correct CO OM (serial) port (4). 5. Select “Edit Configurat C ion”. Pagee | 16 InteGrid d Photovo oltaic Simulaator Oncee the Configu urator open ns, the follow wing screen n appears w with the various confiiguration op ptions on th he left. Undeer Instrument Transforrmer>Ratioss: Set CT ratios to 100:5 for the Fleex-Core AL--101 curren nt transform mers. Set VT raatios to 1:1 for f direct co onnections w without PTss. Undeer Triggers and a Alarms>Recorder Triggers: Set Waveeform and Disturbance D Recorders tto trigger on a Digital IInput 1 “higgh” signal. This is the input from th he cDAQ diggital output. w curren nt is greaterr than inverrter max. Th his is Set Digitaal Output 1 to go high when the triggeer for the Biitronics relaay in the saffety circuit. Set Waveeform and Disturbance D Recorders tto trigger on any otherr desired values. Undeer Recording Modes>Diisturbance or Record ding Modes> >Waveform m: Select desired valuess to record in i each casee. Once all desired chaanges have been b made, hit the "OK K" button an nd allow thee unit to reb boot for the changes to taake effect. Referr to the Bitrronics M57x User Manua al for more detailed insstructions o on setting up p CT’s, triggering, data collecttion, and meeasurementt recording.. Pagee | 17 InteGrid d Photovo oltaic Simulaator Summ mit® DC C Powerr Supplyy Setup p The AEHost A Bus Virtual Fro ont Panel software is ussed to set cu urrent, voltaage, and pow wer limits, regulation n mode, and d control mo ode on the SSummit® po ower supplyy. These lim mits mustt be set to en nsure safe operating o co onditions. T The 480V AC C feed to the power sup pply mustt be on in orrder to comm municate with w it. Referr to the Turrn-On Proceedure on pagge 20 fo or instructio ons on turning the power supply on. 1. Go G to Start>A All Program ms>Windows Virtual PC C>Windows XP Mode. 2. Go G to the Virrtual PC’s Start>All Proggrams>Advvanced Enerrgy>Summitt VFP, or sellect th he shortcut icon on thee virtual desktop. 3. Iff any changees are madee, click on th he “Settings”” button in tthe Toolbarr and confirm the p power supply’s “Unitt Address”, “Bau ud Rate”, and d “Com mmunication n Mode”. Refer to o pagee 4-26 of thee Summit® DC Power Supp ply User Manual and p page 3-9 of the Summit Virtual nt Panel Useer Fron Manual for detaails. 4 4. In the Communication n Conttrols section n, set the cconnection tto Locaal and to thee correect COM (seerial) port.. This shoulld be COM1 of the virtual macchine. U Contro ol Mode clicck on VFP to o use serial communicaation. 5. Under 6. Click the “con nnect” butto on, , to co onnect to th he power su upply. U the Co onfiguration n tab on the right, selecct Program SSource. Set tthe VFP to 7. Under In nternal, the Local/paneel to Externa al, and the U User/Analogg to Externa al 8. Under U the Co onfiguration n tab, select PVI Limits aand set the power, volttage and currrent limits for eacch half of the supply. These T numbers depend on the Pow wer Supply aand nverters in use. u Add exxtra power to t the poweer limit to acccount for th he power in dissipated accross the prre-load resisstors, or thee supply maay limit the p power availlable to o the inverter. 9. Now N change the Controll Mode back k to User/An nalog. Thiss places the supply back k under the control of thee cDAQ. 10. Click C the “co onnect” buttton, , agaain, to discon nnect from the power ssupply. 11. Exit E the VFP P program, then t log outt of and closse the Virtuaal XP windo ow. Pagee | 18 InteGrid Photovoltaic Simulator LabVIEW Program Setup There are two LabVIEW programs written to operate the DC supply. Both are available through shortcuts located on the control PC desktop. The first is a manual operator, which can be used to operate the supply as a constant source. It requires manual operation of all digital and analog controls, and should only be used for special testing by someone familiar with the system. It uses no information about the inverters or potentially simulated PV modules. More detailed information will not be provided here. The primary program is the PV Simulator LabVIEW program. It uses inverter and module data, predetermined irradiance values, and measured current and voltage values during the simulation to automatically operate the DC supply as though it were a real PV array. Listings of inverters, modules, and irradiance profiles already exist in the program, but additional information can be added if desired. Adding Inverters & PV Modules Inverter and PV module models that do not exist in the lists in the simulator program can be added manually. This is done by adding a row for each in the “Inverter&Module Data.xls” excel file. Navigate to C:\PV Simulator\Inverter&Module Data.xls and open the file. Click on the Inverter Data sheet and add a row containing all known data for the new inverter, entering data under the appropriate column header. Click on the Module Data sheet and add a row containing all known data for the new module, entering data under the appropriate column header. Save the file. When the LabVIEW PV Simulator program is reopened the lists will be updated. Adding Irradiance Data Three options exist to simulate irradiance data from days not already saved on the control PC: Go to http://www.nrel.gov/midc/research/ and download desired irradiance csv files to C:\PV Simulator\Irradiance Data\RecordedProfiles. The files being used on the system are from the "SRRL 10Hz Direct Normal" section of the site. Use the IRModifierGUI.m Matlab program, located at C:\PV Simulator\Irradiance Data\ . This program can modify existing recorded profiles, generate new simple profiles, select a shortened portion of a profile, or join two profiles together. It saves its output to the ModifiedIR.txt file. It is recommended this file be copied into the TestingProfiles folder and then renamed with an appropriate description. Manually place a generated file in the RecordedProfiles or TestingProfiles folders. Be sure to conform to the format of the other existing text files. When the simulator program is reopened these new data files will be selectable. Page | 19 InteGrid Photovoltaic Simulator Operation Test Preparation/Turn-On Procedure The following procedure must be performed every time a simulation is conducted: 1. Determine whether or not either of the Preload Resistor Banks will be used. If so, open the appropriate DC disconnect box and close the 10A fuse located below the positive terminal on the output side of the disconnect. Also, be sure to turn on the fan switch located to the side of the upper DC wireway. If the Preload Resistors will not be used, open the fuses and close the DC disconnect doors. 2. Open PV Simulator.vi located at C:\PV Simulator\PV Simulator.vi, or select the shortcut icon on the control PC desktop. Special Note: Since the simulator program uses some embedded Matlab scripts, the control PC must have access through the Ethernet hub to the CSU campus network in order to retrieve a license from the servers before the PV Simulator.vi will load. 3. Make sure all circuit breakers and disconnects are open. 4. The Load Bank or InteGrid AC grid connection should be turned on by an experienced operator in the lab following the InteGrid lock-out/tag-out procedures. 5. Hit the "Run Program" arrow icon in the LabVIEW PV Simulator program. This will activate the safety circuit relay so that the AC breakers in the system can be closed. 6. Remove lockouts and close the AC breakers and disconnects to the devices being attached to InteGrid for the simulation. 7. Close the DC disconnects and switches to the devices being used in the simulation. 8. Turn on the Summit® Power Supply by closing the main circuit breaker, then removing the lockout from, and then closing, the main fused disconnect. Once the DC supply has powered up, the status indicators on the LabVIEW interface should show that they are ready, and a simulation can begin. From this point, follow the directions for running a simulation with the PV Simulator program. See the descriptions of the interface and walkthrough in the following sections. Page | 20 InteGrid d Photovo oltaic Simulaator PV Simulato or LabVIIEW GU UI The following f in nstructions refer r to the PV Simulattor.vi file. A sample imaage is displaayed and all a the major parts are described, d then t a descrriptive walk k through fo or a simulatiion will be b given in the t next secction. 5 1 9 8 6 2 10 3 1 11 7 4 m the Summ mit® DC supp ply, except ffor 1. Sttatus Indicaators: Thesee are digital inputs from th he "Simulatiion Completed" indicattors which llight up wheen either sid de finishes a teest. 2. The T Record Bitronics button b activ vates the diggital output to trigger a recording on th he Bitronicss. It is recom mmended to o hold this iin for a few seconds so the meter h has a ch hance to reg gister the in nput. To rettrieve thesee recordingss, please seee the "Bitron nics" part of the "O Output Dataa" section off this manuaal. The otheer two butto ons can starrt or sttop both sid des of simulator at oncee. 3. The T Program m Stop and Emergency y Stop butttons will end d the simulaation. Presssing th he Emergen ncy Stop buttton will also activate th he safety cirrcuit. m the E-Stop p button on the main 4. Sttatus Indicaators: Thesee are digital inputs from caabinet, and from the AC C breakers. They indicate whether various co ontacts are o open or closed. Pagee | 21 InteGrid Photovoltaic Simulator 5. A & B Tab control and Status window: Selecting one tab or the other will move between the windows for Side A or Side B of the simulator. Each side can run a simulation independently, and has identical controls and indicators. The large text "A" or "B" towards the top middle of the screen provides a quick reference of which tab is currently open. A tab does not have to remain open for the simulation to continue to run. The Status window provides the user some quick instructions during the start of a test, and an indicator of the state of the simulation during and after a test. 6. The upper four buttons are for starting, stopping, or resetting the sides of the simulator program independently. The 250 Ohm Preload Resistor? button changes DC current calculations for the measurements so that only the current flowing to the inverter is used in the voltage setpoint calculations. The default setting for this button is to be enabled. 7. Inverters and Modules: The two lists on the right show all the inverters and modules loaded into the simulator. The default inverter for Side A is the PVP3500, and the default inverter for Side B is the PVP30kW. After selections are made, the three boxes on the right display some of the important properties associated with the inverters, modules, and calculated array that will be used for the simulation. 8. Irradiance Graph: Clicking the folder icon will open a dialog box to select an irradiance profile text file to use for the simulation. The selected irradiance will be displayed on the graph after the file loads. As the simulation runs, a green tracking dot will display where the simulator is in the irradiance profile. The Start and End Time boxes can be used to select a shortened section of the loaded profile. The Elapsed Time box displays how much real time has passed since a simulation was started, which should be useful for determining if the five minute warm-up period of the inverters has elapsed. 9. PV Array I-V Curve: This graph displays the I-V curve for the calculated array at the present level of irradiance. The red dot shows the Maximum Power Point, and the green tracking dot displays the actual measured voltage and current. 10. Data Recording: These buttons control if, and at what rate, data from the simulator is collected. The default rate is 10 Hz. Selecting "Fast Data" changes the rate to 1 kHz. This information is only the DC behavior related to the supply. 11. Display of values: This graph displays some of the measured and calculated values for the simulator as it runs. The legend below the graph explains which values are displayed. Page | 22 InteGrid d Photovo oltaic Simulaator PV Simulato or Walktthrough h In the following desscription, so ome physicaal steps will only need tto be perforrmed once, r step ps can be folllowed for eeither Side A or Side B o of the simullator. while the program related 1. Perform step ps 1 through h 4 of the Tu urn-On proccedure. (Seee page 20.) 2. Click on the LabVIEW L “R Run” button n, , to starrt the progrram. (Step 5 of Turn-On n) ps 6 through h 8 of the Tu urn On proccedure. (See page 20.) 3. Perform step 4. Click on the small s folderr icon and seelect an Irraadiance Filee from the popup. This populates the Irradiancee Graph. E Time forr the test (in n units hh:m mm:ss). 5. Enter a Startt Time and End verter to bee tested usin ng the Inverrter list. 6. Select the inv V module to be emulateed using thee Modules lisst. 7. Select the PV V the caalculated arrray size is co orrect, i.e. ccurrent and voltage leveels are with hin 8. Verify atttached inverter limits. 9. Press the 250 Ohm Pre eload Resisttor? button n so that it iss illuminateed if the preload reesistor bank k will be useed. The deffault settingg for this buttton is to bee enabled. T This ch hanges DC current c calcculations forr the measu urements so o that only th he current fllowing to th he inverter is used in th he voltage seetpoint calcculations. 10. Press the Continue buttton to calcu ulate the I-V curves thatt will be displayed th hroughout the t test. This should taake at least a few secon nds to compllete, depend ding on the length h of the simu ulation bein ng calculateed. 11. When W ready,, Press the Run R button to begin thee test and sttart measurring/record ding data. You can press the Run button n independeently on eacch tab (A or B) or the Sttart A&B A button if both sides are ready to begin. 12. The T test shou uld begin an nd the DC su upply will sttart produccing output. Each of thee in nverters hass a five minu ute "warm-up" period w where it checks for adeequate in ncoming volltage beforee it begins to o produce A AC output. T test will run until it has gone th hrough the lloaded irrad diance profi file, at which h 13. The point the "sim mulation co ompleted" in ndicator shoould illumin nate, and DC C output fro om th he supply sh hould ceasee. Pagee | 23 InteGrid Photovoltaic Simulator 14. To end the simulation and download all the simulator data to the “MEASURED DATA” folder, press the Program Stop Output and Save Data button. The files will be generated and saved to the folder located at C:\PV Simulator\MEASURED DATA\Y-M-D HH:MM. A few of the buttons can be pressed at any time during a simulation: 1. Press the Record Bitronics button to record AC output data on the Bitronics meter. It is recommended to hold this in for a few seconds so the meter has a chance to register the input. Refer to the Setup & Configuration section to configure the triggered recording on a digital input on the Bitronics meter. 2. Press the Stop button or the Stop A&B button to turn the DC power supply output off. This pauses a simulation. The simulation can be resumed, but the inverters will go through another five-minute warm-up period. Enter the elapsed time into the "Reset Simulation Time" box while the Stop button is still latched in, release the Stop button, and then press the Run button to resume a simulation from the entered elapsed time. 3. Press the Emergency Stop button while a simulation is running to trip all the circuit breakers and isolate the system if an emergency situation develops. This completely stops a test, and no output data files are generated. 4. After manually stopping a simulation, press the Restart Program button to start over from the very beginning of a simulation. 5. Press the Record Fast Data button to record data at 1kHz instead of 10Hz. System Turn-Off Procedure The following procedure should be performed when turning the system off after the test is complete and the LabVIEW program has stopped: 1. Ensure DC supply output is off, and allow the unit some time to run the cooling fans. 2. Open the 480V main circuit breaker and disconnect to the DC supply and lockout/tagout the disconnect. 3. Open the AC circuit breaker connections to InteGrid that were in use and lockout/tagout. 4. Open the remaining AC disconnects or DC disconnects that were closed for the test. 5. Open the main tie breaker to InteGrid in the switchgear downstairs, and open the main InteGrid breaker & lockout/tagout upstairs. 6. Turn off the preload resistor cooling fan switch. Page | 24 InteGrid d Photovo oltaic Simulaator Outputt Datta Therre are two primary sourrces of outp put data for analysis of the PV Simu ulator systeem. The DC D characteeristics are recorded r by y the LabVIE EW PV Simu ulator progrram and outtput as texxt files at th he end of a test. The AC C characteri stics are reccorded by th he Bitronicss meteer system an nd must be retrieved r seeparately. T The data fro om the Bitro onics can alsso be observed or colllected whilee a simulatio on is runnin ng. LabVIIEW When W the Prrogram Stop Output and Save Da ata button is pressed, aall the test d data will be saved in a folder entitled with the date d and tim me of the tesst. Up to fou ur separate files are creatted, two forr each side of o the DC supply, depen nding on if o one or both sides of thee simulato or were run. One file co ontains the properties oof the simullation, such h as the datee and time of the t test, the inverter, PV V modules, and irradian nce file used d, ect. The o other contaains the numerical data collected c fro om the simu ulator. In n order to analyze this data, a Matllab file, “AnalyzeDataD Draft7.m”, m must be copied from thee C:\PV Simu ulator\MAT TLAB folder and a saved tto the folderr containingg the LabVIE EW data. On nce copied, open o and ru un the .m-fille. This load ds the vario ous numericcal data into oa Matlab data d structure and, if th he file is not empty, creaates the folllowing plotss. Each plot is versus v the simulation s time t in secoonds. The to op plot show ws DC curreent (IOUT). The second d graph is off DC voltagee (VOUT in b blue, V SET PT in red), w where VOUT is d V SET PT i s the comm manded voltaage to the the actuaal output off the power supply, and power su upply. The third t graph is of DC pow wer (Pmp in n blue, POU UT in red), w where Pmp iis the max pow wer point off the solar arrray being simulated, s aand POUT iss the actual power outp put to the inverter. A seeparate figu ure, not show wn here, alsso shows th he absolute d deviation off the Pagee | 25 InteGrid d Photovo oltaic Simulaator DC voltaage relative to t the voltage set pointt, and the DC C power rellative to thee max power point of the simulatted PV array y. The data structures ccreated can n also be savved and de of manipulated as desiired. Theree are a total of 15 differrent variablees recorded d for each sid the simu ulator. Pleasse see the PVSpringRep P port2012.pd df -- "Grid T Tied Photovvoltaic Simulato or: Final Rep port", for more details on the data collected. Bitron nics Intterface The Bitronics B po ower meter measures the t AC bus ccontinuously, and has p provided softw ware to view w, collect, an nd download d this data. To access tthe Bitroniccs from the contrrol PC durin ng testing, consult the following f th he procedures below. 1. Go G to Start>P Programs>B Bitronics>BiiView v2, or select the sshortcut icon n from the desktop. 2. Select Cance el on the sub b-window th hat opens in nside the BiiView progrram. G to the Filee dropdown n menu in th he program.. 3. Go 4. Selecting Obsservation.ini will open a DNP3 con nnection and d load a screeen that displays the present values measurred by the B Bitronics. Th he scale facttors shown for th he CTs and VTs V are the DNP3 scalee factors onlly. Pagee | 26 InteGrid d Photovo oltaic Simulaator 5. Selectin ng FileDown nloading.inii will open aan FTP connectioon for fast downloadingg of the reccorded files located on the meter. It is suggessted thaat these filess be downlo oaded to thee C:\BitronicsReecordings fo older, or to tthe folder creeated by Lab bVIEW for tthe simulatiion being ru un. 6. Selecting Ma anualTriggerring.ini will open a Teln net connecttion that allo ows for man nual trriggering off recordings, outside of the operatiion of the simulator pro ogram. Once O the files have been n downloadeed, they can n be processsed as desirred. Please ssee th he Setup & Configuratio C on section to o configure the informaation record ded by the Bitronics B meeter. Pagee | 27 InteGrid Photovoltaic Simulator Appendix: Suggested Maintenance The filters on the front of the preload resistor box should be cleaned occasionally to ensure adequate air flow for cooling the resistors. The cooling fins of the heat sinks on top of the small inverters should also be cleaned occasionally. Information on Electrical Schematics & Matlab codes Please see the printed electrical schematics located in the pocket of the main control cabinet door. Current versions of the Matlab codes used in the simulator can be located on the control PC at C:\PV Simulator\MATLAB Glossary/Abbreviations AC …………… ADC ………… CBPB01 …… cDAQ ……….. CSU …………. csv …………… CT ………….… DAC …………. DC …………… DNP3 ………. EECL ……..… E-stop ……… FTP ………….. GUI …………... IR ……….…… I-V …………… kS/s ………… NC …………… N.I. …………... NO …………... PC …………… PTs …………. PV ……….…… SG3B ………... UPS ………….. VFP ………….. VTs ………….. Alternating Current Analog-to-Digital Converter Circuit Breaker Panel Board 01 Compact Data Acquisition Colorado State University comma separated value current transformer Digital-to-Analog Converter Direct Current Distributed Network Protocol Engines and Energy Conversion Lab Emergency Stop File Transfer Protocol Graphical User Interface Irradiance Current - Voltage kilo-samples per second Normally Closed National Instruments Normally Open Personal Computer Potential Transformers Photovoltaic Switch Gear 3B Uninterruptable Power Supply Virtual Front Panel Voltage Transformers Page | 28 InteGrid Photovoltaic Simulator User Notes: Use this area to write down any desired additional information: Page | 29