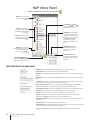
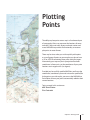
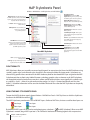
1
8 Microsoft Windows Mac OS User Guide Avenza MAPublisher 8 User Guide Copyright © 2000–2009 Avenza Systems Inc. All rights reserved. MAPublisher® 8 for Adobe® Illustrator® User Guide for Windows® and Macintosh®. Avenza®, MAPublisher® and When Map Quality Matters® are registered trademarks of Avenza Systems Inc., Adobe Illustrator, Adobe Acrobat and PostScript are trademarks of Adobe Systems Inc. or its subsidiaries and may be registered in certain jurisdictions. All other software product names and brands including trademarks or registered trademarks are the property of their respective owners. This manual and the software described in it are furnished under license and may be used or copied only in accordance with the terms of such license. The content of this manual is furnished for informational use only, is subject to change without notice and should not be construed as a commitment by Avenza Systems Inc. or its related companies or successors. Avenza Systems Inc. assumes no responsibility or liability for any errors, omissions or inaccuracies that may appear in this book. Except as permitted by such license, no part of this publication may be reproduced, stored in a retrieval system, or transmitted, in any form or by any means, electronic, mechanical, recording, or otherwise without prior written approval of Avenza Systems Inc. Avenza Systems Inc. 124 Merton Street, Suite 400 Toronto, Ontario, M4S 2Z2 Canada Tel: (+1) 416 487 5116 Toll Free (North America): 1 800 884 2555 Fax: (+1) 416 487 7213 Email: [email protected] Web: http://www.avenza.com Support Tel: (+1) 416 487 6442 Support email: [email protected] Data import/export and co-ordinate conversion powered by GeoTranslate and GeoCalc (c) 2009 Blue Marble Geographics Inc. All Rights Reserved. MAPublisher LabelPro™ powered by text placement engine from MapText Inc., Copyright (c) 2009 MapText, Inc. All Rights Reserved. Cover and Chapter Intro maps courtesy of: Carta Topografica Del Monte Calisio e Altipiano Argentario © Nature Dynamics snc, Rovereto, Italy • Geologic Map of Washington State © Washington State Dept. of Natural Resources, Olympia, WA, USA • Hawkesbury River © Australian Geographic, Terreay Hills, NSW, Australia • Fostering Transit Oriented Development in Boston © Boston Redevelopment Authority, Boston, MA, USA • Official Map of Louisiana 2000 © Louisiana Department of Transportation and Development, Baton Rouge, LA, USA • Wandkaart Apeldoorn © City of Apeldoorn, Apeldoorn, The Netherlands • Grand Canyon © Sky Terrain, Boulder, CO, USA • The World, Physical © XYZ Digital Map Co. Ltd, Glasgow and Edinburgh, Scotland • The Long Path - South-Central Catskills © New York - New Jersey Trail Conference, Mahwah, NJ, USA • Birmingham CityMap Paperback Atlas © XYZ Digital Map Co. Ltd, Glasgow and Edinburgh, Scotland • Riga Address Atlas © Jana Seta Map Publishers Ltd., Riga, Latvia • Southeast Zeeland Bike Map © ANWB, The Netherlands • Chugach State Park © Imus Geographics, Eugene, OR, USA • Greater Philadelphia Regional Bicycle Map © Steve Spindler Cartography, Jenkintown, PA, USA • Tasman Map ©Tasmanian Government Dept Primary Industries, Water and Environment, Hobart, Tasmania, Australia • Recreation and Historical Sites on Public Lands of Arizona © Arizona Office of Tourism, Phoenix, AZ, USA • A Mosaic of Space, Time and Order - The Portland, Oregon, Super Region © Metro Regional Services, Portland, OR, USA MAPublisher 8 User Guide for Adobe Illustrator, V 8.1 – May 2009 Printed in Canada © Avenza Systems Inc. 8 When Map Quality Matters User Guide Welcome Avenza welcomes you to map-making in the 21st century! Combined with Adobe Illustrator, MAPublisher has revolutionized the art of map-making by allowing spatial data files to be used to create maps inside a vector graphics program. MAPublisher allows all cartographic tasks to be performed where they should be done; in a powerful graphics environment. This manual assumes that the user is familiar with Adobe Illustrator and has at least a basic understanding of geographic information systems (GIS) terminology and concepts. Please refer to the Adobe Illustrator user guide for more information on using Adobe Illustrator. A glossary of GIS terms is included at the back of this manual. The User Guide explains the installation process and the many features of MAPublisher. All MAPublisher panels, filters and tools are thoroughly detailed together with the related concepts necessary to build map and perform fundamental cartographic and GIS tasks. As a complement to this guide, the MAPublisher software installer includes tutorial documents (MAPublisher 8 Tutorial Guide.pdf , MAPublisher 8 Quick Start Guide.pdf and MAPublisher 8 MAP LabelPro Tutorial Guide) and associated GIS datasets. We encourage all users to go through these guides to gain additional experience with MAPublisher tools and functions. MAPublisher and Adobe Illustrator together constitute an integrated cartographic design software system with state-of-the-art graphics tools and geographic functions. Contents Welcome Contents Introduction viii What’s New in MAPublisher 8 ix Chapter 1 13 Getting Started System Requirements . . . . . . . . . . . . . . . . . . . . . . . . . . . . . . . . . . . . . . . . . . . . . . . . . . . . . . . . Installation Instructions . . . . . . . . . . . . . . . . . . . . . . . . . . . . . . . . . . . . . . . . . . . . . . . . . . . . . . MAPublisher Compatibility Notes . . . . . . . . . . . . . . . . . . . . . . . . . . . . . . . . . . . . . . . . . . . . . MAPublisher License Management . . . . . . . . . . . . . . . . . . . . . . . . . . . . . . . . . . . . . . . . . . . The MAPublisher Tools . . . . . . . . . . . . . . . . . . . . . . . . . . . . . . . . . . . . . . . . . . . . . . . . . . . . . . . MAPublisher Toolbar . . . . . . . . . . . . . . . . . . . . . . . . . . . . . . . . . . . . . . . . . . . . . . . . . . . . . . . . . MAPublisher Preferences . . . . . . . . . . . . . . . . . . . . . . . . . . . . . . . . . . . . . . . . . . . . . . . . . . . . . . Preparing the Workspace . . . . . . . . . . . . . . . . . . . . . . . . . . . . . . . . . . . . . . . . . . . . . . . . . . . . . Chapter 2 Map Data File Formats 14 15 16 18 21 23 25 31 33 Import and Export Supported Data Formats . . . . . . . . . . . . . . . . . . . . . . . . . . . . . . . . . . . 34 Chapter 3 Importing Map Data 39 Simple Import . . . . . . . . . . . . . . . . . . . . . . . . . . . . . . . . . . . . . . . . . . . . . . . . . . . . . . . . . . . . . . . . 40 Advanced Import . . . . . . . . . . . . . . . . . . . . . . . . . . . . . . . . . . . . . . . . . . . . . . . . . . . . . . . . . . . . 45 Chapter 4 MAP Views and Georeferencing 49 Georeferencing . . . . . . . . . . . . . . . . . . . . . . . . . . . . . . . . . . . . . . . . . . . . . . . . . . . . . . . . . . . . . . MAP Views Panel . . . . . . . . . . . . . . . . . . . . . . . . . . . . . . . . . . . . . . . . . . . . . . . . . . . . . . . . . . . . . MAP View Editor . . . . . . . . . . . . . . . . . . . . . . . . . . . . . . . . . . . . . . . . . . . . . . . . . . . . . . . . . . . . . Import MAP View . . . . . . . . . . . . . . . . . . . . . . . . . . . . . . . . . . . . . . . . . . . . . . . . . . . . . . . . . . . . . Export . . . . . . . . . . . . . . . . . . . . . . . . . . . . . . . . . . . . . . . . . . . . . . . . . . . . . . . . . . . . . . . . . . . . . . . MAP Location Tool . . . . . . . . . . . . . . . . . . . . . . . . . . . . . . . . . . . . . . . . . . . . . . . . . . . . . . . . . . . Chapter 5 MAP Attributes 50 52 58 62 63 66 67 Attributes Foreword . . . . . . . . . . . . . . . . . . . . . . . . . . . . . . . . . . . . . . . . . . . . . . . . . . . . . . . . . . MAP Attributes Panel . . . . . . . . . . . . . . . . . . . . . . . . . . . . . . . . . . . . . . . . . . . . . . . . . . . . . . . . . Edit Schema . . . . . . . . . . . . . . . . . . . . . . . . . . . . . . . . . . . . . . . . . . . . . . . . . . . . . . . . . . . . . . . . . Edit Expression . . . . . . . . . . . . . . . . . . . . . . . . . . . . . . . . . . . . . . . . . . . . . . . . . . . . . . . . . . . . . . . Find & Replace Attributes . . . . . . . . . . . . . . . . . . . . . . . . . . . . . . . . . . . . . . . . . . . . . . . . . . . . . Apply Expression . . . . . . . . . . . . . . . . . . . . . . . . . . . . . . . . . . . . . . . . . . . . . . . . . . . . . . . . . . . . . Join Table . . . . . . . . . . . . . . . . . . . . . . . . . . . . . . . . . . . . . . . . . . . . . . . . . . . . . . . . . . . . . . . . . . . . Export Attributes . . . . . . . . . . . . . . . . . . . . . . . . . . . . . . . . . . . . . . . . . . . . . . . . . . . . . . . . . . . . . 68 71 73 75 79 80 81 83 Contents v Chapter 6 Plotting Points 85 MAP Point Plotter . . . . . . . . . . . . . . . . . . . . . . . . . . . . . . . . . . . . . . . . . . . . . . . . . . . . . . . . . . . . 86 Plot Centroids . . . . . . . . . . . . . . . . . . . . . . . . . . . . . . . . . . . . . . . . . . . . . . . . . . . . . . . . . . . . . . . . 89 Chapter 7 Drawing Tools 91 MAP Area Tools . . . . . . . . . . . . . . . . . . . . . . . . . . . . . . . . . . . . . . . . . . . . . . . . . . . . . . . . . . . . . . 92 MAP Vector Crop Tool . . . . . . . . . . . . . . . . . . . . . . . . . . . . . . . . . . . . . . . . . . . . . . . . . . . . . . . . 93 Chapter 8 Line Functions 95 Buffer Lines . . . . . . . . . . . . . . . . . . . . . . . . . . . . . . . . . . . . . . . . . . . . . . . . . . . . . . . . . . . . . . . . . . 96 Flip Lines . . . . . . . . . . . . . . . . . . . . . . . . . . . . . . . . . . . . . . . . . . . . . . . . . . . . . . . . . . . . . . . . . . . . 97 Join Lines . . . . . . . . . . . . . . . . . . . . . . . . . . . . . . . . . . . . . . . . . . . . . . . . . . . . . . . . . . . . . . . . . . . . 98 Join Points . . . . . . . . . . . . . . . . . . . . . . . . . . . . . . . . . . . . . . . . . . . . . . . . . . . . . . . . . . . . . . . . . . . 99 Simplify Lines . . . . . . . . . . . . . . . . . . . . . . . . . . . . . . . . . . . . . . . . . . . . . . . . . . . . . . . . . . . . . . . 101 Chapter 9 MAP Stylesheets 103 MAP Stylesheets Panel . . . . . . . . . . . . . . . . . . . . . . . . . . . . . . . . . . . . . . . . . . . . . . . . . . . . . . 104 MAP Stylesheet Editor . . . . . . . . . . . . . . . . . . . . . . . . . . . . . . . . . . . . . . . . . . . . . . . . . . . . . . . 107 Chapter 10 Labelling Functions 111 Labelling Tools . . . . . . . . . . . . . . . . . . . . . . . . . . . . . . . . . . . . . . . . . . . . . . . . . . . . . . . . . . . . . . 112 Feature Text Label . . . . . . . . . . . . . . . . . . . . . . . . . . . . . . . . . . . . . . . . . . . . . . . . . . . . . . . . . . . 113 MAP Tagger Tool . . . . . . . . . . . . . . . . . . . . . . . . . . . . . . . . . . . . . . . . . . . . . . . . . . . . . . . . . . . . 116 Chapter 11 Making Selections 119 MAP Selection Filters . . . . . . . . . . . . . . . . . . . . . . . . . . . . . . . . . . . . . . . . . . . . . . . . . . . . . . . . 120 MAP Selection Stats . . . . . . . . . . . . . . . . . . . . . . . . . . . . . . . . . . . . . . . . . . . . . . . . . . . . . . . . . 123 Chapter 12 Working With Images 125 Register Image . . . . . . . . . . . . . . . . . . . . . . . . . . . . . . . . . . . . . . . . . . . . . . . . . . . . . . . . . . . . . . 126 Export Image . . . . . . . . . . . . . . . . . . . . . . . . . . . . . . . . . . . . . . . . . . . . . . . . . . . . . . . . . . . . . . . 130 Chapter 13 Grids and Indexes 131 Grids and Graticules . . . . . . . . . . . . . . . . . . . . . . . . . . . . . . . . . . . . . . . . . . . . . . . . . . . . . . . . . 132 Make Index . . . . . . . . . . . . . . . . . . . . . . . . . . . . . . . . . . . . . . . . . . . . . . . . . . . . . . . . . . . . . . . . . 137 Chapter 14 Scale Bars and North Arrows 139 Scale Bar . . . . . . . . . . . . . . . . . . . . . . . . . . . . . . . . . . . . . . . . . . . . . . . . . . . . . . . . . . . . . . . . . . . . 140 Create North Arrow . . . . . . . . . . . . . . . . . . . . . . . . . . . . . . . . . . . . . . . . . . . . . . . . . . . . . . . . . 143 Chapter 15 MAP Web Author 145 MAP Web Author Panel . . . . . . . . . . . . . . . . . . . . . . . . . . . . . . . . . . . . . . . . . . . . . . . . . . . . . . 146 Web Tag Dialog . . . . . . . . . . . . . . . . . . . . . . . . . . . . . . . . . . . . . . . . . . . . . . . . . . . . . . . . . . . . . 149 vi Contents Export to Web . . . . . . . . . . . . . . . . . . . . . . . . . . . . . . . . . . . . . . . . . . . . . . . . . . . . . . . . . . . . . . . 154 Web Export Advanced Settings . . . . . . . . . . . . . . . . . . . . . . . . . . . . . . . . . . . . . . . . . . . . . . 159 MAP Web Author Workflow . . . . . . . . . . . . . . . . . . . . . . . . . . . . . . . . . . . . . . . . . . . . . . . . . . 163 Chapter 16 MAP GPS 165 MAP GPS Panel . . . . . . . . . . . . . . . . . . . . . . . . . . . . . . . . . . . . . . . . . . . . . . . . . . . . . . . . . . . . . . MAP GPS Panel Menu . . . . . . . . . . . . . . . . . . . . . . . . . . . . . . . . . . . . . . . . . . . . . . . . . . . . . . . MAP GPS Point Plot Settings . . . . . . . . . . . . . . . . . . . . . . . . . . . . . . . . . . . . . . . . . . . . . . . . . MAP GPS Autosave Settings . . . . . . . . . . . . . . . . . . . . . . . . . . . . . . . . . . . . . . . . . . . . . . . . . Edit User Attribute for Current Layer . . . . . . . . . . . . . . . . . . . . . . . . . . . . . . . . . . . . . . . . . Record Sentence Log . . . . . . . . . . . . . . . . . . . . . . . . . . . . . . . . . . . . . . . . . . . . . . . . . . . . . . . . Playback Sentence Log . . . . . . . . . . . . . . . . . . . . . . . . . . . . . . . . . . . . . . . . . . . . . . . . . . . . . . Chapter 17 MAP LabelPro™ 175 MAP LabelPro . . . . . . . . . . . . . . . . . . . . . . . . . . . . . . . . . . . . . . . . . . . . . . . . . . . . . . . . . . . . . . . MAP LabelPro Settings . . . . . . . . . . . . . . . . . . . . . . . . . . . . . . . . . . . . . . . . . . . . . . . . . . . . . . . MAP LabelPro Styles . . . . . . . . . . . . . . . . . . . . . . . . . . . . . . . . . . . . . . . . . . . . . . . . . . . . . . . . . MAP LabelPro Rules . . . . . . . . . . . . . . . . . . . . . . . . . . . . . . . . . . . . . . . . . . . . . . . . . . . . . . . . . . Label Verification . . . . . . . . . . . . . . . . . . . . . . . . . . . . . . . . . . . . . . . . . . . . . . . . . . . . . . . . . . . . Appendices 166 168 169 171 172 173 174 176 178 180 182 186 187 Appendix 1: Technical Reference Guide . . . . . . . . . . . . . . . . . . . . . . . . . . . . . . . . . . . . . . A1/1 Appendix 2: Coordinate Systems . . . . . . . . . . . . . . . . . . . . . . . . . . . . . . . . . . . . . . . . . . . . A2/1 Appendix 3: MAPublisher 8 How To’s For Legacy Users . . . . . . . . . . . . . . . . . . . . . . . A3/1 Appendix 4: Helpful Styles and Symbols Files . . . . . . . . . . . . . . . . . . . . . . . . . . . . . . . . A4/1 Appendix 5: Glossary . . . . . . . . . . . . . . . . . . . . . . . . . . . . . . . . . . . . . . . . . . . . . . . . . . . . . . . A5/1 Contents vii Introduction MAPublisher 8 is the newest version of a powerful suite of plug-ins for Adobe Illustrator CS3 and CS4 that bridges the gap between geographic information systems (GIS) and high-end graphic design software in order to facilitate the map creation process. MAPublisher 8 offers additional panels, functions, tools and filters to the powerful Adobe Illustrator design environment that enable GIS data files to be used as a base for cartographic production destined for print or Web contents. Working from a traditional Adobe Illustrator document, users create and edit their data organized through layers (either new or imported with MAPublisher). Users benefit from the Adobe Illustrator graphic tools as well as additional custom MAPublisher functions and panels to create, edit and query the map data. MAPublisher Simple and Advanced Import functions allow the import of major GIS and CAD formats (ArcGIS, MapInfo, AutoCAD, MicroStation, KLM and more) into Adobe Illustrator, while retaining their native geometry (Point, Line, Text, Area), layer structure, geographic location and attribute data. The cartographic workspace is managed through MAP Views that control the geospatial parameters: coordinate system, anchor, map scale and rotation. Layers organized under the same MAP View share the same geographic frame of reference. A layer must reside within a MAP View to be managed by MAPublisher functions and keep its spatial and attribute information; however layers not related to a MAP View may still be used for presentation purposes (such as title, scale and legend). An Adobe Illustrator document may contain more than one MAP View. For example, a map with an inset map at a larger scale to represent a zoomed-in area of interest. The MAP Attributes panel allows for creating, editing and querying attribute information. For example, for a line layer containing street data, each line segment may be linked to a table with information relative to the street name and street category. Using the MAP Attributes panel, this information can be viewed, queried, edited or additional columns of data may be appended. The MAP Stylesheets make use of the attribute data to apply Adobe Illustrator graphic styles, symbols or character styles, depending on a given object’s attribute value. MAPublisher offers many functions and tools to manage GIS data from within Adobe Illustrator. They are described in detail in this manual: •Plot a symbol by typing in its world coordinates (MAP Point Plotter). •Draw objects with geographic dimensions (MAP Area Tools). •Trim the geographic extents of the map (MAP Vector Crop). •Join lines or points that share a same attribute value, simplify lines, create a buffer area around a line (MAPublisher line functions) •Automatically label features based on attribute data (MAP LabelPro, Feature Text Label and MAP Tagger Tool). •Select features based on attributes (MAP Selection Filters). •Import and export geographically referenced images. •Create grids and indexes. •Create scale bars and north arrows. •Export your map to Flash with populated Web tags (MAP Web Author). •Export layers to major GIS and CAD formats. •Connect to a GPS device for real-time symbol or line tracing (MAP GPS). •And more... viii Introduction What’s New in MAPublisher 8 MAP Web Author Use the new MAP Web Author tool to create interactive Flash maps for Web-based content, complete with rollovers, pop-ups and layer control A number of options are available to design your Web tags: • Include Images, and set their size. • Use MAP Attributes to automatically populate the text field. • Type and style custom text. • Insert hyper links. Users can design templates and tag multiple data layers at the time. During the export process, the user can customize the outline of Web tags and see a preview of the final product. MAP Vector Crop Tool With MAPublisher 8 new Vector Crop Tool, users only need to draw a box around an area of interest and all geometry outside the frame is cropped out, while preserving attributes and styles. MAPublisher LabelPro™ MAPublisher LabelPro™ revolutionizes the way users can label map data, including using symbols as labels and label conflict resolution with a high degree of customizable rule-based labeling options. The MAP LabelPro engine uses your map data attributes for labeling with styles, rules and controls configured through an intuitive, easy-to-use Graphical User Interface. Available as an optional add-on to MAPublisher 8.1. MAPublisher Toolbar MAPublisher now has its own customizable toolbar. Buttons for importing, all MAPublisher filters, and toggle buttons for MAPublisher panels can be found on this dockable toolbar. MAPublisher Preferences The new MAPublisher Preferences allow users to fully customize their MAPublisher experience. Control everything from the way layers are sorted to the font used to display attribute data or style of the MAP Selection Filters panel. This includes several previously hidden options that used to be the domain of advanced users. MAP Point Plotter Dialog Box The MAP Point Plotter dialog box has been redesigned for the release of MAPublisher 8. The point style is now selected from a pop-up dialog box which contains a larger preview of all the styles present in the document, including their full name. By default, the point's position is plotted using the same coordinate system as the current MAP layer, but users can now elect to plot using another coordinate system (geodetic or projected). Another new feature is the ability to plot centroids. A point may now be plotted at the centroid of every area on a selected MAP area layer. What's New in MAPublisher 8 ix MAPublisher License Management The new MAPublisher License Management system helps users manage their licensing in a more streamlined and user-friendly manner. Users can now evaluate the product, register, retrieve their licenses and checkout a floating license, all in a single dialog box. Additionally, MAPublisher panels are now marked with a lock icon when the software is not licensed. Split Layer The MAPublisher Selection Filters panel has a new option that allows users to split a layer into new layers based on an expression. The qualifying features can either be copied or moved to a new layer, while maintaining all their attribute data. KML Export for Google Maps Google Maps does not support the KML Schema tag or any derived tag (i.e. KML files with attributes values). As such, MAPublisher 8 KML export settings now includes an option to export to KML without the attributes information, so that the resultant KML file is compatible with Google Maps. S-57 Import IHO S-57 vector format can now be imported with MAPublisher 8. Use the supplied S-57 template to automatically style the map on import. Geographic Markup Language - Simple Features Import and Export OGC GML Simple Features (points, lines and polygons), version 2.0 and higher, can now be imported and exported (to version 3.1.1) with MAPublisher 8. Recent Expressions Expressions created in the MAP Selection Filters can now be selected and re-used in the Expression Builders of the MAP Attributes panel and MAP Stylesheets panel. MAP Views Editor The MAP View Editor now has the ability to display both thumbnails and coloured extents of MAP Views in the document. Combined with the new ability to zoom and pan the preview, users should find it much easier to precisely position their MAP view on the canvas. Specify Anchor The Specify Anchor function has been redesigned so that the anchor point world coordinates maybe entered in any coordinate system specified by the user (geodetic or projected), hence removing the need for external coordinate conversions. x What's New in MAPublisher 8 Register Image When no matching vector data is available, a new MAP View can be created directly from a GeoTIFF reference file or by specifying a coordinate system. MAP Attributes Interface The attribute viewer has had several enhancements added for MAPublisher 8. Several buttons have been added to provide faster access to some existing functionality: the column button makes setting attribute visibility much more accessible and the Zoom to Feature button zeroes in on the current row's artwork in one click. The look and feel of the panels has also been improved, with new icons for existing buttons as well as new attribute type icons in the column headers. Additionally, the list of layers now only displays MAP layers that have selected MAP features selected. The MAP Attributes panel has a new function Export Attributes to export all selected attribute information to a delimited text file (comma, space, tab or semi-colon separated). Simplify Line Functionality With MAPublisher 8, Simplify Lines now preserves topology when simplifying—no more gaps between simplified polygons. In addition, a new preview option lets you see the results without leaving the dialog box—it even displays simplification statistics like points removed. Import Optimization The import process has been optimized, improving the loading speed by up to 80%. MAP Views Panel The MAP Views panel has been revamped for speed and stability. The panel should also provide better feedback about the states of layers and MAP Views. One immediate effect is that large files or files with large number of layers and MAP Views open much faster. Additionally, the MAP Views panel has a new Export button for easy access, as well as a new Switch to MAP View button, which should facilitate the movement of layers between MAP Views. MAP Stylesheets Panel The MAP Stylesheets panel has been revamped for speed and stability. The panel should also provide better feedback about the states of layers and MAP Stylesheets. The popular Switch To button from the MAP Views panel has also made it into the MAP Stylesheets panel, allowing you to facilitate the movement of layers from one stylesheet to another with just a couple of quick clicks. What's New in MAPublisher 8 xi Getting Started Before using MAPublisher please read this section to ensure that you have a suitable hardware environment, are familiar with the installation and activation procedures, and adequately prepare your system and workspace to make maps with Adobe Illustrator and MAPublisher 8. Topics covered in this section: System Requirements Installation Instructions MAPublisher Compatibility Notes MAPublisher License Management The MAPublisher Tools The MAPublisher Toolbar MAPublisher Preferences Preparing the Workspace Chapter 1: Getting Started 13 System Requirements Before installing MAPublisher 8, please ensure that you have sufficient system resources, as outlined below: WINDOWS • • • • • Adobe Illustrator CS3/ CS4* Intel Pentium 4 processor or higher (Dual core recommended) Windows XP / Vista 1 GB of RAM minimum (2 GB of RAM or higher recommended) 300 MB of available hard-disk space MAC OS X • • • • • Adobe Illustrator CS3 / CS4* PowerPC G5 or above (Intel recommended) Mac OS X 10.4 or higher 1 GB of RAM minimum (2 GB of RAM or higher recommended) 300 MB of available hard-disk space *Adobe Illustrator CS2 has been deprecated and as such we highly recommend using MAPublisher on Adobe Illustrator CS3 or CS4 only. NOTE: Not all foreign language versions of Adobe Illustrator may be supported. Please contact [email protected] for more information. 14 Chapter 1: Getting Started System Requirements Installation Instructions Please note that MAPublisher is licensed for use on a single computer and once activated will be node-locked to that computer and will only function on that computer. Therefore, before proceeding with installation and activation please ensure that MAPublisher is being installed on the appropriate computer. Different full version releases (i.e. 8.x and 7.x) can be installed on the same computer if two versions of Adobe Illustrator are present. For example MAPublisher 8 with Adobe Illustrator CS3 and MAPublisher 7.6.3 with Adobe Illustrator CS2. However, two point-releases of MAPublisher 8.x cannot be on the same machine. For example, MAPublisher 8.1 with Adobe Illustrator CS4 cannot operate together with MAPublisher 8.0 with Adobe Illustrator CS3 on the same computer. In the other cases, it is recommended to un-install older versions of MAPublisher before installing the newest release. In this process, an option will be given to backup custom coordinates systems and MAP LabelPro rules. NOTE: If MAPublisher 8 is installed without un-installing an earlier MAPublisher version, removing the earlier version will also un-install MAPublisher 8. WINDOWS 1. M ake sure that a compatible version of Adobe Illustrator is installed on the computer. If Adobe Illustrator is running, exit the program. 2. CD version: Insert the MAPublisher 8 CD. If Autorun is disabled on the system, navigate to the MAPublisher 8.1 directory on the CD, and double-click the Setup.exe file. Electronic version: Double-click the mp81wi-e.zip file to open the WinZip self extractor. When the files are unzipped, proceed to the MAPublisher directory and double-click the Setup.exe file. 3. Proceed through the installation screens as instructed. Options are given to install documentation and tutorial data. If these components are selected, the files can be subsequently be found here: Start > All Programs > Avenza > MAPublisher 8 > MAPublisher Tutorials. 4. Launch Adobe Illustrator. Please proceed to the section on Registration and Licensing on the following page. MAC OS X 1. M ake sure that a compatible version of Adobe Illustrator is installed on the computer. If Adobe Illustrator is running, exit the program. 2. CD version: Insert the MAPublisher 8 CD. Navigate to the MAPublisher 8.1 directory on the CD, and double-click the Install MAPublisher 8.1 icon. Electronic version: Unstuff the mp81mi-e.dmg file if this operation has not been completed automatically. Then proceed to the MAPublisher 8.1 folder and double-click the Install MAPublisher 8.1 icon. 3. Proceed through the installation screens as instructed. Note that documentation and tutorial data will also be installed. After installation, these files can be found in the Applications\Avenza\MAPublisher 8\MAPublisher Tutorials . An Alias to this folder will be created at the end of the installation process which will be placed on the desktop. 4. Launch Adobe Illustrator. Please proceed to the section on Registration and Licensing on the following page. Chapter 1: Getting Started Installation Instructions 15 MAPublisher Compatibility Notes MAPublisher 8 is compatible with Adobe Illustrator CS3 and CS4. Please read the following important compatibility information for use when opening legacy MAPublisher and Adobe Illustrator documents. BACKWARD COMPATIBILITY MAPublisher 8 documents are not backwards compatible with previous versions of MAPublisher. MAPUBLISHER 5 (OR EARLIER) DOCUMENTS Point Data MAPublisher introduced new standards on dealing with point data in MAPublisher 6. Pre-MAPublisher 6 documents will have font based points converted to symbols on opening of the document. MAPUBLISHER 6 (OR EARLIER) DOCUMENTS Grids and Graticules Grids and Graticules were redesigned in MAPublisher 7. Please note that grids created in previous versions of MAPublisher (6.x and earlier) will need to be recreated with the new tool if the generation of an index is required. Legend to Stylesheet Conversion Legend functionality (Assign Legend Info, Draw Legend etc) was ported into MAP Stylesheets in MAPublisher 7. Legend information held in legacy MAPublisher documents (6.x and earlier) will be converted into stylesheets on document open. Subsequently Graphic Styles (for line and area legends), Character Styles (for text legends) and Symbols (for point legends) will automatically be generated and added to the respective Adobe Illustrator panels. To qualify for legend conversion, legend art in legacy documents must contain the following properties: 1. Be of a valid art type: i.e. polygon, path, symbol or text 2. Have a legend expression assigned (via Assign Legend Info or Auto Assign Legend Info) 3. Have a target MAP Layer During the conversion process you will be asked to set additional conversion preferences: 1. Determine if target MAP Layers should be immediately assigned to the applicable stylesheet. Checking this option will immediately apply the new stylesheets to map art on target layers, whereas unchecking this option means the new stylesheets will not be applied on document open, allowing you to manually drag target layers into the applicable stylesheet later. Note auto assignment conversions are slower. 2. Determine if you wish to merge similar converted stylesheets (i.e. stylesheets with a matching feature type and original map layer) into a single stylesheet. Note this option will be disabled if it is not applicable. Tables Table information held on table layers (i.e. MPTables layers) will be removed on document open. Therefore ensure that all tables have been joined to the vector art prior to opening the document in MAPublisher 8. 16 Chapter 1: Getting Started MAPublisher Compatibility Notes ALL MAPUBLISHER DOCUMENTS IN ADOBE ILLUSTRATOR 10 (OR EARLIER) FORMAT Legacy Text Conversion Adobe introduced new methods on dealing with text art in Adobe Illustrator CS. Therefore files containing MAPublisher text objects must be converted using Adobe Illustrator and MAPublisher text conversion utilities. If the Illustrator Legacy Text Conversion message appears when opening a legacy document, you should click OK (if the text contains attributes that need to be retained). This will allow MAPublisher to use its own conversion utility to update text items maintaining the text attributes. If you click Update, the document will be opened, however all attributes associated with this text will be lost. When receiving the MAPublisher Legacy Text message, choose one of the following: All text art to convert both MAPublisher text and regular Adobe Illustrator text to the new Adobe Illustrator text format. MAPublisher text art only to convert only MAPublisher text to the new Adobe Illustrator text format. Nothing to open the file but lose attribute information associated with MAPublisher text elements. Legacy Document Format Adobe Illustrator 10 or earlier Open in Adobe Illustrator CS2*, CS3 or CS4 New Document Format 8 Adobe Illustrator CS2*/ CS3/CS4 *Adobe Illustrator CS2 is deprecated, we highly recommend using MAPublisher on Adobe Illustrator CS3 or CS4 only. Chapter 1: Getting Started MAPublisher Compatibility Notes 17 MAPublisher License Management MAPublisher will fail to function until activated. The following instructions are for the activation of single-user licenses of MAPublisher 8 only. If you have purchased a floating license please refer to the floating license installation guide provided with your purchase. MAPublisher 8 is available in both single-user and floating license configurations. Floating licenses are designed to allow an organization to deploy a specific number of licenses that can be used and shared on any number of computers over a network. IMPORTANT: Some peripheral components might interfere with the activation process. Before activating MAPublisher, users must temporarily unplug or disable: mobile phone, blue tooth, wireless or GPS systems. Laptop users with a docking station must activate MAPublisher in the undocked state. After the installation of MAPublisher 8, launch the version(s) of Adobe Illustrator you installed it to. The MAPublisher Welcome Screen will appear automatically. This screen gives four licensing options: Evaluate, Register, Retrieve and Floating. NOTE: If you wish to continue to use Adobe Illustrator without MAPublisher, you can cancel this dialog box and activate MAPublisher license later by navigating to the Help menu in Adobe Illustrator and then to MAPublisher Licensing > License Management. MAPublisher panels are marked with a lock icon when the software is not licensed. MAPublisher welcome screen MAPublisher License Management ACTIVATING AN EVALUATION VERSION OF MAPUBLISHER 1. After installation of MAPublisher 8, click the Evaluate button of the MAPublisher Welcome Screen or MAPublisher License Management dialog box. Fill the form. 18 If you cannot activate the evaluation license directly from the application (due to Firewall limitations), then go to www.avenza.com/register or email ([email protected]) or phone and provide the Machine ID displayed in the MAPublisher License Management dialog box. An email with a zipped license file attachment will be sent to you. You must unzip this attachment and save the .lic file to the appropriate folder*. Chapter 1: Getting Started MAPublisher License Management 2.When you are ready to purchase the software you can open the MAPublisher License Management dialog box from Adobe Illustrator Help menu at MAPublisher Licensing > License Management, click Register button and follow the instructions in the next paragraph. REGISTER A PURCHASED COPY OF MAPUBLISHER 1. To activate MAPublisher 8 you must enter the Serial Number which was provided when you purchased the product. 2. After installation of MAPublisher 8, click the Register button of the MAPublisher Welcome Screen or MAPublisher License Management dialog box. You will be prompted to enter the serial number, then fill out the form. If you cannot register your purchased license directly from the application (due to Firewall limitations), then go to www.avenza.com/register or email ([email protected]) or phone and provide the Machine ID displayed in the Finish screen. We will then send you an email with a zipped license file attachment. You must unzip this attachment and save the .lic file to the appropriate folder*. RETRIEVE YOUR MAPUBLISHER LICENSE If you have inadvertently deleted your license file from your hard drive, you can click the Retrieve button of the MAPublisher Welcome Screen or MAPublisher License Management dialog box. This will download the license file from our server. If you cannot retrieve your MAPublisher license directly from the application (due to Firewall limitations), then go to www.avenza.com/register or email ([email protected]) or phone and provide the Machine ID displayed in the MAPublisher License Management dialog box. We will then send you an email with a zipped license file attachment. You must unzip this attachment and save the .lic file to the appropriate folder*. * The license file is located in the following directories: Windows XP: C:\Documents and Settings\All Users\Application Data\Avenza\MAPublisher 8 Windows Vista: C:\ProgramData\Avenza\MAPublisher 8 Mac OS X: Applications/Avenza/MAPublisher 8/MAPublisher Plug-In Alternatively, users may right-click on a row in the License Management dialog box (started from the menu Help > MAPublisher Licensing > License Management) and click on the menu item Browse to license folder... This opens a file browser at the dedicated MAPublisher license file directory for your operating system. Keeping this browser opened, users can past in the license file received directly at the appropriate location. Chapter 1: Getting Started MAPublisher License Management 19 CHECKOUT A FLOATING LICENSE If you have purchased a floating license please refer to the floating license installation guide provided with your purchase. Once the server license is fully operational, follow these instructions to check-out a license from the client machine (computer running the actual MAPublisher application). 1. After installation of MAPublisher 8, click the Floating button of the MAPublisher Welcome Screen or MAPublisher License Management dialog box. 2. Enter the name or IP address of the server where the license manager resides. 3. Click the Checkout button to retrieve the one of the licenses from the server. NOTES: • • If you wish to use Adobe Illustrator without MAPublisher, then click the Check in button from the MAPublisher License Management dialog box (at Help > MAPublisher Licensing > License Management). This releases the license, so other users can now use it. The link to the server is set for once. The next time you start the application, you just need to the click the Checkout button on the MAPublisher Welcome Screen (or License Management dialog box). MAPUBLISHER LABELPRO LICENSING MAPublisher LabelPro is an optional add-on to MAPublisher. Purchased MAPublisher LabelPro licenses are added to the main MAPublisher license. During the registration process described above, all licenses will be imported. When purchasing a new MAPublisher LabelPro license on the top of an existing MAPublisher license, a new serial number will be issued and the full license will have to be retrieved (see instructions above). To evaluate MAPublisher LabelPro license, open the MAPublisher License Management dialog box from the Adobe Illustrator menu Help > MAPublisher Licensing > MAPublisher License Management. Click the MAPublisher LabelPro branch and then click the Evaluate button as previously explained. The evaluation version of MAPublisher LabelPro scrambles the text of placed labels but preserves the case, spacing and punctuation, so that the results give a sense of how actual labels would be placed based on the rule settings. See chapter 17 for more details on MAP LabelPro functionality and usage. NOTE: MAPublisher and MAPublisher LabelPro can only be both floating licenses or both local licenses (fixed or evaluation). A user on a floating license wishing to evaluate MAPublisher LabelPro will have his main MAPublisher and MAPublisher LabelPro licenses switched to a local evaluation license. At the end of the evaluation period, the settings for floating license can be reset as described above. 20 Chapter 1: Getting Started MAPublisher License Management The MAPublisher Tools MAPublisher tools can be found in a number of locations in Adobe Illustrator. The MAPublisher Importers can be found under the File menu and by using the keyboard shortcuts and toolbar. MAPublisher Edit MAP Object* function can be found under the Object menu *for editing Scale Bars, Grids and Graticules (menu item name is adjusted accordingly) The MAPublisher panels can be found under the Window menu Chapter 1: Getting Started The MAPublisher Tools 21 The MAPublisher filters can be found under the Object > Filters menu* MAP Images MAP LabelPro MAP Legend MAP Lines Five MAPublisher tools can be found in the main Adobe Illustrator Tools panel * In Adobe Illustrator CS3, MAPublisher Filters are found in the Filters menu. 22 Chapter 1: Getting Started The MAPublisher Tools MAPublisher Toolbar Window > MAPublisher > MAP Toolbar The new MAPublisher Toolbar allows the user to launch the MAPublisher tools, described in the previous paragraph, in a single click. The MAP toolbar is divided in five sections: MAPublisher Import, MAPublisher Lines, MAPublisher LabelPro, MAPublisher Legends, MAPublisher Imaging and MAPublisher Panels. MAPublisher Import MAPublisher Lines MAP LabelPro MAPublisher Legends MAPublisher Panels MAPublisher Imaging NOTE: MAPublisher Toolbar cannot be saved in a workspace (Adobe Illustrator main menu Window > Workspace >Save Workspace...) MAPUBLISHER IMPORT Simple Import Advanced Import MAPUBLISHER LINES Buffer Line Simplify Lines Flip Line Join Points Join Lines MAPUBLISHER LABELPRO MAP LabelPro MAPUBLISHER LEGENDS North Arrow Scale Bar Feature Text Make Index Grids Graticules Chapter 1: Getting Started MAPublisher Toolbar 23 MAPUBLISHER IMAGING Export Image Register Image MAPUBLISHER PANELS MAP Attributes MAP Web Author MAP GPS Panel MAP Location Tool MAP Stylesheets MAP Selection Stats MAP Views MAP Selection Filter MAP Point Plotter 24 Chapter 1: Getting Started MAPublisher Toolbar MAPublisher Preferences Edit > MAPublisher Preferences (Windows) Illustrator > MAPublisher Preferences (Mac OS) MAPublisher Preferences are options that allow users to customize MAPublisher panels and editors, including those for layer ordering, font for attribute data display, panel style, etc. Settings are available for the following categories: • General. • MAP Attributes (panel). • MAP LabelPro. • MAP Stylesheets (panel and editor). • MAP Views (panel and editor). Property sheet with options specific to the selected category on the list on the left side. MAPublisher Preferences are saved within the Adobe Illustrator preference file called AIPrefs (Windows) or Adobe Illustrator Prefs (Mac OS), which is launched each time Adobe Illustrator is started. Therefore, MAPublisher Preferences are not file dependent. NOTE: The Adobe Illustrator preference file is located in following directory Windows XP: C:\Documents and Settings\[ user profile ]\Application Data\Adobe\Adobe Illustrator CSX Settings\AIPrefs Windows Vista: C:\Users/(user)\AppData\Roaming\Adobe\Adobe Illustrator CSX Settings\AIPrefs Mac OS X: Users/~username/Library/Preferences/Adobe Illustrator CSX Settings/Adobe Illustrator Prefs OPEN MAPUBLISHER PREFERENCES MAPublisher Preferences can be opened from the Adobe Illustrator main menu, Edit > MAPublisher Preferences (Windows) or Illustrator > MAPublisher Preferences (Mac OS X), and from the panel options menu of the following MAPublisher panels: MAP Attributes, MAP Selection Filters, MAP Stylesheets and MAP Views. When opened through the Adobe Illustrator menu, MAPublisher Preferences opens up with no category selected. When started from a specific MAPublisher panel options menu, MAPublisher Preferences open on the current panel property sheet. Chapter 1: Getting Started MAPublisher Preferences 25 MAPUBLISHER PREFERENCES SETTINGS Clicking one of the MAPublisher category or sub-categories on the left hand list displays the corresponding property sheet displayed on the right. General Preferences The General property sheet is used to change the layer ordering rule for all MAPublisher panels. By default, layers are sorted alphabetically only. The other option is to first group layers by data type first (Legend, Text, Point, Line and Area) and subsequently in alphabetical order for each group. Sorting Style - Set to Name, then type for an alphabetical sorting. Set to Type, then name to first sort the layers per data type (Legend, Text, Point, Line or Area) MAP Attributes Preferences The MAP Attributes preference category does not contain general settings but has a sub-category for the MAP Attributes panel (see chapter 5 for a full description of the MAP Attributes panel). MAP Attributes > Panel Preferences: Show icons in column headers – Enable this option to display the data type in front of the attribute column name ( Boolean, Integer, Real, String). Table font– Set the text font for headers and attribute values. Table font size– Set the text font size. 26 Chapter 1: Getting Started MAPublisher Preferences MAP LabelPro Preferences The MAP LabelPro preference category contains general settings to save the path access to saved rules, styles and symbol folders (see chapter 17 for more information on MAP LabelPro). The Editor sub-category controls the aspect of the MAP LabelPro dialog box. MAP Label Pro Preferences: Base rule folder – Directory path to the rule folder. Click the browse button to open a folder browser and change the path. Base style folder – Directory path to the style folder. Click the browse button to open a folder browser and change the path. Symbol folder – Directory path to the symbol folder. Click the browse button to open a folder browser and change the path. Ignore invisible artwork – Enable this option to ignore individual invisible artwork. If this option is disabled, individual invisible artwork will be taken into account as labelling source and obstacle. NOTE: The default directories for the rule, style and symbol folder are as follow: • Default rules and styles folders—respectively Rules and Styles subfolders in the directory: Windows XP: C:\Documents and Settings\All Users\Application Data\Avenza\MAPublisher 8\LabelPro\.. Windows Vista: C:\ProgramData\Avenza\MAPublisher 8\LabelPro\.. Mac OS X: Applications/Avenza/MAPublisher 8/MAPublisher Plug-In/LabelPro/.. • Default symbol folder: Windows XP: C:\Documents and Settings\All Users\Application Data\Avenza\MAPublisher 8\LabelPro\Symbols Windows Vista: C:\ProgramData\Avenza\MAPublisher 8\LabelPro\Symbols Mac OS X: Applications/Avenza/MAPublisher 8/MAPublisher Plug-In/LabelPro/Symbols Chapter 1: Getting Started MAPublisher Preferences 27 MAP Selection Filters Preferences The MAP Selection Filters preference category does not contain general settings but has a sub-category for the MAP Selection Filters panel (see chapter 11 for a full description of the MAP Selection Filters panel). MAP Selection Filters > Panel Preferences Show filters on two lines - Enable this option to display the selection filter name and its expression on two separate lines. MAP Stylesheets Preferences The MAP Stylesheets preference category does not contain general settings but has sub-categories for the MAP Stylesheets editor and panel (see chapter 9 for a full description of the MAP Stylesheets editor and panel). MAP Stylesheets > Editor Preferences: Maximum values to load - Maximum number of attribute values that are loaded in list of values of the Simple Expression dialog box.. 28 Chapter 1: Getting Started MAPublisher Preferences MAP Stylesheets > Panel Preferences: Sort list using natural string comparison – Enable this option to use the natural sorting for layer and MAP Stylesheet names using numbers (e.g. 1,2,10 instead of 1, 10, 2). MAP Stylesheet sort style – By default, the General sorting style is applied (option Use General preference). Set to Name, then type for an alphabetical sorting. Set to Type, then name to first sort the layers per data type (Legend, Text, Point, Line or Area). MAP Views Preferences The MAP Views preference category does not contain general settings but has sub-categories for the MAP Views editor and panel (see chapter 4 for a full description of the MAP Views editor and panel). MAP Views > Editor Preferences:: In the MAP Views Editor, the Preview Pane allows to display up to 10 MAP Views represented in different Coloured boxes . The MAP Views Editor preference property sheet allows to customize the colour of these coloured boxes. Chapter 1: Getting Started MAPublisher Preferences 29 MAP Views > Panel Preferences: Sort list using natural string comparison – Enable this option to use the natural sorting for layer and MAP Stylesheet names using numbers (e.g. 1,2,10 instead of 1, 10, 2). RESET MAPUBLISHER PREFERENCES TO DEFAULT SETTINGS MAPublisher Preferences can be reset directly from the MAPublisher Preferences dialog box. A right click on a category will display the choice to reset the preference setting of this category or the entire MAPublisher Preferences. MAPublisher Preferences will also be reset if the Adobe Illustrator preferences are reset or deleted. Adobe often recommends this to solve some problems with the application. Adobe Illustrator preferences are reset by doing one of the following: • Press and hold Alt+Control+Shift (Windows) or Option+Command+Shift (Mac OS) as Adobe Illustrator is starting. The current settings are deleted. • Remove or rename the AIPrefs file (Windows) or Adobe Illustrator Prefs file (Mac OS). New preferences files are created the next time Adobe Illustrator is restarted. 30 Chapter 1: Getting Started MAPublisher Preferences Preparing the Workspace Before you can start using MAPublisher, you must first set up your Adobe Illustrator document. It is at this point that you define your page size and units, set your print orientation and generally prepare your Adobe Illustrator workspace. Establish the desired page size and orientation before importing map data as MAPublisher will establish georeferencing based on the current page. However editing page dimensions after import will maintain correct georeferencing based on the new page dimensions. SETTING UP YOUR DOCUMENT 1. Create a new Adobe Illustrator document by selecting File > New, or Select File > Document Setup if you already have a blank document open - The Adobe Illustrator Document Setup dialog box appears. 2. Select the size to use for your page. Letter (8.5” x 11”) is the default size*. You may wish to change the orientation to landscape for some files. For example, a map of Chile may be best displayed in portrait but a map of Indonesia may be best displayed in landscape. 3. Select your desired page units. The default unit type is Points. 4. Ensure the page origin is at 0,0. To do this, select View > Show Rulers. Double-click the top left corner of the rulers where the vertical and horizontal rulers intersect. For more information and details regarding these operations please refer to your Adobe Illustrator User Guide. * In step 2 the default page size of 8.5” x 11” is for North American versions of Adobe Illustrator. Other language versions of Adobe Illustrator may have different default page sizes. Consult your Adobe Illustrator User Guide for more information. NOTE: Due to an Adobe Illustrator limitation, the document size should not exceed a limit of 200 inches by 200 inches (200’’ equals 5080 mm, 508 cm, 14400 points, 1200 picas, 14400 pixels). Passed this limit, some MAPublisher tools may not operate properly (shift in positioning). Note that the maximum length and width dimension for an Adobe Illustrator document is 227.5416 inches. Chapter 1: Getting Started Preparing the Workspace 31 Map Data File Formats MAPublisher 8 imports and exports most of the GIS industry leading vector file formats: Import Formats CAD (*.dxf ) (*.dwg) ESRI Interchange File (*.e00) ESRI ArcInfo Generate (*.gen) ESRI Shapefile (*.shp) GML (Simple Features 2.0 +) MapInfo Interchange (*.mif / *.mid) MapInfo Table (*.tab) MicroStation Design (*.dgn) Not supported under Mac PPC/Rosetta Delimited Text Data (*.txt) (*.csv) (*.tsv) KML (*.kml) S-57 (*.000) TIGER/Line (*.rt1) (*.bw1) USGS Digital Line Graph (*.dlg) (*.opt) USGS Spatial Data Transfer Standard (SDTS) (*.ddf ) Export Formats CAD (*.dxf ) (*.dwg) ESRI Interchange File (*.e00) ESRI ArcInfo Generate (*.gen) ESRI Shapefile (*.shp) GML (Simple Features 3.1.1) MapInfo Interchange (*.mif / *.mid) MapInfo Table (*.tab) MicroStation Design (*.dgn) Delimited Text Data (*.txt) (*.csv) (*.tsv) KML (*.kml) This section provides an overview of the formats outlined above, as well as additional considerations when using GIS data with MAPublisher. For an in-depth analysis of further considerations when using these formats during Import, please see appendix A1. Chapter 2: Map Data File Formats 33 Import and Export Supported Data Formats DATA FORMAT DESCRIPTIONS AutoCAD Drawing (*dwg) and Drawing Exchange (*.dxf) Import and Export These file types are most commonly created by Autodesk AutoCAD product, though other software programs such as Bentley MicroStation and various other computer-aided design (CAD) programs are capable of creating files in this format. There are two formats used by AutoCAD: DXF (drawing exchange format) files, which are large, and ASCII representations of the binary DWG (drawing) files. Logically, both files are identical and, therefore, MAPublisher treats both file types in the same manner. AutoCAD files consist of drawing settings and configurations, as well as a series of entities, or graphic elements, organized into layers. MAPublisher provides broad support for many AutoCAD entity types and options. Prior to import set the colour mode of the Adobe Illustrator document to the same scheme used in the colour table of the CAD file (i.e. RGB or CMYK) to ensure colours are imported correctly. Note the hierarchy of layers in multi-feature imports is by feature type: text layers, then point, then line, then area layers. ESRI Interchange File (*.e00) Import and Export ESRI Interchange File files are created by ESRI ArcInfo product. A single E00 file describes a complete ArcInfo coverage. The file itself is actually an archive of several smaller files, or sub files, which will have fixed names and follow a predefined data format. MAPublisher will reproduce these sub files as distinct Adobe Illustrator layers on import. Therefore importing a single e00 import can result in the generation of point, area, line and text layers. Note the hierarchy of layers in multi-feature imports is by feature type: text layers, then point, then line, then area layers. ESRI ArcInfo Generate (*.gen) Import and Export ArcInfo Generate files are created by ESRI ArcInfo product, and have a simple ASCII from x-y to x-y format. Due to its simplicity you can also use a text editor such as Notepad to create text files and save them with a *.gen extension, which can then be imported with MAPublisher. ESRI Shapefile (*.shp) Import and Export Shapefiles are most commonly created by ESRI ArcGIS or ArcView. Shapefiles store both geometry and attributes for features, and a single shapefile will consist of at least three physical files. The .shp portion contains the geometric data, the .dbf contains attributes for the geometric data, and the .shx contains the index information. All three files are required in order to successfully import a shapefile to Adobe Illustrator using MAPublisher. There is also usually a .prj file, which holds the coordinate system information of the shapefile and will automatically be read by MAPublisher on import. If your shapefile folder does not contain a .prj file you will be required to specify the coordinate system in order to fully utilize MAPublisher. The important things to remember when importing Shapefiles are that the .shp file must be the one that is selected through the MAPublisher import filter and that all its component files must be in the same folder. You may also find that your Shapefile directory comes with two extra files, a .sbn and a .sbx, which hold the spatial index for the geometric data. These two files will not exist unless the Shapefile was created with an ESRI product, and are not necessary for successful import with MAPublisher. 34 Chapter 2: Map Data File Formats Import and Export Supported Data Formats GML (Simple Features 2.0+) Import and Export The Geographic Markup Language (GML) was designed as a geographic interface language for the Geo-Web. It is currently in draft as an ISO standard (ISO 19136). The goal of the format is to provide users with a set of abstract base objects that can be built into working real world dataset. It uses as XML base to store geometry and feature information that can easily be transported across the Internet. The GML Simple Feature Profile was created by the Open Geospatial Consortium (OGC) as a restricted but useful subset of the GML specification. It provides a reduced geometry and metadata profile that can be shared across many GIS tasks. This simple feature model can be used as a base to generate local application profiles for a specific work area. Since the GML models base abstract classes, these application profiles (schemas) are required for accessing and processing any GML datasets. GML data has a *.gml extension, and requires a attributes schema file *.xsd. Some GML files may have their .xsd file referenced to a URL path, we recommend to copy the xsd files locally, to avoid error messages upon import when no internet connection is available. Users have two options to store their .gml and .xsd files: they can be both located in a same directory or the xsd files can be kept in the MAPublisher GML Schema directory found here: Windows XP and Vista: C:\Program Files\Avenza\MAPublisher 8\Data Source Files\GMLSchema Mac OS X: /Applications/Avenza/MAPublisher 8/MAPublisher Plug-In/Data Source Files/GMLSchema The second option is the most practical if all the GML files are using a same schema (only one instance of the xsd file needs to be saved). Installed with MAPublisher are three default xsd files: • xml.xsd, generic GML attribute schema. • nen3610.xsd and top10nl.xsd, models standardized in the Netherlands (maintained by the Dutch topographic office Kadaster). GML files with a missing xsd file or with an invalid attribute schema will cause a GML validation error upon import (see chapter 3). Users have the option to either find the appropriate xsd file and copy it to the GML Schema directory or to the GML file directory, or to disable the GML validation. This option will assign a type string to all attributes. See chapter 3 Importing Map Data for more details on these settings. MAPublisher supports the import of simple features (points, lines, polygons, donuts, and aggregates) in GML 2.0 and later versions. MAPublisher supports export to GML 3.1.1. MapInfo Interchange (*.mif/*.mid) Import and Export Files of this type are most commonly created by the MapInfo product, though other products, including MAPublisher, are also capable of generating files in this format. These files exist in pairs where each file has the same name but ends in either a .mif or .mid file extension. The .mif portion contains the vector geometric data, and the .mid contains the associated attributes. Both files are required in order to successfully import a file of this format to Adobe Illustrator using MAPublisher. The important things to remember when importing MapInfo files are that the .mif file must be the one that is selected through the MAPublisher import filter and that both files must be in the same folder. MAPublisher will automatically locate and deal with the .mid file. Chapter 2: Map Data File Formats Import and Export Supported Data Formats 35 MapInfo Table (*.tab) Import and Export The TAB format is a simple, non-topological format for storing the geometric location and attribute information of geographic features, and is an integral part of the MapInfo product. The TAB format defines the geometry and attributes of geographically-referenced features in several files with specific file extensions that are stored in the same folder on disk. They are: .tab: main file: table structure in ASCII format. .map: the file that stores the feature geometry. .id: the file that stores the index of the feature geometry. .dat: the dBASE file that stores the attribute information of features. .ind: table field indexes (if necessary) The geometry of each feature is stored as a shape that comprises a set of vector coordinates. The attributes for each feature are stored as a record in a dBASE table (.dat) associated with the Shapefile (.map). There is one record in the dBASE table for each feature in the map file. Raster TAB files cannot be imported in MAPublisher. To ensure successful import, select the .tab component in the MAPublisher importers. MicroStation Design* (*.dgn) Import and Export MicroStation Design files (.dgn) are the native files created by Bentley Systems Inc. (and formerly Intergraph) MicroStation product. Design Files consist of a header, followed by a series of elements. The header contains global information including the transformation equation from design units to user coordinates, as well as the dimension of the elements in the file. Each element contains standard display information, such as its colour, level, class, and style, as well as a number of attributes specific to its element type. During the import process MAPublisher will reproduce .dgn levels as distinct Adobe Illustrator layers. Therefore a typical single import will produce one layer for each Level that exists in the MicroStation Design File. MAPublisher supports the import of MicroStation J (version 7) and V8 files, however attached raster file will not be imported (they are ignored). Files are exported to DGN from MAPublisher as MicroStation J files. Prior to import set the colour mode of the Adobe Illustrator document to the same scheme used in the colour table of the original file (i.e. RGB or CMYK) to ensure that the colours are interpreted correctly upon import. The hierarchy of layers in multi-feature imports is by feature type in the following order: text layers, then point layers, then line layers, then area layers. Raster files attached to DGN files are ignored during the import process. * MicroStation Design file import is not supported under Mac PPC/Rosetta operating system. Please contact Avenza support if you require more assistance regarding this issue. Delimited Text Data (*.txt) (*.csv) (*.tsv) Import and Export MAPublisher also supports the import of Delimited Text Data held in a variety of tabular file formats, as long as the data contains coordinate values. File types supported are Text (.txt), Tab Separated (.tsv) and Comma Separated (.csv) files. Import Settings dialog box: In order to import point data with MAPublisher you must set parameters by clicking the Settings’ button. This operation is required to choose the columns of the selected attribute file that will be used to derive the X and Y coordinates of the data, and ensure correct georeferencing. These and further settings will be discussed in the Delimited Text Data Settings section in appendix A1. 36 Chapter 2: Map Data File Formats Import and Export Supported Data Formats KML (*.kml) Import and Export Keyhole Markup Language (KML) is an XML-based language for managing the display of three-dimensional geospatial data in the programs Google Earth, Google Maps, Google Mobile and WorldWind. The KML file specifies a set of features for display. Each feature always has a longitude and a latitude and can have other data, such as tilt, heading, and altitude. KML shares some of the same structural grammar as GML. KML files are very often distributed as KMZ files, which are zipped KML files with a .kmz extension. KMZ files are not supported in this version of MAPublisher. S-57 (*.000) Import only S-57 is referring to the IHO (International Hydrographic Office) Special Publication number 57 related to the IHO transfer standard for Digital Hydrographic Data . Maintained by the IHO, S-57 format is intended for the exchange of digital hydrographic data between national hydrographic offices and for its distribution to manufacturers, mariners and other data users. It is used for the supply of ENC cells (Electronic Navigational Charts) to ECDIS (Electronic Chart Display and Information System). The objects spatial geometry can be of Point, Line or Area geometry, while object descriptions are categorized in object classes, organized in specific attributes schemas. To make full use of this format, refer to the online object catalog available on www.s-57.com. MAPublisher imports non-encrypted S-57 data into MAP layers named per S-57 object acronym, of type Area, Line or Points. All S-57 Attributes are converted into MAP Attributes. An Adobe Illustrator template is supplied to automatically style the map after import. The template contains a series of MAPublisher stylesheets linking S-57 imported features to nautical symbols and graphic styles (libraries provided by Avenza). This representation is non-exhaustive and meant to assist users with limited knowledge of the S-57 format to interpret the data contents more easily. The S-57 template and the symbols and graphic styles libraries can be found in the MAPublisher Helpful Styles & Symbols folder (see Appendix 4). TIGER/Line (*.rt1) (*.bw1) Import only TIGER is an abbreviation of Topologically Integrated Geographic Encoding and Reference System, and was developed by the U.S. Census Bureau. TIGER/Line files are a digital database of geographic features, such as roads, railroads, rivers, lakes, political boundaries, census statistical boundaries, etc., that cover the entire United States. The database contains information about these features such as their location in latitude and longitude, the name, the type of feature, address ranges for most streets, the geographic relationship to other features, and other related information. TIGER/Line files are the public product created from the Census Bureau TIGER database of geographic formation. TIGER was developed in order to support the mapping and related geographic activities required by the census and sample survey programs. More information on the TIGER/Line file format and data product can be found on the US Census web page at: http://www.census.gov/geo/www/tiger/ MAPublisher considers the .rt1 or .bw1 file as the TIGER dataset. Even though each county will consist of a series of files with a common base name, there may be a number of different extensions. Remember to select the .rt1 or .bw1 file when importing TIGER data. Chapter 2: Map Data File Formats Import and Export Supported Data Formats 37 USGS Digital Line Graph (*.dlg) (*.opt) Import only The United States Geological Survey DLG file structure is designed to accommodate categories of spatial data represented on a conventional line map. Node (point), line, and area data types are accepted. The attribute coding scheme is designed to accommodate basic cartographic data categories such as hypsography, hydrography, or political and cultural features, as well as additional thematic data categories. USGS Spatial Data Transfer Standard SDTS (*catd.ddf) Import only Digital cartographic products of the USGS are available in the Spatial Data Transfer Standard format, and are generally distributed over the Internet as a means of promoting the standard. For SDTS import, select the catd file (xxxxcatd.ddf ), which is the index file that contains a description of the other files in the SDTS transfer. Individual DDF files cannot be imported. Generally all SDTS downloads will contain the CATD file. DATA CONSIDERATIONS When obtaining GIS data for use with MAPublisher, whether from an online source, commercial vendor, government office or from an internal source within your organization, there are a number of important considerations to keep in mind. First and foremost you should always endeavour to obtain data in one of the formats supported by the MAPublisher Importers (see above). In cases where the file format native to a particular mapping application is not supported by MAPublisher, you can often request the data provider to export a file in one of the supported formats. When obtaining data you should acquire as much metadata about the files as possible. MAPublisher deals with data in the following manner: Unprojected data will be imported by MAPublisher with latitude and longitude map anchors, which will therefore range from (x) -180 to 180, (y) -90 to 90. If you receive projected data you should be aware of the following. MAPublisher will import projected data with a true scale and appropriate map anchors. Unlike unprojected data, these map anchors will not be in lat/ long, but rather in a coordinate system appropriate for the particular projection. For most file formats the name of the projection, datum, and units will be recognized by MAPublisher. However if the program cannot find this information in the data, and you wish to subsequently reproject your data, you will be required to specify the coordinate system. Additionally, please be aware that MAPublisher is a 2D mapping program. Therefore if you attempt to import 3D data with MAPublisher it will be converted to two dimensional artwork by the importers. NOTE: Data provided in a generic latitude and longitude (unprojected) coordinate system will usually be recognized as a WGS 84 (World Geodetic System 1984 - EPSG = 4326) coordinate system by the MAPublisher importers. 38 Chapter 2: Map Data File Formats Import and Export Supported Data Formats Importing Map Data The Import filters are the main starting point for most users wanting to work with GIS map data in Adobe Illustrator. These filters are used to import GIS data files, set the initial map scale and define your cartographic workspace to start making maps. MAPublisher 8 supports import of the following GIS data formats: CAD (*.dxf ) (*.dwg) ESRI Interchange File (*.e00) ESRI ArcInfo Generate (*.gen) ESRI Shapefile (*.shp) GML (Simple Features 2.0 +) MapInfo Interchange (*.mif / *.mid) MapInfo Table (*.tab) MicroStation Design (*.dgn) Not supported under Mac PPC/Rosetta Delimited Text Data (*.txt) (*.csv) (*.tsv) KML (*.kml) S-57 (*.000) TIGER/Line (*.rt1) (*.bw1) USGS Digital Line Graph (*.dlg) (*.opt) USGS Spatial Data Transfer Standard (SDTS) (*.ddf ) See chapter 2 for a description of these formats. Two import filters will be discussed in detail in this section: Simple Import: This filter is designed to provide a fast way to import one file, or several files of the same data format and coordinate system into Adobe Illustrator. Advanced Import: This filter provides functionality to import a number of files of differing data type and/or coordinate systems into Adobe Illustrator. Chapter 3: Importing Map Data 39 Simple Import File > Import Map Data > Simple and MAP Toolbar Format - Select the data type you wish to import. This drop-down list shows the names of all MAPublisher supported data types. Settings - Opens a Settings dialog box if the file format requires the input of extra parameters, such as for the import of DGN, DXF, DWG, E00, GML, KML, MIF/MID, Tab and Delimited Text Data (see facing page). Dataset - Displays the directory path and filename for the currently selected file(s). You can also manually type in the dataset location here. Source Coordinate System - Provides a description of the coordinate system and units detected in the data source. Same as - Check this option in order to assign a coordinate system that matches that of an existing MAP View. Browse - Opens a Data Source browser to enable the selection of files for import. Character Encoding - Assign a codec if the attribute information held in the selected dataset uses a double byte character set. Specify - If the coordinate system of the selected file(s) is known, but it was not automatically detected by the program, click here. This will open the Specify Source Coordinate System dialog box (below). Clear - Click this button to clear the existing source coordinate system. RELATED TOOLS Specify Source Coordinate System Accessed via the Specify button. Coordinate Systems - Choose a category appropriate to the data to be imported. To view all of the coordinate systems select *All*. For a list of the last 10 coordinate systems used, select *Recent*. Search - Specify a text string to search the database for coordinate systems. Results are displayed in the *Search* category. Coordinate System Information - This area shows information about the coordinate systems. (i.e. Name, Type, Envelope, EPSG Code). To choose a known source coordinate system select it from this list. Search - Click this button and your search results will be populated. Matching MAP View Automatically opens if there is already a coordinate system in your document which matches the incoming data. Add to - Add the incoming data file to a matching MAP View. Resize MAP View to fit - Check this box to rescale the matching data so that both the selected layer and the incoming data fit inside the page extents. 40 Chapter 3: Importing Map Data Simple Import MAP View list - Select the matching coordinate system that you wish to align the incoming data to. Fit to page based on new MAP View - Both the matching coordinate system and incoming data will be treated separately in terms of page scaling. IMPORT SETTINGS Delimited Text Data Settings Latitude/Longitude or X/Y Columns - These two drop-down lists hold the names of all the numeric columns in the selected file. Select the columns from which the coordinates for each point will be read. AutoCAD DXF/DWG Settings Group Entities By - Group entities by layer name or geometry. Hatches - Check this box if you want MAPublisher to read your hatch pattern on import . Coordinate Format - This drop-down list allows the format of the data to be set on import (e.g. Decimal Degrees, Packed DMS... see chapter 6). Use first line as a header - If the first line of the text file you are importing contains column headings, check this box. White Lines and Fills - Choosing the Import as is option will instruct MAPublisher to import the data true to the original colour settings contained in the file. Choose the Change white lines and fills to black option to import black lines instead of the files native white lines. Choose the Create black background option to incorporate a layer containing a black background, to mimic the AutoCAD environment. MapInfo TAB and MIF/MID Settings Pen and Brush Patterns - Enable this box to view the pen and brush pattern values in the imported attribute table. ESRI Interchange File Settings Enable - Specify if you require the creation of a layer holding the registration control points. If you enable the _tic_point layer won't be created. MicroStation Design Settings* Group Elements Choose how you want to group the elements. If you group the elements by level, it may result in a large number of output files. Expand Network Links - Checking this box will enable the use of network linked KML files. Coordinate Units - Specifies how feature coordinates will be interpreted and converted. White Lines and Fills - Choosing the Import as is option will instruct MAPublisher to import the data true to the original colour settings contained in the file. Choose the Change white lines and fills to black option to import black lines instead of the files native white lines. Choose the Create black background option to incorporate a layer containing a black background, to mimic the MicroStation environment. KML Settings Allow Random Colour Mode Checking this box allows Adobe Illustrator to generate random colour settings for your data. Import KML as Visible Attributes - When this check box is selected the KML-specific attributes will be imported into the attribute table as a visible entities. The KML attributes that will be imported are Description and Address which will display in the MAP Attributes panel as kmlDescription and kmlAddress. The description column will show the description of each object and the address column will show the corresponding address for that object. When this check box is not selected the attributes will still be imported, however they will not be immediately visible in the MAP Attributes table. Complex Strings - Check the Drop box if you want each component of a complex chain to be returned as its own feature. Otherwise all elements of the complex chain will be merged into a single linear feature. * MicroStation Design file import is not supported under Mac PPC/Rosetta. Chapter 3: Importing Map Data Simple Import 41 GML (Simple Features 2.0+) Settings GML validation - GML validation must be disabled to import GML files with a missing .xsd file or with an invalid attribute structure. If not disabled, a GML validation error will be displayed during the import of these files. SIMPLE IMPORT FUNCTIONALITY The Simple Import function provides a fast, uncomplicated method of importing map data into Adobe Illustrator. Its purpose is for the map maker who has a single piece of map data, or several smaller files comprising one dataset of the same format and coordinate system, that they wish to import quickly. PREREQUISITES In order to import data via Simple Import, you must first set up your Adobe Illustrator document. Plan for the data that you will subsequently bring in, and set up your Adobe Illustrator document accordingly. For instance, a map of the world would fit well into a page with a Landscape orientation, whereas a map of South America would fit best into a page with a Portrait orientation. Also plan for the output of the map document, if necessary, to ensure that your page dimensions are close to the required size that the document will be printed. It is far easier to set up the page before the map data has been imported, as MAPublisher will interpret these dimensions in the Importer, and calculate a map scale for your document accordingly. If you do edit the size of your document, remember to reset your rulers before opening either Importer in order for MAPublisher to correctly fit the data into the page extents. Once your page has been set up you can access the MAPublisher Simple Import function under the File menu, at the Import Map Data pullout or from the MAPublisher toolbar button or by using the keyboard shortcut Shift+Ctrl+i. USING SIMPLE IMPORT Overview The dialog box itself is split into two sections. The upper section allows you to choose a file format, select the file you wish to import, and enter any additional settings that may be required. The lower section will display the coordinate system of the selected file and allow you to specify this manually if the program has not detected a coordinate system. 42 Chapter 3: Importing Map Data Simple Import Adding Files In order to select a file or files for import you can either leave the Format drop-down list as <Auto detect format> or set the drop-down list to the file type you wish to import. If this drop-down list is left as <Auto detect format>, when you search for your GIS file, all supported files will be displayed. It is often easier therefore to set the Format drop-down list at the required format to ease navigation. When you have chosen the format, click the Browse button to select your file(s) and then click Open. Alternatively you can type in the full path of the file(s) in the Dataset text box. NOTES: • • The import of multiple of Delimited Text files is not supported. Data provided in a generic latitude and longitude (unprojected) coordinate system will usually be recognized as a WGS 84 (World Geodetic System 1984 EPSG = 4326) coordinate system by the MAPublisher importers. Source Coordinate System Once the Dataset text box has been populated with a valid path, the program will read the file(s) to determine the coordinate system and display this in the Source Coordinate System section (see chapter 4 on MAP Views). If the program returns the message [No Coordinate System Specified] for the coordinate system, you may click the Specify button to specify it (MAPublisher will read the coordinate system automatically if the file format supports projection information). In the Specify Source Coordinate System dialog box, coordinate systems are separated into categories to ease the process of choosing a coordinate system. Under the Coordinate System category *All* will list all the coordinate systems in the database. For an overview of Geodetic and Projected systems and Datums see appendix A2. If you wish to view the parameters of a certain coordinate system, click the Info button. Character Encoding Extended and international character sets are supported as attributes on import. To assign a character codec suitable for your selected dataset, choose the appropriate value from the list box. Format Specific Settings Certain file formats will offer additional configuration parameters which can be accessed by clicking the Settings button. These file formats are ESRI Interchange File, CAD DWG/DXF, MicroStation DGN*, MapInfo MIF/MID, MapInfo TAB, KML, Delimited Text Data† and GML. Select your file(s) first. If the format accepts additional settings the Settings button will be enabled. See the import settings at the beginning of this chapter for an overview of the meanings of these options. * MicroStation Design file import is not supported under PPC/Rosetta operating system † Additional Settings are mandatory only for importing Delimited Text Data. Delimited Text Data Settings MAPublisher also allows for the import of delimited text files as point data provided they contain coordinate values. Delimited text import allows the user to import many different formats including: Decimal Degrees, Delimited Degrees Minutes Seconds, Degrees.Minutes, Degrees.MinutesSeconds, Packed DMS with decimals and Packed DMS (see chapter 6, for more details). MAPublisher supports the import of delimited text files that contain any of the following delimiters between data values: comma, return, end-of-line and tab. Chapter 3: Importing Map Data Simple Import 43 To import delimited text data, you must choose the Columns to use for your latitude/longitude or X and Y coordinates from the two drop-down lists. Note that only numerical columns will be listed to ease the process of determining the columns to use. If the first line of the text file you are importing contains column headings, check the Use first line as a header check box, though MAPublisher will generally automatically detect if this is the case. If the file does not appear to contain column headers, MAPublisher will assign the default headers Column1, Column2 to the attribute columns on import. Importing Data When you have your file(s) selected, and, if necessary, specified the coordinate system and/or extra settings, you can click OK to import. If MAPublisher finds there is a coordinate system already in your document which matches the incoming data, the Matching MAP View dialog box will open (see chapter 4 on MAP Views). If this dialog box opens you must choose to either add the incoming data file to a specified MAP View, or create a new MAP View to hold the incoming data. 1. If you specify Add to, choose the MAP View from the drop-down list to add your incoming data to. This option will also allow you to rescale the existing and incoming data which will comprise this MAP View in order to fit them all inside the page extents. To achieve rescaling, check the Resize MAP View to fit option. If you do not check this option, some of your data may be imported outside of the page extents. 2. If you specify Fit to page based on new MAP View, the incoming data will be treated separately from the matching data, as if it was the first import. RESULTS The data will be imported into Adobe Illustrator as individual Adobe Illustrator layers, one for each feature type in the import. The name of these layers will be the same as the name(s) of the original imported data file with the appropriate feature type extension appended. For instance importing a single polygon file named world.mif would produce a single Adobe Illustrator layer called world_area, which contains the imported file. Additionally this layer can be seen as part of a MAP View, where Adobe Illustrator layers are automatically placed as sub-features of MAP Views (in relation to specific coordinate systems). NOTE: You may receive a MAPublisher warning upon importing data exceeding the allowable 32,000 points per path in Adobe Illustrator. In this case, MAPublisher automatically simplifies the imported object and shows the following message: 44 Chapter 3: Importing Map Data Simple Import Advanced Import File > Import Map Data > Advanced and MAP Toolbar File Name - The directory path of the map file(s) to be imported Coordinate System- Indicate the coordinate system of the file to be imported. File List - This is a table where all files selected for import are listed. File Numbers - Allows the selection of individual files in order to activate the Edit and Remove buttons. Remove - Removes selected files from the list. Add - Allows the selection of files for import by opening the Advanced Import Data Source function (see below). Edit - Allows the edit of the selected file by re-opening the Simple Import Data Source function (see below). New based on - Imports all of the files to one of the coordinate systems in the File List. Details - Displays details of currently selected file: Coordinate System, Unit, Page Anchors, Scale, Map Anchors and Rotation. Use existing - Allows you to import all of the files in a coordinate system that already exists in a MAP View in the document. Auto scale - If you have multiple files in the File List, and have selected the New Based On or Use Existing options, check this box to ensure all the files fit inside the page extents when imported. Create new - Allows you to import all of the files in a new coordinate system. Clicking the Editor button opens the MAP View Editor (see chapter 4) . RELATED TOOLS Advanced Import Data Source Accessed via the Add or Edit button. Format - Select the data type you wish to import. This drop-down list shows all MAPublisher supported data types. Dataset - Displays the directory path and filename for the currently selected file(s). You can also manually type in the dataset location here. Source Coordinate System - This section allows the manual selection of the coordinate system if this information is not held in the data source. Same as - Check this option in order to assign a coordinate system that matches that of an existing MAP View. Info - Click this button to view the parameters of a selected coordinate system. Settings - Opens Settings dialog box for file formats that requires the input of extra parameters, such as for the import of DGN, DXF, DWG, E00, GML, KML, MIF/MID, Tab and Delimited Text Data (see chapter 2). Browse - Opens a Data Source browser to enable the selection of files for import. Character Encoding - Assign a codec if the attribute information held in the selected dataset uses a double byte character set. Clear - Click this button to clear the existing parameters of the source coordinate system. Specify - Click this button to open the Specify Source Coordinate System tool (see Appendix 2), enabling you to search for coordinate systems by specifying a text string. Results are displayed in the *Search* category. IMPORT SETTINGS See the Simple Import various Import Settings dialog boxes and options. Chapter 3: Importing Map Data Advanced Import 45 ADVANCED IMPORT FUNCTIONALITY Advanced Import provides an alternative method of importing map data into Adobe Illustrator. Its focus is for the map maker who has a collection of map data, that they wish to import into Adobe Illustrator at the same time. This function can deal with import of multiple formats and varying coordinate systems, with the dialog box providing a list of files flagged for import. PREREQUISITES In order to import data via Advanced Import, you must first set up your Adobe Illustrator document. Please see the guidelines for setting up your page that are included in the Simple Import Prerequisites section in this chapter. Once your page has been set up you can open MAPublisher Advanced Import. This is located under the File menu, at the Import Map Data pullout or from the MAPublisher Toolbar button or by using the keyboard shortcut, Alt+Shift+Ctrl+A. USING ADVANCED IMPORT Dialog Box Overview The dialog box itself is comprised of a list box for the display of currently selected files; buttons to Add, Remove, or Edit files for Import; and a section for the specification of an output coordinate system, whether this be in one of the files in the list, a coordinate system in the current document, or a new user specified coordinate system. Adding Files In order to select a file or files for import first click the Add button. In the Add dialog box (the same dialog box as Simple Import) you can either leave the Format drop-down list as <Auto detect format> or set the drop-down list to the file type you wish to import. If this drop-down list is left as <Auto detect format>, when you search for your GIS file, all files will be displayed. It is often easier therefore to set the Format drop-down list at the required format to ease navigation. When you have chosen the format, click the Browse button to select your file(s) and then click Open (only one file format can be opened from this Open dialog box). Alternatively you can enter the path of the file(s) in the Dataset text box. NOTE: The import of multiple of delimited text files is not supported. Character Encoding In MAPublisher 8, double byte characters are supported in attributes on import, allowing such attributes to be used for labelling and export. To assign a codec suitable for your selected dataset, choose a value in the list box. Source Coordinate System If you are aware that your selected files do not contain Coordinate System information, you can either specify it within the Advanced Import Data Source dialog box, or you can assign a coordinate system based on an existing MAP View in your document by using the Same As feature. For an overview of Projections and Datums see appendix A2. 46 Chapter 3: Importing Map Data Advanced Import Generally most users should ignore the Coordinate System section when choosing the Import files, as the program will read the coordinate system automatically if the file format supports such information. If you wish to view the parameters of a certain coordinate system, click the Info button. Format Specific Settings Certain file formats will offer additional configuration parameters which can be accessed by clicking the Settings button. These file formats are ESRI Interchange File, CAD DWG/DXF, MicroStation DGN*, MapInfo MIF/MID, MapInfo TAB, KML and Delimited Text Data†. Select your file(s) first. If the format accepts additional settings the Settings button will be enabled. See the Import Settings at the beginning of this chapter for an overview of the meanings of these options. * MicroStation Design file import is not supported under Mac PPC/Rosetta operating system. † Additional Settings are mandatory only for importing Delimited Text Data. Delimited Text Data Settings MAPublisher also allows for the import of delimited text files as point data provided they contain coordinate values. Delimited text import allows the user to import many different formats including: Decimal Degrees, DMS, Degrees. Minutes, Degrees.MinutesSeconds, Delimited DMS, and Packed DMS. MAPublisher supports the import of delimited text files that contain any of the following delimiters between data values: comma, return, end of line and tab. To import delimited text data, you must choose the Columns to use for your X and Y coordinates from the two dropdown lists. Note that only numerical columns will be listed to ease the process of determining the columns to use. If the first line of the text file you are importing contains column headings, check the Use first line as a header check box, though MAPublisher will generally automatically detect if this is the case. If the file does not appear to contain column headers, MAPublisher will assign the default headers Column1, Column2 to the attribute columns on import. Advanced Import File List Once the Dataset text box has been populated with a valid path and you have clicked OK, the program will close the Advanced Import Data Source dialog box and either read the selected file(s) to determine the coordinate system, or attach your specified coordinate system to the files. The file(s) will now be listed in the Advanced Import dialog box. You can now add more files to this list (for instance adding the next file format) by re-clicking the Add button and proceeding in the same manner as specified above. There are two columns present in the Advanced Import list. The first will display the full path of each file, and the second will display the coordinate system that has either been automatically read by the program or assigned manually. Each file added to the Import list will have a row number that can be clicked in order to select it. This function will allow you to remove a selected file from the Import list; or edit a selected file. Therefore to remove a selected file or number of selected files from the Import list click the Remove button. NOTE: The file list cannot contain a mix of known and unknown coordinate systems. Chapter 3: Importing Map Data Advanced Import 47 Changing Coordinate Systems Prior to Import If the program displays Unknown for the Coordinate System of a file, you may select the row and click the Edit button to specify it by returning you to the Advanced Import Data Source dialog box. It is not possible to import multiple files with a mix of unknown and known coordinate systems therefore the unknown coordinate systems will need to be specified. Note that you can only import the listed files in a single coordinate system, even though they may comprise of several coordinate systems. Therefore the Destination MAP View section holds the details of which coordinate system the listed files will be imported in. The destination coordinate system the file(s) will be imported into will be displayed in the panel in this section, and will show the Name of the coordinate system, its Map and Page Anchors, Scale and Angle for the selected file. These settings will be discussed more in chapter 5 MAP Attributes. Destination MAP view You have three choices when deciding the destination coordinate system for the imported files: 1. You can choose to import all of the listed files in the coordinate system and parameters that exists in one of the listed files. Click New based on and then select one of the files in the coordinate system you require. If you have multiple files in the File List, you can check the Auto scale option to ensure that when the data is imported, it is scaled to fit the current page extents. If you do not check this option, your current scale will be used and some of your data may fall outside of the page extents during the import process. 2. Choose to import all of the listed files in the coordinate system and parameters that currently exists in the document (for example via a previous import). In this case select Use existing and then select the MAP View containing the desired coordinate system. Check the Auto scale option to ensure the combination of incoming and existing data will be fit inside the page extents, i.e. existing data may be rescaled as a result. If you do not check this option, some of your data may be imported outside of the page extents. 3. Choose to assign another coordinate system completely by first selecting the Create new option, and then clicking Editor. This will open the MAP View Editor, allowing you to specify a coordinate system from a projection list and make numerous page scaling edits. For an in depth look at this tool, see chapter 4. RESULTS When you have your file(s) selected, and if necessary specified the coordinate system and/or extra settings, you can click OK to import. The data will be imported into Adobe Illustrator as individual Adobe Illustrator layers, one for each feature type in the import. The name of these layers will be the same as the name(s) of the original imported data files with the appropriate feature type extension appended. For instance importing a polygon file named county.mif and a line file named roads.shp, would produce two Adobe Illustrator layers named county_area and roads_line, which contain the imported files. Additionally these layers will be seen as part of a MAP View, where the Adobe Illustrator layers will be automatically placed as sub features of a single coordinate system, that being the singular coordinate system specified in the Destination MAP View section of the Advanced Import dialog box. 48 Chapter 3: Importing Map Data Advanced Import MAP Views and Georeferencing The MAP Views panel is the hub from which many additional MAPublisher features may be accessed. The panel itself will display the Adobe Illustrator layers that exist in the current document as sub layers of distinct coordinate systems, or MAP Views. With this tool, you can specify coordinate systems for map layers, transform coordinate systems, edit scale and data placement, merge layers, and export to GIS formats. During a standard Import process, an Adobe Illustrator layer is created for each feature type automatically, and is automatically appended with a _point, _line, _area, or _text suffix in the Adobe Illustrator Layers panel. Certain file types generate multiple layers, such as the levels found in DGN or DXF, but they are similarly split up by feature type. A single import of such files produces a single MAPublisher View as an import can only take place in a single coordinate system. Custom MAP Views may be created in order to georeference existing Adobe Illustrator artwork. The following pages deal with the creation and management of MAP Views, specifying and reprojecting a coordinate system, editing scale and data placement on the page, merging Adobe Illustrator layers, and exporting to GIS formats. The topics covered in this section are as follows: Georeferencing MAP Views Panel MAP View Editor Import MAP View Export MAP Location Tool Chapter 4: MAP Views and Georeferencing 49 Georeferencing INTRODUCTION TO GEOREFERENCING Georeferencing a non-georeferenced Adobe Illustrator file in MAPublisher can be separated into three steps: 1. 2. 3. A Source Coordinate System must be specified. The coordinate system gives a method to represent geographic points in relation to a world origin (these are also called point map, geographic, real world or spatial coordinates). MAPublisher bases its georeferencing on a tie point within an Adobe Illustrator document (artboard). The relationship between Page Anchor and Map Anchor is defined below. A Scale is necessary to translate measurements on the ground to measurements on the artboard. During the import process, the software reads the coordinate system settings from the input file and calculates a scale to best fit the map data on the page. The software treats the point at (0,0) in the document (Page Anchor) as being coincident to the lower left corner of the data in real world coordinates (Map Anchor). From this point on these two points are dynamically linked. MAPublisher uses this anchor point in subsequent data transformations, such as rescaling and transforming, but also in the creation of grids and to maintain georeferencing on export. If a coordinate system has not been defined in the source data, the Source Coordinate System has to be manually set in MAPublisher, as well as the Scale. One should not estimate this information, it is usually provided as metadata by data vendors or indicated as text on the original map. Also, anchors have to be specified manually: Map Anchor information can be entered in any coordinate system unit (for example latitude and longitude in degree), Page Anchor are entered in the document units. The most common way to set up an Adobe Illustrator page is to set the page origin (0,0) to coincide with the lower left corner of the map extents. If this information is not known, any point on the map can be used as long as its geographic location is known (e.g. a building or graticule grids on a scanned map—this information is usually given by the data provider if not obvious on the map itself ). The position in page coordinates for the same point is found using the Adobe Illustrator Info panel. Again, once the relationship between the real world coordinates and the page coordinates is established, MAPublisher will be able to perform coordinate system transformations, rescaling, plotting points etc... For further information, please refer to the appendices. See appendix A1 General Tips on Georeferencing an Adobe Illustrator file. Appendix A2 provides general information on projections and gives details of the MAPublisher coordinate systems as well as customizing options. 50 Chapter 4: MAP Views and Georeferencing Georeferencing ypage Ymap Page (0,0) xpage WORLD (0,0) Xmap Illustration of page and map anchors Chapter 4: MAP Views and Georeferencing Georeferencing 51 MAP Views Panel Window> MAPublisher > MAP Views and MAP Toolbar MAP Views - List of the distinct configurations for geospatial parameters MAP Layers - An alphabetical list of the layers that comprise each MAP View, symbolized by feature type. Lock button - Click this box to lock or unlock the Layer (mirrored in the Adobe Illustrator Layers panel). Non-MAP layers - List the Adobe Illustrator layers that are not part of a specified MAP View, and do not contain georeferencing information. Export MAP View / MAP Layer Export the selected MAP View or MAP Layer to various GIS formats. Zoom To MAP View / MAP Layer Zoom to the selected MAP View or MAP Layer data extent. Switch MAP View - Click this button to switch the selected layer from one MAP view to another. Remove GIS data moves the selected layer to [Non-MAP layers] section, discarding the geographic information and attributes in the process. New MAP View button - Create a New MAP View and specify its name and coordinate system information. Delete MAP View button - Delete the currently selected MAP View provided it does not contain any map layers. MAP VIEWS PANEL OPTIONS MENU New MAP View - Create a new MAP View and specify its name and coordinate information. Duplicate MAP View - Create a duplicate of the currently selected MAP View. Edit MAP View - Open the MAP View Editor to edit the name and coordinate system of the currently selected MAP View. Delete MAP View - Delete the currently selected MAP View provided it does not contain any Adobe Illustrator layers. Specify Anchors - For manually establishing the tie-in point between Map and Page Anchors (should only be used for new MAP Views or for the correction of georeferencing errors). Import Coordinate System From File - Imports a coordinate system from different file types including, WKT definitions (*.wkt), MAP files (*.map), ESRI projection files (*.prj), MapInfo TAB files (*.tab). Export Coordinate System to File - Exports the selected MAP View coordinate system to a WKT definition (*.wkt). Import MAP View - Import MAP Views and associated MAP Layers from other open documents. Export - Enable the export of the selected MAP View or MAP Layer to various GIS formats. Merge Layers - Combine two or more MAP Layers, as long as their attribute structures match. Ctrl key (Windows) or the Command key (Mac) to select the layers in the MAP Views panel. Layer Name Search and Replace - Search for text within layer names and specify an alternative. Useful for multilayer imports. Load Geodetic Datasource - Load an external data source in .xml format. Edit Geodetic Datasource - Open the Geodetic Datasource Editor to create new coordinate systems and edit the parameters of existing ones in the data source (see appendix A2). Preferences - Opens MAPublisher Preferences on the MAP Views Panel property sheet (see chapter 1). 52 Chapter 4: MAP Views and Georeferencing MAP Views Panel RELATED TOOLS Define Layer Automatically opens when dragging a Non-MAP layer into a specified MAP View. Feature Type -Select the type of feature that exists on the layer being dragged. This drop-down list presents a choice of Area, Line, Point, Text or Legend layer types. Base Attribute Schema on - Check this option to copy the attribute schema from an existing MAP Layer. Select the MAP Layer name in the drop-down list to copy it's attribute schema. Apply to all - If you are dragging a number of layers of the same feature type to a specified MAP View, you should check this box. Specify Coordinate System Automatically opens when dragging a MAP Layer to an alternate MAP View, and either the source or destination MAP View has an unspecified coordinate system. Select custom coordinate system - Choose this option and then click the Select button to specify the coordinate system of the named MAP View via the Select Coordinate System dialog box (see Appendix 2). Once selected, the coordinate system will be displayed below it. Same as - Choose this option in order to assign a coordinate system to the named MAP View that matches that of an existing MAP View. The coordinate system of the selected MAP View will be displayed below. Layer Name Search and Replace Specify Anchors Should only be accessed if you are creating a new MAP View, or you are correcting inaccurate georeferencing information. Caution: editing anchors can damage the accuracy of your data. Map Anchors - The location of the Map Anchors in the units of the selected coordinate system. Page Anchors - The location of the Page Anchors in the units of the current document (see File > Document Setup). Replace with - Type in the variable you wish to change the layer names to. Find what - Type in the variable contained in the current layer names on which you wish to search. Coordinate system - Specify the reference coordinate system in which the anchor coordinates are entered. Use the current MAP View's coordinate system, or specify a different one (by default, the geodetic system base of the projection or WGS84, in latitudelongitude format). Click the Select button to open the Select Coordinate System dialog box and choose any coordinate system Chapter 4: MAP Views and Georeferencing MAP Views Panel 53 OVERVIEW The MAP Views panel displays a list of all the Adobe Illustrator layers in the current document and each defined configuration for geospatial parameters (coordinate system, anchors, map scale and rotation). Every MAP Layer will be shown in this panel as belonging to a particular MAP View. Adobe Illustrator layers that do not have georeferencing information (e.g. layers existing in the document prior to import) are placed in the [Non-MAP layers] category. Categories are symbolized in the following manner: MAP View Contains layers with georeferencing and attribute information. [Non-MAP layers] Contains layers with no georeferencing or attribute information. Each layer that belongs to a MAP View is symbolized in MAPublisher panels and dialog boxes with an icon identifying its feature type: Area layer (e.g. county boundaries, urban areas, country outlines etc.) Line layer (e.g. rivers, roads, railways etc.) Point layer (e.g. town and city symbols, railway stations etc.) Text layer (e.g. text labels) Legend layer (for MAPublisher Legend items: North Arrows, Scale Bars, Grids) Layers are sorted alphabetically or per data type, as specified in the MAP Views panel MAPublisher Preferences (see chapter 1). FUNCTIONALITY MAP Views are designed to provide an easy method of accessing settings for specifying and changing coordinate systems, for editing scale and data placement on the page, and for exporting to GIS formats. Within the MAP Views panel allows for merging Adobe Illustrator layers, georeferencing existing Adobe Illustrator artwork, changing multiple layer names, and reprojecting data on the fly. USING THE MAP VIEWS PANEL Using the MAP View Editor will be discussed in detail later in this section. Reprojecting MAP Layers via MAP Views Panel The MAP Views panel can be used to move Adobe Illustrator layers from one MAP View to another, enabling you to reproject vector art* quickly. Layers can be moved via drag-and-drop or with the new Switch MAP View button . * Raster imagery cannot be reprojected with MAPublisher. For example, if you have two imported data layers, one in UTM projection, and the other in latitude/longitude, MAPublisher will produce two distinct MAP Views, each holding the associated MAP Layer. If you wish to reproject the layer which is in UTM into Lat/Long, drag it from the UTM MAP View and drop it into the Lat/Long MAP View. MAPublisher will automatically reproject and scale artwork on the layer to match the destination MAP View. 54 Chapter 4: MAP Views and Georeferencing MAP Views Panel When reprojecting in this manner, and either the origin or destination MAP View does not contain a defined coordinate system, the Missing Coordinate System dialog box is displayed offering the two options: 1.Specify custom coordinate system to specify the projection of the named MAP View, via the Source Coordinate System function. 2.Same as to specify the coordinate system of the named MAP View by choosing a coordinate system which already exists in a MAP View in your document. NOTE: Many transformations will inherently cause the loss of precision by the very nature of the complex mathematical calculations that must be performed. Additionally there are differences in precision between MAPublisher and Adobe Illustrator. MAPublisher calculations are in 64-bit for accuracy, but the results still must be stored as 32-bit for Adobe Illustrator. As a result, please be aware that you may lose precision if you drag repeatedly from one coordinate system to another. When determining a coordinate system to use via the drag method, we strongly recommend to use Edit > Undo to revert coordinate systems until you find the appropriate system for your data. Creating New MAP Views To create a new MAP View click New MAP View under the panel options menu or click the New button at the base of the panel. This will automatically open the MAP View Editor, which will be discussed in the MAP View Editor section, allowing you to set up a coordinate system, and enter values for scale, rotation, and page anchors. After you have created a new MAP View, you must use the Specify Anchors option from the MAP Views panel to define the tie-in point between Map Anchors and Page Anchors. Specify Anchors The Specify Anchors function should only be accessed when referencing a new MAP View (for example in the process of georeferencing an Adobe Illustrator file, see appendix A1) or to correct an inaccurate referencing. The MAP Anchors are entered in the unit of the selected coordinate system. MAP Anchors coordinates must be known from information written on the map (e.g. graticules crossing) or from external source (metadata, survey points or other). When the Use Current MAP View's coordinate system option is toggled, MAP Anchors coordinate values are entered in the current MAP units of the coordinate system of the MAP View. When the Use: XXXX option is toggled, the Select button will become enabled. Clicking the Select button will open the Select Coordinate System dialog box. Choose any coordinate system, the coordinates values entered will be in the unit (Point Style) for this coordinate system. When the selected or default coordinate system is projected, X and Y coordinates are entered in the unit (Point Style) of the coordinate system (e.g. metre, kilometre, feet). When the selected or default coordinate system is Geodetic, Lat and Long coordinates are entered in degrees. NOTE: When the current MAP View coordinate system is a projected system, the default system specified in Use:XXXX is set to the geodetic system base for the projection. For example, if the MAP View's system is the US State Plane NAD83 / Colorado North (ftUS), the default alternative system is set to NAD83 (to enter the latitude/longitude coordinates in degrees). The Page Anchors are entered in the current unit of the document. This unit can be changed through the Adobe Illustrator menu File > Document Setup. Positions of points on the document in page coordinates are determined using the Adobe Illustrator Info panel (menu Window > Info). Chapter 4: MAP Views and Georeferencing MAP Views Panel 55 Layer Name Search and Replace The MAP Views options list also provides a Search and Replace function, enabling the quick change of names of multiple Adobe Illustrator layers. For example MicroStation Design or CAD imports may contain a large number of similar named layers. This option will allow you to quickly change the names of all layers that contain a specified character string. Merge Layers This panel also provides a fast way of merging Adobe Illustrator layers. If you have more than one layer in a MAP View that contain the same attribute structure and data type, this option will allow them to be merged into a single layer. For example your data may have been received in pieces, and you therefore find it occupying multiple layers in Adobe Illustrator. Press the Ctrl or Shift keys (Windows) or the Command or Shift keys (Mac) and click the layers in the MAP Views panel and click the option for Merge Layers. The layers will then be merged to provide a single layer holding the data and its associated attributes. Creating New Layers to Hold Additional Features In order to plot points, generate text, use legends, or plot grids, scale bars and north arrows, you will first be required to create extra Adobe Illustrator layers to hold this information. This is due to the fact that layers cannot contain more than one feature type. Therefore, prior to generating these additional map features, you need to first create a layer in the Adobe Illustrator layers panel on which these features will be held. Subsequently in the MAP Views panel you should move these layers into the MAP View which contains the coordinate system you require to plot the extra features. The Feature Type you should specify for these features in the Define Layer dialog box are as follows: for Text items. Feature Text Label and MAP Tagger (chapter 10) require you have a Text layer for output. for Point symbols. Point Plot (see chapter 6) will not function without a Point layer selected. for Legend items. Grids and Graticules (see chapter 13), Scale Bars and North Arrows (see chapter 14) must be placed on Legend layers. Zoom to MAP View / Zoom to MAP Layer Use these functions to zoom to the selected MAP View or MAP Layer in the MAP Views panel. This is particularly useful for files containing a large number of layers. Assigning Georeferencing Information To Adobe Illustrator Layers Similarly, existing Adobe Illustrator layers that do not contain georeferencing or attribute information will also appear in this panel under the default MAP View entitled Non-MAP layers. Such layers can be quickly moved into a specified MAP View with a matching coordinate system. When moving a non-map layer into a specified MAP View you will be prompted by the Define Layer dialog box to specify the feature type of the layer you are moving. Multiple layers may be selected and moved together to a specified MAP View. Use the Apply to all function in the Define Layer dialog box if the type is identical for all layers to be moved. The Advanced option Base attribute schema on allows you to copy the attribute schema from an existing MAP Layer (see chapter 5 for details). 56 Chapter 4: MAP Views and Georeferencing MAP Views Panel Duplicating And Deleting MAP Views MAP Views can be duplicated. For example, to create inset maps make a duplicate and drag some MAP Layers into the duplicated MAP View. Then use the MAP View Editor to edit the placement, scale or coordinate system of the duplicate. MAP Views that do not contain any MAP layers can be deleted. Both of these tools are accessed in the panel options menu of the MAP Views panel. You can also delete a MAP View by clicking the Delete button at the base of the panel. Note that these functions act on MAP Views only, and not MAP Layers. Removing MAPublisher Information At the end of the project cycle it may be useful to permanently remove all georeferencing and attribute information in the current document. This can now be accomplished by switching your MAP Layer(s) to the [Non-MAP layers] category in the MAP Views panel via drag and drop or click the Switch Map View button and the Remove GIS data... option. NOTE: This function should only be used as a final step as all attributes and georeferencing will be removed leaving a standard Adobe Illustrator file devoid of all map information. Be sure to save a copy of your file before performing this operation. Chapter 4: MAP Views and Georeferencing MAP Views Panel 57 MAP View Editor MAP Views panel > Edit MAP View / New MAP View, Advanced Import > Create New > Editor Zoom buttons - zoom in/out or fit to the extents of the map view. Preview Pane - Displays the data extents of the MAP View: White rectangle - Artboard extents. Green rectangle - Data extents of the current MAP View. Previews - Select the preview options: None, Coloured Boxes, Thumbnails, Thumbnails and Boxes Crosshair - Location of the current Map and Page Anchors. Scale - The scale of the MAP View. Edit the scale manually or by using the Up and Down arrows to increase or decrease scale by 10% Click the Auto Scale button to rescale the data to fit the page extents. Show Anchors - Click this box to view or hide the Map Anchors and Page Anchors in the Preview Pane. Name - The editable name of the current MAP View. Data Extents LL Corner - Editable location of the lower left corner of the data in document units. Angle - The rotation of the MAP View. Edit the angle manually or by using the clock hand in the rotation control graphic. Alignment Control - Click the respective anchor point to set the Page Anchors to a graphically designated location. Perform Coordinate System Transformation Check this box to transform your data from your source coordinate system to a selected destination coordinate system Same as - Check this option to transform to a coordinate system that matches that of an existing MAP View. Clear - Click this button to clear the existing parameters of the source coordinate system. Specify Source Coordinate System - If your MAP View does not currently contain a coordinate system, click here to assign one by opening the Specify Source Coordinate System tool. Specify Destination Coordinate System Click this button to open the Specify Destination Coordinate System (right), then specify the destination coordinate system for the resulting transformation. Info - Click this button to view the parameters of a selected coordinate system. Specify Datum Shift - Click this button to specify a new datum shift FUNCTIONALITY The MAP View Editor can be accessed as part of the Advanced Import process (chapter 3) or from the MAP Views panel. To access via the Advanced Import process, click the Create new option in the Destination MAP View section, and then click the Editor button to open the dialog box. From the MAP Views panel select the MAP View you wish to edit, and then select Edit under the Options arrow in the upper right corner of the panel. Conversely you can double-click the MAP View to open the MAP View Editor. The MAP View Editor has a variety of purposes. It will allow you to transform coordinate systems, change scale, edit data positioning in the document, change rotation values, and rename MAP Views. Any or all of these functions can be achieved with a single visit to the MAP View Editor. There is also a preview pane where you can see how the edits made to data will affect its extents in the document. USING THE MAP VIEW EDITOR Preview Pane By default, the Preview Pane displays the data extents with a green rectangle and the MAP View orientation with an arrow pointing north. The Previews option allows you to change the preview to None (default green rectangle), Coloured boxes (previews up to 10 MAP views, symbolized with rectangles of different colours as specified in the 58 Chapter 4: MAP Views and Georeferencing MAP View Editor MAP View Editor MAPublisher Preferences, see chapter 1), Thumbnails (preview a reduced image of the document contents, including all MAP views) and Thumbnails and boxes (shows both thumbnails and coloured boxes of up to 10 MAP views in the document). You can click inside the green rectangle and drag to move the data to a more suitable position within the page. Use the Zoom In, Zoom Out and Center buttons to set the magnification of the preview. NOTE: Due to Adobe Illustrator rasterization limitations, thumbnails cannot be displayed when a very large MAP View is present in a file. MAP View Name The current name of the MAP View is listed in the Name text box, which you can edit if desired. Whether the MAP View Editor is accessed via Advanced Import, or from the MAP Views panel, editing the name here will change the name of the resultant or existing MAP View. Page Anchors Current page anchors are displayed in the Data Extents LL (Lower Left) Corner X/Y text boxes, in the current document units. As discussed in the section on georeferencing at the beginning of this chapter, the default page anchors are 0,0 in document units. Editing the page anchor values will move the data relative to the lower left location of the data. Entering negative values will move the data to the left or down, entering positive values will move the data to the right or up. There are also two graphical ways to edit page anchors. Firstly the data can be assigned to respective positions in the document by clicking a respective Alignment Control button, of which there are nine positional options. Conversely dragging the green data preview rectangle around the page in the Preview Pane will update the Page Anchor values accordingly. Note that editing Page Anchors will not affect data integrity. It simply means that the lower left corner of the data in coordinate units (Map Anchors) is located at this new document position. Scale The scale of the current MAP View is shown in the Scale text box. For MAP Views in projected coordinate system, the scale value is a real world scale (exact ratio linear distance on the page over distance on the ground). For MAP Views in geodetic coordinate system (i.e. Lat/Long format in angular unit), the scale value is approximated using the common formula 1°= 111.353m (metres per degree at the equator). This is not an accurate number because the formula is only valid at the equator, but it is more intuitive for cartographic considerations. This text box is editable allowing you to quickly specify an alternate scale. Furthermore the up and down buttons will allow you to fine tune scales by increasing or decreasing a scale by 10% of the starting value. The Auto Scale button will allow you to quickly fit the data to the page extents. Clicking this button will edit the scale and page anchors so that it is located in the centre of document. Transforming a Coordinate System To transform to another coordinate system in the MAP View Editor the Perform Coordinate System Transformation box must be checked. Clicking the Specify button in the Perform Coordinate System Transformation frame opens the Specify Destination Coordinate System dialog box. In the Specify Destination Coordinate System dialog box, coordinate system folders are organized into geodetic and projected systems and then generally according to continents and countries, to ease the process of choosing a Chapter 4: MAP Views and Georeferencing MAP View Editor 59 coordinate system. When a folder is selected, the list on the right shows the coordinate systems belonging to this folder. When the *All * folder is selected the view lists all of the coordinate systems in the database and if you click this folder, it may take some time to choose the one relevant to your MAP View. The MAP View Editor also offers a check box to enable you to select a coordinate system that already exists in the document. The Same as drop-down list will allow you to select from a list of existing georeferenced MAP Views. This function can be used to set all the MAP Views of a document to a same coordinate system, while they keep a different position on the page. Again the Preview Pane will display the new data extents for any new coordinate systems specified in the MAP View Editor. To match coordinate systems across a number of MAP Views, move the Adobe Illustrator layers into the MAP View containing the coordinate system you require, as discussed in the MAP Views panel section. If you wish to view the parameters of a certain coordinate system, click the Info button. To edit a coordinate system please refer to appendix A2. Assigning a Coordinate System To set the current coordinate system of the data, rather than change coordinate system, you can click the Specify button in the Source Coordinate System frame of the MAP View Editor. You must use caution, as this option will set source coordinate systems only, and not serve to reproject your data. Therefore data integrity may be lost if you overwrite the current coordinate system of the MAP View via the use of this utility. In the Specify Source Coordinate System dialog box, coordinate systems are separated into folders to ease the process of choosing a coordinate system. Choose the folder *All* to list all the coordinate systems in the database. If the coordinate system needed cannot be found, then enter a text string in the search text box to query the database for coordinate systems. The results are displayed in the *Search* category. For an overview of projections and datums see appendix A2. Searching For a Coordinate System The Specify Source/Destination Coordinate System dialog box allows you to search for coordinate systems based on an entered text string. Searches can be performed on the whole database, or solely in continent and country sub-folders. To use the Specify Coordinate System type a search term into the text box located at the bottom of the dialog box and click the search button. In the Find: text box enter the text on which to search. For example to find coordinate systems with NAD83 properties, enter NAD83 . Following the Find: text box is the in text box to select an area of the database in which to search. For example to find NAD83 in the name only, select Names. When you have entered the search criteria, click the Search button. If the search has returned results, these results will be displayed in the Specify Coordinate System dialog box in the *Search* folder, and can be immediately selected in order to reproject your data or to assign a coordinate system. Search results will be stored in this folder until you restart Adobe Illustrator or perform another Coordinate System Search. NOTE: If you do not find an appropriate coordinate system, you can edit or create a new one in this interface. To do this, please refer to appendix A2. Rotation A rotation figure can be applied or edited by specifying an angle in the entry field, or by using the clock hand to rotate the MAP View graphically. Notice that changes to rotation will be automatically previewed in the Preview Pane with the green rectangle and arrow depicting the new orientation of the data. 60 Chapter 4: MAP Views and Georeferencing MAP View Editor New MAP Views The MAP View Editor is opened by default when creating a New MAP View. This will enable you to quickly specify the name, coordinate system and page scaling for your new MAP View. This functionality will be discussed in detail in Georeferencing an Adobe Illustrator file in appendix A1 General Tips. After a new MAP View is created, the Specify Anchors option from the MAP Views panel must be used to define the tie-in point between Map Anchors and Page Anchors. Map Anchor coordinates can be entered in any chosen coordinate system (for example, latitude and longitude in degree for projected map). IMPORTANT NOTES FOR ADOBE ILLUSTRATOR CS4 USERS Adobe Illustrator CS4 introduced the concept of multiple artboards (up to 100). MAPublisher 8 takes this new feature into account in the MAP View Editor. When using Adobe Illustrator CS4, the MAP View Editor dialog box has an additional drop-down list to select the Active Artboard. When this section of the dialog has focus, the Preview Pane displays the number of each artboard. The current active artboard is shown in white, while the others are grayed out. The Data Extents LL Corners and Scale calculations are based on the Active Artboard dimensions. To move the data extent (green box in the Preview Pane) from one artboard to another, change the Active Artboard number to the artboard where the data is to be moved, then click the Auto Scale button or one of the Data Extents LL Corner boxes. Artboards- Preview of the artboards present on the canvas. Active Artboard - White background. Other Arborads - Grayed out. Active Artboard- Select the number of the artboard to be set as Active NOTE: Adobe Illustrator CS4 allows users to move artboards. However, this action does not preserve the georeferencing (same effect as moving arts on the active artboard). Instead of moving the artboard, users must do the following: • Create a new artboard at the desired position on the canvas. • Open the MAP View Editor and move the data from the initial artboard to the new one (see explanation above). • Delete the initial artboard. Chapter 4: MAP Views and Georeferencing MAP View Editor 61 Import MAP View MAP Views panel > Import MAP View From Document Document list - List of open documents and the MAP Views contained in them. FUNCTIONALITY MAPublisher Import MAP View copies a MAP View from one document to another, including all the layers that are within that MAP View. This can be a useful tool when merging parts of several documents into a single document. An example might be to import a commonly used inset map. PREREQUISITES At least two documents must be opened to use Import MAP View. The active document does not need to contain any MAP View, but the second document must at least contain one MAP View. To access the function, click the Import MAP View from Document... item in the MAP Views panel options menu. IMPORTING A MAP VIEW The Import MAP View dialog box will show all other documents currently open, along with all the MAP Views they contain. Simply select the MAP View you wish to import into the current document, and click OK to import the MAP View and MAP Layers. 62 Chapter 4: MAP Views and Georeferencing Import MAP View Export MAP Views panel > Export and buttons (MAP View) (MAP Layer) Settings - Opens a Settings dialog box for the input of extra parameters (see below). Format - Select the export format for the selected layer or MAP View. Browse - Opens a Data Source browser to enable the selection of an export directory. Dataset - Displays the directory path for the export of the currently selected layer or MAP View. You can also manually type in the dataset location . Character Encoding - Assign a codec if the attribute information held in the selected layer or MAP View uses a double byte character set. EXPORT SETTINGS General Settings Keep format extension - Check this option to export layers with their feature extension (_area, _line, _point, or _text) which may have been appended to layer names during import. AutoCAD Settings Export visible attributes only - Check this option to export only the attributes that are currently visible in the MAP Attributes panel. Delimited XY Text Data Settings MicroStation Settings Include header - Add the column headers at the first line of the exported text file Release Version - Specify the AutoCAD version number you wish to export to. Area Fills - Controls whether or not fill linkages will be written out for ellipses, shapes, and solids. Coordinate Units - Specifies how feature coordinates will be interpreted and converted (Master, Sub or Units of Resolution). MIF/MID Settings Delimiter - Set the fields delimiters to either comma or semicolon E00 Settings E00 Compression Level - Set the compression of the exported E00 file (default is None). KML Settings Do not export attributes - Check this option for export to KML to be used in Google Maps (Google Maps does not support KML files with attribute values). Chapter 4: MAP Views and Georeferencing Export 63 FUNCTIONALITY MAPublisher supports the export of single MAP Layers or whole MAP Views to various GIS formats, maintaining all georeferencing and attribute information. The following export formats are supported: CAD (*.dxf ) (*.dwg) Delimited Text Data (*.csv) (*.tsv) (*.txt) ESRI Interchange File (*.e00) ESRI ArcInfo Generate (*.gen) ESRI Shapefile (*.shp) GML (Simple Features 3.1.1) (*.gml / *.xsd) KML (*.kml) MapInfo MIF/MID (*.mif / *.mid) MapInfo TAB (*.tab) Microstation Design (*.dgn) NOTE: Exporting a MAP View to CAD or MicroStation format will assemble all hosted layers into a single file. PREREQUISITES The Export function will export a single selected Adobe Illustrator layer contained in a MAP View or all layers contained in a specified MAP View. Therefore both imported and user created MAP Views will contain MAP Layers that are suitable for export to GIS formats. USING MAP EXPORT Export a MAP View To export all the MAP layers within a single MAP View, select the MAP View to be exported in the MAP Views panel, then click the button . Alternatively, click Export “<MAP View name>” in the panel options menu. Export a MAP Layer To export a single layer, select the MAP Layer you wish to export in the MAP Views panel, then click button Alternatively, click Export “<Layer name>” in the panel options menu. . NOTE: You cannot export multiple MAP Views or multiple layers that have been selected individually. Only a single MAP View or a single layer can be exported at one time. Within the dialog box select the export Format you require, and then click the Settings button. Keep Format Extension The MAP Layer or MAP View you are exporting will be the default name of the exported file. However the feature type text (i.e. _area, _line, _point, or _text) appended to Adobe Illustrator layers by MAPublisher in the Import process, will be removed during the export process, unless you specify that you wish to keep this. If you wish to keep the feature type text, check the Keep format extension option. 64 Chapter 4: MAP Views and Georeferencing Import MAP View Export Visible Attributes Check this option to export only the attributes that are currently visible in the MAP Attributes panel. If this option is not checked, all attribute columns (including MAPublisher #Property attributes) will be exported. Format Specific Settings Depending on the select export format, additional specific settings may be available. This is the case for the following formats: AutoCAD, Delimited XY Text Data, MicroStation, MID/MIF, E00 and KML. See the Export Settings above. Choosing a Destination Folder Most of the export formats will require the selection of a destination folder only. For export to ESRI or MapInfo formats, click the Browse button to specify a destination folder. Click the OK button to export your MAP Layer. In the case of exporting to AutoCAD format you will be required to specify a name for the exported file, and select the file extension (DXF or DWG) to be used. For MicroStation formats, you will be required to specify a name for the exported file. If you wish to export to either of these formats, click the Browse button to name the export file, and then choose the file format from the Format drop-down list. ADDITIONAL NOTES Valid Area Direction (Area Layer Exports) When exporting Area layers to GIS formats, polygon outlines must have a positive Area value, whereas holes held inside compound paths (or complex shapes) must have a negative Area value. If you have values for polygons in the #Area property column of your MAP Attribute table which contradict these guidelines, you can use the following tools to convert the MAPublisher area calculation from a negative to a positive value or vice versa: • Flip Lines tool (chapter 8) for convert multiple areas: • Create a Selection Filter (chapter 11) to select all elements that have an #Area of less than zero (to select negative values) or greater than zero (to select positive values). Then start the Flip Lines function. • #AreaDirection property value (chapter 5) for convert areas one by one: • Select the area to edit and then choose the alternate value for #AreaDirection in the MAP Attributes panel. #TEXT Property (Text Exports) It is not possible to export values in the #Text property column. An alternative is to create a new string attribute column and assign it an expression of #Text. See Edit Schema in chapter 5 on MAP Attributes. Add/Edit Geodetic Datasource Please see appendix A2 for further information on how to edit the geodetic datasource. Chapter 4: MAP Views and Georeferencing Import MAP View 65 MAP Location Tool MAP Toolbar, or Tools> MAP Location Tool and Window > MAPublisher > MAP Location Displays the parameters of the currently selected layer. Latitude/Longitude - The latitude and longitude coordinates of the cursor in degrees (based on the geodetic datum of the coordinate system). WX/WY - The X and Y coordinates of the cursor in current map units. Angle - Angle of Rotation. Scale 1: - Scale of the current layer. Page X/Y - Page Anchors. Map X/Y - Map Anchors. Coordinate System - Coordinate system of the layer, if specified. Units - Units of the coordinate system, if specified. Copy Notification - When the MAP location tool is selected on the tool bar, you will see this text, enabling you to copy the current X and Y coordinates of the mouse cursor. FUNCTIONALITY The MAPublisher Location Tool displays the coordinates of the mouse cursor on the selected map layer in current Map Units and in Degrees. Latitude and longitude values are in reference to the geodetic datum set in the coordinate system definition. When no georeferencing is present on the selected layer, the dialog box will display the coordinates in Page Units. The dialog box will also display the Map and Page Anchors, the Scale, Angle of rotation, and the Coordinate System and Units of the MAP Layer. The MAP Location Tool also enables the X and Y position of the cursor in the current map units (WX and WY) to be copied to the clipboard. An example of a use of this function is that it enables you to build point files in an external text editor; files which can then be re-imported with MAPublisher. Coordinates are copied with the X value first and Y value second, and are delimited by a comma. For example: -79.396527,43.631979 USING THE MAP LOCATION TOOL To use the MAP Location Tool, click the button in Adobe Illustrator Tools panel or on the MAP Toolbar, or open the panel through Window > MAPublisher > MAP Location. With the cursor scroll around your map document, and note how the map units update with the location of the mouse. With the MAP Location Panel open the values will be constantly updated regardless of the tool that is selected. When the MAP Location Tool button is enabled in the Adobe Illustrator Tools panel, users are able to copy the coordinates of a specific location. The appropriate layer must be selected in the MAP Views panel, the MAP View containing the layer will determine the MAP Units and coordinate system used to display the positions. To copy the positions: • Position the cursor at the desired location. • Click the document while holding the Shift key. The X and Y position in map units are copied to the clipboard and can be paste into any text editor. Only one set of coordinates can be copied at once. When shift+click is used again, the values copied previously will be overwritten. NOTE: When the cursor is placed outside of the MAP View extent of the selected layer, positions values are indicated as Unavailable . 66 Chapter 4: MAP Views and Georeferencing MAP Location Tool MAP Attributes MAPublisher can import GIS files into Adobe Illustrator while retaining both geographic vector and attribute information and makes it very easy to produce high quality maps. This section explains the principles of attribute information and how these are maintained within MAPublisher. Topics covered in this section are: Attributes Foreword MAP Attributes Panel Edit Schema Edit Expression Find & Replace Attributes Apply Expression Join Table Export Attributes Chapter 5: MAP Attributes 67 Attributes Foreword ATTRIBUTE INFORMATION The attribute table that forms part of a GIS map file is one of the most important parts of any data set. It is in the attribute table that we find important information such as street names for lines, zoning or zip code numbers for areas and elevations for points to go along with our vector line, area or point data. Along with vector line, area and point data imported as explained in the previous sections, MAPublisher also imports the attribute data table associated with any vector map file that it supports. MAP LAYERS Throughout this guide, an Adobe Illustrator layer containing georeferencing and/or attribute information will be referred to as a MAP Layer. Each MAP Layer which can contain attribute information is symbolized in MAPublisher panels and dialog boxes with an icon depicting its feature type: Area layer (e.g. county boundaries, urban areas, country outlines etc.) Line layer (e.g. rivers, roads, railways etc.) Point layer(e.g. town and city symbols, railway stations etc.) Text layer (e.g. text labels) MAPUBLISHER #PROPERTY ATTRIBUTES In addition to the attribute values that were created upon data import or within a work session, Area, Line, Point and Text layers are also assigned a number of additional MAPublisher attribute columns. These property columns (prefixed with a #) are designed to indicate the physical properties of map art on the Adobe Illustrator canvas. Art can be modified directly from the attribute table by making edits to values in these columns. The following property columns are attached to valid map layers in this version of MAPublisher: Area layers #ID #Name #AreaDirection #VertexCount #Style #StrokeWeight #Perimeter #PathClosed #ArtScale #Area 68 describes the internal unique ID to refer to Adobe Illustrator artwork within the document. There will never be two pieces of artwork with the same #ID value at the same time. This property cannot be set. describes the name of the polygon. Editing this property will change the name in the Layers panel. describes the direction as clockwise or counter-clockwise. Editing this value will reverse the direction accordingly. describes the number of points in the art. This property cannot be set. describes the Graphic Style in use. Editing this property will apply the selected style to the art. describes the stroke weight of the path. Editing this property will alter the stroke weight of the art. describes the perimeter of the area in world units. This property cannot be set. describes whether or not the path is closed (yes or no). Editing this value will open/close the path. describes the scaling of the line stroke. Editing this value will scale the stroke weight. describes the area of the path in world units. This property cannot be set. Chapter 5: MAP Attributes Attributes Foreword Line layers #ID #Name #VertexCount #Style #StrokeWeight #PathClosed #Length #ArtScale describes the internal unique ID to refer to Adobe Illustrator artwork within the document. There will never be two pieces of artwork with the same #ID value at the same time. This property cannot be set. describes the name of the polygon. Editing this property will change the name in the Layers panel. describes the number of points in the art. This property cannot be set. describes the Graphic Style in use. Editing this property will apply the selected style to the art. describes the stroke weight of the path. Editing this property will alter the stroke weight of the art. describes whether or not the path is closed (yes or no). Editing this value will open/close the path. describes the length of the path in world units. This property cannot be set. describes the scaling of the line stroke. Editing this value will scale the stroke weight. Point layers #PageX #PageY #ID describes the x-coordinate in the document units of the current point. describes the y-coordinate in the document units of the current point. describes the internal unique ID to refer to Adobe Illustrator artwork within the document. There will never be two pieces of artwork with the same #ID value at the same time. This property cannot be set. #Name describes the name of the point. Editing this property will change the name in the Layers panel. #HorizontalScale describes the horizontal scaling of a point object. Editing this value will scale the symbol in the X axis. #VerticalScale describes the vertical scaling of a point object. Editing this value will scale the symbol in the Y axis. #Rotation describes the rotation in degrees of the art around its anchor point. Editing this value will rotate art. #Style describes the Symbol in use. Editing this property will apply the selected symbol to the art. #MapX describes the x-coordinate in the world units of the current point. #MapY describes the y-coordinate in the world units of the current point. Text layers #PageX #PageY #ID #FontSize #FontFamily #Name #Text #TextLength #Rotation #Style #PageX #PageY describes the x-coordinate in the document units of the current point text. For text-on-a-path or text-in-apath, this will be the x-coordinate of the first vertex on the associated path. describes the y-coordinate in the document units of the current point. For text-on-a-path or text-in-a-path, this will be the y-coordinate of the first vertex on the associated path. describes the internal unique ID to refer to Adobe Illustrator artwork within the document. There will never be two pieces of artwork with the same #ID value at the same time. This property cannot be set. describes the font size used by the text. describes the font family used by the text. describes the name of the text field. Editing this property will change the name in the Layers panel. describes the contents of the text. Editing this property will edit text on the page. describes the number of characters in the contents of the text art. This property cannot be set. describes the rotation in degrees of the art around its anchor point. Editing this value will rotate art. describes the Character Style in use. Editing this property will apply the selected style to the art. describes the x-coordinate in the world units of the current point text. For text-on-a-path or text-in-a-path, this will be the x-coordinate of the first vertex on the associated path. describes the y-coordinate in the world units of the current point. For text-on-a-path or text-in-a-path, this will be the y-coordinate of the first vertex on the associated path. Warning - #ID property is not persistent; if you save a document and re-open it you will find that the #ID has changed. The value will usually not change over the life of a document session, but there are Adobe Illustrator operations that can cause the value to change. Chapter 5: MAP Attributes Attributes Foreword 69 IMPORTANT ADOBE ILLUSTRATOR COMPATIBILITY NOTES Some Adobe Illustrator functions may cause the link between artwork objects and their attributes to be broken, resulting in possible data loss. These functions are: • Compound path (Make) • Pathfinder • Live Paint • Gradient mesh • Blob brush (Adobe Illustrator CS4) If required, users should first duplicate their working layer in the Adobe Illustrator Layers panel before using these functions. The original layer can be kept for labelling (see chapter 10) or for information purposes. 70 Chapter 5: MAP Attributes Attributes Foreword MAP Attributes Panel Window > MAPublisher > MAP Attributes and MAP Toolbar Click header to sort column values alpha/numerically. Click and drag separator to resize the columns. Edit Column - Edit the properties of the selected column. Delete Column - To delete the currently selected column. Layer Selection - If data is selected on a number of layers, select the map layer containing the attributes to be viewed with this list. Export attributes - export all selected attribute information to a delimited text file (comma, space, tab or semi-colon separated). Preferences - Opens MAPublisher Preferences on the MAP Attributes Panel property sheet (see chapter 1). Attributes and Properties Attribute and property values on the selected layer are displayed here. Join Table - Click to join an external data table to the current attribute table. Selected objects - Number of objects selected on the current layer.. Hide Column - To hide the currently selected column. New Column - To add a new column to the attribute table. Right-click (Windows) or Ctrl-click (Mac) on a column to display this menu. Show/Hide Columns - Select or un-select column names to show or hide columns. You can also choose to show all columns, or hide all columns Highlight Feature - Click the feature attribute to highlight that feature on your map. Apply Expression - To assign attribute values or graphical properties to selected art via the input of an expression. Find & Replace - Click to find and replace attributes in the current attribute table. Edit Schema - To edit the properties of all columns comprising the current attribute table: i.e. edit column names, visibility, type and width, or assign expressions to columns. Zoom to Feature - Click the Feature number or right click the attribute and select Zoom to Feature. FUNCTIONALITY The MAP Attributes panel displays the map attribute and property attribute records for a map layer, which are linked to the map’s graphic elements, and makes them available for editing. This panel is also the hub from which you can edit column schemas and visibility, add or delete columns, join tables, find and replace attributes, and apply expressions to selected art. Only the visible attributes of selected map features will be displayed in the dialog box. USING THE MAP ATTRIBUTES PANEL Viewing Attributes Selected features are sorted per layer. The Layer drop-down list shows all the layers that currently have features selected, as well as the number of selected map objects for each layer (also reported at the base of the panel). The attribute values displayed in columns in the MAP Attributes panel can be sorted in ascending or descending order by clicking the column header. The widths of the columns may be changed by clicking the column separator and manually dragging it to resize as desired. Chapter 5: MAP Attributes MAP Attributes Panel 71 The type of attribute is indicated by an icon preceding the column name : Boolean - columns contain True or False values Integer - columns contain only whole numbers (limited to 10 digits) Real - columns contain numbers carrying decimal values String - columns can contain attributes that are both alpha and numeric Editing Attributes MAPublisher MAP Attributes panel is a fully editable spreadsheet environment. All attribute values may be edited except for certain MAPublisher Property attributes (see earlier in this chapter). To change the value of a cell, doubleclick within the cell and enter the new value such as you would in a spreadsheet program. Keep in mind that entered values must correspond with a column’s type (i.e. only enter numbers into a column of type Real or Integer). The edits will immediately be reflected in the map documents database records. Existing attribute records may also be edited or modified by performing a find and replace operation on them. Column Visibility Click the Show/Hide Columns button (or Right-click (Windows) or Ctrl-click (Mac) on a column in the dialog box) to edit the column visibility, either toggling visibility for individual columns or for all columns. It is also possible to edit the visibility of attribute columns with the Edit Schema tool. Zoom To and Highlight Feature To zoom into a specific feature in the attribute table, select a single attribute and click the Zoom to Feature button. This will automatically fit this feature to the screen and highlight it—allowing to examine it closer or to simply locate it on the map. To highlight a specific feature on the page maintaining the current zoom level, click one attribute of that feature. Property Attributes The attribute table can also be configured to display property attributes for datasets. These attributes describe the current assignment of graphical properties such as the stroke weight, style, rotation and scale. These fields are editable and provide the ability to modify a map objects graphical properties directly within the context of the MAP Attributes panel. To edit a property attribute for a particular map object, either double-click within the appropriate property cell and directly enter a value or choose from an available drop-down list depending on the property type being edited. Once these changes have been entered into the MAP Attributes panel, the modified art elements are graphically updated within the map to reflect these changes. 72 Chapter 5: MAP Attributes MAP Attributes Panel Edit Schema MAP Attributes panel > Edit Schema / Edit Column / New Column Name - Edit the name of the selected column here. Display Label- Edit the column label displayed. Up / Down - Click the appropriate button to move the selected column up or down the hierarchy. Type - Edit the column type here: choose from Integer, Real, String or Boolean. Column list - Attribute and (#) property columns on the current layer are listed here. Select a column here to edit its properties on the right. Size / Decimals - Edit the size of String type or amount of decimals of Real type. Default Value - Assign the same value to all items in the selected column if required. Add - Click to add a new column to the column list. Remove - Click to delete the selected column. Visibility - Choose to show or hide the selected column by editing this option. Derive value from expression - Check this option to assign an expression to the selected column. Either enter the expression directly into the entry field, or click the Browse button to access the Edit Expression function. Read-only - Check this option to ensure that values in this column can not be edited. In MAPublisher, the term schema is used to define the structure and makeup of the map attributes table. FUNCTIONALITY The Edit Schema function allows to edit and manage various components of the data’s map attribute structure, including creating, editing and deleting columns, setting visibility preferences, and assigning expressions. Any changes made to the schema will instantly be reflected in the MAP Attributes panel. USING EDIT SCHEMA Select an object of the MAP Layer containing the attributes to be edited. It gets selected in the MAP Attributes panel. Access the tool by clicking the Edit Schema button or menu item in the MAP Attributes panel options menu. Edit Schema lists all of the columns which currently exist in the MAP Layer attribute structure, including MAPublisher Property attributes (see previous section). By default, imported or created attributes will be visible, whereas property columns will not be shown by default. Please note some #Property column structures cannot be edited (read only). Editing Column Format To rename a column enter the new text directly into the Name field. Specify a data type by making the appropriate selection in the Type list. Please note the following: • String columns can contain attributes that are both alpha and numeric. • Integer columns contain only whole numbers. • Real columns contain numbers carrying decimal values. • Boolean columns contain True or False values. To modify the amount of characters or decimals, enter a value into the Size/Decimal text box. A Default Value can be assigned for all new objects placed on the selected layer by entering text accordingly. Check or uncheck the Visible option to edit a column’s visibility. Check or uncheck the Read-only option to edit a column’s read/write status. Chapter 5: MAP Attributes Edit Schema 73 Check the Derive value from expression option to assign an expression to the selected column. Enter a valid expression in the Expression field or click the Browse button to enter and edit expressions via the Edit Expression dialog box. The Expression Validity icon will report if the expression entered is valid. Otherwise it will report and include additional warning notes. This function is useful, for example, to populate the column values based on the contents of other columns and/or mathematical formulas. NOTE: Values derived from expression are dynamically linked to the attributes used in the expression. Therefore, they are read-only. Use the Apply Expression function to generate values that can be modified. The following are some examples of basic expressions which can be assigned to columns in Edit Schema. “Ontario” (applied to column = NAME) Result: All items are assigned the value “Ontario” in the NAME column. “MAP Area 01” (applied to column = #Style) Result: All area items are assigned the value “MAP Area 01” in the #Style column and are assigned the Graphic Style “MAP Area 01” on the page. 45 (applied to column = #Rotation) Result: All point items are assigned the value 45 in the #Rotation column and are rotated to 45° on the page. NOTE: String values are case-sensitive and must be entered in quotes (“...”). Adding, Deleting and Re-Ordering Columns Stipulations regarding the display order of attribute columns in the MAP Attributes panel can be set by reordering the existing list according to your preferences. Any column may be promoted in the list/attribute table by selecting it in the list and clicking the Up and Down buttons to move it up or down within the list. Columns will display in the MAP Attributes panel according to the display order established in Edit Schema. To create a new column, click the Add button and input the desired column properties. To delete an existing column, choose it from the available list and click the Delete button. Click OK to confirm your edits to the attribute structure on the selected layer. These edits will immediately be visible in the MAP Attributes panel. EDIT COLUMN Edit Schema can also be accessed via the Edit Column context menu. Within the MAP Attributes panel, select the column to be edited, right-click the column heading or cell and click Edit. This opens the Edit Schema dialog box with the same column immediately selected in the column list. NOTES: • • 74 MAPublisher does not support punctuation characters in column names to avoid complications when exporting to external formats. The following illegal characters are replaced with an underscore '_' upon data import or join table: space ` ~ ! @ # $ % ^ & * ( ) - + = { } [ ] | ; : " ' \ , < . > / ? Some external file formats have limits on the number of characters allowed for field names. Therefore, during the export from MAPublisher, some field names might get truncated to comply to the chosen external file format. For example, ESRI shapefiles are limited to 10 characters (confirmed up to ArcGIS 9.2), ESRI Interchange File (.e00) to 16 characters, MapInfo to 30 characters. Chapter 5: MAP Attributes Edit Schema Edit Expression Accessed from Edit Schema, Apply Expression, New/Edit Selection Filter, MAP Stylesheet Editor Expression Builder Operator buttons - Click to insert an operator into the expression at the current cursor position. Recent - Select expressions from the MAP Selection Filters (see chapter 11). Expression Validity - Indicates if the expression is valid or invalid . If invalid, additional info is reported. Expression Entry - Where all composition of the expression occurs. Use the keyboard, operator buttons, and/or the Objects list to compose the expression. Advanced toggle - Click to show or hide the Expression Components section Cursor Position - Position of the current text entry point. Objects - List of attribute and property columns, constants and functions for use in the expression. To expand a folder click ; to collapse click . Double-click items to insert them into the expression. Description - Displays information on the currently selected item in the Objects panel, i.e. a description and example of the function or constant, or information regarding the format of the MAP layer along with it's attribute values. Layer attributes - List of the attribute and property columns which comprise the current layer. When selecting an attribute, click the link display unique values* to display the attribute values of the selected attribute column. Constants - Insert either True or False into the expression if required. Functions - List of functions for use in the expression if required. *Display unique values only list up to a maximum of 1000 attribute values. Recent Expressions This dialog box appears when the Recent button is clicked Expressions - List of expressions from the MAP Selection Filters saved expressions (see chapter 11). Click one or more entries to copy to the expression builder—multiple selections are concatenated with the AND statement.. Chapter 5: MAP Attributes Edit Expression 75 FUNCTIONALITY The MAPublisher Edit Expression tool provides for the entry and edit of expressions for use in the generation of new attribute values and properties, to make selections or to apply styles. Expressions can be entered using the keyboard, and/or by selecting from listed column names, operators and functions. Edit Expression provides functionality for a number of tools: Edit Schema: To create or edit an expression for the generation of values in an attribute or column. (MAP Attributes panel > Edit Schema > Derive value from expression > Browse) Apply Expression: To apply an expression to an attribute or property column for selected art only. (MAP Attributes panel > Apply Expression> Browse) New/Edit Selection Filter (chapter 11): To create or edit expression criteria for use in selecting map data. (MAP Selection Filters panel > New/Edit Selection Filter > Browse) MAP Stylesheet Editor (chapter 9): To create or edit an expression for use in styling map data. (MAP Stylesheets panel > Edit MAP Stylesheet > Advanced Expression > Browse) ENTERING EXPRESSIONS Expression can be built using the keyboard and/or by clicking the operator buttons or items in the Objects list (attributes name and values, constants and functions). These items are colour coded to ease the identification: attribute names in purple, string values in orange, operators and numerical values in grey, constants in green and functions in black. Clicking any of the operator buttons or double-clicking an item from the Objects list inserts that item into the expression. It is recommended to use the interface rather than the keyboard to build expressions, because functions are formatted correctly (e.g. with brackets), and, for attribute values of type strings, quotations marks are added automatically. Besides, expressions are case-sensitive. For string comparison, all strings values can be converted to a same case using the appropriate function (LOWER(“string”) or UPPER(“string”)). However, the keyboard is best used for deletions. Validity The validity of the expression will be displayed below the Expression Entry field, and will be updated as the expression is built. The Expression Validity icon will report if the expression entered is valid. Otherwise it will report and include additional warning notes. Operator Buttons Click to insert an operator at the current cursor position. Available operators are as follows: 76 ( ) AND OR = != Open clause operator Close clause operator Logical AND operator Logical OR operator Logical equal to comparator Logical not equal to comparator Chapter 5: MAP Attributes Edit Expression < > + - / * Logical less than comparator Logical greater than comparator Mathematical addition operator Mathematical subtraction operator Mathematical division operator Mathematical multiplication operator Expression Components Items in the Objects list fall into three categories. Information on a selected item is displayed in the Description panel. Double-click to insert an object at the current cursor position. Available objects are as follows: <MAP Layer>* List of #property columns (see page 37) List of attribute columns** Constants #true Boolean true value #false Boolean false value * Layer may vary depending on tool. For Edit Schema, Apply Expression and New/Edit Se lection Filter, the current layer is displayed. In the MAP Stylesheet Editor, all layers hosted by the stylesheet are displayed. ** Unique values contained in each attri bute column can be viewed in the Descrip tion panel. Descriptions and examples have been provided for each function and parameter in the Description panel. Functions ABS Absolute value of a number ACOS Inverse of the cosine of an angle ASIN Arcsine of an angle ATAN Arctangent of an angle CONTAINS True if source string contains search string COS Cosine of an angle DEGREES Converts values from radians to degrees ENDSWITH Returns true is the source string ends with the suffix string IF Based on a conditional statement LIKE Searches the source string using wildcards LOWER Strings converted to lower case NUMBER String values as numbers POW Base to the power of an exponent PROPER Strings converted to capital case RADIANS Converts values from degrees to radians REGEX Searches the source string using a regular expression ROUND Rounded to specified decimals of precision SIN The sine of an angle SQRT Square root of a value STARTSWITH Returns true if the source string starts with the prefix string TAN Tangent of an angle UPPER Strings converted to upper case Confirmation When you have finalized your expression and it has been validated, click OK. The expression is inserted into the expression field of the appropriate tool. The Edit Expression tool can be re-opened if further edits are required. NOTE: String values are case-sensitive and must be entered in double quotes (“...”). Example Basic Expressions APPLY EXPRESSION “Ontario” (applied to column = NAME) Result: All selected items are assigned the value “Ontario” in the NAME column. “MAP Area 01” (applied to column = #Style) Result: All selected area items are assigned the value “MAP Area 01” in the #Style column and are assigned the Graphic Style “MAP Area 01” on the page. 45 (applied to = #Rotation) Result: All selected point items are assigned the value 45 in the #Rotation column and are rotated to 45° on the page. Chapter 5: MAP Attributes Edit Expression 77 SELECTION FILTER NAME = “Ontario” Result: All items with the value “Ontario” in the NAME column are selected. POPULATION < 1000000 Result: All items with values less than one million in the POPULATION column are selected. NAME = “Ontario” OR NAME = “Alberta” Result: All items with the value “Ontario” OR “Alberta” in the NAME column are selected. NAME = “Ontario” AND POPULATION < 1000000 Result: Only the items containing the value “Ontario” in the NAME column AND values less than one million in the POPULATION column are selected. MAP STYLESHEET NAME = “Ontario” Result: All items with the value “Ontario” in the NAME column are assigned the selected style. POPULATION < 1000000 Result: All items with values less than one million in the POPULATION column are assigned the selected style. NAME = “Ontario” OR NAME = “Alberta” Result: All items with the value “Ontario” OR “Alberta” in the NAME column are assigned the selected style. NAME = “Ontario” AND POPULATION < 1000000 Result: Only items containing the value “Ontario” in the NAME column AND values less than one million in the POPULATION column are assigned the selected style. Example Complex Expressions SELECTION FILTER or MAP STYLESHEET LIKE (NAME, “*New*”) Result: all items with the string of letters "New" in the NAME column are selected (e.g. “New Brunswick” and “Province of Newfoundland”) STARTSWITH (NAME, “o”) Results: all items that starts with the letter “o” (“Ontario”) are selected. EDIT SCHEMA LOWER(NAME) (applied to column = name) Result: All items in column name are assigned the value of the column NAME in lower case (e.g. “ontario” for “Ontario”, “new brunswick” for “New Brunswick”) PROPER(name) (applied to column = Proper_name) Result: All items in Proper_name are assigned the value of the column name in proper case (or capital case) (e.g. “Ontario” for “ontario”, “New Brunswick” for “new brunswick”). ROUND((POPULATION/ AREA ),3) (applied to column=density) Result: All items are calculated as “population divided by area”, rounded to three decimals. 78 Chapter 5: MAP Attributes Edit Expression Find & Replace Attributes MAP Attributes panel > Find & Replace Find / Replace - Choose to Find variables, or to Find & Replace variables simultaneously. Find what - Enter a variable on which to perform a search in the current attribute table. Note this list will also contain previous criteria. Replace with - Enter a variable on which to replace found items. Note this list will also contain previous criteria. Find/Replace All Attributes / Just in Column - Perform the Find, or Find & Replace, on all values in the current layer, or just in a specified column. Find Next - Move to the next value matching the Find what variable. Replace - Replace the selected value with the Replace with variable. Replace All - Replace all occurrences matching the Find what variable. Case sensitive - If checked, only values matching the case of the Find what variable will be found. Match whole word only - If checked, only words matching the Find what variable will be found (words containing the variable will be ignored). FUNCTIONALITY The Find & Replace tool allows for the searching and/or replacing of attribute values and properties contained in the MAP Attributes panel. Note that only values in visible columns can be found and/or replaced. USING FIND & REPLACE Access the tool by clicking the Find & Replace button or menu item in the MAP Attributes panel. Find Only To use Find & Replace to easily find values, click the Find tab to enter the search criteria. Find criteria can be typed directly into the Find what entry field (previous criteria can be selected from the list). A search may be performed on all attributes by default, or only on specific columns contained within the MAP Attributes panel by enabling the Just option and choosing a column from the list. Criteria may be further refined by enabling the Case sensitive and Match whole word only options. Once the search string has been entered click the Find Next button in order to perform the search. Search results can be seen in the MAP Attributes panel; the column header and row number containing the first matching record will be displayed in bold text. At this point search for individual records can be done by clicking again the Find Next button. Find & Replace To replace records selected through the Find operation click the Replace tab. Find & Replace criteria can be typed directly into the Find what and Replace with entry fields (previous criteria can be selected from the lists). A find and replace may be performed on all attributes by default, or only on specific columns contained within the MAP Attributes panel by enabling the Just option and choosing a column from the list. Criteria may be further refined by enabling the Case sensitive and Match whole word only options. There are two methods to replace values. The first method requires to approve each replacement manually by clicking the Replace button so that each instance of the attribute located via the search parameters is successively replaced in the map attribute table. The second method allows for the replacement of all found records simultaneously, accomplished by clicking the Replace All button. Chapter 5: MAP Attributes Find & Replace Attributes 79 Apply Expression MAP Attributes panel > Apply Expression Apply to - Select the attribute column on which to apply the expression. Attribute and MAPublisher Property columns can be assigned expressions Expression - Enter the expression directly into the entry field, or click the Browse button to access the Edit Expression function.. Expression Validity - Indicates if the expression is valid or invalid .. If invalid, additional info is reported. FUNCTIONALITY The Apply Expression tool allows for the assignment and application of expressions to currently selected artwork for the purpose of assigning attributes, assigning properties, or transforming artwork. For example, the tool can be used to assign attribute values based on values in other columns, assign graphic styles to selected elements, or transform data on the page via the assignment of a rotation value. Note that property attributes are dynamic. Changes made to them in the map attribute table are reflected immediately in the graphical properties and on-screen display of the data to which they are linked. Expressions can be generated and applied to data based on the values found in an existing attribute column, providing a one-step process to transform a vast number of different objects in a single operation. NOTE: Unlike the Derive Value From Expression option in Edit Schema, values computed through Apply Expression are not tied to the original attributes constructing the expression and can be edited later on. APPLYING EXPRESSIONS Ensure the data required for the application of the expression is selected, and that layer is selected in the MAP Attributes panel. Then access the tool by clicking the Apply Expression button or menu item in the same panel. First specify a column from the Apply to list to specify which attribute column the expression will be applied to. The columns listed here are representative of the attribute structure unique to the data layer currently displayed in the attribute table as well as the standard MAPublisher property attributes. To assign an expression to a column, enter a valid expression in the Expression text box. The Expression Validity icon will report if the expression entered is valid. Otherwise it will report and include additional warning notes. Alternatively, click the Browse button to enter and edit expressions via the Edit Expression tool (page 46). The following are some examples of basic expressions which can be assigned to selected data with Apply Expression. “Ontario” (applied to column = NAME) Result: All selected items are assigned the value “Ontario” in the NAME column. “MAP Area 01” (applied to column = #Style) Result: All selected area items are assigned the value “MAP Area 01” in the #Style column. Same items are assigned the Graphic Style “MAP Area 01” on the page. 45 (applied to = #Rotation) Result: All selected point items are assigned the value 45 in the #Rotation column. Items are rotated to 45° on the page. Click OK to apply the expression to the selected data, updating the values in the selected attribute column and transforming data as appropriate. 80 Chapter 5: MAP Attributes Apply Expression Join Table MAP Attributes panel > Join Table Source Table - Lists the selected external data table and its path. Click the Browse button to select the data table to be joined. Source Matching Column - Select a column from the source table to match to a column in the destination layer. First line contains column names For Delimited Text type tables, check this box to use the first line to derive column names. Character Encoding - Assign a codec if the attribute information held in the selected dataset uses a double byte character set. Target Layer - Select the layer containing the MAP Attribute table about to be joined with the source table Destination Matching Column - Select a column from the destination layer to match to a column in the Source Table. Case sensitive - If checked, values from the two matching columns will be matched up case-sensitively. FUNCTIONALITY Join Table provides the ability to merge external data tables directly into an existing MAP Layer attribute schema in order to create a single extended attribute table. Three of the most common table formats are supported: • dBase (*.dbf ) • USGS SDTS (*.ddf ) • Delimited Text (*.csv) (*.tsv) (*.txt) • Excel (*.xls) When exporting tables from spreadsheet applications for use with MAPublisher the preferred format to use is Delimited Text (*.csv). NOTE: dBase tables created or edited in Microsoft Excel must have a proper data type assigned to each column through cell formatting before being saved as dbf. For example, numerical values specified in a cell set with a format "General" will import as an Integer type by default, therefore loosing all decimal values. PREREQUISITES In order to successfully join a table into an existing attribute schema, both MAP Layer and data table must share at least one common attribute column with matching values. The column must be of a matching type (i.e. String, Real, Integer, Boolean) in both the Source and the Destination table. Access the Join Table tool by clicking the Join Table button or options menu item in the MAP Attributes panel. USING JOIN TABLE Source Table Click the Browse button to select the data table for import. When the file has been selected, select a common column by selecting an appropriate entry in the Matching Column drop-down list. Chapter 5: MAP Attributes Join Table 81 In MAPublisher, double byte characters are supported in attributes on import, allowing such attributes to be used for labelling and export. To assign a codec suitable for your selected dataset, choose an appropriate entry from the Character Encoding drop-down list. If the table contains column names as headers, check the First line contains column names option. If it does not contain headers do not check this option and each column will be assigned a default heading name: Column1, Column2, etc. Destination Table Choose the attribute table to be joined to the data table. This can be achieved by choosing a MAP Layer from the Target Layer list. When the destination layer has been selected, select a common column by selecting an appropriate entry in the Matching Column drop-down list. This column must match the format and values as the column selected in the Source Table section. Additional Option If the Case sensitive option is checked, the column entries from the two matching columns will only be matched by case. For example, if you have a mixture of upper or lower case entries in the data table that is mirrored in the destination attribute table, you should check this box. If one of the matching columns contains values in lowercase, and the other contains values in uppercase, for example, you should not check this box. RESULTS When you click OK, the data table will be added to the attribute table on the destination MAP Layer and may be viewed in the MAP Attributes panel. Notice that the matching column in your data table has also been added, but has been appended with a 1 if the column names were identical in the source and destination tables. 82 Chapter 5: MAP Attributes Join Table Export Attributes MAP Attributes panel options > Export Attributes File name - Click the Browse button to select the directory and type the file name where to save the exported attributes. Scope - Choose to export all the attributes or only the visible attributes. Delimiter - Specify the field delimiter. Select Comma, Semi-colon, Space or Tab from the drop-down list. Include column names on first line - Click this option to export the column names on the first line of the exported text file. FUNCTIONALITY The Export attributes function exports all selected attribute information from the current MAP Layer to a delimited text file—comma, space, tab or semi-colon separated.. PREREQUISITES Attributes will be exported as they are in the MAP Attributes panel. For example, users can change the number of decimals for attributes of type Real prior to exporting (see Edit Schema in this chapter), to limit the size of the exported file—or to turn on/off the visibility of some attributes, with Edit Schema or the MAP Attributes panel Show/Hide function (see previous section in this chapter). USING EXPORT ATTRIBUTES Export attributes is accessed from the MAP Attributes panel options menu. In the Export Attributes dialog box, click the Browse button to navigate to the directory where the exported file will be saved and type a file name. By default, the exported file will be appended a .txt extension—to export in another delimited text format, type another file extension (*.csv or *.tsv) n the file name (e.g. file.csv). Users have the following options to set: • Export all attributes or visible attributes only. • Set field delimiter in the exported text file to Comma, Semi-colon, Space or Tab • Export or not the column names on the first line. RESULTS A delimited text file is created according to the specified settings. Text attributes (type String) are exported in double quotes ("...") in the text file. Chapter 5: MAP Attributes Export Attributes 83 Plotting Points The ability to place points onto a map is a fundamental part of cartography. Points can represent the locations of towns and cities, shops and malls, airports and train stations and more. MAPublisher provides the functionality to create or plot points in vector format. There may be times when you wish to quickly add a point or a small group of points to your map but you do not have a GIS or ASCII file containing these points ready for import. Alternatively your map may be in a projection that holds coordinates in linear units, yet the coordinates of your point locations are in angular units (i.e. degrees). Provided you have a fully specified MAP View, and know the coordinates (coordinate system and unit can be specified) for the locations you wish to plot, you can use the MAPublisher Point Plotter to have your points automatically added at their correct locations. Topics covered in this section are: MAP Point Plotter Plot Centroids Chapter 6: Plotting Points 85 MAP Point Plotter Window > MAPublisher > MAP Point Plotter and MAPublisher Toolbar Current Layer - Displays the selected layer's name and coordinate system. Coordinates - Enter the coordinates of the point to be plotted either in MAP units or in a different choice of coordinate system. Format - Select the input format for values in degrees (when input coordinate system is geodetic. Plot- Click to plot the symbol after coordinates have been entered. Scale - Change the size of the chosen symbol if required. The arrow keys will increase or decrease the scale value by 10% increments. Style - Choose a symbol to use. Click the symbol name to open the list of symbols to choose from Input Coordinate System - Specify the reference coordinate system in which the point coordinates are entered. Use the current layer's coordinate system, or specify a different one (by default WGS84, latitude-longitude format). Click the Select button to open the Select Coordinate System dialog box and choose any coordinate system. NOTE: Points can only be plotted on point layers. The plot button will be disabled if another map layer type is the active layer. PREREQUISITES In order to plot points using the Point Plotter, you must first have a fully georeferenced MAP View in your document, as this function will use the coordinate system of that MAP View in order to generate points. Furthermore you must create a new Adobe Illustrator layer in which your points will be placed, as the software will not support multiple feature types on the same layer. Remember once you have created a Point layer, you must drag it into the desired MAP View, specifying Point in the Define Layer dialog box. USING POINT PLOTTER Setting up the Symbol Selection The symbols used by Point Plotter are a direct reproduction of those that exist in the Adobe Illustrator Symbols panel. To open the Adobe Illustrator symbols panel, click the menu Window > Symbols. If you wish to add points to this panel, create your symbols as closed Adobe Illustrator objects and drag them into this panel. Alternatively, open the MAP Symbols file from the Helpful Styles & Symbols folder on your MAPublisher CD or local drive (see Appendix 4), and drag the symbols into your Adobe Illustrator Symbols panel. 86 Chapter 6: Plotting Points MAP Point Plotter Entering Coordinates When the Use Current Layer's coordinate system option is toggled, coordinate values can be entered in the current MAP units of the coordinate system of the MAP View containing the selected layer. When the Use: WGS 84 option is toggled, the Select button will become enabled. Clicking the Select button will open the Select Coordinate System dialog box. Choose any coordinate system, the coordinates values entered to plot points will be in the unit (Point Style) for this coordinate system. When the selected or default coordinate system is projected, X and Y coordinates are entered in the unit (Point Style) of the coordinate system (e.g. metre, kilometre, feet). When the selected or default coordinate system is Geodetic, Lat and Long coordinates are entered in degrees. The values entered into the Latitude and Longitude text boxes may be entered in different formats: • Decimal degrees (D+[.d*]) • Delimited Degrees Minutes Seconds (D+dMM’SS[.s*]”) • Degrees.Minutes (D+.MM[m*]) • Degrees.MinutesSeconds (D+.MMSS[s*]) • Packed DMS with decimal point((D)DDMMSS[.s*]) • Packed DMS ((D)DDMMSS[s*]) Items in [ ] are optional, * means zero or more digits, + means one or more digits. NOTES: • • • Lines of latitude run East-West (the Equator is an example), whereas lines of longitude run North-South (the Greenwich Meridian is an example). Positive degree values represent north latitudes and east longitudes. Negative degree values represent south latitudes and west longitudes. Directions can be entered either with positing/negative values or using the N, S, E or W letters preceding or following the numerical values, separated or not with a space. Valid delimiters for Delimited Degrees Minutes Seconds format are: JJ d (degree), single quote (minute), double quote (second): e.g. 43d41'48.98"N JJ hyphen (-) : e.g. 43-41-48.98N JJ space: e.g. 43 41 48.98N Packed formats require the use of two digits for degrees of latitude (e.g. 1°N must be written 01) and 3 digits for degrees of longitude (e.g. 1°E must be written 001). Examples of Latitude/Longitude values Formats Avenza Office: 43°41’48.98”N 79°23’32.38”W (= 48°41.8163’N | 79°23.5396”W) (= 48.6969°N | 79.3922°W) Decimals Degrees Delimited Degrees.Minutes Degrees. MinutesSeconds Packed DMS with decimal point Degrees Minutes Seconds Packed DMS Lat 43.6969N 43d41’48.98”N 43.418163N 43.414898N 434148.98N 43414898N Long 79.3922W 79d23’32.38”W 79.235396W 79.233238W 0792332.38W 079233238W Lat 43.6969 43 41 48.98 N43.418163 N 43.414898 434148.98 N 43414898 Long -79.3922 W 079 23 32.38 W79.235396 W 79.233238 -0792332.38 W 079233238 Lat N 43.6969 N 43-41-48.98 43.418163 43.414898 N 434148.98 43414898N Long -079.3922 W 79-23-32.38 -079.235396 -079.233238 W 0792332.38 -079233238 Chapter 6: Plotting Points MAP Point Plotter 87 Choosing a Symbol and Scale After entering coordinate values select an appropriate symbol to use by clicking the symbol name link. Again the symbols displayed are the symbols that currently exist in the Adobe Illustrator Symbols panel. To scale the symbol used, edit the Scale entry field. Clicking the Up and Down arrows will increase or decrease the value by 10%. Plotting Points Click Plot to plot the point in the designated MAP layer. To plot subsequent points, edit the coordinates, and also choose different symbols if required and click Plot again. 88 Chapter 6: Plotting Points MAP Point Plotter Plot Centroids MAP Point Plotter panel > Plot Centroids MAP View - Select the MAP View containing the layers of interest (Source Layer and Destination Layer) Source Layer - Select the Area MAP Layer containing the polygons on which the centroids will be calculated. Destination Layer - Select an existing Point MAP Layer or create a new one, where centroid symbols will be added . Style - Select the symbol to use. The list correspond to the symbols present in the Adobe Illustrator Symbols panel. Scale - Select the symbol scale FUNCTIONALITY The Plot Centroids function creates point symbols at the center of polygons, while copying the attributes from the source Area layer when the New Layer option is selected. This function is useful for cartographic generalization purpose (e.g. replacing small island area by a symbol), or to simply add a meaningful symbol at the center of areas. For single polygons, the centroid can be assimilated to the center of mass of the surface. For polygons grouped into a compound path, the centroid of the largest polygon is used. NOTE: The centroid of a Bezier polygon (smoothed path) may not be completely accurate because only the anchor points are used to calculate the centroid's position. If necessary, use the Adobe Illustrator Add Anchor Points function (Object > Path > Add Anchor Points) before running Plot Centroids on Bezier polygons. PREREQUISITES The document must contain a fully georeferenced MAP View that includes a MAP layer of type Area with polygons. An existing Point layer may be used as destination layer (Existing Layer option), in which case this layer must be included in the file before running the function . Furthermore, the symbol of your choice must be present in the Adobe Illustrator Symbols panel. USING PLOT CENTROIDS Plot Centroids is located in the Point Plotter panel options menu. • Select first the MAP View that contains the layers concerned by the function. • Select the Source Layer containing the polygons for which the centroids will be plotted (MAP Layer of type Area). • Select the symbol Style and Scale to apply. • Choose the Destination Layer in which the centroids will be added: select an existing Point layer or create a new one. NOTE: When the New Layer option is enabled, the attributes from the source Area layer are copied to the new Point layer. However, when using an existing point layer, attributes do not get transferred. Chapter 6: Plotting Points Plot Centroids 89 RESULTS Symbols are added to the specified Point MAP Layer specified. Depending on the type of polygon (single or compound path), symbols are located on the center of the polygons or at the center of the biggest polygon of a group. Example: result of plotting centroids on a Canadian provincial Area layer. 90 Chapter 6: Plotting Points Plot Centroids Drawing Tools MAPublisher benefits from Adobe Illustrator drawing tools. Any artwork created on a specified MAP layer is incorporated into the map data and can therefore be rescaled and reprojected. If the new artwork is of the same feature type as the MAP Layer, it will be automatically added to the attribute table. Similarly, objects can be deleted and moved between layers with basic Adobe Illustrator tools. Therefore it is very easy to quickly add and delete features to MAP Layers. In addition to this, MAPublisher also provides its own tools for creating and managing artwork. MAP Area Tools are designed to draw rectangular and elliptical areas of specified dimensions in MAP Units. The MAP Vector Crop Tool will trim all the vector data (on all active layers) falling outside of a crop area. The topics covered in this section are as follows: MAP Area Tool MAP Vector Crop Tool Chapter 7: Drawing Tools 91 MAP Area Tools Tools > MAP Area Tool (Box) / MAP Area Tool (Ellipse) Width/Height - Enter the width and height for the area to be drawn. Center area on click - Check this option if you want the area to be drawn centered on the click point. Units - Select a map or page unit to be used for width and height values. FUNCTIONALITY By using the MAP Area tools, areas of exact map dimensions can be quickly added to any MAP Layer and its related attribute table. Whenever an area is created using the MAP Area tools, any objects that fall inside the area (in whole or part) will be automatically selected. USING THE MAP AREA TOOLS Overview MAPublisher offers Ellipse and Rectangle drawing tools. Select the shape you require from the main Adobe Illustrator Toolbar, and select the MAP Layer which contains the coordinate system on which you want to draw the shape. There are two methods of using the MAP Area tools. As with Adobe Illustrator shape tools you can either click and drag to create a shape at an unspecified size. Alternatively you can single click in the MAP document to open the Add Area dialog box, where you specify exact width and height values for the shape. Drawing via Click and Drag To draw shapes at unspecified sizes, click and drag over the Map document while holding down the left mouse button until the desired area has been outlined, as is done with the standard Adobe Illustrator area drawing tools. Use the Alt key (Windows) or the Option key (Mac) to draw from the centre and/or the Shift key to constrain the proportions. When you release the mouse button the area will be created. Entering Specific Dimensions To draw shapes at specified sizes, single click at a point in your Map document at the location from which you wish to plot the shape. The MAPublisher Add Area dialog box will appear into which you can enter specific dimensions for the area to be drawn. If you wish to have the area centered over the click point simply check the Center area on click box. If you do not check this box an area will be drawn from its upper left corner. Click OK to plot the shape. RESULTS Plotting a shape using either of these methods will initially select the features that fall, inside the area (in whole or part). Therefore, these tools can be also useful for selecting features that are within designated distances away from a central location. 92 Chapter 7: Drawing Tools MAP Area Tools MAP Vector Crop Tool Tools > MAP Vector Crop FUNCTIONALITY By using the MAP Vector Crop Tool, the entire map drawing (vector data) can be trimmed to a certain area of interest. Typically, the tool is meant to crop imported vector data that might be covering a larger area than the intended map extents. Used on a copy of the full original MAP View, MAP Vector Crop can also be utilized to create map insets (smaller maps centered on specific areas)—see example below. PREREQUISITES Before using the MAP Vector Crop tool, ensure that the layers to be trimmed are visible and unlocked in the Adobe Illustrator Layers panel. Similarly, layers that are not supposed to be cropped should be locked or invisible. The extent of the map that will remain after cropping must be visible on the screen, so make sure to zoom out sufficiently prior to starting the vector crop tool. NOTE: Invisible and locked layers will not be cropped. Users should save a copy of the Adobe document prior to performing a crop. Due to some Adobe Illustrator limitations, text typed on a path might not return to their prior state after an undo. USING THE MAP VECTOR CROP Click the MAP Vector Crop button in the Adobe Illustrator Tools panel, then click and drag a rectangle over the artboard. Upon release of the mouse button, the crop function is completed. If the remaining map is too large, the MAP Vector Crop can be run again on the remaining data. If the remaining map is too small, the MAP Vector Crop can be undone (menu Edit > Undo) and run again. RESULTS On all visible and unlocked layers: • Text objects that have their anchor outside of the cropping rectangle are deleted. Text objects with their anchor inside the cropping rectangle are retained completely. • Points falling outside of the cropping rectangle are deleted (the position of the center of the symbol is relevant). Symbols that have their center inside the cropping rectangle are maintained as a whole. • Lines are clipped at the boundary of the cropping rectangle. • Areas (polygons) that are completely out of the cropping rectangle are deleted. Areas intersecting with the cropping rectangle are clipped and closed following the edge of the rectangle. The overall result is a map coverage reduced to the cropping rectangle outline. Subsequently, the MAP View(s) can still be transformed, rescaled etc. See examples on the next page. NOTE: The purpose of the MAP Vector Crop is to cut vector data types (points, lines and polygons). Some Adobe Illustrator specific objects might not be cropped properly using this tool, for example: • Blend and Live Paint objects. • Any art using effects that have been rasterized. • Custom art such as scale bars, grids/graticules, north arrows (expand custom art to crop). • Images cannot be cropped with this tool. • Legacy Text Chapter 7: Drawing Tools MAP Vector Crop Tool 93 Due to an Adobe Illustrator limitation, text on a path may flip after a crop operation. This is corrected by checking the Flip option from Type on the Path Options dialog box (choose Type > Type on a Path > Type on a Path Options). Examples Crop vector data Original map Crop result: lines and area are clipped, text with 1st letter within the cropping rectangle and symbol with center point in rectangle are maintained. The MAP view can be re-scaled to fit better to the document size Create Inset • Open a map, and make a copy (choose File > Save a Copy). Leave the original map open, make the copy the active document. • Use MAP Vector Crop to crop the area of special interest. • Make the original map active. In the MAP Views panel, select the option menu Import MAP View from document. Select the MAP View from the copy . The map now contains two MAP Views (at least). Their relative position can be managed from the MAP View Editor, as well as the scale of the inset map. Copy and Crop Edit MAP views: e.g. move inset and change scale 94 Original Chapter 7: Drawing Tools MAP Area Tools RESULT Line Functions The Adobe Illustrator environment offers lots of flexibility when working with vector art. MAPublisher offers graphics specific line tools, which is discussed in detail in this chapter. Buffer Lines allows for the creation of a buffer around current lines at designated distances in map units. Flip Lines can be used to swap the start and end points of lines if these line strings were not originally digitized in a preferable manner. Join Lines can be used to connect line segments into continuous line strings or compound paths based on a specified attribute column. Simplify Lines allows for the removal of vertices from selected lines based on mathematical formulae. Join Points allows for point symbols to be joined based on attribute values. This tool will generate a line string joining common points, and is ideal for GPS data. Topics covered in this section are: Buffer Lines Flip Lines Join Lines Join Points Simplify Lines Chapter 8: Line Functions 95 Buffer Lines Object > Filters > MAP Lines > Buffer Lines* or MAP Toolbar Static Value - If you want to enter a specific value to buffer the selected lines by, click this option and enter the value in the adjacent entry field. Units - Select a unit to use for the buffer values. The default is the current map unit. Attribute Value - If your line data has a column in its attribute table that contains buffering values, click this option and select the column containing the value. Output Layer- Select the Area layer which will hold the buffered objects. FUNCTIONALITY The MAPublisher Buffer Lines filter creates buffer Area objects around the line work. This can be useful if you are attempting to calculate distances on each side of a line. An example where you would use this tool could be in the planning of new roads, where the actual width of the highway is a major consideration. PREREQUISITES Your MAP Layer must be a Line layer to use Buffer Lines. Before using this filter you must create an Area layer in your Adobe Illustrator Layers panel. Create a new layer, and then drag this to the MAP View which holds line work you wish to buffer, remembering to set the feature type to Area. To use this tool, select the line(s) you wish to buffer, and then go to Filter > MAP Lines > Buffer Lines or use the MAPublisher toolbar button . USING BUFFER LINES You can choose to buffer lines by entering a value or by selecting an attribute column that contains buffer values. The buffering value specified designates the total width of the new area object. For example, a value of 10 map units would create a buffer of 5 map units on either side of the selected line. This works on individual lines or a selected set of lines. The buffer width will be calculated and created using the units of measurement set in the dialog box. 1. Set the unit to use for the buffer value from the Units drop-down list. 2. Then choose which option to use for the buffer values. When the Buffer Lines filter is run with the Attribute Value option checked, an area width is calculated based on the value(s) related to the selected object(s) in the attribute table. The area will then be constructed based on the line’s attribute value. When the filter is run based on a Static Value, an area object is created by the specified value. 3. Choose the Area layer to place the buffer(s), then click OK to generate the areas. * In Adobe Illustrator CS3, Buffer Lines is found in the Filter > MAP Lines menu. 96 Chapter 8: Line Functions Buffer Lines Flip Lines Object > Filters > MAP Lines > Flip Lines* or MAP Toolbar FUNCTIONALITY The MAPublisher Flip Lines filter reverses the endpoints of a line or an area (open or closed path). Adobe Illustrator Brushes and Type on a Path tools are designed to position patterns and text depending on the direction of the endpoints. Two consequences of this are: • Cases occur when labels are placed upside down and backward when using the MAPublisher labelling tools (MAP Tagger tool and Feature Text Label, see chapter 10 Labelling Functions). • When applying graphic styles with a brush pattern to paths (manually or using MAPublisher MAP Stylesheets), sometimes patterns are not applied at the right side of the line or in the expected orientation. In order for the labels or patterns to be consistent for a group of lines, flipping some of the lines may be necessary. Lines can be flipped on Line layers and Area layers. In order to use this filter, select the lines to be flipped, and then go to Filter > MAP Lines > Flip Lines, or use the MAPublisher toolbar button NOTES: • • • . When exporting Area layers to GIS formats, polygon outlines must have a positive #Area value in the MAP Attributes panel. If some values in the #Area column are negative (and #AreaDirection is equal to Counter Clockwise), Flip Lines can then be used to reverse the #AreaDirection and convert the #Area to a positive value. For compound paths, the #AreaDirection property is equal to Indeterminate, therefore compound paths cannot be flipped. The MAPublisher MAP Tagger tool or Feature Text Label, have an option to enable Flip upside-down labels to create text in a consistent orientation, without requiring the use of the Flip Lines function (see chapter 10 for details). * In Adobe Illustrator CS3, Flip Lines is found in the Filter > MAP Lines menu. Chapter 8: Line Functions Flip Lines 97 Join Lines Object > Filters > MAP Lines > Join Lines* or MAP Toolbar Join on Attribute - Select the column you wish to base the join on. All lines within the selected proximity with matching column values will be joined. Proximity Units - Select a map or page unit to be used for proximity values. Destination Layer - Enter the name of the output layer. This new layer will contain the newly joined lines. FUNCTIONALITY Close Segment Gaps - If two line segments are separated by a distance less than the Proximity, selecting this option will create a line segment that connects the two lines otherwise a compound path is created. Proximity - Assign a proximity value in the current unit. This value determines how close together (in map units) the lines must be in order to be joined. The Join Lines filter allows a group of linear features to be joined based on a common value within an attribute column. For example, it may be desirable to join all segments of a particular street by the common attribute of street name in order to create a single line element representing that street. When the Join Lines filter is run a new layer is created containing the joined lines in order to avoid deleting other attributes within the original street layer. The new MAP Layer contains the joined lines with an attribute column representing the joined column. Join Lines can be very useful for reducing the size of a data file by joining related lines and thus reducing the number of segments and associated data present in the file. It is also very useful to run Join Lines prior to labelling with Feature Text Label in order to reduce the occurrence of duplicate labels (see chapter 10 Labelling Functions). PREREQUISITES This tool can be executed on selections on click the MAPublisher toolbar button . Line layers. To access Join Lines, choose Filter > MAP Lines > Join Lines or USING JOIN LINES In the Join on attribute drop-down list, select the attribute column containing the attributes you wish to join. For example to join lines based on street name, you should select the column containing the street names. This will result in line segments containing the same street name being joined. In the Destination Layer text box you should specify a name for the new hold your joined lines. Line layer that MAPublisher will create to A Proximity value should be entered and proximity Units assigned. Units can be specified in map units or page units. Entering a proximity value of zero will only join line segments that are touching. If the distance between the end of a segment and the start of another is greater than the set proximity value, these lines will not be joined. If two line segments in the selection are separated by a distance less than the set proximity value, check the Close Segment Gaps option to create a line segment that connects the two lines. When not selected a compound path will be created. When you have entered your preferences for the join click OK. On the newly created Line layer view the layer’s attributes in the MAP Attributes panel. Note that the only attribute columns present are the default #Property columns and the attribute column you specified for your join. * In Adobe Illustrator CS3, Join Lines is found in the Filter > MAP Lines menu. 98 Chapter 8: Line Functions Join Lines Join Points Object > Filters > MAP Lines > Join Points* or MAP Toolbar Input Layer - Use this drop-down list to select the Point layer containing the symbols you wish to join. All Points / Selected Points You can choose to join only those points that have been selected or all points on the selected MAP Layer. Output Layer - Enter the name of the output layer. This new layer will contain the generated lines. Close paths - Check this option to generate an Area layer. If unchecked, a Line layer will be generated. Group By - Specify the attribute column containing similar values to determine each group of points. Sort By Available Columns - Select an attribute column containing ascending values to sort by. Then click the Add button to add the column to the Sort Order. Sort Order - Contains a hierarchical list of the columns specified to sort by. To remove a column from the Sort Order, click the Remove button. Move Up / Move Down - You can move columns up and down the Sort Order hierarchy by clicking the appropriate button . FUNCTIONALITY The Join Points filter allows a group of point symbols to be joined to form a line, based upon sorting criteria which exist in the attribute structure of the point layer. For example, it may be desirable to join points that were originally generated by a GPS device, in order to create line elements connecting these points. When the Join Points filter is run a new layer is created containing a line linking each set of common points, with the generated layer containing the same common attribute column that was used to group the points together. PREREQUISITES Join Points can only function on Point layers, and can be used on both currently selected point symbols or all the point symbols on a specified layer. There must be at least two attribute columns on the specified point layer in order to use Join Points. To open the dialog box, choose Filter > MAP Lines > Join Points or click the MAPublisher toolbar button . USING JOIN POINTS From the Input Layer drop-down list, select the Point layer containing the points you wish to join. Then specify if you wish to join All Points, or just the Selected Points on this layer, by selecting the appropriate option. Specify a name for the Output Layer that this function will generate. By default, the program will generate a Line layer. To generate an Area layer (by linking the line end to the start) check the Close paths option. In the Group By Column drop-down list, select the attribute column containing the common attributes you wish to join together. For example to join points based on a unique ID, you should select the column containing the common ID names. This will result in point symbols containing the same name being joined together. * In Adobe Illustrator CS3, Join Points is found in the Filter > MAP Lines menu. Chapter 8: Line Functions Join Points 99 As each point that is joined will be represented by a node in a line string, you must now specify a logical order by which the points will be joined. For example, it is logical that the point which was captured by a GPS unit first should be the first node in the line string, with the second and third points being located at the second and third nodes. In order to specify these parameters, choose columns by which to sort your points. These should be attribute columns which contain rising alphabetical or numerical values. In the Sort By Available Columns list, select the primary sorting column. This should be the attribute column that contains the best fit for rising alphabetical or numerical values. For example if points have rising values from 1–10, the point with a value equal to 1 will be at the start of the generated line, and the point with a value equal to 10 will be at the end of the line. When you have selected the column, click the Add button to place the column into the Sort Order list. If all the values contained in the first Sort By column are unique, you will not be required to set a secondary column. If the first Sort By column contained any similar values, you must specify a secondary column. Again click a column in the Sort By Available Columns list, and then click the Add button to place the column in the Sort Order list. Similarly third, fourth and fifth Sort By columns can be specified in the same manner if previous columns contain similar values. Note that the Sort By columns are a hierarchy with the topmost specified column being used for the primary sort, then the second, then third, etc. To move columns up or down the hierarchy after they have been specified, simply select the appropriate column in the Sort Order list and click either the Up or Down button. To remove any Sort By columns from the hierarchy, select the column in the Sort Order list and click the Remove button. Note that a maximum of five columns can be used to sort points into a logical order. If the columns specified to sort by do not distinguish an ordering between certain points, the order of these points in the attribute table will be used to determine the order of the nodes in the generated line string. RESULTS When all the options have been set click OK to join the points on the specified layer. An Area or Line layer will be generated, depending on the specified output layer type, which will be placed in the same MAP View as the Input Point layer which has been joined. 100 Chapter 8: Line Functions Join Lines Simplify Lines Object > Filters > MAP Lines > Simplify Lines* or MAP Toolbar Proximity - Set the simplification tolerance (type in or use arrows). Vertex Count - Displays the number of vertices in the original and simplified line after clicking the Preview button. Unit- Select page unit or map units (angular or linear unit list depending if the map coordinate system is projected or geodetic) used for proximity tolerance. Preview- Display a preview on the artboard before running the tool. FUNCTIONALITY The MAPublisher Simplify Lines filter allows for the simplification or generalization of imported vector data. The Simplify Lines function uses the popular Douglas-Peucker algorithm for removing nodes and vertices during simplification. For more information on the Douglas-Peucker algorithm see Appendix A1. Simplify Lines is used to reduce the number of points required to represent a vector-encoded line where the lines are approximated by a stream of X-Y coordinates. The function can be used on Line or Area layers and removes nodes based upon a proximity value in either Page Units or Map Units. The list of Map Units depends on the MAP View coordinate system—e.g. angular units (page units, degrees, etc) for geodetic coordinate systems; linear units (such as metre, feet) for projected coordinate systems. The Proximity value or simplification tolerance is based on the vertical difference between the begin-end line and points off a line, not the distance between anchor points on the line. The Douglas-Peucker algorithm takes the proximity value and iterates through the line vertices to determine the points that fall within the specified proximity distance off the line and removes those vertices. Once all vertices are determined to be greater than the proximity value the line processing ends. A smaller proximity value will usually result in a fewer number of nodes being removed. USING SIMPLIFY LINES To access the function choose Filter > MAP Lines > Simplify Lines or the MAPublisher toolbar button . Enter a proximity value in Page Units or Map Units by making a selection from the Units drop-down list. Page Units will be simply the units of the current document. Enter a proximity value in the unit specified by typing a value or by using the arrows. Click the Preview button to see the simplification result. Once the result is correct, click OK to perform the actual simplification. It is always a good idea to experiment with different proximity values in order to achieve the desired results particular to your scale and coverage area. * In Adobe Illustrator CS3, Simplify Lines is found in the Filter > MAP Lines menu. Chapter 8: Line Functions Simplify Lines 101 RESULTS All selected lines or areas are simplified according to the settings. Simplified lines or areas will not be simplified again unless the tolerance value is increased. For example, if a line has been simplified with a proximity of 1.5 km., then it will not be simplified again until the tolerance is set to a value larger than 1.5 km. In practice, it means that simplified lines can be selected again with non-simplified lines to run the function again, when the Simplify Lines function is run only the new lines will be simplified (unless the proximity value is increased). NOTES: • • 102 It is a good idea to perform simplify lines on artwork before exporting a Flash map. This will reduce the size of the file and therefore it will have a faster rendering time. To smooth the appearance of paths using Bezier curves, use the Adobe Illustrator function Simplify Lines found in the menu Object > Path > Simplify. Chapter 8: Line Functions Simplify Lines MAP Stylesheets MAPublisher provides extensive tools for quick, easy and accurate styling of points, lines, areas and text. This function is able to read and work with the data found in the MAP Attributes panel and to apply symbols, graphic styles and character styles to artwork according to the legend criteria you specify. The topics covered in this section are as follows: MAP Stylesheets Panel MAP Stylesheet Editor Chapter 9: MAP Stylesheets 103 MAP Stylesheets Panel Window > MAPublisher > MAP Stylesheets or MAP Toolbar Panel Options Menu New MAP Stylesheet - Opens the New Stylesheet dialog box to specify a name and feature type for the new stylesheet. MAP Stylesheet List - An alphabetical list of the MAP Stylesheets and associated MAP Layers in the current document. Both are depicted with their feature type. Duplicate MAP Stylesheet - Will create a duplicate of the selected MAP Stylesheet. Lock button - Click this button to lock or unlock the layer. Edit MAP Stylesheet - Will open the MAP Stylesheet Editor dialog box to edit the selected MAP Stylesheet. No MAP Stylesheet - Lists the MAP Layers which are not associated to any MAP Stylesheet. Delete MAP Stylesheet - Delete the selected MAP Stylesheet. Create MAP Stylesheet legend - Allows you to create a legend using the selected MAP Stylesheet rules. Preferences - Opens MAPublisher Preferences on the MAP Stylesheet Panel property sheet (see chapter 1) Switch MAP View - Click this button to switch the selected layer from one MAP Stylesheet to another. Remove from Stylesheet moves the selected layer to [No MAP Stylesheet] section Delete MAP Stylesheet - Deletes the selected MAP Stylesheet. New MAP Stylesheet New MAP Stylesheet - Opens the New Stylesheet dialog box to specify a name and feature type for the new MAP Stylesheet. Name - Specify a name for the new MAP Stylesheet. Feature Type - Specify a feature type for the stylesheet: Area, Line, Point or Text. FUNCTIONALITY MAP Stylesheets allow you to quickly create and apply legends (or expression rules) based on MAP Attributes using symbols, graphic styles, and character styles that exist in the respective Adobe Illustrator panels. Stylesheets are created using specific values contained in the MAP Attributes panel for the related MAP Layer assigned to the MAP Stylesheet and then stylized using Adobe Illustrator symbology, graphic styles or character style. MAP Stylesheets can be applied to data on both a one to one basis, where specific attribute values are assigned with a specific style or symbol (i.e. Style 1 = Value A) or with attribute value ranges (i.e. Style 2 = Greater than Value B and Less than Value C). Stylesheet information will be saved in the Adobe Illustrator file so that the MAP Stylesheet can be quickly edited later. USING THE MAP STYLESHEETS PANEL To open the MAP Stylesheets panel, choose Window > MAPublisher Panels > MAP Stylesheets or click the Stylesheets button on the MAPublisher toolbar . The MAP Stylesheets panel contains a list of all MAP Layers. Similar to MAP Views, the icons used for these layers are: Area Layer Line Layer Point Layer Text Layer By default all MAP Layers will be listed as not belonging to a stylesheet— [No MAP Stylesheet]. When a new MAP Stylesheet is created, drag a MAP Layer into it. This will load its attributes for creating legend rules or expressions. 104 Chapter 9: MAP Stylesheets MAP Stylesheets Panel Loading Symbols and Styles The symbology used by MAP Stylesheets is directly related to the symbols and styles which exist in native Adobe Illustrator panels. In order to correctly function, the MAP Stylesheet requires that symbology or styles appropriate to the feature type is established in the following Adobe Illustrator panels: Area Stylesheets: Graphic Styles panel (Window > Graphic Styles) Line Stylesheets: Graphic Styles panel (Window > Graphic Styles) Point Stylesheets: Symbols panel (Window > Symbols) Text Stylesheets: Character Styles panel (Window > Type > Character Styles) Symbology can be quickly added to these panels by dragging and dropping artwork from the artboard, or by dragging and dropping symbology from custom libraries. As an example under Window > Graphic Style Libraries > Other Library… navigate to the Helpful Styles & Symbols Files folder (see Appendix 4) on your MAPublisher CD and load either MAP_AreaStyles.ai or MAP_LineStyles.ai. Then shift-select these styles and drag them into the Graphic Styles panel for use in Area and Line Stylesheets. Similarly you can navigate to Window > Symbol Libraries > Other Library… and load MAP_PointSymbols.ai. Then shift-select these symbols and drag them into the Symbols panel for use in Point Stylesheets. NOTE: An Adobe Illustrator file will save all the symbols, graphic styles and character styles created. Create a master file with all your symbols, graphic styles and character styles for easy reference when adding these elements for MAP Stylesheet creation. Creating a New Stylesheet To create new MAP Stylesheets you must first select New MAP Stylesheet… under the Options menu, or click the New button at the base of the panel. This will open the New Stylesheet function, where you are required to specify the name and feature type for the new MAP Stylesheet. Clicking OK will place the new stylesheet in the panel and assign it with the appropriate icon. It is possible to now drag single or multiple MAP Layers with a matching feature type into this stylesheet. If your data is held across a number of layers, all of these layers can be placed inside the same stylesheet.. Note that they do not need to contain the same attribute structures. As long as they are all of a matching feature type they can be placed inside one MAP Stylesheet. Deleting and Duplicating Stylesheets You can create as many MAP Stylesheets as you wish within a document. Note that in the MAP Stylesheets panel options menu there are functions to delete and duplicate stylesheets. Selected MAP Stylesheets may be deleted by clicking the Delete button at the base of the panel or by selecting Delete Stylesheet in the panel options menu. Only empty stylesheets can be deleted. Associated MAP Layers must be moved to [No MAP Stylesheet] or into another stylesheet via drag-and-drop or with the new Switch MAP Stylesheet button . Only at this stage will the Delete option be activated. Note that moving a stylesheet to [No MAP Stylesheet] will not restore the data to its default symbology; it will simply remove the relationship between attribute value and style/symbol. Chapter 9: MAP Stylesheets MAP Stylesheets Panel 105 Duplicate Stylesheet can be used to create copies of existing stylesheets. Even though the copy will not contain a MAP Layer at first, the style rules which exist between attributes of the original layer and the symbology will be retained. This is useful to create different versions of a map: for each stylesheet duplicate, edit the styles that relate to each value in each stylesheet. To apply the different styles, MAP Layers only need to be moved from one stylesheet to another via drag-and-drop or with the new Switch MAP Stylesheet button . Creating a MAP Stylesheet Legend A legend can be quickly created using any MAP Stylesheet. Any area, line, point or text MAP Stylesheets can be used for a legend. The legend is created by drawing an area, line, point symbol or displaying the word Style (using the character style set by the rule) followed by the expression associated with that MAP Stylesheet rule. Area MAP Stylesheet Legend Point MAP Stylesheet Legend Line MAP Stylesheet Legend Text MAP Stylesheet Legend Legend Symbol - Displays the associated symbol for the MAP Stylesheet rule Rule Name - Displays the name of the MAP Stylesheet rule Expression - Displays the expression used for the MAP Stylesheet rule To create a legend using MAP Stylesheets, a Legend layer must be created first. Create a layer in the Adobe Illustrator layers panel, drag the layer to a MAP View and define the layer as a Legend layer. Select the MAP Stylesheet that you would like to use to create the legend. In the panel options menu, select Create MAP Stylesheet legend. The legend font is set by the character panel. Select the font you would like to use for your legend using the character panel before creating a MAP Stylesheet Legend. Legends are fully customizable. If you would like to change any aspect of the legend this is can easily be accomplished. Select the legend and choose Object > Ungroup. The legend is now considered Adobe Illustrator artwork, allowing the individual elements to be edited freely. 106 Chapter 9: MAP Stylesheets MAP Stylesheets Panel MAP Stylesheet Editor MAP Stylesheets panel > Edit Name - Editable name of the MAP Stylesheet. Rules - List of styling criteria in a hierarchical format. Scale - To scale the symbols in point stylesheets or stroke in area and line stylesheets. Move Up/Down - To adjust the order in which the rules will be applied to . Rule Name - Editable name of the style rule. Expression - Click to edit the expression assigned to each style rule (*see below). Style† - List of established Graphic Styles (for area and line stylesheets), Character Styles (text stylesheets) or Symbols (point stylesheets). Add/Remove - To add a new style rule or delete the currently selected rule. Expression Mode Select the style of the display for creating expressions (*see below). *Simple Expression *Advanced Expression To compose and edit expressions in Simple Mode To compose and edit expressions in Advanced Mode Column - Lists the attribute column(s) of the associated MAP Layers. Range operator - Click to activate the second row to enable the composition of range expressions. Expression - Enter the expression directly into the entry field, or click the Browse button to access the Edit Expression function (see chapter 5). Comparison - List of operators (Equal to, Greater than, Less than or equal to etc) Value - List of values in the selected column. Expression Validity - Indicates if the expression is valid or invalid. If invalid, additional information is reported. For Text stylesheets, if the Style list does not contain a recently created character style, simply return to the Character Style panel, double-click this style and click OK in the Character Style Options dialog box. This forces Adobe Illustrator to re-load the list of character styles. † FUNCTIONALITY Accessing the MAP Stylesheet Editor When you have a MAP Stylesheet created which hosts at least one MAP Layer of the same type, click the stylesheet name, and choose Options > Edit… Alternatively double-click the new MAP Stylesheet. The Name of the current MAP Stylesheet will be displayed at the top of this dialog box, which is editable. Also a feature type icon will be displayed. To begin, click the Add button to create elements in your MAP Stylesheet. Assigning a Style Rule Name The Style Rule Name column will contain the name of each style rule. This can be edited to describe the style rule and/or its intention. For example, style rules could be named "Roads" or "Cities with populations over 200,000". Selecting Styles and Symbols The Style field will contain a list of styles that currently exist in the Adobe Illustrator Graphic Styles panel (for Area and Line stylesheets), in the Symbols panel (for Point stylesheets), or in the Character Styles panel (for Text stylesheets). For each rule, choose a style or symbol to use. Note you can only use a specified style once in a single stylesheet. The Move Up and Move Down buttons will move the priority of the selected style up or down the list. Chapter 9: MAP Stylesheets MAP Stylesheet Editor 107 Assigning an Expression The Expression field describes the criteria for applying the style rule. By default, the field displays the currently entered expression, if any. Clicking the Expression field opens either the Simple Expression panel or the Advanced Expression panel, depending on the Expression Mode and the current expression. Using the Advanced Expression, expressions created in the MAP Selection Filters may be re-used to create MAP Stylesheets rules. See chapter 5 for more information on the Expression Builder and chapter 11 on MAP Selection Filters. To choose the mode in which to compose your expression, select the Simple or Advanced option. Then assign an expression for each rule using the guidelines below. Simple Expressions... The Simple Expression panel is intended to facilitate quick expression generation. First, select a column from the drop-down list, or manually type in a name. Choose a Comparison. There are six options available: = > < Equal to Greater than Less than >= <= != Greater than or equal to Less than or equal to Not equal to S elect the Value against which the comparison will be applied. You can select the value from the drop-down list or enter the value manually. Similarly, the value does not have to appear in the list to be valid. I f you chose any Comparison except Equal to, (=), you then have the option of extending your expression further. Clicking the Range operator check box enables an additional Comparison and Value input pair. As with the first set, you must pick a Comparison and a Value, thus completing your expression. If you enter an expression with Equal to (e.g. Attribute1 = A), when you select this rule again and click the Add button, the new expression will be automatically written using the same attribute Equal to the next value on the list (e.g. attribute1 = B). This does not occur with the other operators. Advanced Expressions... The Advanced Expression panel lets you construct more complex expressions. E nter a valid expression in the Expression field. The Expression Validity icon will report if the expression entered is valid. Otherwise it will report and include additional warning notes. Alternatively click on the Browse button to enter and edit expressions via the Edit Expression tool (see chapter 5). The following are some examples of basic expressions which can be entered for styling rules. NAME = “Ontario” Result: All items with the value “Ontario” in the NAME column are assigned the selected style. POPULATION < 1000000 Result: All items with values less than one million in the POPULATION column are assigned the selected style. NAME = “Ontario” OR NAME = “Alberta” Result: All items with the value “Ontario” OR “Alberta” in the NAME column are assigned the selected style. NAME = “Ontario” AND POPULATION < 1000000 Result: Only items containing the value “Ontario” in the NAME column AND values less than one million in the POPULATION column are assigned the selected style. NOTE: String values are case-sensitive and must be entered between double quotes (“...”). 108 Chapter 9: MAP Stylesheets MAP Stylesheet Editor Assigning a Scale The Scale default is 100%. Editing the scale will alter the symbol size (points) or stroke weight (areas and lines). Building the Stylesheet For subsequent style rules proceed in the same manner. Click Add, and then specify a Name, Style, Expression and Scale. You can click Apply at any time to preview the results at any stage of building a stylesheet, and also return to edit settings you have made for individual style rules. In order to delete a style rule from the list, click anywhere in its row and click the Remove button. Click OK to exit the dialog box and to assign the MAP Stylesheet to the associated MAP Layers. IMPORTANT NOTES Expression Modes The Expression Mode determines which type of expression panel you get when editing a style rule’s expression The expression mode will be remembered from the last session. If the Expression Mode is set to Advanced, the expression panel will always be the Advanced Expression panel, irrespective of the expression being edited. If the Expression Mode is set to Simple, the expression panel will be the Simple Expression panel, unless the expression to be edited is not a simple expression. A Simple Expression is one that is either empty or includes only one attribute and no more then two clauses. For example: Simple Expression: AttributeA = 1 Simple Expression: AttributeB < 5 AND AttributeB > 1 Advanced Expression: AttributeC > 1 AND AttributeD > 10 If the current expression is not a Simple Expression, editing it will always result in the Advanced Expression panel. Dynamic Style Linkage Once a MAP Stylesheet has been assigned with styles and symbols, those styles and symbols are dynamically linked to their attribute values in the MAP Stylesheet if the expression is a simple equality. A simple equality expression is when there is only one attribute and only one clause (an equality comparison). For example AttributeA = 1 is a simple equality expression, while AttributeA > 15 is not. Applying the style from a style rule with a simple equality expression manually (i.e. changing a style of a polygon directly from the Graphic Styles panel) will assign the attribute value of that style rule in the MAP Stylesheet. For example, in the case above AttributeA on the modified art would be set to 1. Caution should be used with manually editing the styles of artwork after MAP Stylesheets have been applied if any style rules have simple equalities. Similarly, as styles and symbols which exist in these Adobe Illustrator panels are linked to the related MAP Stylesheet entries, using these styles and symbols to create new artwork will automatically assign the related attribute value to these objects when the same criteria are met. Chapter 9: MAP Stylesheets MAP Stylesheet Editor 109 Point Data Regarding the editing of Point Data, you must use either MAP Stylesheets or the MAP Attributes panel to change symbology. As point data is linked dynamically to the symbols which exist in the Symbols panel, you cannot edit graphical properties manually. Choosing Break Link to Symbol from the Symbols panel options will result in the loss of attributes for your point data. NOTE: MAP Stylesheet can be quickly created when using equality operators. If the first rule created is Capital = "Y" by clicking Add the next rule will be created using the next unique attribute value Capital = "N". Creating rules like this will use the next graphic style in the Style column. Symbols, graphic styles and characters styles will be displayed alphabetically in the Style column. Unique attribute values will be displayed alphabetically and numerically when creating expression rules. Therefore when creating a map that requires a style for each unique attribute value create the first rule and click Add to auto-populate the next rule. 110 Chapter 9: MAP Stylesheets MAP Stylesheet Editor Labelling Functions One of the most useful features of MAPublisher is the ability to create labels for map objects using values from the MAP Attributes panel. Manually entering and placing labels is not necessary, provided that the labelling information is included in the map attributes of the MAP Layer being labelled. MAPublisher provides two methods of adding labels to your map, both of which contain options to place labels intelligently using defined label settings. One way to create feature labels is to first select all the features you want to be labelled and use Feature Text Label to label all of them by specified attribute values. An alternate method involves using the MAP Tagger Tool to apply labels individually, also by specified attribute values. Topics covered in this section are: Feature Text Label MAP Tagger Tool For more advanced labelling capabilities refer to chapter 17 on MAPublisher LabelPro (additional license required). Chapter 10: Labelling Functions 111 Labelling Tools For Feature Text Label and MAP Tagger Tool Source Layer - Lists the Point, Line and Area layers which can be labelled. For Feature Text Label, only layers containing selected items are listed. Text layer - For each Source Layer, select the destination text layer you wish to place the generated text labels on. Source Column - Select the column that contains the values you wish to use to label the selected features. Label Settings - Click the appropriate button to assign label settings and rules for each layer type (see below). See Settings panels below Line Label Settings Distance from start - Controls where the text is located along the line. Auto - will place text at the midpoint for straight lines and find the smoothest portion closest to the midpoint for curved lines. Fixed - will allow for precise placement of text along a line. Follow/Don’t Follow Line - Select whether text should follow paths or be placed at a point near the selected line. Flip upside-down labels - By default this is always enabled and will automatically orient labels correctly. Disabling this feature will not flip label. Line Smoothing / Offset Line - Check to smooth the generated text path. Then specify an offset distance for the text path from the original. Adjust label if larger than line - Specify rules for the scaling of text if the text will not fit onto the text path in its entirety. Click the Up or Down buttons to adjust the order in which the rules will be implemented in the labelling process. Label Position - Choose how the text will be placed on the generated text path. Area Label Settings Labels curve with lines of latitude For projected layers, choose this option to generate curved text on latitude lines. Set all labels to same minimum size - If at least one label has been reduced in font size due to the implementation of rules, then ALL text items will be reduced to that font size ( in Feature Text Label only). Placement Accuracy - If you require area labels to be placed with high precision in the centre of area objects, choose High. To quickly generate labels, choose Low. Adjust label if larger than line - Specify rules for the scaling of text if the text will not fit inside the area object in its entirety. Click the Up or Down buttons to adjust the order in which the rules will be implemented in the labelling process. Set all labels to same minimum size - If at least one label has been reduced in font size due to the implementation of rules, then ALL text items will be reduced to that font size (Feature Text Label only). Point Label Settings Label Position - Choose the position of the label relative to the point symbol. Labels curve with lines of latitude For projected layers, choose this option to generate curved text on latitude lines. 112 Chapter 10: Labelling Functions Labelling Tools Feature Text Label Object > Filters > MAP Legend > Feature Text Label* or MAP Toolbar FUNCTIONALITY The Feature Text Label filter allows labels to be added to your map based on the attribute data of the features. Line, Point or Area MAP Layers containing attribute information can be labelled using this filter. All selected features on MAP Layers (which contain appropriate attribute information) can be labelled using this tool. Data selected on multiple MAP Layers can be labelled simultaneously. In addition, you may specify options such as alignment to lines of latitude, minimum font size, horizontal scaling and label position to place labels intelligently. PREREQUISITES Before using this filter you must create a Text layer in the MAP Views panel. Create a new Adobe Illustrator layer in the Adobe Illustrator Layers panel, and in the MAP Views panel, drag it to the MAP View holding the features you wish to label. Set the feature type to Text when prompted. For best results, set up a character style for type font, size, justification and color. (Adobe Illustrator menu Window > Type > Character Style). Select the appropriate style in the Character Style panel before starting the Feature Text Label tool and MAPublisher will generate labels based on these settings. Otherwise labels applied will appear in the current default colour, font and font size. Then select the features that you want to label and go to Filter > MAP Legend > Feature Text Label or the MAPublisher toolbar button to access the function. FEATURE TEXT LABEL SETTINGS Source Layer and Column You must first set the options for MAPublisher to determine the attributes that will be converted to text labels. The Source Layer list will show the Area, Point and/or Text layers currently containing selected data. For each layer, the Column drop-down list(s) is populated with the attribute structure of that layer. You must choose a column that holds the attributes you wish to label the map with. Target Text Layer In the Text layer drop-down list(s), you must specify a Text layer that the labels will be output to. Note you can only output labels to text layers in the same MAP View as the Source Layer. LABEL SETTINGS MAPublisher provides options to specify label preferences such as label position, alignment to lines of latitude, minimum font sizes and horizontal scaling to best place labels within polygons and paths. These label settings are common to Feature Text Label and the MAP Tagger Tool. Line Labels MAPublisher will place Line labels intelligently, depending on the curvature and length of the line string. Click the Line Labels button to assign MAPublisher Line Label Settings. * In Adobe Illustrator CS3, Feature Text Label is found in the Filter > MAP Legend menu. Chapter 10: Labelling Functions Feature Text Label 113 MAPublisher controls where text is placed along lines by using the Distance from start option. Selecting Auto will place text at the midpoint for straight lines and for curved lines this will find the smoothest portion of the curved line closest to the midpoint. Selecting Fixed, the distance from start is set as a percentage of the length of the line. Flip upside-down labels is enabled by default and will automatically orient labels correctly if your lines are flipped. Disabling this feature will not flip labels. If the Line Smoothing option is used, MAPublisher creates a smoothed path for each text object in the selected Text layer and places the text along this path at the specified Offset value. The labels can then be dragged and positioned at any position along a line. If the Line Smoothing option is not selected, the labels follow the original path. The Label Position option allows for the selection of the vertical position of the labels relative to the line. Three options are available: Baseline, Descender, and Center. • Select Baseline to place labels above the generated text path. • Select Descender to place the portion of a letter in a Latin-derived alphabet that normally extends below the baseline of a particular font above the generated text path. • Select Center to place the centre the label on the generated text path. Labels can be modified if they exceed the length of the line in the current default font size. First check the Adjust label if larger than line option to activate the label rules. Rules are executed by MAPublisher in a hierarchical order, and can be reordered by clicking the rule and clicking the Up or Down button. Checking the Reduce font size option will allow you to reduce the size of the font to a specified minimum size in points. Checking Reduce horizontal scaling allows text to be scaled down horizontally by the percentage specified. Feature Text Label also provides an additional option (not applicable in MAP Tagger). If any of the labels have been adjusted in size due to the activation of a line adjustment rule, all labels can be resized to the same size by checking the Set all labels to the same minimum font size option. If no rules are enabled, MAPublisher will not perform any label scaling. If none of the rules specified in the panel can be satisfied, MAPublisher will default to placing the label centered over the line. Also note that text generated for Line labels will be automatically orientated above the lines, irrespective of the direction of line digitization. Area Label MAPublisher will place Area labels intelligently, depending on the shape and size of the area polygon. Click the Area Labels button to assign MAPublisher Area Label Settings. Decide how to place area labels—with a high degree of precision or lower degree of precision—by choosing the appropriate Placement Accuracy option. If the Labels curve with lines of latitude option is selected, MAPublisher creates a path that conforms to local line of latitude and place the text along it. If this option is not selected, the labels are placed horizontally. This option is enabled only for MAP Views set with a projected coordinate system. Labels can be modified if they exceed the size of the area in the current default font size. First select the Adjust label if larger than area option to activate the label rules. Rules are executed by MAPublisher in a hierarchical order, and can be reordered by clicking the rule and then the Up or Down button. 114 Chapter 10: Labelling Functions Feature Text Label Checking the Reduce font size option will allow you to reduce the size of the font to a specified minimum size in points. Checking Reduce horizontal scaling will allow text to be scaled down horizontally by the fraction specified. Checking the Wrap Labels that are longer than area option will enter a carriage return at the nearest space in the text. NOTE: The Wrap Labels that are longer than area option is not available if the Labels curve with lines of latitude option is checked. Feature Text Label also provides an additional option which is not available with the MAP Tagger tool. If any of the labels have been adjusted in size due to the deployment of an area adjustment rule, all labels can be resized to the same size by checking the Set all labels to the same minimum font size option. If no rules are enabled, MAPublisher will not perform any label scaling. If none of the rules specified in the panel can be satisfied, MAPublisher will default to placing the label centered over the area. In situations with area compounds, MAPublisher will label the largest area in the compound. Point Labels Click the Point Labels button to assign MAPublisher Point Label Settings. If the Labels curve with lines of latitude option is selected, MAPublisher creates a path that conforms to local line of latitude and places the text along it. If this option is not selected, the labels are placed horizontally. This option is enabled only for MAP Views set with a projected coordinate system. Adjust the Label Position by specifying where you want the label to be positioned relative to the point. The nine options in the list allow you to select where the text anchor will be placed. FEATURE TEXT LABEL RESULTS When all the Layer Label Options have been set and the Label Settings have been specified click OK to label the selected features. Labels applied using Feature Text Label will appear in the current default colour, font and font size (as set by the selected character style). Chapter 10: Labelling Functions Feature Text Label 115 MAP Tagger Tool Tools > MAP Tagger Tool FUNCTIONALITY The MAP Tagger Tool allows labels to be added to your map based on the attribute data of the features. Line, Point or Area MAP Layers containing attribute information can be labelled using this filter. This tool functions similarly to the Feature Text Label filter. However, labels are created by clicking the feature with the MAP Tagger Tool. You also have greater control over the initial placement of the label, because the label is placed where you click, and the tool provides the ability to create leader lines for labelling congested areas of the map. In addition, you may specify options such as alignment to lines of latitude, minimum font size, horizontal scaling and label position to place labels intelligently. PREREQUISITES Before using this filter you must create a Text layer in your MAP Views panel. Create a new layer in the Adobe Illustrator Layers panel, and in the MAP Views panel, drag it to the MAP View holding the features you wish to label. Set the feature type to Text when prompted. For best results, set up a character style for type font, size, justification and color. (Adobe Illustrator menu Window > Type > Character Style). Select the appropriate style in the Character Style panel while using MAP Tagger tool, and MAPublisher will generate labels based on these settings. Otherwise labels applied will appear in the current default colour, font and font size. The MAP Tagger Tool can be found towards the bottom of the Adobe Illustrator Toolbar. Double-click the create new label settings or to edit settings. tool to MAP TAGGER TOOL SETTINGS Source Layer and Column You must first set the options for MAPublisher to determine the attributes that will be converted to text labels. The Source Layer list shows all Area, Point and/or Text layers in the current document. For each layer, the Column drop-down list is populated with the attribute structure of that layer. You must choose a column that holds the attributes you wish to label the data with. Target Text Layer In the Text layer drop-down lists(s), you must specify a Text layer that the labels will be output to. Note you can only output labels to text layers in the same MAP View as the Source Layer. LABEL SETTINGS MAPublisher provides options to specify label preferences such as label position, alignment to lines of latitude, minimum font sizes and horizontal scaling to best place labels within polygons and paths. These Label Settings are common to Feature Text Label and MAP Tagger Tool. 116 Chapter 10: Labelling Functions MAP Tagger Tool TAGGING MAP DATA When you have set all your Layer Label options and specified Label Settings, click OK to close the dialog box and confirm your settings. With the MAP Tagger Tool selected click the map object to label it. The following list of keyboard modifiers may be used for additional labelling options: (note = click map object with MAP Tagger Tool selected). Labels placed using current Adobe Illustrator Type and MAPublisher settings. Line labels are placed at click point and assigned angle of line at click point. Area labels are placed horizontally at click point. Point labels are placed horizontally at click point. + Shift Only applicable for Line labels. Labels placed using current Adobe Illustrator Type and MAPublisher settings. Line labels are placed horizontally at click point. + Shift + drag Labels placed using current Adobe Illustrator Type and MAPublisher settings and leader line created on drag. Line labels are placed horizontally. Leader line connects text to line feature. Area labels are placed horizontally. Leader line connects text to line feature. Point labels are placed horizontally. Leader line connects text to line feature. + drag Labels placed using current Adobe Illustrator Type and MAPublisher settings. Line labels are assigned angle of line at click point. Area labels are placed horizontally. Point labels are placed horizontally. NOTE: To create custom leader lines use a graphic style. Create or load a graphic style and select it in the Graphic Styles panel while using the MAP Tagger Tool function. Chapter 10: Labelling Functions MAP Tagger Tool 117 Making Selections MAPublisher contains tools for selecting data graphically and by attribute values. The MAP Selection Filters tool provides functionality to create, edit and save multiple selection criteria. These selections can be applied to any MAP Layer and are saved in the document. The MAP Selection Stats tool can be used for quickly selecting all features contained in a MAP Layer, for viewing how many objects are selected at a given time, to save a selection and to reverse selections. The topics covered in this section are as follows: MAP Selection Filters MAP Selection Stats Chapter 11: Making Selections 119 MAP Selection Filters Window > MAPublisher > MAP Selection Filters or MAP Toolbar Filters List - Lists the Selection criteria in the current document. MAP Selection Filters panel Not Valid Filter Icon- If the expression is not valid for that particular data layer a red exclamation mark will be displayed. Edit Selection Filter - Opens the Edit Selection Filter function (below) for editing the assigned expression. Valid Filter Icon - When a selection filter contains an expression that is valid for the active Adobe Illustrator data layer a green check mark icon will be displayed. Split layer - Opens the Split Layer function (below) for copying or moving selected objects to a new layer. Apply as New Selection - Makes a new selection using the highlighted criteria. Add to Current Selection - Adds the highlighted criteria to the current selection. Preferences - Opens the MAPublisher Preferences on the MAP Selection Filters property sheet. Remove from Current Selection - Removes the highlighted criteria from the current selection. Delete Selection Filter - Deletes the selected filter(s). Create New Selection Filter - Opens the New Selection Filter function (below) . Get Subset of Current Selection - Makes a selection within the current selection. New/Edit Selection Filter Edit Expression - Opens the Expression Builder for editing the assigned expression. Name - Assign or edit the name of the selection filter. Expression - Enter the expression directly into the entry field, or click the Browse button to access the Edit Expression function (see chapter 5). Split Layer Expression Validity - Indicates if the expression is valid or invalid. If invalid, additional information is reported. Expression - Assign or edit the expression. Expression Validity - Indicates if the expression is valid or invalid. If invalid, additional information is reported. Destination Layer- Enter the name of the new layer to be created. Edit Expression - Opens the Expression Builder for editing the assigned expression (see chapter 5). Copy attribute schema - Check this option to copy the attribute schema onto the new layer Method - Select the option to copy or move objects from the source layer to the destination layer MAP Selection Filters Panel Preferences Show filters on two lines - cleared 120 Chapter 11: Making Selections MAP Selection Filters Show filters on two lines - selected. FUNCTIONALITY MAPublisher Selection Filters allow you to build, edit and apply multiple selection criterias based on the attributes and properties contained in MAP Layers. Selection criterias are created in an expression builder. Selection filters can be applied to any MAP layer, and are saved in the document so that they can be edited or applied later. Expressions created in the MAP Selection Filters may be re-used for MAP Attributes and MAP Stylesheets expression builders (see chapter 5). CREATING A SELECTION FILTER To open the MAP Selection Filters panel, choose Window > MAPublisher > MAP Selection Filters or click the MAPublisher toolbar button . This panel will contain a list of all the selection filters in the current document. Create a new MAP Selection Filter by clicking the Create New Selection Filter button or panel options menu. This will open the New Selection Filter dialog box. The Name text box can be edited to describe the selection filter or its intention. For example, a selection filter could be named Cities or Countries with 80% or higher literacy. The Expression field describes the criteria for the selection of feature art. Build a valid expression in the Expression field. The Expression Validity icon will report if the expression entered is valid. Otherwise it will report and include additional warning notes. Alternatively click the Browse button to enter and edit expressions via the Edit Expression tool (see chapter 5). The following are some examples of basic expressions which can be entered for use as selection filters. NAME = “Ontario” Result: All items with the value “Ontario” in the NAME column are selected. POPULATION < 1000000 Result: All items with values less than one million in the POPULATION column are selected. NAME = “Ontario” OR NAME = “Alberta” Result: Items with the value “Ontario” OR “Alberta” in the NAME column are selected. NAME = “Ontario” AND POPULATION < 1000000 Result: Only items containing the value “Ontario” in the NAME column AND values less than one million in the POPULATION column are selected. Click OK to create the filter, adding it to the list of filters in the panel. EDITING AND DELETING SELECTION FILTERS The name and entered expression can be edited. To edit a MAP Selection Filter, double-click the appropriate selection filter in the panel, or click the selection filter in the panel and click the Edit Selection Filter in the panel options menu. This will open the Edit Selection Filter dialog box. Delete a MAP Selection Filter by clicking the Delete Selection Filter button or menu item. Chapter 11: Making Selections MAP Selection Filters 121 MAKING SELECTIONS Once MAP Selection Filters have been created they can be applied to a MAP layer. Selection filters can only be applied to one layer at a time. However, more than one filter may be applied simultaneously (use Shift or Ctrl (Windows) or Command (Mac) to select multiple filters). When applying multiple selection filters, art only has to satisfy one of the chosen selection filters to qualify (i.e. multiple selection filters are combined using the “OR” operator). NOTE: When the expression is marked as valid, it is not necessarily valid when applied to a given layer. For example, the expression Country=”Ohio” is only applicable to a layer with the Country attribute. If an expression is not valid for a layer, an error is shown when the selection filter is applied. There are four methods of applying a selection filter (available as buttons and menu items): • • • • Apply as New Selection: Clears the current selection and selects any art on the current layer that meets the criteria of the chosen selection filter(s). Add to Current Selection: Adds any art on the current layer that satisfies the chosen selection filter(s) to the current selection. Remove from Current Selection: Deselects any art on the current layer that is selected and satisfies the chosen selection filter(s). Get Subset of Current Selection: Deselects any art on the current layer that is selected and does not satisfy the chosen selection filter(s). SPLIT LAYERS A MAP Selection Filter may also be applied to create a new layer containing the selected features. Features can either be copied or moved from the source layer to the destination layer with the option to maintain the attribute information from the source layer. This function is particularly useful to split a layer that contains a lot of objects. For example, a road layer with classes such as street, highway and toll road could be split in three distinct layers. Split Layers can be used as a preliminary to running MAP LabelPro (to allow labelling of multiple classes with different styles, see chapter 17), or to exporting layers to external GIS formats. To use Split Layers, an appropriate selection filter must first be created. The layer to be split must be selected in the Adobe Illustrator Layers panel and the filter must be selected from the list of valid filters in the MAP Selection Filters panel. The Split Layers function is started from the MAP Selection Filters panel options menu Split "layer name". 122 Chapter 11: Making Selections MAP Selection Filters MAP Selection Stats Window > MAPublisher > MAP Selection Stats or MAP Toolbar A and R - All and Reverse. You can choose to either select all of the features on the selected MAP Layer, or reverse the current selection. Layer - The current MAP Layer and feature type. Number Selected/Number Existing - The field on the left represents the number of selected objects on the active MAP Layer. The field on the right displays the total number of objects of a given feature on the active MAP Layer. Recall - Restores a selection that has been saved to memory. Clear - Removes the saved selection from memory. Save - Save the current selection to memory so that it can be recalled later. M OR - Selects both the saved and currently selected features. M AND - Selects the saved features that are also currently selected. M XOR - Selects both the saved and currently selected features, but also removes from the selection any features that are both saved and selected. USING THE MAP SELECTION STATS PANEL To open the MAP Selection Stats panel, choose Window > MAPublisher > MAP Selection Stats or click the MAPublisher toolbar button . Layer Statistics On initial opening, this panel will display the total number of Map features that exist on the current MAP Layer, as well as how many are currently selected. As only one feature type is supported per MAP Layer, this dialog box will only display the current feature type. Only MAPublisher objects will be displayed in the MAP Selection Stats panel. Objects that are in [Non-MAP layers] in the MAP Views panel, will not be recognized in this panel. Selecting objects manually or via a MAP Selection Filter will update the left hand field in this panel. The right hand field will display the total number of map features that exist on the current MAP Layer. All or Reverse The dialog box offers a quick way to select all map features on the current layer. Simply click the A (All) button to select all the Map features on the current layer. Clicking the R (Reverse) button will reverse the current selection (i.e. all the features that were selected will be deselected, and the features that were deselected will be selected). Saving Selections The Save button will save the current selection to memory, allowing you to retrieve your selection again later. Only one selection can be saved, and it is limited to the current Adobe Illustrator session. A subsequent click of the Save button will overwrite the original saved selection. Clicking Recall will perform the selection that is saved to memory. Clicking Clear, will remove the saved selection from memory. Chapter 11: Making Selections MAP Selection Stats 123 Additional Selection Options This panel also offers additional selection tools: M OR, M AND, and M XOR. Current Selection Current Selection Current Selection 124 M OR Saved Selection M AND Saved Selection M XOR Saved Selection Resulting Selection Clicking the M OR button will select both the currently selected objects and the saved selection. Resulting Selection The M AND button will select the map features in the current selection which are included in the saved selection. Resulting Selection Chapter 11: Making Selections MAP Selection Stats The M XOR button will select both the currently selected features and the saved selection if these selections do not overlap. However if the current selection includes any features that are part of the saved selection, those will be deselected. Working With Images MAPublisher contains tools for working with georeferenced raster images such as aerial photography and satellite imagery. The Register Image filter accurately registers raster images with georeferencing information to vector map data. The Export Image filter exports raster images with various georeferenced formats. Georeferencing information for raster images are usually stored in a separate text file (except GeoTIFF) where the image and its associated reference file have the same file name but a different file extension. The reference file formats that can be read by Register Image, or written to by Export Image are: World (*.tfw) Image Report (*.irp) MapInfo TAB (*.tab) ListGeo (*.lgo) GeoTIFF (*.tif ) (a single file containing both the image and its reference data) Topics covered in this section: Register Image Export Image Chapter 12: Working With Images 125 Register Image Object > Filters > MAP Images > Register Image* or MAP Toolbar Register Image Tie Points† - Change the tie point of the image by clicking another corner of the graphic Placement X/Y† - Specify the coordinates (in map units) of the selected corner of the raster image. Image Size† - Specify the size of each pixel in the selected map unit (updates the Effective Map Size). Register Image supports non square pixels. Load File - Choose a file containing the georeference information for the selected raster image. The information from the file will be inserted into the appropriate fields. Constrain Proportions - Check this option to keep the pixel proportions. Effective Map Size X/Y† - Specify the X and Y size of the image in map units (updates the Pixel Size). † Coordinate System - Indicates the coordinate system of the loaded file (for GeoTIFF images). Set to unknown by default. Editing these options is not required when using the Load File function. Units - Select a unit to use for the specification of georeferencing information. The default selection is the current map unit. Undefined Layer This dialog box appears if the image to register is not placed on a MAP Layer Select MAP View - Register the image on a new MAP View (created from the image registration information) or select an existing MAP View from the drop-down list Feature Type - Select the type of feature that exists on the image layer. The feature type is indifferent if the layer contains only the image. Base Attribute Schema - Check this option to copy the attribute schema from an existing MAP Layer. FUNCTIONALITY The Register Image filter applies geospatial properties to images imported to the document with the Adobe Illustrator Place command, i.e. image placement and pixel or image size—entered manually or loaded from a reference file. If an image's coordinate system matches one of existing vector data, the image can be scaled and rotated to fit the vector data. If no matching vector data is found in the document, a new MAP view can be created to store the cartographic information of the image to allow for data digitization with accurate positioning. Register Image does not have the capability to transform images from one coordinate system to another. * In Adobe Illustrator CS3, Register Image is found in the Filter > MAP Images menu. 126 Chapter 12: Working With Images Register Image PREREQUISITES For Register Image to be functional, the geospatial properties of the raster image must be known. Some raster image formats store the relationship between source image coordinates (pixel location) and real-world reference coordinates in an associated reference file but do not save the coordinate system information (e.g. world file .tfw). The commonly used GeoTIFF images are embedded with geographic information such as position and coordinate system. Depending on the image format, check the position and coordinate system of your imagery with your data provider before attempting to use this tool. To fit the imagery to existing vector data, one option is to first transform the vector data to match the image's coordinate system in MAPublisher (see the MAP View Editor in chapter 4). Alternatively Avenza's Geographic Imager for Adobe Photoshop can be used to transform the imagery to match the coordinate system of the MAP View. Finally, the image must be imported to the document using the Adobe Illustrator Place command (File > Place). The image can be placed on any layer (MAP Layer or not). Use a MAP Layer only if it is certain that the image's coordinate system matches the MAP View containing the layer. NOTE: The image can be placed to a layer containing artwork, but it is recommended to use a specific layer, dedicated only to the image registration for better layer management and workflow. At this point, the image is placed on the artboard in a default location and with a default size. It still needs to be registered. With the image selected go to Object > Filter > MAP Images > Register Image* or click the MAPublisher toolbar button to access the function. * In Adobe Illustrator CS3, Register Image is found in the Filter > MAP Images menu. USING REGISTER IMAGE If the image is placed on a MAP Layer, the Register Image automatically registers the image using the coordinate system of the MAP View containing that MAP Layer. If the image is placed on non MAP Layer, the Undefined Layer dialog box opens. Users can either select to create a new MAP View or to use an existing MAP View (if it is certain that the coordinate system of this MAP View matches the one of the image). In both cases the feature type must be specified (indifferent if the layer only contains the image). When creating a new MAP View, the MAP View's anchor point and scale are derived from the registration information (placement and image size). In the case of GeoTIFF images, the MAP View's coordinate system is automatically read from the image header—for other image formats, the coordinate system has to be specified manually in the MAP View Editor after the registration process (see chapter 4 for more information on Specify coordinate system). Registration via Reference File To select a reference file click the Load File button and navigate to the folder containing the reference file. The reference file usually is called the same name as the image, but may have a different extension (.irp, .tfw, .tab or .lgo). In the case of the GeoTIFF format, the image file itself contains both the image and reference data, however the same GeoTIFF file (.tif) needs to be loaded to retrieve the georeferencing information. The values contained in this reference file are automatically entered into the image parameters. If the file is in GeoTIFF format, the image coordinate system is read and displayed in the Register Image dialog box Coordinate system field—for other file formats, the coordinate system is left to unknown. Chapter 12: Working With Images Register Image 127 Manual Registration To manually enter image parameters, one of the following combinations must be available in page units or map units: • The X and Y coordinates of one corner of the image and the X and Y Pixel Size. • The X and Y coordinates of one corner of the image and the X and Y size of the image. First choose the units to use for entering parameters by making a selection from the Units drop-down list. Then, click the appropriate corner of the graphic to indicate the image placement point and enter the X and Y coordinates for this location in the adjacent fields. Next set either the Pixel Size or Effective Map Size. The Pixel Size is the value of a single pixel in the units set. The Effective Map Size is the X and Y size of the whole image in the units set. Setting either option will update the other accordingly. NOTE: The MAPublisher Register Image supports the registration of images having non-square pixels. RESULTS When registering GeoTIFF images, a warning message will be displayed if the coordinate system of the image does not match the selected MAP View's coordinate system. When registering images not in GeoTIFF format while creating a new MAP View, the coordinate system of the MAP View has to be specified in the MAP View Editor to finalize the georeferencing. Provided that the coordinate system, placement and size of the raster image are correct, the image will be scaled and registered. When matching vector data is available, the image will fit to the artwork. The MAP Location Tool can be used to check the positions (see chapter 4). NOTES: • • Raster images cannot be transformed into another coordinate system. If the vector data is transformed through the MAP View Editor Perform Coordinate System Transformation function after the image has been register, the image will have to be transformed externally (with Avenza's Geographic Imager for example) and registered again in MAPublisher. Registered images can be re-scaled and rotated together with the vector data, but not automatically. After the vector data has been re-scaled or rotated using the MAP View Editor, Register Image must be used to re-apply the image referencing information. In the case of a manual registration, it is recommended to use the Export Image function before applying the changes to the vector data (see next paragraph). This way, registering the image again is only a matter of loading a reference file. SUPPORTED GEOREFERENCED IMAGE REFERENCE FORMATS World File (*.tfw, *.tifw, *.wld, *.eww, *.jgw, *.jpw, *.pgw, *.sdw, *.eww, *.blw, *.dmw) World files contain the affine relationship between source image coordinates (pixel locations) and real-world reference coordinates (lat/long or other real-world coordinate units). World files simply contain a computed relationship between source image coordinates and reference coordinates and not the complete reference point information. World files do not support storing coordinate system information. IRP Image Report File (*.irp) IRP Image Report files are ASCII report files indicating the coordinates of the four corners of the raster file and the pixel size in ground units to allow for georeferencing of the image in other image processing, CAD, or GIS programs. 128 Chapter 12: Working With Images Register Image MapInfo TAB File (*.tab) MapInfo Table file formats save the complete reference point list information such that it can be loaded again in the future. MapInfo TAB files support storing coordinate system information. Supported projections when saving the coordinate system are listed below: Albers Equal-Area Azimuthal Equidistant Cylindrical Equal Area* Eckert IV* Eckert VI* Equidistant Conic* Gall Stereographic* Hotine Oblique Mercator Lambert Azimuthal Equal Area* Lambert Conic Conformal Mercator* Miller Cylindrical* Mollweide* New Zealand Map Grid Hotine Oblique Mercator 1pt Polyconic Robinson* Sinusoidal* Swiss Oblique Mercator Stereographic Transverse Mercator * Coordinate Systems using this projection will not be stored when saving the reference file. ListGeo file (*.lgo) A ListGeo files are text files containing the GeoTIFF metadata information (or tags), which can then be read, and may also be used as input to other programs. GeoTIFF File (*.tif, *.tiff) Tagged Image File Format (TIFF or TIF) is a common raster graphic file format and one of the most common geospatial image formats you are likely to come across. Many raster geographic images from GIS systems are stored in this format. A GeoTIFF is a TIFF file with embedded geographic information such as position and scale in world coordinates, coordinate system or an explicit list of ground control points. NOTE: The only way to differentiate a regular TIFF image from a referenced GeoTIFF image is to open it in a spatial imaging software application (such as Avenza's Geographic Imager product). Unlike the other geographically referenced image formats discussed in this section, GeoTIFFs do not require a separate reference file. When registering a GeoTIFF image in MAPublisher, the same file name must be selected in the Load File dialog box—the required georeference information is contained in the file header. Supported projections when saving the coordinate system are listed below: Albers Equal-Area Cassini-Soldner - Cassini Cylindrical Equal Area Equidistant Conic Equidistant Cylindrical Equirectangular Gnomonic Hotine Oblique Mercator Laborde Oblique Mercator Lambert Azimuthal Equal Area Lambert Conic Conformal (1SP) Lambert Conic Conformal (2SP) Lambert Cylindrical Equal Area Mercator Miller Cylindrical New Zealand Map Grid Oblique Mercator Oblique Stereographic Orthographic Polar Stereographic Polyconic Robinson Sinusoidal Stereographic Transverse Mercator Transverse Mercator (South Oriented) VanDerGrinten Chapter 12: Working With Images Register Image 129 Export Image Object > Filters > MAP Images > Export Image or MAP Toolbar Store Geography As - Select the output format for the georeferencing information for the selected image. Save As - Choose a destination name and directory for the exported image. FUNCTIONALITY MAPublisher offers the ability to export placed raster files as georeferenced images for use in other programs and/or for archival purposes. This can be useful in a number of ways. For example, when working with an image for which there is no georeferencing file, use the MAPublisher Export Image function to create a GeoTIFF or other georeferenced image file based upon the coordinate system of the host MAP View. The Register Image filter can be used to accurately position and scale imagery with vector data. Alternatively the imagery can be manually moved, scaled or rotated to align with artwork in a designated MAP View. If the host MAP View contains accurate georeferencing information, Export Image can be used to save raster data to a fully georeferenced image format. It is also possible to convert the vector artwork to a georeferenced raster image. MAPublisher will export the selected image as a TIF, with a choice of the five reference file formats (see the previous page). USING EXPORT IMAGE With the image selected, go to Filter > MAP Images > Export Image or click MAPublisher Toolbar button . The Store Geography as drop-down list will show the five available reference file formats. A regular TIF file will be generated with a reference file carrying the extension TFW, IRP, TAB or LGO if one of these formats is selected. If GeoTIFF is selected from this drop-down list, only a TIF file will be produced, as this will carry both the image and the georeferencing information. RESULTS When all of the export options have been set, click the Save As button. Specify a name for the TIF file, and the location where it will be saved. If the format is a TIF and reference file combination, the reference file will carry the same file name and will be saved to the same location as the TIF. This image file can be subsequently used in imagery applications, such as Avenza's Geographic Imager for Adobe Photoshop, or in other Adobe Illustrator documents using MAPublisher. NOTE: Exporting linked images in CMYK color mode will create an incorrect result. These images must either be set to a different mode or embedded prior to exporting. * In Adobe Illustrator CS3, Export Image is found in the Filter > MAP Images menu. 130 Chapter 12: Working With Images Export Image Grids and Indexes MAPublisher contains tools to easily create map grids and map indexes. Grids can be created for reference purposes, or to follow designated lines such as latitude and longitude, and can also be labelled for indexing. When a labelled grid has been established, MAPublisher is able to generate index files, containing the location of text objects in MAP Layers. Topics covered in this section: Grid and Graticules Make Index Chapter 13: Grids and Indexes 131 Grids and Graticules Object > Filters > MAP Legend > Grids and Graticules* or MAP Toolbar Object > Edit Grid / Edit Graticules Advanced - Access the Advanced dialog box to specify additional options for the grids or graticules. Grid/Graticule Selection - Click the appropriate button to select the grid type required and to assign settings (see below). Note: Measured Grids can only be created on MAP Views in projected coordinate systems. See Settings panels below Center Style†- Select the Character Style to use for the Center Labels. Axes Style† / Place off grid cell - Select the Character Style to use for the Axis Labels. Select a distance off the grid to place the labels. Axis Labels - Solid graphic denote an enabled labelling option. Click an axis label to toggle all labels on that axis ON or OFF. Line Labels - Solid graphic shows labels will be generated. Click the line label to toggle it ON or OFF. Line Style† / Place off line - Select the Character Style to use for the Line Labels. Select a distance off the grid to place the labels. Label Direction - Click to reverse the direction that labels increment. Append units to labels - Choose to include labels (i.e. degree symbols) for Line Labels. Cell Labels - Solid graphic shows labels will be generated. Click a cell label to toggle all center labels ON or OFF. Flip Label Axes - Click to flip which axis will be labelled alpha and which numerically. Units - Set the units for Measured Grid dimensions if appropriate. If the Center, Axes and Line style lists do not contain a recently created character style, simply return to the Character Style panel, double-click this style and click OK in the Character Style Options dialog box. This forces Adobe Illustrator to re-load the list of character styles. † Labels Values - Select the type of labels to display (distances measured from the lower left corner of the grid, or actual projected coordinates (Eastings/ Northings) Index Grid Settings Number of Columns and Rows - Select this option to create a grid with it dimensions specify the number of columns and rows Cell Size in Page Unit - Select this option to specify the cell size in page unit (as specified in the Adobe Illustrator Document Setup.. Style - Select a style for the grid. Graticule Settings Pass through latitude - Specify a line of latitude that must be included (this can be any meridian within the data extents). Pass through longitude - Specify a line of longitude that must be included (this can be any meridian within the data extents). Don’t label - Checking any of these boxes will not label a specific column or row. * In Adobe Illustrator CS3, Grids and Graticules is found in the Filter > MAP Legend menu. 132 Chapter 13: Grids and Indexes Grids and Graticules Latitude Intervals - Specify the interval for each line of latitude. Longitude Intervals - Specify the interval for each line of longitude. Style - Select a style for the graticules. Vertices - Use the slider to increase or decrease the number of nodes which will be used in the construction of the graticules (use a higher number if graticules will be curved). Measured Grid Settings Cell Width/Height - Specify the dimensions of each cell comprising the grid in the current map units. Preset Origin - Choose this option to select a preset X and Y origin . Fixed Number of Cells - Check this box to enforce a set number of columns and rows in the grid. Grid passes through point - Choose this option to select specific coordinates for the X and Y origin . Style - Select a style for the grid lines. FUNCTIONALITY The Grids and Graticules tool will generate fully editable grid lines based on a number of user-defined settings. There are three grid types available. Selecting Graticules allows you to plot grid lines at specific lines of latitude and longitude which will be automatically curved if applicable. Choosing an Index Grid allows you to specify the number of cells that you wish to divide the current grid extents into. Choosing a Measured Grid also allows you to place grid lines, but with advanced control over placement, size, alignment, and labels using projected coordinates. A number of labelling options exist for each type of grid, allowing grid lines and grid cells to be labelled if required. Any form of grid plotted with this tool can be subsequently resized using the bounding box of the grid, and any parameter can be specifically edited via the Object > Edit Grid / Edit Graticules menu item. PREREQUISITES Before using this filter you must create a Legend layer in your Adobe Illustrator layers panel. Create a new layer, and then drag this to the MAP View holding the features on which you wish to plot a grid, remembering to set the feature type to Legend. MAPublisher will use the Normal Character Style when generating grid labels. If you wish to use a different text size, justification, font, stroke colour and weight, it is useful to create a new character style at this stage (Window > Type > Character Styles). A default grid line style will also be used. If you wish to use an alternate style for the grid lines, add the desired style to the Graphic Styles panel prior to accessing the Grids and Graticules function. The MAP View must have a coordinate system assigned in order to plot a grid. Graticules and Index Grids can be generated for any coordinate system. Measured Grids cannot be generated for a geodetic coordinate system used in a MAP Views. To access the function select the legend layer and navigate to Filter > MAP Legend > Grids and Graticules or MAPublisher toolbar button . Chapter 13: Grids and Indexes Grids and Graticules 133 INDEX GRIDS The Index Grid option allows grids to be created by dividing the extents of the current MAP View into a specified number of cells. The grid dimension can be either calculated from the specified number of columns and rows or by Cell Size in Page Units. Finally, a graphic style for the grid lines must be selected. NOTE: The page units are specified in the Adobe Illustrator document setup (main menu File > Document Setup). GRATICULES The Graticules option permits grid lines to be placed at specific degree positions and intervals. Specify a line of latitude and/or longitude that graticule lines must pass through. Then specify the interval for each subsequent line of latitude and longitude, and select a graphic style for the grid lines. Use the slider to increase or decrease the number of vertices used in the graticules if required (use a higher number if the graticules will be highly curved due to the current projection). The graticule may have a section in one of the corners that you do not wish to label (perhaps there is no data in this graticule, or there is only a small portion of that graticule showing and it does not need to be labelled). The don’t label feature allows you to not label a specific column or row. MEASURED GRIDS The Measured Grid option allows for cells to be plotted at specific sizes and position when there is a projected coordinate system in the current MAP View. The extents of the grid can be modified using this option within the geographical extents of the current MAP View. The width and height of each cell composing the grid should be specified in the Width and Height text boxes (you can modify the map units used for these dimensions if required by making an alternate selection in the Units list). A fixed number of cells for columns and rows can be enforced if required. Additionally you can specify a preset X and Y origin for the grid, or choose specific coordinates for a passthrough point. LABELLING OPTIONS A number of labelling options are available for use in grids and graticules. Axis labels and cell labels for indexing can be included, the direction of axis and cell labels can be modified and the axes used for alpha and numeric labels can be flipped. The ability to choose between labels starting from zero and actual projected coordinates is also when labelling the end of line. When using graticules on projected world maps, axis and line labels may not display properly (due to the extreme curvature of the graticules at the edges). In this case, it is recommended to use the don't label options. The labelling graphic shows the status of axis, cell and line labels (solid labels mean that label is enabled, grey labels mean that label is OFF). Click any cell label to switch all cell labels on or off. Click a line label to switch that line label only on or off. Click an axis label to switch the labels on that axis only on or off. Click a horizontal arrow to flip the direction of labels on the top and bottom axes. Click a vertical arrow to flip the direction of labels on the left and right axes. Click a corner graphic to swap which axes are labelled numerically and which are labelled alphabetically. For indexing choose a character style to use for the cell labels by selecting an entry for Center Style, choose a 134 Chapter 13: Grids and Indexes Grids and Graticules character style to use for the labels on each axis by selecting an entry for Axes Style. For axes labels specify a distance away from the edge of the grid that the labels will be placed. Choose a character style to use for the line labels by selecting an entry for End of Line Style to label the position of the grid or graticule in map units. Select actual coordinates or distance from zero with the lower left corner being the origin. For end of line labels specify a distance away from the edge of the grid that the labels will be placed, and append the current units to each label. ADVANCED OPTIONS Click the Advanced button to access additional grid extents and labelling options. Modify the extents of the grid by entering new coordinates for the Lower Left and Top Right position of the grid in the current units. It is also possible to edit the first value used for cell labels by editing the Start alpha/numeric index at values. Omit certain alpha characters from cell references with the Do not use characters option. For example, it may be useful to omit the characters “I” and “O” for indexing purposes (when entering alpha characters to omit, separate characters with a comma). The Reference label order option can be edited to change the center labels from alpha-numeric (A-1) to numeric-alpha (1-A), or vice versa. Lower Left - Adjust X and Y values for the lower left of the grid extents. Top Right - Adjust X and Y values for the upper right of the grid extents. Start alpha/numeric index at - Edit the first value used for cell labels. Do not use characters - Enter alpha characters to omit from cell references. Reference label order - Choose to make Center Labels alpha-numeric or numeric-alpha. Chapter 13: Grids and Indexes Grids and Graticules 135 GENERATING AND EDITING THE GRID When all the options have been set, click OK to create the grid. The grid will be plotted on the legend layer using the entered parameters. Use the bounding box of the generated grid (View > Show Bounding Box) to resize if required. Resizing grids horizontally or vertically will add or remove component cells in the grid. After transforming a MAP View containing a grid, the grid will be transformed and rescaled within its current bounds (the physical extents of the grid on the page is not edited). In this scenario you should use the bounding box to resize the grid to the new bounds. If you wish to change any parameter without generating a new grid, simply select the grid and access the Object > Edit Grid/Edit Graticules menu item. This will re-open the Grids and Graticules function and the current parameters of the grid will be available for editing. You can even choose an alternate grid type if required. IMPORTANT NOTES Manually editing type position, font, colour etc is not possible on Grids and Graticules in their default grouped state. Manual editing is possible however if you first expand the object (Object > Expand), though this will negate any opportunity to subsequently edit the art via the Grids and Graticules filter. Certain projected coordinate systems may cause incomplete grids and/or graticules to be drawn. Such issues may occur if the MAP View is in a polar coordinate system or the extents of the data cross the 180 degree west/east meridian. Measure grids cannot be labelled properly using actual coordinates when the data is projected using a stereographic or orthographic coordinate system. If the generation of a grid/graticule causes blank or incomplete results, the following workflow should be used: 1. 2. 3. 4. 5. Transform the MAP View to a geodetic coordinate system (e.g. WGS 84). Generate your grid or graticules on this MAP View. Expand the object (Object > Expand). Create a new area layer in the MAP View. Drag the expanded grid to this new layer. Transform the MAP View back to the original projection. Please see Appendix A3 for more information on working with grids and graticules in MAPublisher 8. 136 Chapter 13: Grids and Indexes Grids and Graticules Make Index Object > Filters > MAP Legend > Make Index* or MAP Toolbar Make index based on label position - An index will be created by assigning one index location for each label found on the selected label text layer. Make index based on label and matching feature position - MAPublisher will determine what features to index by matching label text on the selected Label layer to the indicated attribute on the Feature layer. An index will be created for every grid cell in which the labelled feature can be found. Advanced - Click this button to open the Advanced dialog box (below), enabling you to specify additional options for your index. Advanced Options Sort index by - You can choose to sort the entries in the index file by either feature label or grid cell address. Index Delimiter - Select a delimiter for the index file - Tab, Comma or Custom. If you choose Custom, enter the desired delimiter into the adjacent entry field. FUNCTIONALITY When a Grid or set of Graticules have been created, the Make Index filter can be used to generate an index for your map based on the position of text elements in referenced grid cells. Index files generated using this function are produced as a simple text file, and sorted alphabetically. A typical file would be formatted as follows: Melrose Place Richview Avenue Sesame Street Wisteria Lane B-4 A-5 A-4 B-5 PREREQUISITES In order to facilitate the creation of a map index using this filter you must have created an Index Grid, Measured Grid or set of Graticules using the Grids and Graticules filter. This grid must exist on a Legend layer, and be selected in order to access the function. An index will be created even if grid labels are hidden. The Text layer containing the labels to be indexed must be located in the same MAP View as the grid. To access the Make Index tool, choose Filter > MAP Legend > Make Index or MAPublisher toolbar button . * In Adobe Illustrator CS3, Make Index is found in the Filter > MAP Legend menu. Chapter 13: Grids and Indexes Make Index 137 USING MAKE INDEX Index Based on Label Position This method will create an index by assigning one index location for each label found on the selected label text layer. For example if the label "High Street" is only found in grid cell A-4, the only entry for "High Street" in the index file would be as follows: High Street A-4 Select the Make index based on label position button to generate an index using this method. Then choose the Label layer from the drop-down list which contains the text you wish to index. Index Based on Label and Matching Feature Position This method will create an index by matching label text on a selected Label Layer to the indicated attribute on the Feature layer, creating an index entry for every grid cell in which the feature can be found. Note that only features that have labels can be indexed. For example if "High Street" passes through grid cells A-3, B-3 and C-4, the grid cells will be sorted alphabetically on one line. High Street A-3, B-3, C-4 • • • • Select the Make index based on label and matching feature position button to generate an index using this method. Choose the Label layer from the drop-down list which contains the text you wish to index. Choose the layer that was used to generate the labels from the Feature layer drop-down list. In the Label text matches attribute list, select the attribute column in the selected Feature layer which matches the labels you are indexing. Formatting Options If you wish to set additional options to control the formatting of your index file, click the Advanced button. Choose an option to Sort index by. This will be the ordering of your index entries. The default is the Feature label itself, meaning for example, countries starting with A will be listed first. Alternatively, you can choose to index by Grid cell, meaning labels inside the cell marked A-1 will be listed first. Make Index also provides an option to specify an Entry Delimiter, being the form of the separator between grid cell and text label for each index entry. You can choose from Tab, Comma, or specify a Custom delimiter. Saving the Index File When you have set all of your index options, click the Save As button. This will allow you specify a name for the text file, and the location where it will be saved. You can open this file in a text editor, or place it back into document using the Adobe Illustrator Place function*. * Using Adobe Illustrator CS4 on Mac OS X, it is recommended to copy the index contents into a text box instead of using the Place function. 138 Chapter 13: Grids and Indexes Make Index Scale Bars and North Arrows MAPublisher contains tools for plotting accurate scale bars and north arrows onto your map. The Scale Bar filter offers a number of different designs that you can choose from, including double-bar designs for the placement of scale bars in multiple units. North Arrows are created from selected artwork on the page using the Create North Arrow filter, and will be immediately aligned to true north. Topics covered in this section: Scale Bar Create North Arrow Chapter 14: Scale Bars and North Arrows 139 Scale Bar Object > Filters > MAP Legend > Scale Bar* or MAP Toolbar Object > Edit Scale Bar Preview Panel - Displays a preview of the generated scale bar. Select Style - Use the Previous and Next buttons along with the Scale Bar Preview Panel to select the desired scale bar. Units - Select the desired map units to be used in the selected scale bar. Advanced toggle - Click to show or hide the scale bar options in the lower section. Interval - Specify the length of each interval in the selected map unit. Horizontal lines - Select the desired number of horizontal lines to be included in the scale bar. Used with certain scale bar styles only. Labeled intervals - Enter the number of interval which will comprise each bar. Intervals to subdivide - Enter the number of scale bar intervals to be subdivided. Sub intervals - Select the number of sub-intervals for each subdivided scale bar interval. Add interval left of zero Check this box to have an interval placed on the scale bar to the left of the zero mark. Text Style† - Select the Adobe Illustrator Character Style to be applied to the text. Labelling - Set a style for labels from the Character Styles panel. Display the scale value and specify its location. Display a page to map units ratio and choose its location. Display the units used in each bar if required. Display scale value - Check this option to display the scale value above or below the bar. Display page to map units ratio Check this option to show the scale as page unit to map unit ratio. Page units is selectable from cm, mm or inch . If the Text style list does not contain a recently created character style, simply return to the Character Style panel, double-click this style and click OK in the Character Style Options dialog box. This forces Adobe Illustrator to re-load the list of character styles. † Display units - Check this option to display the interval unit on the scale bar. FUNCTIONALITY MAPublisher contains ten different scale bar designs that you may incorporate into your map. After creation, MAPublisher scale bars can be subsequently resized via a bounding box (for example to add or remove component intervals). Scale bars can also be edited by selecting the Object > Edit Scale Bar menu item. PREREQUISITES To accurately create a scale bar your MAP View must contain accurate georeferencing information and the coordinate system must be projected. (i.e. not in degrees) . The MAP Layer on which you intend to create your scale bar must be a selected (active) and unlocked Legend layer. If you require a custom character style to be used for the labels of the Scale Bar, it is also advisable to establish this style (Window > Type > Character Styles) before opening this dialog box. The Scale Bar dialog box is accessed by clicking the menu Filter > MAP Legend > Scale Bar or MAPublisher toolbar button . * In Adobe Illustrator CS3, Scale Bar is found in the Filter > MAP Legend menu. 140 Chapter 14: Scale Bars and North Arrows Scale Bar ADDING A SCALE BAR Standard Options Use the Previous and Next buttons to select the scale bar design you require. Note that certain scale bar designs contain two bars and when such a design is selected, the Second Bar column of options will be enabled. In the Units drop-down list, specify the units that you wish the scale bar interval(s) to be based on. The default units are that of the current MAP View. In the Interval text box(s), specify a real-world distance that each interval of the scale bar will represent. This figure will be in the unit you specified in the Units list. NOTE: A scale bar cannot be created on a MAP View that contains a coordinate system using custom (user defined) point styles or units. Advanced Options Click the Advanced button to show or hide additional scale bar parameters. Specify the number of cells in the bar(s) by entering a figure in the Number of labeled intervals entry field. Depending on the style of scale bar you have chosen, you can also specify the Number of horizontal lines that will compose the scale bar. If you wish some of the intervals or cells in the bar(s) to be additionally subdivided, choose a figure from the Number of intervals to subdivide list. The subdivided cells will begin from the left of the bar(s). The Number of sub-intervals that compose each of these cells can be specified in the next list. You can also choose to Add an interval left of zero if required. Labelling Options Choose a Character style for the scale bar labels by choosing a style from the list. The label options allow you to add extra scaling information to the generated scale bar. The text that will be generated by this tool is displayed in the Preview panel when the options are set. Generating the Scale Bar When you click OK the selected scale bar will be placed on the legend layer at a default position. The Adobe Illustrator editing tools may be used to move the scale bar to a desirable location. Chapter 14: Scale Bars and North Arrows Scale Bar 141 EDITING A SCALE BAR Use the bounding box of the generated scale bar (View > Show Bounding Box) to resize. Resizing scale bars horizontally will add or remove intervals from the bar(s). Resizing vertically will adjust the width of the bar(s). Scale bars can also be resized using the Adobe Illustrator menu Object > Transform >Transform Each, by changing the horizontal or vertical scales. If you require a different design to be used for your scale bar, or wish to change any parameter without generating a new version, select the scale bar and access the Object > Edit Scale Bar menu item. This will re-open the Scale Bar dialog box and the current parameters of the bar will be available for editing. NOTE: Manually editing the type position, font, colour etc. is not possible on scale bars in their default grouped state. However, manual editing is still possible if the object is expanded first (Object > Expand). Please note, however, that his will remove all opportunity to subsequently edit the art via the Scale Bar filter. Please see Appendix A3 for more information on working with scale bars in MAPublisher 8. 142 Chapter 14: Scale Bars and North Arrows Scale Bar Create North Arrow Object > Filters > MAP Legend > Create North Arrow* or MAP Toolbar FUNCTIONALITY The MAPublisher Create North Arrow filter provides the functionality to convert selected symbology into a geographically correct north arrow. Once the north arrow is created it will be rotated to true north, and this property will be maintained through subsequent reprojection or rotation. PREREQUISITES The MAP Layer on which the art to be converted to a north arrow resides must be a Legend layer, and be selected. This Legend layer must be hosted by the MAP View that you wish to base the alignment of the north arrow on. CREATING A NORTH ARROW Select the piece of art that you want to convert to a north arrow. The art can be any form of artwork which can normally be converted to an Adobe Illustrator symbol. Then select Filter > MAP Legend > Create North Arrow or MAPublisher toolbar button . Upon creation, the north arrow will be added to the Adobe Illustrator Symbols panel and the coordinate system of the host MAP View will be used to align the north arrow correctly. When the north arrow symbol is repositioned on the map, it will be re-oriented to the true north at the new location. NOTE: Sample north arrow designs are included on your MAPublisher CD. Go to Window > Symbol Libraries > Other Library… navigate to the Helpful Styles & Symbols folder on your CD and load the MAP_NorthArrows.ai file. Drag the required symbol onto your Legend layer and then execute the Create North Arrow filter. * In Adobe Illustrator CS3, Create North Arrow is found in the Filter > MAP Legend menu. Chapter 14: Scale Bars and North Arrows Create North Arrow 143 MAP Web Author Users should have a basic understanding of HTML syntax to use this feature. MAPublisher 8 introduces the MAP Web Author tool that exports Adobe Illustrator documents with GIS data to interactive Flash maps, fully completed with callout bubbles, rollovers, layer control, pan and zoom controls, and with all the underlying GIS attributes intact. As with the other MAPublisher functions, MAP Web Author is a completely built-in to Adobe Illustrator. Therefore, users are not required to have Adobe Flash installed to benefit from this tool. An interactive Web map is exported without any additional coding or software requirements immediately after the map document is created with MAPublisher. All the GIS attribute information can be embedded in callout bubbles. The resulting Flash map offers controls for the layers visibility. Additionally, specific feature (point, line, and area) can be identified from the attribute information when users type a keyword in a search box. Users with advanced knowledge in HTML syntax will be able to embed the created Flash map objects to any Web page. Topics covered in this section are: MAP Web Author Panel Web Tag Dialog Export to Web Web Export Advanced Settings MAP Web Author Workflow Chapter 15: MAP Web Author 145 MAP Web Author Panel Window > MAPublisher > MAP Web Author or MAP Toolbar MAP Web Author Panel Add/Modify - Click this button to open the Web Tag Dialog, add or modify the tags of a single selected object (Add if no tag exists, Modify if a Tab already exists). Multiple - Click this button to open the Multiple Web Tag Dialog, add or edit existing tag for all the selected objects at once. Remove - Click this button to clear the tags of the selected objects Add/Modify Zoom - Click this button to zoom to Web tagged object. Template - Click this button to modify the layer template. By default, the template lists all the attributes from the layer of the selected object. All Web Art - Click this button to select all the artworks that have a tag in the document. Web Art on Layer - Click this button to select all the artworks that have a tag in the currently selected layer. Specify Source Media Folder - Specify the directory path to the media files that might get inserted in callout bubbles. Export to Web - Click this button to open the Export to Web dialog box. Previous/Next Web Artwork - Click the arrows to navigate from one Web tag object to another. Specify Source Media Folder Absolute Path - Select this option to set an absolute path (best used when working on a single computer). Relative Path - Select this option to set a path relative to the current location of the Adobe Illustrator document (best used when files have to be moved). Newly created documents must be saved for this option to be enabled. Browse- Click this button to browse to the directory containing the media files (images). Remove- Click this button to clear the current Source Media Folder settings. FUNCTIONALITY The MAP Web Author tool exports a MAPublisher document as an interactive Flash map for Web display. Together with the map artwork, Web tags (callout bubbles) are exported. Prior to the export process, the MAP Web Author panel is used to create, edit, add, or modify these interactive objects. The Web tags can either be populated one object at the time or for a selection of objects (Multiple). The information can be entered manually or extracted from the MAP Attributes fields (when available for the object layer). In Multiple Web tagging mode, the same text format is applied to all Web tags. Individual Web tags can be edited later on through the Modify dialog box. Text and image formatting is done using simple HTML codes, the results can be checked in the Callout Preview window available in the Web Tag Dialog. Additional settings are available during the export process, such as callout bubble colour, selection colour, etc. 146 Chapter 15: MAP Web Author MAP Web Author Panel PREREQUISITES In order to use MAP Web Author, you must first complete a map using MAPublisher and Adobe Illustrator tools. The size set for the Adobe Illustrator document will be the size of the Flash map on the Web browser. It is recommended to set the document size before any work is started. However, at a later stage, the document size may be changed in the Adobe Illustrator Document Setup dialog box. Using the Pixels unit is the most practical to compare with Web browser sizes. To benefit from the Web tagging based on MAP Attributes, the MAP layers must have the relevant attributes populated. For example, to insert links to images using the Multiple method, the image file name and path must be set as an attribute value, therefore the MAP layer must have a dedicated attribute field (e.g. house.jpg). NOTES: • • Not just any map can be made into a Flash Map. A print ready map does not necessarily mean that it is a Flash ready map. Unneeded art and attributes should be removed, lines should be simplified. Layers that do not require tagging will still be exported. Only the active artboard will be exported to Flash (Adobe Illustrator CS4 only). Furthermore, the directory containing the images (Source Media Folder) must be organized. The supported image formats are jpeg, png and gif. To be sure that images can be viewed properly, the latest Flash Player version should be installed (download from Adobe website www.adobe.com). USING MAP WEB AUTHOR Specify the Source Media Folder The Source Media Folder is the directory containing the images that might be displayed in the Web tags (callout bubbles). The path to this directory must be specified through the MAP Web Author panel options menu Specify Source Media Folder. Either an Absolute Path or a Relative Path may be entered. An Absolute Path refers to the full folder directory path (e.g. C:\folder1\folder2...). A Relative Path refers to the folder path from the current location of the Adobe Illustrator document. Absolute Path example Relative Path example If the Adobe Illustrator file is to be exchanged between computers, it is good practice to use a Relative Path to avoid having to reset the link to Source Media Folder when the files are moved. Chapter 15: MAP Web Author MAP Web Author Panel 147 Add and Edit Web Tags The Web Tag Dialog is started when clicking the Add or Modify button. This option is enabled when one single object is selected or several objects from a same layer are selected. See next page for details. When several objects are selected the Multiple button is enabled to allow Web tagging on several objects at once. Clicking Multiple starts the Multiple Web Tag Dialog, which is similar to the Web Tag Dialog, the only difference is that additions are applied to all selected objects at once. Objects that are tagged with the multiple mode, may be modified individually at a later stage, using the Modify button. Web Selection Select all the objects with Web tags (All Web Art button) or all objects on the current layer (Web Art on Layer). The navigation buttons may be use to highlight objects consecutively. Create a template The Template button opens a dialog box to create a template that is then accessible from the Web Tag Dialog (see next page). By default, the template is set per layer to show the list of all attributes as: • Attribute1 Name: Attribute1 Value • Attribute 2 Name: Attribute2 Value • etc... OK - Click OK to save the template for further use. Cancel - Click cancel to reverse to the last saved template. Default - Click this button to reset to the default template (list of all attributes). Clear - Click this button to clear the template entries. NOTE: The template is fully editable. It can include attributes, regular text with HTML formatting. Export to Web The Export to Web button starts the Web Export Dialog described later in this chapter. 148 Chapter 15: MAP Web Author MAP Web Author Panel Web Tag Dialog Callout Title - Type here the title of the callout bubble. Callout Preview - Click this button to open or close the preview of the callout bubble. Insert Image - Select Manually to browse to the image manually. Select By Attribute to type the attribute name containing the path to the image (string type). Callout Size - Set the size (width and height in pixels) of the Web tag. Image Width and Height - Specify the image width and height in pixel or use original size. HTML Text Editor Tools and Graphic Tools - Use these tools to edit the text. Edit the callout contents. Supported HTML tags may be used to format the text and images in the contents. HTML Supported Tags - Click here to open a link to Adobe Web site with Flash documentation on HTML supported tags. Previous and Next - Click Previous or Next button to switch from one object to another (buttons are enabled when more than one object is selected). Auto Size - Check this option to have the callout bubble size be automatically set from the image size and text contents. Trigger External URL (Advanced) This function allows users to setup properties so that web pages may be opened in a different frame, when either clicking or hovering on a web-art. The user has to create a set of framesets and target the Web page to a specific frame. Callout Bubble example: Callout title Callout Image - as set in the image frame. Callout Contents - can contain text, images and graphics. Set in the contents frame. FUNCTIONALITY The Web Tag Dialog and Multiple Web Tag Dialog are started from the MAP Web Author panel by clicking the buttons Add, Modify or Multiple. These dialog boxes are meant to design the callout bubbles (also known as Web tag) that will popup when clicking objects in the produced Flash map. Not all objects in the map need to be associated with a callout, users must design their Flash maps to make them readable, not too crowded, but still containing the information they wish to display. NOTE: Objects associated with a callout are also called Web Art. Only Web Art will be searchable in the resulting Flash map (see Export to Web). Chapter 15: MAP Web Author Web Tag Dialog 149 PREREQUISITES In the Web Tag Dialog, text and image parameters are edited using HTML Tags. HTML Tags are key codes written between less than (<) and greater than (>) signs, that indicate how the Web browser should display the text. There are opening and closing version for most (but not all) of the tags, and the affected text is contained between two tags. Both the opening and closing tags use the same key code but the closing tag is preceded by an initial extra forward slash sign (/). Examples of text formatting: Opening Tag Closing Tag Text <b>Maps of the World</b> <i>Maps of the World</i> Result Maps of the World Maps of the World Some HTML tags are used to insert links and images. Examples: •<a href="http://www.avenza.com"> Avenza Web Page</a> Creates a link to www.avenza.com accessed when clicking "Avenza Web Page" text. •<img src="sourcemedia/picture.jpg" hspace="0" vspace="0" align="left" > Inserts an image (picture.jpg located in the Source Media Folder). Besides, HTML ignores extra spaces and returns, therefore commands must be used to create line breaks. For example, the key code <br> is used for line break, <p> to start a new paragraph. In addition to the HTML tags, MAPublisher can use text extracted from the MAP Attributes table. The reference to the attribute field name is indicated between two percent (%) signs: %Attribute_1% Examples use of attribute field: •<b>%Street_Name%</b> Main Street •<img src="sourcemedia/%image%" hspace="0" vspace="0" align="left" > Shows image indicated in the attribute called "image" (a string text). hspace and vspace set the horizontal and vertical space left blank around the image. align set the image alignment to the left of the page •<a href="http://%WebSite%"> Avenza Web</a> Avenza Web (and opens the Website indicated in the attribute WebSite on click). Text with HTML tags may be directly entered for formatting or benefit from the Web Tag Dialog HTML Text Editor Tools described here after. USING THE WEB TAG DIALOG Callout Set-up and Preview The user must set the Height and Width of the callout bubble in pixel units or use the Auto Size option. The Auto Size option sets the size of the bubble automatically based on the contents (image and text). The Preview button opens or closes the preview of the callout. As text and images are inserted, the preview gets updated to show the aspect of the callout bubble prior to export. 150 Chapter 15: MAP Web Author Web Tag Dialog Insert a Title Callouts may have a title (shown at the top of the bubble). The title can be typed in as a simple text, but it can also be formatted using HTML tags and MAP Attribute values. Insert an Image Images can be inserted in the callout bubble, on the side of the main contents. To insert an image by browsing to the image file with a file navigator, select Manually. To use an attribute value containing the path to the image file, select By Attribute. The attribute field name must be entered between percent (%) signs, e.g. %Image_File%. By default, the original image size is maintained. It is however possible to change it by using the Width and Height text boxes (the width/height ratio is maintained). This option is not available for Multiple tagging with option By Attribute. NOTE: The maximum size for a callout is 1000 pixels x 1000 pixels. When this limit is reached, images are automatically scaled to fit (image aspect ratio is maintained). Add and Edit Contents As explained in the Prerequisites, the callout bubble text and contents can be typed and formatted using HTML tags. The Web Tag Dialog also provides a series of tools to create the HTML tags formatting. It works as follows: • Type the text or parameter (for image, link and charts) • Highlight the text • Click the edit buttons (see below) The HTML tags are added to the text body . In the Preview, the text is shown in the appropriate format and images, links or charts are displayed. Aside from the HTML tags, the Web Tag Dialog provides a drop-down list to pick MAP Attributes name (visible attributes only) or the Template (as set up in the MAP Web Author panel). Template- Loads the template as set up in the MAP Web Author panel. MAP Attributes- Pick an attribute name in the list so that it gets inserted in the callout bubble contents. NOTE: MAP Attributes column names are case sensitive. Chapter 15: MAP Web Author Web Tag Dialog 151 Button Function HTML text Result Bold <b>bold text</b> bold text Italic <i>italic text</i> italic text Hyperlink <a href=”http://www.avenza.com”> Avenza Page</ Avenza Page a> Break line break<br>line break line List <ul> <li>list 1</li> <li>list 2</li> <li>list 3</li> </ul> list 1 list 2 list 3 Insert image <img src=”ImageFile/Canada.png”> Pie chart <chart type=”pie” showLegend=”true” values=”’key1’, ‘%attrib1%’ | ‘key2’, ‘%attrib2%’” colors=”0xff0000, 0x00ff00” width=”180” height=”180” > <chart type="horizontalbar" showLegend="true" showAxisValues="true" values="'key1', Horizontal bar chart '%attrib1%' | 'key2', '%attrib2%'" colors="0xff0000, 0x00ff00" width="180" height="180" > Vertical bar chart <chart type="verticalbar" showLegend="true" showAxisValues="true" values="'key1', '%attrib1%' | 'key2', '%attrib2%'" colors="0xff0000, 0x00ff00" width="180" height="180" > More advanced HTML tags combinations are possible to create more effects. For more information and a complete list of HTML tags supported by Adobe Flash click the link on the Web Tag dialog box or go to http://livedocs.adobe. com/flash/9.0/main/wwhelp/wwhimpl/common/html/wwhelp.htm?context=LiveDocs_Parts&file=00000922.html. Auto Size Option When this option is used, the callout size automatically adapts to the contents and callout image size. 152 Chapter 15: MAP Web Author Web Tag Dialog Trigger External URL The Trigger External URL options allow an advanced Web designer to load a specified HTML document (designated by its URL address) into a targeted HTML frame, when the object being tagged is hovered or clicked. A Web browser can be divided into multiple panes called HTML frames, to present documents in multiple views, which may be independent windows or subwindows. For example, within the same window, one frame might display a static banner, a second a navigation menu, and a third the main document that can be scrolled through or replaced by navigating in the second frame. An example layout could be as follow: Frame 1 Frame 3 Frame 2 Names of frames created by Web designers must begin with an alphabetic character (a-z/A-Z). Some special purpose HTML frames have reserved names with a leading underscore. The following reserved names are available for selection from the Target drop-down list. _blank: Loads the linked document into a new blank window (unnamed). _self: Loads the linked document into the same frame in which the link was clicked (frame containing the Flash map). _parent: Loads the linked document into the immediate parent of the document the link is in (frame containing the Flash map). _top: Loads the linked document into the entire window, clearing the frames. To use the Trigger External URL options, enter the URL address of the HTML document to open in the Hover URL or Click URL fields. The specified URL can be any page available locally or any external Web page (for example http://www.avenza.com). In the Target drop-down list, enter the name of the destination frame (type in the name given by Web designers or use one of the four available reserved names). Chapter 15: MAP Web Author Web Tag Dialog 153 Export to Web Basic Settings Export Location- Points to the destination folder of the exported Flash Documents. OK - Click the button to launch the export to Flash. Layer List - Lists all the layers in the active artboard. Layers are preceded with a check box when the option Enable Layer Visibility Toggle is on. All layers will be visible, but only checked layer will be toggable in the Flash map. # of Web Tags - Indicates the number of Web tags (callout bubbles) created per layer. Export Attributes - Indicates layers for which MAP Attributes are exported (when used in Web tags). Quick Selection Buttons - (Visible when the option Enable Layer Visibily Toggle is on) - Select All or Deselect All layers. Layer Control - Select the type of layer control to be inserted in the Flash map: Built-in (Flash datagrid): layer controls are automatically placed within your Flash document. External (layerCheckboxes.js): controls are placed externally and can be re-arranged using HTML tags. Enable Layer Visibility Toggle Check this option to add a Layer Control box on the Flash map. Flash Viewer Settings Width and Height - Size of the Flash map in the browser. Cannot be larger than the Adobe Illustrator document . Reset - Change the size settings back to the default (current document size) Pan X and Pan Y - Initial pan shift applied when the Flash map is opened. JPEG Image Quality - Drag the slider to control the amount of JPEG file compression. Initial Zoom - Zoom level when the Flash map is initially opened. Enable Navigation - Check this option to display navigations button on the Flash map (pan up/down/left/right and zoomin/zoom-out). Export For Off-line Viewing - Check this option if the exported Flash file is not intended for Web distribution and only for off-line use. Preserve Appearance - Flatten artwork to a single layer before export. Selecting this option limits the editability of the file. When uncheck, path simplifications are applied by Adobe Illustrator. Compress Metadata File - Check this option to compress the file map.xml (recommended). Advanced Settings See next section for more details on advanced Settings Viewer Style - Expand to set the Flash viewer style (actions allowed, pan and zoom factors...). Popup Style - Expand to set the style of the callout bubbles (bubble rounding settings, drop shadow options...). 154 Chapter 15: MAP Web Author Export to Web Line Style - Expand to set the selection and hovering line styles (color, thickness...). Search Box Style - Expand to set the style of the search box (position, color of searched objects...). FUNCTIONALITY The final settings for the export to Flash are entered through the Web Export Dialog started from the MAPublisher MAP Web Author panel. While settings concerning the map contents and Web tags are done through the classic MAPublisher tools and the Web Tag Dialog, the settings in Web Export concerns the parameters specific to the Flash format: navigation buttons, search box, layer controls, callout bubble aspect... Navigation buttons - Pan up/down/ left/right Zoom in (+) and out (-). Search box - Type in text. It will search through the contents of all the exported callout bubble. Callout Bubble - Style can be edited: corner rounding, drop shadow etc... Layer control - Check boxes to toggle on/off layer display. Layer list and position is set in Web Extport Dialog. Lines - By default, objects clicked on are highlighted in blue, objects hovered on are in green and objects found by the search are in yellow. Colors are editable. PREREQUISITE Web tags must be first setup with the Web Tag Dialog. USING EXPORT TO WEB The Web Export Dialog is started from the MAP Web Author panel by clicking the Export to Web button . In the Export Location field, enter the directory and file name of the exported HTML index file (by default index.html) Layer Control Settings Users may choose to insert a Layer Control panel into the Flash map. To do so, the option Enable Layer Visibility Toggle must be checked. Layers that are checked in the Layer List will be included as toggable in the Layer Control. The layers that are not checked are exported, but it will not be possible to switch them on and off of the display when the Flash map is opened in a Web browser. In general, the layers display order is the same as setup in Adobe Illustrator. However toggable layers will be displayed at the top of the non-toggable layers. Chapter 15: MAP Web Author Export to Web 155 The style of the Layer Control is set through the Layer Control list box. The two styles options are: • Built-in (Flash Datagrid): the control is automatically placed on the Flash document and cannot be modified. • External (layerCheckboxes.js): Check boxes are placed outside the Flash map. The great advantage of this option is that the position and layout of the check boxes can be re-arranged using HTML tags. By default, they are placed at the top of the Flash map: Flash Viewer Settings Users can setup the following parameters for the Flash Viewer (how the Flash map will be displayed when opened in the Web browser). The parameters that can be setup are: • Size of the display window (width and height), it cannot be larger than the Adobe Illustrator document. • Initial position of the Flash map of the display: initial zoom, pan X and pan Y (if zoomed-in). • Display of the navigation buttons or not. Users can also make some more advanced changes to the default display settings, such as: • Viewer style: enable only some of the navigation buttons, change the zoom and pan factors, change the button positions... • Popup style: change the rounding of the callout bubble, arrow style, change the drop shadow settings and position... • Line style: change the color and thickness of line marking clicked and hovered objects... • Search box style: enable or display of the search box, change the default position, change the color and thickness of the line marking the objects found by the search. Additional Settings Images in Adobe Illustrator are exported as JPEG, the JPEG Image Quality slider allows to set the compression level exported images. This setting does not apply to images included in Web tags. The option Use Preserve Appearance Settings For Flash Export flattens the artwork to a single layer before exporting. It is recommended to maintain the artwork quality. However, some known issues with Adobe Illustrator Flash export cause some documents to fail to export with this option on. The option to Export for Off-line Viewing allows to produce SWF files that will work off-line without having to update Flash security settings. In this case, the exported SWF will not work on-line—do not use this option if the exported file are intended for Web distribution. Metadata File map.xml The Metadata File (map.xml or map.xml.zip) is used by the Flash viewer to get the information on the initial zoom level, Web tags contents (text and image paths), aspect of the callout bubble and tagged object geographic coordinates. 156 Chapter 15: MAP Web Author Export to Web It is recommended to use a compressed version of this file (map.xml.zip) to allow for a fast loading of the Flash map on your Web site. However, advanced users may use the uncompressed version (map.xml). For example, an advanced user could create programs that automatically update the Web Tag contents. If the option Compress Metadata File map.xml is on, a file map.xml.zip is created during the export. Once compressed, this file cannot be uncompressed to map.xml. If this file is required, the export must be run again with this option turned off. NOTE: In MAPublisher 8.0, the metadata file was named map.afm or map.afm.compressed. The decision was made to change the file extensions because these file formats were not recognized by all Web server. Execute Web Export Once all the settings are entered, the user launches the actual export to Flash by clicking the OK button. The export summary is displayed in the Web Export Log. Web Export Log Layer List - List of the exported layers, number of vertices and size. Set Folder Permissions - In order to view your Flash document with an internet browser, Permissions must be set to the Export Folder (see below). Total SWF File Size - Total size of the created swf files. The smaller the better. Metadata (.xml) File Size - Size of the created metadata.xml file. 50 KB compressed (xml.zip) is ideal. List of created files - Export Folder. The export creates a set of default files together with the files specific to the map. The main files are: • filename.html (as specified in the Export Location field, by default, index.html) • map.xml.zip (or map.xml when the compress option is not checked) • MAPublisherSWF.swf • map.swf plus map_L1.swf, map_L2.swf... (one file per selected toggable layer when the option is selected). The Web Export Log information on the file size is meant to warn the users when files get very large. Large files should be avoided as they may be very slow to open on a Web site. Chapter 15: MAP Web Author Export to Web 157 Visualize Results When exporting Flash map intended for Web distribution, do not check the option Export for Off-line Viewing. In this case, some permissions (Global Security Settings) must be set to allow the browser to open the file to view the produced Flash map on a regular Web browser, without posting the file on a server, . Clicking the Set Permissions button in the Web Export Log dialog box, opens the Web page http://www.macromedia.com/ support/documentation/en/flashplayer/help/settings_manager04.html containing the Adobe Flash Player Settings Manager: 1. Click Edit Locations 2. Click Add Location 3. Click Browse For Folder or copy the full path as written in the Web Export Log dialog box and click Close. The folder is added in the list of trusted locations. Locations can later be deleted through a similar process. NOTE: You must be connected to the Internet in order to set these permissions. If the option Export for Off-line Viewing is enabled, it is not necessary to set folder permissions. Files exported with this option on will not work on-line from a Web site. To be used on-line, the Flash map has to be exported again with the option checked off. To finally view the exported map, browse to the Flash export folder (as specified in the Web Export Dialog) and open the file index.html (or name specified as export location) in your favorite Web browser. Users should be reminded to check that the latest Flash Player version has been installed (download from Adobe Web site). An outdated viewer might cause images not to be displayed (gif format in particular). NOTE: Depending on the security settings of the Web browser used, some warnings may appear when opening files exported with the off-line viewing option enabled. These can be ignored. 158 Chapter 15: MAP Web Author Export to Web Web Export Advanced Settings This section describes the different options available in the MAP Web Author Export To Web dialog box advanced options. VIEWER STYLE StageQuality – (Low, Medium,High) Quality of the exported Flash map. StageQualityDuringPanZoom – (Low, Medium,High) Quality of the Flash map while the map is panned and zoomed in or out. FullPopupOnHoverEnabled – (True or False) Display or not both title and content of the callout bubble while the mouse pointer is hovered on a Web art. When enabled (True): When disabled (False): HoverPopupEnabled – (True or False) Display or not the callout bubble (title or full depending on option above) while a mouse pointer is hovered on a Web art. When set to False, the Web art must be clicked to display the callout bubble. StaticPopupEnabled – (True or False) Display or not the callout bubble contents in a fixed location within the Flash viewer extent (see Popup Style advanced settings). NOTE: To use a static callout bubble, both HoverPopupEnabeld and StaticPopupEnabled must be set to True. ZoomButtonsEnabled – (True or False) Display or not the Zoom buttons (both in and out) in the Flash map. PanButtonsEnabled – (True or False) Display or not the Pan buttons (up, right, down and left) in the Flash map. LayerListFlashControlW – Width for the Flash control containing the layer list when Enable Layer Visibility Toggle is enabled with the Built-in (Flash datagrid) option selected. LayerListFlashControlH - Height for the Flash control containing the layer list when Enable Layer Visibility Toggle is enabled with the Built-in (Flash datagrid) option selected. H W LayerListFlashControlX– X position of the top left corner of the Flash control containing the layer list when Enable Layer Visibility Toggle is enabled with the Built-in (Flash datagrid) option selected. LayerListFlashControlY– Y position of the top left corner of the Flash control containing the layer list when Enable Layer Visibility Toggle is enabled with the Built-in (Flash datagrid) option selected. PanUpX – X position of the top left corner of the pan (up) icon in the Flash map. PanUpY – Y position of the top left corner of the pan (up) icon in the Flash map. PanDownX – X position of the top left corner of the pan (down) icon in the Flash map. PanDownY – Y position of the top left corner of the pan (down) icon in the Flash map. Chapter 15: MAP Web Author Web Export Advanced Settings 159 PanLeftX – X position of the top left corner of the pan (left) icon in the Flash map. PanLeftY – Y position of the top left corner of the pan (left) icon in the Flash map. PanRightX – X position of the top left corner of the pan (right) icon in the Flash map. PanRightY – Y position of the top left corner of the pan (right) icon in the Flash map. ZoomInX – X position of the top left corner of the zoom (in) icon in the Flash map. ZoomInY -–Y position of the top left corner of the zoom (in) icon in the Flash map. ZoomOutX – X position of the top left corner of the zoom (out) icon in the Flash map. ZoomOutY – Y position of the top left corner of the zoom (out) icon in the Flash map. NOTE: The origin of the coordinates (0,0) on a Flash map is at the top left corner of the Flash extents. Example of positions of pan and zoom buttons: ZoomButtonsW – Width of the zoom buttons (14 pixel by default). ZoomButtonsH – Height of the zoom buttons (14 pixel by default). PanButtonsW – Width of the pan buttons (14 pixel by default). PanButtonsH – Height of the pan buttons (14 pixel by default). NOTE: The images (png format) for the pan (up, right, down, left) and zoom (in and out) buttons are stored in the flashviewer/interface directory in the export destination folder. The image names are button_up.png, button_right.png, button_down.png, button_left.png, button_plus.png, and button_minus.png, respectively for pan-up, pan-right, pan-down, pan-left, zoom-in, and zoom-out. When customizing the images for the zoom and pan buttons, the same image names must be used. When the size of the button is different from 14 pixel width by 14 pixel height, the size must be entered in the advanced options for zoom buttons width and height and pan buttons width and height. POPUP STYLE BubbleRounding – Roundness of the corners of the callout bubbles where 0 indicates the corner to be a right angle while 20 indicates the corner to be rounded to a arc-circle. BubbleGradientEnabled – (True or False) Apply or not a gradient effect on the callout bubble. BubbleDropShadowEnabled – (True or False) Display not a drop shadow behind the callout bubbles. DropShadowAlpha – Transparency level of the drop shadow—0.0 is full transparency, 1.0 is opaque. 160 Chapter 15: MAP Web Author Web Export Advanced Settings DropShadowAngle – (0 to 359) Direction of the drop shadow for callout bubbles. DropShadowAngle (here 45°) DropShadowDistance DropshadowColor – Color of the drop shadow for callout bubbles. DropShadowDistance – Distance between the edge of the callout bubble and the drop shadow in the direction specified by DropShadowAngle. DropShadowStrength – Fuzziness of the drop shadow for callout bubbles—0 is the most fuzzy (looks as if there is no shadow), 50 is the most sharp (almost looks like opaque sharp black shadow). BubbleArrowEnabled – (True or False) Display or not an arrow pointing to the clicked point from the callout bubble. Callout bubble body Callout bubble arrow ArrowBaseDistanceFromEdge – Distance from the arrow base to the edge of the callout bubble. ArrowBaseWidth – Width of the arrow base. ArrowTipX – Distance on a X axis from the clicked position to the edge of the callout bubble. ArrowTipY – Distance on a Y axis from the clicked position to the edge of the callout bubble. ArrowBaseDistanceFromEdge ArrowBaseWidth ArrowTipX ArrowTipY Mouse pointer StaticPopupDrawBubbleEnabled – (True or False) Display or not the callout bubble at a fixed location specified with the StaticPopupX and StaticPopupY options. StaticPopupHeight – Height of the static popup. StaticPopupWidth – Width of the static popup. StaticPopupX – X position of the static popup on the Flash map. StaticPopupY – Y position of the static popup on the Flash map. Chapter 15: MAP Web Author Web Export Advanced Settings 161 LINE STYLE ClickLineEnabled – (True or False) Display a line or not when a Web art is clicked. ClickLineAlpha – Transparency level of the line when a Web art is clicked. ClickLineColor – Line color of clicked Web art. ClickLineThickness – Thickness of the line of clicked Web art. HoverLineEnabled – (True or False) Display a line or not when a Web art is hovered. HoverLineAlpha – Transparency level of the line when a Web art is hovered. HoverLineColor – Color of the line when a web art is hovered. HoverLineThickness – Thickness of the line when a web art is hovered. SEARCH BOX STYLE SearchBoxEnabled – (True or False) Display or not a search box in the Flash map. SearchBoxOffsetX – Distance between the top right corner of the Flash map and the top right corner of the search box along the X axis. SerachBoxOffsetY – Dstance between the top right corner of the Flash map and the top right corner of the search box along the Y axis. SearchLineAlpha – Transparency level of the lines depicting the objects which meet the search criteria. SearchLineColor – Color of the lines depicting the objects which meet the search criteria. SearchLineThickness – Thickness of the lines depicting the objects which meet the criteria entered in the search box. SeachBoxOffsetY SeachBoxOffsetX Seach Line 162 Chapter 15: MAP Web Author Web Export Advanced Settings MAP Web Author Workflow MAPublisher 8 is installed with tutorial materials. It is recommended that users go through the exercises described in them in order to get more familiarity with the tools. The tutorial materials have an exercise dedicated to the new MAP Web Author panel. Users can also refer to this chapter that presents a general workflow to be used for guidance. 1) MAP COMPILATION WITH ADOBE ILLUSTRATOR / MAPUBLISHER 8 Users must create their map document using the traditional MAPublisher 8 and Adobe Illustrator tools. If the only purpose of the map is to create a Flash map, consider at this stage the document size parameter, as this determines the size of map extents in the Web browser. 2) PREPARING FOR MAP WEB AUTHOR a) Creating a working directory Create a folder in your computer. This folder is to store all the components for the Web Flash map and the exported Flash files. b) Preparing images for the callouts Images that will be used in the Web tagging process must be collected and grouped in a folder (Source Media Folder). If you plan to insert the images using a MAP Attributes field in the Multiple mode, remember that you will not be able to change the sizes in the Web Tag Dialog. If required, image sizes have to be changed in a picture editor first. c) Setting document size for the Flash map If the document size hasn't been set at step one (document creation), it should be modified through the Adobe Illustrator menu File > Document Setup prior to the Web export. NOTE: Changing the document size might result in the adjustment of the symbol and text sizes as well as stroke widths. d) Attribute table information to attach the callouts In order to use attribute information for Web tagging, they must be organized using the MAPublisher MAP Attributes panel. This process might include creating new attribute columns to type Web site links or image file path (in that case create a column of type String). e) Data preparation Run the crop tool, simplify lines and remove unneeded attributes. 3) USING MAP WEB AUTHOR a) Setup the Source Media Folder The user have a choice between entering an absolute or relative path for the Source Media Folder. Example: Absolute path: C:\Work\Flash_Project\Images Relative path: \Images Chapter 15: MAP Web Author MAP Web Author Workflow 163 NOTE: If an image is placed under C:\Work\Flash_Project\Images\MyImage\MyImage1.jpg, and the Source Media Folder is C:\Work\Flash_Project\Images, then the path \MyImage\MyImage1.jpg must be typed in the Web Tag Dialog (or in the MAP Attributes panel when using attributes). b) Creating callout bubbles Using the Web Tag Dialog, insert the information relative to the callout bubbles (title, images, text contents etc...). When MAP Attributes have been prepared for some layers, users may first select all objects in one layer and choose the Multiple tagging mode. Use the Preview to check the aspect of the callout bubble prior to the export process. When tagging multiple objects, use the buttons Next/Previous to display the bubble created for each individual objects. 4) EXPORT FLASH DOCUMENTS The settings entered in the Web Export Dialog are determined by the desired aspect of the Web map. We recommend that users tryout the different configurations. Here are some simple examples: Simple MAP - No layer control, no navigation (Basic Settings). No Search box (Advanced Settings). Default Style Map - Built-in layer control and navigation button added through the Basic Settings only. No Advanced Settings required. Customized Style Map - External layer control and navigation button added through the Basic Settings. Removed zoom buttons and changed callout bubble style through Advanced Settings. 5) VIEWING THE FLASH MAP WITH A WEB BROWSER. To view the Flash map with a Web browser, without posting the files on a server, users must first set the Global Security Settings or export using the off-line viewing option. Users should also download the latest Flash Player version for their Web browser. It can be downloaded free of charge from Adobe Web site (www.adobe.com). 164 Chapter 15: MAP Web Author MAP Web Author Workflow MAP GPS The MAP GPS feature allows for the collection, display and styling of raw GPS data directly in Adobe Illustrator. Using the MAP GPS feature, you can connect to many NMEA compliant GPS devices, collect data points and then use the information to apply it to maps. The data can be reprojected, styled, and scaled automatically when it is received. The MAP GPS Panel is covered in this section. Chapter 16: MAP GPS 165 MAP GPS Panel Window > MAPublisher > MAP GPS Panel or MAP Toolbar Start/Stop Scanning - Begins or ends scanning of the GPS device depending on the current state. GPS Fix - Displays the status of the GPS fix. No Fix, 2D or 3D will be displayed. Manual Plot - Plots a single point at the current location read from the GPS and applies the manual plot settings from the Point Plot Settings dialog box. Satellites In Use - Displays the number of satellites which are currently being tracked by the GPS device . Altitude - Displays the current altitude in metres above mean sea level. Plot by Time - Plots points at a specified time interval which are reflected in the Point Plot Settings dialog box. Position - Displays the current position of the GPS device in either Lat/ Long or UTM coordinate systems depending on the option selected. Plot by Distance - Plots points at a specified distance interval which are reflected in the Point Plot Settings dialog box. Lat/Long or Map Units (Meter) - Indicates if Lat/Long or projected coordinates are used for the display of the Position data. Dilution of Precision - Displays the Positional (PDOP), Horizontal (HDOP), and Vertical (VDOP) values received from the GPS device. Start/End Route - Creates a path using the selected Graphic Style using all valid GPS information received. FUNCTIONALITY MAP GPS will collect, interpret, and apply styles to points and lines from information received from a supported GPS device within an Adobe Illustrator document, based on user settings. Several plotting options are available for use in MAP GPS. For plotting points, users can decide whether to plot single points using the Manual Plot option, to plot points based on a specific time interval, or to plot points based on a set distance interval. For plotting lines, the Start Route feature may be used to create a line feature containing all valid information received from the GPS device. Additionally, auxiliary settings may be used to plot points on separate layers when either a change in speed or a change in heading is observed, when concurrently using one of the previously mentioned plotting options. MAP GPS also provides the ability to automatically apply user defined attributes for specific layers while plotting, and to record a log file of information received from the GPS device, which may then be played back into an Adobe Illustrator document at a later time. PREREQUISITES Prior to being able to use MAP GPS, it is required to have a compatible GPS receiver. Supported devices include any NMEA compliant device which has a serial COM port or Bluetooth connection option (using a COM Port). To use devices with USB connection, the USB port must be converted to virtual serial COM port using software provided by the GPS vendor or a third party application. Prior to interacting with the GPS device, the proper COM port settings have to be specified in the Device Settings dialog box so that the GPS can communicate and interact with the MAP GPS function. Either a new document or an existing document may be used to begin a GPS session. If the appropriate type of layer is selected in the layers panel e.g. a point layer, then points will be plotted on that layer. If no layer or an improper layer for the type of plotting action is selected then a new layer will automatically be created of the proper type. 166 Chapter 16: MAP GPS MAP GPS Panel USING THE MAP GPS PANEL Start Scanning This feature allows MAPublisher to interact with the specified GPS device. When the Start Scanning button is clicked, the settings specified in the Device Settings dialog box will be used to begin reading and interpreting the information the GPS is receiving. This information is then used to display the GPS status in the GPS panel as well as to plot points and/or lines. Manual Plot This method plots a single point at the current position reported by the GPS device. The plotted point is reflective of the settings specified under the Manual Plot section of the MAP GPS Point Plot Settings panel, i.e. using the specified scale and point symbol. When Manual Plot is clicked, a single point will be plotted either on an existing point layer (if selected) or on a new layer which is automatically created if a point layer is not selected. If the Adobe Illustrator document does not contain any MAP View, a new one is created in the WGS84 geodetic coordinate system. Plot By Time This method plots a single point each time the specified time interval is observed. The time interval is displayed in the MAP GPS Point Plot settings panel along with other settings such as scale and point symbol. Plot By Distance This method plots a single point each time the specified distance interval is observed. The distance interval is displayed in the MAP GPS Point Plot settings panel along with other settings such as scale and point symbol. Start Route This method creates a line feature for all valid information received by the GPS. Line styling is determined by the Graphic Style selected in the Adobe Illustrator Graphic Styles panel. Chapter 16: MAP GPS MAP GPS Panel 167 MAP GPS Panel Menu Accessed from the MAP GPS Panel Many of the MAP GPS features can be accessed via the MAP GPS panel options menu. These features include Device Settings, Point Plot Settings, Autosave Settings, Edit User Attribute, as well as many different log file features. The following sections will outline each of the features and their uses. Device Settings - Opens the Device Settings dialog box. Point Plot Settings - Opens the Point Plot Settings dialog box. Autosave Settings - Opens the Autosave Settings dialog box. Edit User Attribute for Current Layer - Opens the Edit User Attribute for Current Layer dialog box. Record Sentence Log - Opens the Record Sentence Log dialog box. View Sentence Log - Opens the View Sentence Log panel. Playback Sentence Log - Opens the Playback Sentence Log panel. Start Scanning - Begins Scanning the GPS device. Manual Plot - Plots a single point. Plot by Time - Begins plotting points by a specified time. Plot by Distance - Begins plotting points by a specified distance Start Route - Begins plotting a route. MAP GPS DEVICE SETTINGS Accessed from the MAP GPS menu. The MAP GPS Device Settings dialog box provides for the input of the specific settings for the connected GPS Device. Users are required to manually select the appropriate settings prior to using MAP GPS. Appropriate settings for specific devices can usually be obtained by consulting the device’s user manual or by contacting the manufacturer. Port Name - Select the proper serial port for your GPS device. Baud Rate - Select the baud rate for your GPS device. Data Bits - Select the data bits for your GPS device. Parity - Select the proper parity for your GPS device. Stop Bits - Select the proper Stop Bits for your GPS device. Flow Control - Select the proper flow control for your GPS device. Test this Configuration - Select button to ensure all the specified features are inputted correctly before continuing. 168 Chapter 16: MAP GPS MAP GPS Panel Menu MAP GPS Point Plot Settings Accessed from the MAP GPS menu. Type - Select the type of Plot you would like to apply the setting to. Either Manual Plot, Plot By Time, Plot by Distance, Plot by Change in Speed, or Plot By Change in Heading may be used. Scale - Sets the size of the chosen symbol prior to or during plotting if required. Every - Sets the intervals at which points will be plotted. Plot Symbol - Choose a symbol to use. The symbols displayed here will be the same as those in the Adobe Illustrator Symbols panel. Enable this Auxiliary GPS Plot Type - This setting becomes enabled only for the Plot by Change in Speed, or Plot By Change in Heading options. If the check box is selected then when Plot by Time, Plot by Distance, or Start Route are being used the settings will be applied FUNCTIONALITY The MAP GPS Point Plot Settings panel is used for controlling all of the settings related to points to be plotted by the GPS. In this dialog box, users define parameters such as scale, interval, and point symbol. The Point Plot Settings panel also controls the additional auxiliary settings such as change in speed and change in heading. Point symbols reflect the symbols found in the Adobe Illustrator Symbols panel. New symbols created or loaded in the Adobe Illustrator Symbols panel will be appended to the MAP GPS Point Plot Settings panel. Use the Type drop-down list to enter the settings for Manual Plot, Plot By Time, Plot by Distance, Plot by Change in Speed or Plot by Change in Heading. USING THE POINT PLOT SETTINGS PANEL Manual Plot The Manual Plot setting option controls how points will be plotted and styled when using the Manual Plot option from the main MAP GPS panel. There are two settings for the Manual Plot, the Scale and Plot symbol. The scale controls the size of the point symbol to be plotted. With a scale of 100 percent selected, the point is plotted at the original size of the symbol. The second option is the Plot Symbol which determines which symbol is plotted. Plot By Time The Plot By Time setting options control how points will be plotted when using the Plot By Time feature from the main MAP GPS panel. Three separate settings can be adjusted: Scale, Every and Plot symbol. The Every setting is used to specify the time interval between plots. For instance, if the Every setting is set to 5 seconds, a new point is plotted every five seconds. These settings may be changed while plotting is occurring. If the user wishes to increase or decrease the scale or change to a different point symbol while plotting by time, they may do so by setting new parameters. Changes will be reflected in the next point to be plotted. Chapter 16: MAP GPS MAP GPS Point Plot Settings 169 Plot By Distance The Plot by Distance setting options control how points will be plotted when using the Plot by Distance feature from the main MAP GPS panel. Three separate settings can be adjusted: Scale, Every and Plot symbol. The Every setting is used to specify the distance interval between plots. For example, if the Every setting is set to 5 metres, a point will be plotted every five metres. These settings may be changed while plotting is occurring. If the user wishes to increase/ decrease the scale or change to a different point symbol while plotting by distance, they may do so by simply selecting new parameters. Changes will be reflected in the next point to be plotted. Plot By Change in Speed The Plot by Change in Speed auxillary settings will plot a point each time a change in speed is detected as specified by the threshold set in the Point Plot Settings. Change in speed points are plotted in addition to the points plotted while completing one of the standard plot options (Plot by Time, Plot By Distance or Route). To use this setting, a user must first enable it by selecting the Enable this Auxillary GPS Plot Type from the bottom of the MAP GPS Point Plot Settings panel. The optional settings for Scale, Every, and Plot Symbol must then also be specified. The Every setting has an additional option which allows specification of the speed units. Either km/h, knots, or mi/h may be used. When plotting begins, a new layer is automatically be created specifically for the change in speed points. This layer will be automatically named based on the name of the current layer upon which the main plotting operation is being conducted with the phrase change_in_speed prefixed to it. For example if the main plotting is in progress on a layer called ABCD, the layer created for the change in speed plots will be named change_in_speed_ ABCD. Plot By Change in Heading The Plot by Change in Heading auxillary settings will plot a point each time a change in heading is detected as specified by the threshold set in the Point Plot Settings. Change in heading points are plotted in addition to the points plotted while completing one of the standard plot options (Plot by Time, Plot By Distance or Route). To use this setting a user must first enable it by selecting the Enable this Auxillary GPS Plot Type from the bottom of the MAP GPS Point Plot Settings panel. The optional settings for Scale, Every, and Plot Symbol must then also be specified. When plotting begins, a new layer will automatically be created specifically for the change in heading points. This layer will be automatically named based on the name of the current layer upon which the main plotting operation is being conducted with the phrase change_in_heading_ prefixed to it. For example if the main plotting is in progress on a layer called ABCD, the layer created for the change in heading plots will be named change_in_heading_ ABCD. 170 Chapter 16: MAP GPS MAP GPS Point Plot Settings MAP GPS Autosave Settings Accessed from the MAP GPS menu. Automatic Save - Enable the check box and set the setting to the desired time for Automatic saving to occur. FUNCTIONALITY The MAP GPS Autosave Settings provide the option to have a document automatically saved each time a specified time interval has elapsed. This feature allows for users to limit data loss in the instance that hardware or power problems occur while collecting data. PREREQUISITES The current document must have already been saved at least once to a local location on the computer. If the Autosave setting is activated and the current document has not been saved then a warning will appear upon leaving the Autosave dialog box, stating that this feature will not function until the document is saved and will offer the option to manually save the document at that time. USING THE AUTOSAVE SETTINGS The Autosave settings may be activated by selecting the associated check box and specifying the number of minutes between autosave instances. Once this has been activated and the current document has been saved, automatic saves will occur each time the specified interval is reached. Chapter 16: MAP GPS MAP GPS Autosave Settings 171 Edit User Attribute for Current Layer Accessed from the MAP GPS menu. Current Layer - Displays the currently selected layer in the Adobe Illustrator Layers panel Current Attribute - Displays a list of string attribute columns for the current layer Current Value - Allows for input of a value to be added as an attribute to the current column. Create New - Opens a dialog box which allows the user to create a new string attribute column on the layer. Clear Value - Will clear the current value entered in the Current Value text field FUNCTIONALITY The Edit Attribute for Current Layer dialog box provides the ability to create a new attribute column for the current layer or use an existing string (text) attribute column and have custom attribute values automatically entered in that column for plotted features. Attribute values will be added each time a new point is plotted. For example, if points are being plotted along a street, a Street column could be created and the street name could be added as an automatic attribute value each time a new point is plotted. PREREQUISITES Prior to using this feature the current document requires a MAP View and at least one MAP layer. If the MAP layer is selected then the Edit User Attribute for Current Layer is accessible and can be set up for use when plotting begins. If the above criteria are not met the Edit User Attribute for Current Layer menu item will be greyed out and unavailable. USING THE EDIT USER ATTRIBUTE FOR CURRENT LAYER The Edit User Attribute For Current Layer function can be accessed whenever a valid MAP layer is selected. Upon opening the dialog box, the current layer name will be displayed in the dialog box along with any string attribute column names associated with that layer. To add attribute values to an existing attribute column select the desired column name from the Current Attribute combo box and enter the desired attribute value into the Current Value text field. To create a new column select the Create New button and enter a column name into the open dialog box. When a new attribute column is created its type will be automatically set to string. When the dialog box closes and plotting begins, the attribute value will be added to the layer each time a point is plotted. NOTE: If the Edit User Attribute For Current Layer dialog box is opened while plotting is in progress, the plotting will be paused. This allows the necessary changes to be made. Upon closing the dialog box all the points which would have been plotted will be plotted and will reflect the changes just made. 172 Chapter 16: MAP GPS Edit User Attribute for Current Layer Record Sentence Log Accessed from the MAP GPS menu. Browse - Allows the user to navigate to a location to save the log. Log File - Allows the user to specify to a location to record the log. Append - Will add new information at the end of the file if it already contains log information. Overwrite - Will overwrite information in the specified file if it contains any. FUNCTIONALITY The Record Sentence Log feature allows for all information gathered from the GPS to be saved to a text file. This information can be used for back-up or debugging purposes or imported at a later time into a new document. In addition to being able to record to the file, the user is given the options of adding to an existing file or overwriting any information which may be in the specified file. USING THE RECORD LOG SETTINGS DIALOG BOX The Record Log Settings dialog box requires either navigation to a directory or manual specification of a location to which the log file is to be saved. Once a directory has been specified the file name for the Record Log must be specified. This file will be saved as a standard text file that is readable in Notepad or any other plain text capable application. It may also be used at a later date to import the log information into a new or existing document as MAP features. In addition to specifying a file name and location either the Append option or the Overwrite option must be specified. The Append option will add all new information to the end of the file if the selected file contains information. The Overwrite option will overwrite any information currently contained in the specified file with the new information received. NOTE: Once a Record Log file has been specified using the Overwrite option and plotting started, any interruption to the plotting, for example, evoking a Stop Scanning operation, will result in the saved log file being overwritten by new log data once scanning and plotting restart. If it is desired that a complete session log be created and saved which is not overwritten each time plotting is stopped and restarted, the Append option should be used. Chapter 16: MAP GPS Record Sentence Log 173 Playback Sentence Log Accessed from the MAP GPS menu. Browse - Allows the user to navigate to the location where the log is located. Log File - Allows the user to specify the location where the log file is located. Build Route - A route will be created from the information in the log file using the selected Graphic style in the Adobe Illustrator panel. Auto Plot by Time - Settings from the Point Plot settings panel will be used to interpret the log file and plot points at specified times. Auto Plot by Distance - Settings from the Point Plot settings panel will be used to interpret the log file and plot points at specified distances. FUNCTIONALITY The Playback Sentence Log feature allows for information contained in a log file to be re-imported into an Adobe Illustrator document. The Playback Sentence Log feature is used in conjunction with the MAP GPS Point Plot Settings panel to create a series of points or a route in the document based upon data previously collected using MAP GPS. Depending on the applied settings, GPS sessions which have been previously recorded can be recreated in a new or existing document. This feature may also be used to import raw NMEA files collected from other devices. USING THE PLAYBACK SENTENCE LOG DIALOG BOX The Playback Sentence Log feature is used by selecting a previously recorded log file and then selecting one of the plot options: Build Route, Auto Plot by Time, or Auto Plot by Distance. 174 • Build Route - A route will be created from the information in the log file using the selected Graphic style in the Adobe Illustrator panel. • Auto Plot by Time - Settings from the Point Plot settings panel will be used to interpret the log file and plot points at specified times. • Auto Plot by Distance - Settings from the Point Plot settings panel will be used to interpret the log file and plot points at specified distances. Chapter 16: MAP GPS Playback Sentence Log MAP LabelPro™ MAP LabelPro is a comprehensive collision-free labelling solution integrated into the MAPublisher framework. Using rules and styles for text placement, it extracts label information from map layer attributes and performs fast, intelligent, cartographic text placement. Placement rules can be saved to a file and imported into other labelling work sessions. Topics covered in this section: MAP LabelPro MAP LabelPro Settings MAP LabelPro Styles MAP LabelPro Rules Label Verification MAP LabelPro is available as an optional add-on to MAPublisher 8.1. For more information on how to obtain a MAP LabelPro license please contact [email protected] or visit www.avenza.com. For information on how to activate a purchased or evaluation license please refer to chapter 1 of this guide. NOTE: The evaluation version of MAPublisher LabelPro scrambles the text of placed labels but preserves the case, spacing and punctuation, so that the results give a sense of how actual labels would be placed based on the rule settings. Chapter 17: MAP LabelPro 175 MAP LabelPro Object > Filters > MAP LabelPro or MAP Toolbar Attribute Select the attribute column containing the data to be used as labels for selected features. Destination Specify a destination from a list of available text layers. The destination layer holds the labels. Priority If multiple layers are being simultaneously labelled, assign a priority level to each labelling operation. The same priority can be set to multiple layers. Style Create a new label style or choose from a list of established label styles. Rules Select a default set of rules or create custom rules that dictate how labels are placed. Suppression Layer Repository for labels that could not be placed based on the rules set. Save & Label Save the current settings in the LabelPro configuration dialog box and perform the labelling operation based on these settings. Save Save the current settings in the LabelPro configuration dialog box without performing any labelling. Source – Displays MAP Views and its associated MAP Layers specified in Setup Layers. Obstacle layers – Displays MAP Views and its associated MAP Layers specified as obstacles during the labelling session. Setup Layers Open the Setup Layers dialog box to choose which layers are to be used for labelling and/or obstacles. Advanced Specify user defined extents for labelling operations. Label all art on source layers By default, only generate text labels for all data contained on the source layers. Exactly as found in source attribute By default, generates text labels exactly as they are from the attribute table. Label only selected art on source layers When enabled, generate text labels for currently selected data on the source layers Convert to lower case Enable this option if you wish to have all the text labels converted to lower case when placed. Convert to upper case Enable this option to have all the text labels converted to upper case when placed. Statistics type Choose an option from the drop-down list to display labelling statistics for the completed labelling process. To access MAP LabelPro, click the MAP LabelPro button in the main MAPublisher toolbar. 176 Chapter 17: MAP LabelPro MAP LabelPro FUNCTIONALITY The MAPublisher LabelPro labelling engine offers advanced labelling capabilities beyond those available in MAPublisher Feature Text. The MAP LabelPro engine contains sophisticated algorithms based on MapText’s EZ Label technology that solves many of the most common map labelling problems such as complex conflict resolution across multiple layers, the ability to specify data as obstacles and the ability to create complex labelling conventions via user defined rules. The MAP LabelPro engine uses map data attributes for labelling and provides a much greater level of sophistication and control that can be configured through an intuitive user interface. Data layers may be assigned an order of prioritization for labelling sequences and the ability to recognize existing type as obstacles for multiple labelling sessions if necessary. Placement rules and properties, once set, can be saved to a file and imported into other files or shared over a network. Only Point, Line and Area layers can be labelled using MAP LabelPro, however, Text layers may be used as obstacles. PREREQUISITES MAPublisher LabelPro can only be used in conjunction with MAPublisher documents. MAP LabelPro generates static text, meaning the map extent and scale should be established prior to labelling through MAPublisher. Once the labels are generated, they remain placed on the map unless explicitly deleted and the map is re-labeled. Before labelling with MAP LabelPro, it is necessary to create a destination text layer (a layer on which the new labels will be contained). Create a new Adobe Illustrator layer in the Adobe Illustrator Layers panel. In the MAP Views panel, drag the new layer to the MAP View containing the features to be labelled. Be sure to set the feature type to Text when prompted. To use a suppression layer (for labels that could not be placed by MAP LabelPro) create another text layer for this purpose. For each source layer, MAP LabelPro derives the labels from a selected attribute column. Use the MAP Attributes panel to analyze and/or edit the information prior to labelling. It is not possible to label based on an expression (e.g. a road layer with classes such as street, highway and toll road can only be labelled with a single style and rule). To label multiple classes of a layer, use the Split Layer option of the MAP Selection Filter to create new layers for each class (see chapter 11). In the MAPublisher Preferences section for MAP LabelPro, base rule and style folder paths can be set. By default, invisible objects are ignored by MAP LabelPro (they will not be labelled or used as obstacle). To take them into consideration, uncheck the option Ignore invisible artwork. See chapter 1 on MAPublisher Preferences for more information on this topic. Chapter 17: MAP LabelPro MAP LabelPro 177 MAP LabelPro Settings SETUP LAYERS Before labelling, the Setup Layers dialog box must be configured to specify which MAP Layers are to be labelled and which layers, if any, will be denoted as obstacles. Obstacles are map objects that are included in the conflict resolution decision making process, and are considered objects that must be avoided when trying to place a label. The Setup Layers dialog box displays all valid MAP Views and their MAP Layers in the document. To mark a layer for labelling purposes or as an obstacle, check the appropriate check boxes to the right of the layer name. All layers are listed, but only layers that are checked will be included in the labelling process or considered as obstacles. NOTE: Layers may be used as both a label and an obstacle concurrently. It is possible to perform labelling operations for multiple MAP Views simultaneously, however, source data layers and destination text layers must belong to the same MAP View. Label – Enable the check box for each data layer to be labelled. Enabling the option beside the MAP View name will enable the label option for all the data layers that belong to it. Name – Displays all MAP Views and the layers within them that may be specified for labelling purposes. Obstacle – Check this option should you want the contents of the layer to be used as obstacles for label conflict resolution. ADVANCED In the Advanced options dialog box, set the Label Placement Area option to the extents based on the current artboard or the extents of labelled source layers. To set Label Margins, enable the option and enter the extents of the label container in increments of the current document units. Data that is outside of the label margins is disregarded in the labelling process. Extents of the current artboard (Default) Label all designated data that falls within the extents of the current artboard Extents of labeled source layers – Label data only to the extents of the selected MAP Layers. Label Margins – Enable the check box to add margins to the selected extents. Obstacles – Enable the check box to specify that paths without stroke are not considered obstacles. NOTE: These settings are applied in conjunction to the settings from the Source Art section in the main MAP LabelPro configuration dialog box. Units for margins are determined by Document Setup in Adobe Illustrator. 178 Chapter 17: MAP LabelPro MAP LabelPro Settings SOURCE AND ATTRIBUTE COLUMNS These settings determine which attribute information is converted into text labels for a respective layer. The Source column shows the Area, Point and Line layers in the document that have been enabled for labelling through the Setup Layers option. For each layer listed in Source column, the Attribute column holds a drop-down list populated with the attribute structure of that MAP layer. Specify the appropriate attribute to be used for generating that layer's labels. NOTE: By default, label case is left exactly as it is found in the attribute table. To modify a label's case, see the options in the Label Case frame located on the main MAP LabelPro configurations dialog box. DESTINATION AND SUPPRESSION TEXT LAYERS The layers on which generated labels should be placed are specified in the Destination and Suppression Layer column drop-down lists. Destination layers will contain only the labels that could be placed successfully on the map based on the defined rules. Suppression layers are repositories for labels that could not be placed successfully according to the rules and have not met all placement conditions. For best viewing results after labelling, hide the suppression type text layers. Alternately, the suppression layer can be set to Ignored and unsuccessfully placed labels will not output to any layer. NOTE: Rows that have incomplete configuration settings (locked destination or suppression layers/unspecified destination layers) will be displayed in red under the Source list in the configuration dialog box. It is normal for a certain percentage of labels to not succeed in being placed due to rule or data conflicts. Information regarding the success rate of placement can be reviewed by enabling one of the Statistic type options located in the Options frame. PRIORITY The Priority setting allows for complex hierarchical labelling sequences. The priority is the order of preference in which labels are placed. Layers with a priority of 1 will be placed first (or have a high priority). Layers with a priority of 12 will be placed last (or have a low priority). Consequently, layers with a low priority might have more suppression labels generated for them. Priorities are set by selecting a number in the Priority drop-down list for a respective layer. NOTE: A maximum of twelve priorities may be assigned at any given time however the same priority number can be assigned to multiple layers. Chapter 17: MAP LabelPro MAP LabelPro Settings 179 MAP LabelPro Styles POINT AND AREA STYLES The Style dialog box allows users to set label style properties for each map layer. To access the dialog box, click the Style edit button . Set the text properties for font family, style, size and colour. A sample preview of the stylized text is shown in the large text box. Once the desired settings have been made, they can be collectively saved into a style file by clicking Save As. MAP LabelPro offers a pre-configured default style of 12 point Arial as a base labelling option. Family – Specify the font for the labels. Style – Indicate the desired font style. Size – Specify the font size. Colour – Choose a colour. Preview – text sample (result may not be exact for some font families). Save As – Save the current settings into a style file. Once saved, Styles are added to the Styles drop-down list in the MAP LabelPro Configuration dialog box. This is very helpful in maintaining labelling consistency among similar mapping projects or when multiple users are working on the same project. Existing styles may be deleted by selecting it from the Style drop-down list and then clicking on the delete button. Style files are saved to either a point, line or area folder depending on the type of map layer it is associated with. By default, styles are saved in the following location: Windows XP: C:\Documents and Settings\All Users\Application Data\Avenza\MAPublisher 8\LabelPro\Styles Windows Vista: C:\ProgramData\Avenza\MAPublisher 8\LabelPro\Styles Mac OS X: Applications/Avenza/MAPublisher 8/MAPublisher Plug-In/LabelPro/Styles The default save path for the Styles can be modified in the MAP LabelPro section of the MAPublisher Preferences dialog box. Choose Edit > MAPublisher Preferences (Windows) or choose Illustrator > MAPublisher Preferences (Mac). NOTE: Windows XP and Vista users must install PostScript Type 1 fonts directly into the Windows system font folder so that it can be used in MAP LabelPro styles. Please be aware that Adobe Illustrator includes Myriad, which is such a font, and will result in an error or incorrect results if used for labelling. NOTE: Attributes consisting of Unicode characters must be labelled with a Unicode font that contains the appropriate characters. For example, attempting to label Japanese characters with an Arial font will result in an error or incorrect results. 180 Chapter 17: MAP LabelPro MAP LabelPro Styles LABELLING LINE DATA WITH SYMBOLS MAP LabelPro has the ability to place labels inside symbols. A typical application of this would be numbered highway route shields. To label lines with symbols, check the Label with symbol check box to enable the symbol options. Choose an appropriate symbol set from the Symbol File drop-down list and select a symbol from the Symbol drop-down list. Use the Size option to change the size of the symbol. The symbol size refers to the size of the symbol and not the label created within it (e.g. specifying a size of 5 pt will result in a symbol being generated 5 pts in height). Label with symbol – Enable this check box to activate the symbology options Symbol file – Choose which symbol file (.lsf ) that contains the desired symbols. Symbol – Choose the symbol you wish to use from this drop-down list. Size – Specify a size manually or allow the symbol to be scaled automatically to accommodate the label's text via the Auto option. NOTE: The label font size and a fixed symbol size (not Auto size) affect how a label is sized inside a symbol. For example, if a fixed symbol size of 22 pt is used, but the label font size of 5 pt, the symbol will be 22 pt but the label inside will be no greater than 5 pt. If the label font is set to 50 pt, but the fixed symbol size is 22 pt, the label will have a maximum size of whatever fits inside the symbol or the selected font size. Symbols are stored in the location set in the MAPublisher Preferences (see chapter 1). The default locations are: Windows XP: C:\Documents and Settings\All Users\Application Data\Avenza\MAPublisher 8\LabelPro\Symbols Windows Vista: C:\ProgramData\Avenza\MAPublisher 8\LabelPro\Symbols Mac OS X: Applications/Avenza/MAPublisher 8/MAPublisher Plug-In/LabelPro/Symbols NOTE: Labelling with symbols is only available for Line layers. To label areas with symbols, use the Plot Centroids function from the MAP Point Plotter (see chapter 6). Chapter 17: MAP LabelPro MAP LabelPro Styles 181 MAP LabelPro Rules MAPublisher LabelPro provides users with an intuitive, easy to understand graphical user interface for setting up labelling rules. Each Point, Line and Area rule dialog box has numerous label placement options for a high level of label detail and a variety of configurations. To access label rules, click the Rules edit button in the Rules column of the main MAP LabelPro dialog box. Depending on the layer type, this will open either the Area, Line or Point Rules dialog box. Configure label rules and, if needed, save the rules to add it to the Rules drop-down list. Rules operate in a very similar approach to Styles in that once added to the Rules list, they can be immediately applied, reused later in the same file or in other documents provided they are being applied to the same type of data. Rules are saved to the Area, Line or Point folder depending on the feature type of the map layer. MAP LabelPro offers a pre-configured Default rule for each data type. It is loaded by default and used until new rules have been created or selected. The default rule is a good starting choice as it is configured to be useful for the most common labelling situations, however, creating custom rules can be very useful when specific labelling conventions are required. In an Area, Point or Line Rule dialog box, the sequence in which the rule options appear and are checked have no bearing on the order of label placement, only whether the option is enabled or not. Adjust the Priority value of layers to adjust the sequence of label placement. Existing rules may be deleted by selecting them from the Rule drop-down list and then clicking the delete button . Rules are saved to the location set in MAPublisher Preferences (see chapter 1). The default locations are: Windows XP: C:\Documents and Settings\All Users\Application Data\Avenza\MAPublisher 8\LabelPro\Rules Windows Vista: C:\ProgramData\Avenza\MAPublisher 8\LabelPro\Rules Mac OS X: Applications/Avenza/MAPublisher 8/MAPublisher Plug-In/LabelPro/Rules NOTE: Labelling results will vary depending on which rules are enabled. If no rules are enabled, MAP LabelPro will not perform any labelling. 182 Chapter 17: MAP LabelPro MAP LabelPro Rules AREA RULES The Area Rules dialog box contains the label configuration options for labelling Area layers. Rules can be set by selecting an area feature type layer and clicking the Rules edit button in the Rules column. The placement settings in the screenshot below represent the default configuration, however, these settings may be changed to match any labelling requirements. Click the Save As button to save the label configuration. The rule will be saved with a user assigned name. Click OK to apply the current settings. Allow stacking – Labels are allowed to stack up to a maximum of two, three, or four lines. Allow horizontal inside – Labels are allowed to be placed horizontally inside the polygon. Allow labels to cross lines Labels are allowed to cross line features and area boundaries. Allow dominant angle – Labels are allowed to be placed parallel to the dominant angle of the polygon. Allow font reduction Automatically reduces the label size incrementally, when necessary. Each step shrinks the selected font by 0.5 pt. Allow extending beyond boundary Labels are allowed to exceed the boundaries of the polygon being labelled. Allow outside – Labels are allowed to be placed outside the polygon being labelled. Allow overlapping labels Area Labels are allowed to overlap other labels in the same labelling session. Allow inside, along boundary Labels are allowed to be placed inside the polygon, following the polygon boundary. Allow use of leader lines – Incorporates the use of leader lines. Options include the number of lines the leader line are allowed to cross, the width of the leader line being used and the style of arrow to be used as the leader line. NOTE: For Area type data, labels are placed relative to an object's centroid. For areas grouped in a compound path, the largest area of the compound will be labelled. Chapter 17: MAP LabelPro MAP LabelPro Rules 183 LINE RULES The Line Rules dialog box contains the label configuration options for labelling Line layers. Rules can be set by selecting a line feature type layer clicking the Line Rules edit button in the Rules column. The placement settings in the graphic below represent the default configuration, however, these settings may be changed to match any labelling requirements. Click the Save As button to save the label configuration. The rule will be saved with a user assigned name. Click OK to apply the current settings. Starting Point – Specify where the start of the label will be placed with options including Start, Center and End. Start will have the start of the label placed at the starting point of the line, Center will place the label in the center of the line and End will place the label at the end of the line. The starting point of a line depends on the direction of the vertices. Allow overhang – Labels are allowed to overhang the line up to a set percentage. The percentage of overhang is relative to the start of the label and the end of the line. Placement – Place labels using an offset or on a centerline. Offset labels Above or Below a line. Vertical Split places multiple word labels above and below the line and relative to the center of the line. If the generated label only has one word, it will be placed on the suppression layer. The Centerline option places labels directly on top of the line. Allow stacking – Labels are allowed to stack to a maximum of two lines. Allow Labels to Cross Lines Labels are allowed to cross line features and area boundaries. Allow font reduction Automatically reduces the label size incrementally, when necessary. Each step shrinks the selected font by 0.5 pt. Label joined feature – Places one label on a line that is joined together. Label each feature – Labels each and every line segment. Divided highways – Label multiple road segments with a common symbol such as a shield. Lines must be within 0.25 inch and 75% of the lines must be parallel to be considered a divided highway. The divided highway symbol will be placed on the line with the longest geometry. Spread words – Multiple word labels placed a specified amount apart. Repeat labels– Repeat labels along a line at specified amounts. Allow overlapping labels – Check this option to allow line labels to overlap with other labels in the same labelling session. Allow use of leader lines Incorporate the use of leader lines. Allowed Line Crosses permits the number of lines the leader line will be allowed to cross. Leader Width and Arrow Style adjusts the thickness and style of the leader line, respectively. NOTE: Text as obstacles will not work unless the Allow labels to cross lines option is disabled. This is because text obstacles are treated as areas and not text. Also, text will only be avoided being placed where it intersects the outline of the shape and not within it. 184 Using the Placement option Vertical Split may require additional line smoothing (straightening or simplifying). Chapter 17: MAP LabelPro MAP LabelPro Rules POINT RULES The Point Rules dialog box contains the label configuration options for labelling Point layers and follows the same conventions mentioned for the previous two data types. Allow stacking – Labels are allowed to stack up to a maximum of two, three, or four lines. Placement – Click the placement buttons in the desired order of priority. Use the Clear Last or Clear All options to remove selections. Unselected positions will not be considered. Allow labels to cross lines Labels are allowed to cross line features and area boundaries. Allow font reduction Automatically reduces the label size incrementally, when necessary. Each step shrinks the selected font by 0.5 pt. Centered on point Labels are placed on the center of the point. Allow use of leader lines Incorporate the use of leader lines. Allowed Line Crosses permits the number of lines the leader line will be allowed to cross. Leader Width and Arrow Style adjusts the thickness and style of the leader line, respectively. Allow overlapping labels – Check this option to allow point labels to overlap with other labels in the same labelling session SAVING AND LABELLING Once the layers, main configuration, style and rule based options have been completed, proceed to label the map data by clicking the Save & Label button. Clicking the Save & Label button will save the current settings, close the main MAP LabelPro configuration dialog box and begin the labelling process. Due to the complexity of the calculations involved in rule based text placement, it is likely that a progress meter will be displayed for most labelling processes except those that are sufficiently simple or small. Cancel the labelling process at any time by clicking on the button in the progress dialog box. Alternatively, save the current settings without labelling by clicking the Save button. This will close the main MAP LabelPro configuration dialog box and will not label any features. The dialog box can be reopened later to edit the saved label settings or be used to label the map. Chapter 17: MAP LabelPro MAP LabelPro Rules 185 Label Verification The graphic below shows results of a typical labelling result that options such as stack labels, repeat labels, allow labels to cross lines, and many others. Verify that labels were successfully placed in accordance to the rule base set out in the MAP LabelPro configuration. Also verify that labels were placed on the appropriate Destination text layers. Text failing to meet the labelling criteria will be placed in a Suppression layer (if one is available and has been set). If no Suppression layer is available, the non-compliant text is ignored and is not generated. Once placed, the labels are considered standard text and may be modified using Adobe Illustrator or MAPublisher operations. NOTE: Undo and Redo operations are supported when labelling. Be aware that undoing a labelling operation will also undo any changes to rules, styles or settings made at the same time. It may be useful to save without labelling, close the MAP LabelPro Editor, re-open it, then proceed to click Save & Label. OPTIONS None – (Default) No statistics panel will display after labelling. Just overall totals – Totals for all placed and unplaced labels (not separated by layer). Just layer totals – Totals for each layer. Shows both placed and unplaced labels. Show all – Show all statistics. The Statistics type drop-down lists several options for displaying statistical information after the labelling process is completed. This information is useful in determining how successful the labelling operation was based on the number of labels written to Destination and Suppression layers. It may help indicate whether adjustments to the rule base are required to necessitate a higher rate of success. 186 Chapter 17: MAP LabelPro Label Verification Appendices Appendix 1: Technical Reference Guide Graphic File Formats . . . . . . . . . . . . . . . . . . . . . . . . . . . . . . . . . . . . . . . . . . . . . . . . . . A1/1 MAPublisher Import Formats . . . . . . . . . . . . . . . . . . . . . . . . . . . . . . . . . . . . . . . . . . A1/2 MAPublisher Unicode Support . . . . . . . . . . . . . . . . . . . . . . . . . . . . . . . . . . . . . . . . A1/12 Frequently Asked Questions . . . . . . . . . . . . . . . . . . . . . . . . . . . . . . . . . . . . . . . . . . A1/15 GIS Backgrounder . . . . . . . . . . . . . . . . . . . . . . . . . . . . . . . . . . . . . . . . . . . . . . . . . . . . A1/21 Graphics Backgrounder . . . . . . . . . . . . . . . . . . . . . . . . . . . . . . . . . . . . . . . . . . . . . . . A1/23 Memory Considerations . . . . . . . . . . . . . . . . . . . . . . . . . . . . . . . . . . . . . . . . . . . . . . A1/25 Online Links . . . . . . . . . . . . . . . . . . . . . . . . . . . . . . . . . . . . . . . . . . . . . . . . . . . . . . . . . . A1/27 Technical Support Options . . . . . . . . . . . . . . . . . . . . . . . . . . . . . . . . . . . . . . . . . . . . A1/30 General Tips and Hints . . . . . . . . . . . . . . . . . . . . . . . . . . . . . . . . . . . . . . . . . . . . . . . . A1/32 Appendix 2: Coordinate Systems Overview . . . . . . . . . . . . . . . . . . . . . . . . . . . . . . . . . . . . . . . . . . . . . . . . . . . . . . . . . . . . . A2/1 The Geodetic Datasource . . . . . . . . . . . . . . . . . . . . . . . . . . . . . . . . . . . . . . . . . . . . . A2/3 Appendix 3: MAPublisher 8 How To’s For Legacy Users Legend Functionality in MAP Stylesheets . . . . . . . . . . . . . . . . . . . . . . . . . . . . . . A3/1 Grid and Scalebar Operations . . . . . . . . . . . . . . . . . . . . . . . . . . . . . . . . . . . . . . . . . A3/3 Copy and Paste . . . . . . . . . . . . . . . . . . . . . . . . . . . . . . . . . . . . . . . . . . . . . . . . . . . . . . . A3/4 Legacy Text Conversion . . . . . . . . . . . . . . . . . . . . . . . . . . . . . . . . . . . . . . . . . . . . . . . A3/4 Appendix 4: Helpful Styles and Symbols Files Appendix 5: Glossary Appendices Contents 187 Appendix 1: Technical Reference Guide Graphic File Formats AI The Adobe Illustrator native postscript file format. Refer to the Adobe Illustrator User Guide for more information. DOQ Digital Orthophoto Quadrangle (DOQ) are geographic images from the United States Geological Survey (USGS) and are stored in the JPG format. They can be placed by Adobe Illustrator and registered by the MAPublisher Register Image filter. DOQ are usually very large files (30-40 MB or more) and will require extremely large amounts of RAM. DRG Digital Raster Graphics (DRG) are scanned images of published topographic maps from the USGS stored in TIF format. They can be placed by Adobe Illustrator and registered by the MAPublisher Register Image filter. DRG are also usually very large files (30-40 MB or more) and will require extremely large amounts of RAM for any manipulation within Adobe Illustrator. EPS The Encapsulated Post Script (EPS) file is used to transfer PostScript language artwork between applications (also see PostScript in the glossary section of the User Guide). EPS files are easily opened by Adobe Illustrator because the format is widely supported by most graphics programs. It is the preferred format for export to most illustration and page-layout programs. EPS files are by their nature vector based, but can contain embedded raster graphics and fonts. GIF Graphic Interchange Format (GIF) is a colour-indexed graphics format, commonly used for web pages and image file transfer. Adobe Illustrator can export 8-bit indexed-colour or grayscale gifs. JPEG Joint Photographic Experts Group (JPEG or JPG) is a compression technique for raster file formats. The Digital Orthophoto Quadrangle geographic images from the USGS are stored in this format, which can be imported by Adobe Illustrator and registered by the MAPublisher Register Image filter. DOQ are usually very large files (30-40 MB or more) and will require extremely large amounts of RAM. PDF Portable Document Format (PDF) is a standardized format developed by Adobe for use across Macintosh, Windows, DOS, and UNIX platforms. Based on the PostScript Level 2 language, PDF supports both raster and vector graphics. TIF/TIFF/GEOTIFF Tagged Image File Format (TIFF or TIF) is a common raster graphic file format that can be imported by Adobe Illustrator. Many raster geographic images from GIS systems are stored in this format, which can be imported by Adobe Illustrator and registered by the MAPublisher Register Image filter. A GeoTIFF is a TIFF file with embedded geographic information identifying its position and scale in world coordinates. OTHERS Please refer to the Adobe Illustrator User Guide for other graphics file formats supported by Adobe Illustrator. Appendix 1: Technical Reference Guide Graphic File Formats A1/1 MAPublisher Import Formats This section contains descriptions of the GIS formats supported for import by MAPublisher. Here you will find an overview of the structure of each format, as well as information on supported format versions and elements unique to each data type. Each file format will carry a checklist covering which core elements are supported by MAPublisher during its import. You can also refer to the Frequently Asked Questions section in this guide for information on any issues associated with the various file formats. Also see chapter 2 on Map Data File Formats. AUTOCAD DRAWING (*DWG) AND DRAWING EXCHANGE (*.DXF) There are two formats used by AutoCAD: DXF is a CAD data file format, developed by Autodesk as their solution for enabling data interoperability between AutoCAD and other programs. The Dwg format is used for storing two and three dimensional design data and is the internal format for the AutoCAD Computer Aided Design package. DWG is also the common name for AutoCAD proprietary DWG technology developed by Autodesk for their AutoCAD package. Supported Elements Typical File Extensions *.dwg, *.dxf Automated Translation Yes User-Defined Attributes Yes Coordinate System Support No Generic Colour Support Yes Spatial Index Never Schema Required Yes 3D Support Yes Supported Versions Windows: Releases vrs. R12 to 2007 Mac OS X: Releases vrs. R12 to 2007. Supported Geometry Aggregate Circles Circular Arc Elliptical Arc Ellipses Polygon Donut Polygon Point Line Text No Yes Yes Yes Yes Yes Yes Yes Yes Yes Prior to the import process, additional Settings can be made, which will affect how the selected file will import. The following parameters can be applied to the import: • Group Entities - Group entities by Layer Name or Geometry. • Hatches - Check this box if you want MAPublisher to read your hatch patterns upon import. • White Lines and Fills - Enabling the Import as is option will instruct MAPublisher to import the data true to the original colour settings contained in the file. Check the Change white lines and fills to black box to import black lines instead of the files native white lines. Check the Create black background option to incorporate a layer containing a black background to mimic the AutoCAD environment. ESRI INTERCHANGE FILE (*.E00) An archive of files that describes a complete ArcInfo coverage. This is either ASCII or compressed into a binary and is used to transfer files between different versions of ArcInfo. It is a commonly found format for freely distributed data such as that found at the GIS Data Depot (http://www.geocomm.com). A single E00 file describes a complete ArcInfo coverage. The file itself is actually an archive of several smaller files, referred to as subfiles. Some of these subfiles have fixed names which do not vary from coverage to coverage, and A1/2 Appendix 1: Technical Reference Guide MAPublisher Import Formats follow a predefined data format. The remainder of the subfiles contained within an E00 are the info files. These files may contain user-defined attributes, and have names which vary from coverage to coverage. Supported Elements Supported Geometry Typical File Extensions *.e00 Automated Translation Yes User-Defined Attributes Yes Coordinate System Support Yes Spatial Index Never Schema Required Yes Geometry Type Attribute e00_type Aggregate Circles Circular Arc Elliptical Arc Ellipses Polygon Donut Polygon Point Line Text No No Yes Yes No Yes Yes Yes Yes Yes There are essentially four types of geometry defined in E00 files, which will be reproduced as layers during import: Arcs (lines), Points, Polygons, and Text. Prior to the import process, an additional Setting can be made: • Tic points layer - This option enables you to include an additional layer which will hold the registration points for the imported data. The default is to set to Yes. ESRI ARCINFO GENERATE (*.GEN) ESRI simple ASCII storage and interchange format. There are three different types of .gen files each with of its own syntax one for points, one for lines, and one for text geometries. This is the format exported by ArcInfo generate command. The gen files are use by ArcInfo to transfer coverages to other mapping systems. Supported Elements Typical File Extensions *.gen Automated Translation Yes User-Defined Attributes No Coordinate System Support No Generic Colour Support No Spatial Index Never Schema Required Yes Geometry Type Attribute arcgen_geometry Supported Geometry Aggregate Circles Circular Arc Elliptical Arc Ellipses Polygon Donut Polygon Point Line Text No No No No No No No Yes Yes Yes Appendix 1: Technical Reference Guide MAPublisher Import Formats A1/3 ESRI SHAPEFILE (*.SHP) The ESRI Shapefile is a geospatial vector data format for geographic information systems software. It is developed and regulated by ESRI as a mostly open specification for data interoperability among ESRI and other software products. A Shapefile is a digital vector storage format for storing geometric location and associated attribute information. This format lacks the capacity to store topological information A single logical Shapefile consists of three physical files, each with one of the following file name extensions: *.shp : Geometric data *.shx : Index to the geometric data *.dbf : Attributes for the geometric data These extensions are added to the base name of the Shapefile , creating separate physical files that must all reside in the same directory. You must select the *.shp file for import. Point, multipoint, polyline, and polygon geometric data can be stored in *.shp files. However, a single *.shp file can contain only one type of geometry. Each entity in a *.shp file has a corresponding entry in the *.shx index file and a corresponding row of attributes in the associated *.dbf file. The order of the entries in each of these files is synchronized. For example, the 3rd geometric entity in the *.shp file is pointed to by the 3rd entry in the *.shx index file and has the attributes held in the 3rd row of the *.dbf. A single Shapefile may also consist of a number of additional files, with the following file name extensions: *.sbn / *.sbx : Spatial index files for the geometric data. These two files are only generating by an ESRI product however they are not required by MAPublisher for import and will they be generated when exporting data to the Shapefile format.. *.prj : Spatial coordinate system information. If a *.prj file exists in your Shapefile directory, holding the coordinate system information of the Shapefile , this will automatically be read by MAPublisher on import. If your Shapefile folder does not contain a .prj file you will be required to specify the coordinate system in order to fully utilize MAPublisher. Supported Elements Typical File Extensions *.shp (*.shx, *.dbf, *.prj) Automated Translation Yes User-Defined Attributes Yes Coordinate System Support Yes (if have *.prj) Generic Colour Support No 3D Support Yes Schema Required Yes Transaction Support No Geometry Type Attribute SHAPE_GEOMETRY A1/4 Appendix 1: Technical Reference Guide MAPublisher Import Formats Supported Geometry Aggregate Circles Circular Arc Elliptical Arc Ellipses Polygon Donut Polygon Point Line Text Yes No No No No Yes Yes Yes Yes No MAPINFO INTERCHANGE (*.MIF/*.MID) MIF is a published ASCII storage format used by the MapInfo. It is used as a file format for map and database exporting/importing in MapInfo software products. The MapInfo Reference Manual describes the MIF format and all constants it uses for colour, style, symbol, and fill patterns. MapInfo Interchange Format Files are often called MIF or MIF/MID files. A single logical MIF file consists of two physical files, having the following file name extensions: *.mif : Geometric data *.mid : Attributes for the geometric data These extensions are added to the base name of the MIF file, creating separate physical files that must all reside in the same directory. You must select the *.mif file for import. Each entity in a *.mif file has a row of attributes stored in an associated *.mid file. A single .mif file contains many different types of geometry however, the associated attribute in the *.mid file must have the same number and type of fields for each entity in the *.mif file. The order of the entries in the two files is synchronized. For example, the second geometric entity in the *.mif file has the attributes held in the second row of the *.mid file. The number and type of attributes associated with each entity is specified by the user. There must be at least one attribute field in the *.mid file. Supported Elements Typical File Extensions *.mif (*.mid) Automated Translation Yes User-Defined Attributes Yes Coordinate System Support Yes Generic Colour Support Yes Spatial Index Never Schema Required Yes Geometry Type Attribute mif_type Supported Geometry Aggregate Circles Circular Arc Elliptical Arc Ellipses Polygon Donut Polygon Point Line Text Yes Yes Yes Yes Yes Yes Yes Yes Yes Yes Prior to the import process, additional Settings can be made, which will affect how the selected file will import. The following parameters can be applied to the import: • Import as Visible Attributes - Enable this option to view the pen and brush pattern values in the imported attribute table. The MAPublisher MID/MIF importer supports the storage of point, line, polyline, arc, ellipse, rectangle, rounded rectangle, region (polygon), and text geometric data in .mif files. Each geometric entity present in a *.mif file has display properties such as pen and brush width, pattern, and colour. Supported MID MIF properties are as follows: MAPublisher supports the import of line weights (0-7), colours (24 bit RGB), strokes (1-71). It also supports fonts (family, style, justification) for text. In order to use line patterns and fill patterns you must have opened or accessed the style library equivalents. Two library files have been created, MIF_LineStyles.ai and MIF_AreaStyles.ai, which provide support for many of the standard MapInfo pen styles (stroke patterns) and brush styles (fill patterns). These files can be found in the Helpful Styles & Symbols folder on your MAPublisher CD. Please refer to your Adobe Illustrator User Guide for details about how to add these libraries to your Adobe Illustrator Graphic Style panel. Appendix 1: Technical Reference Guide MAPublisher Import Formats A1/5 MAPINFO TABLE (*.TAB) TAB is a proprietary geospatial vector data format for geographic information systems software used by MapInfo mapping products. A minimum of two files are required for the tab format. The .DAT file which stores the attribute data and the .TAB ASCII file which is the link between all other files and holds information about the type of data file. The MapInfo TAB importer is closely patterned after the MapInfo MIF/MID reader and writer. This commonality makes it easy to support both MIF and MapInfo native formats in the same mapping file. A single logical TAB file consists of a number of physical files, having the following file name extensions: *.tab : The main file for a MapInfo table, it is associated with the appropriate dat, map, id and ind files. *.dat : Tabular data for a table in MapInfo native format *.id : An index to a MapInfo graphical objects (MAP) file. *.map : Contains geographic information describing map objects *.ind : An index to a MapInfo tabular (DAT) file These extensions are added to the base name of the TAB file, creating separate physical files that must all reside in the same directory. You must select the *.tab file for import. Supported Elements Typical File Extensions *.tab (*.dat, *.id, *.map, *.ind) Automated Translation Yes User-Defined Attributes Yes Coordinate System Support Yes Generic Colour Support Yes Spatial Index Always Schema Required Yes Geometry Type Attribute mapinfo_type Supported Geometry Aggregate Circles Circular Arc Elliptical Arc Ellipses Polygon Donut Polygon Point Line Text Yes Yes Yes Yes Yes Yes Yes Yes Yes Yes Prior to the import process, additional Settings can be made, which will affect how the selected file will import. The following parameters can be applied to the import: • Import as Visible Attributes - Enable this option to view the pen and brush pattern values in the imported attribute table The MAPublisher TAB importer supports the storage of point, line, polyline, arc, ellipse, rectangle, rounded rectangle, region (polygon), and text geometric data in .tab files. Each geometric entity present in a *.tab file has display properties such as pen and brush width, pattern, and colour. Supported TAB properties match those described for MID MIF files on the previous page. Raster TAB files cannot be imported in MAPublisher. A1/6 Appendix 1: Technical Reference Guide MAPublisher Import Formats MICROSTATION DESIGN (*.DGN) DGN are the native files created for Bentley Systems Inc. MicroStation product. These files consist of a header, followed by a series of elements. The header contains global information including the transformation equation from design units to user coordinates, as well as the dimension of the elements in the file. Each element contains standard display information, such as its colour, level, class, and style, as well as a number of attributes specific to its element type. For example, a text element has fields for font, size, and the text string in addition to the standard display attributes. Supported Elements Typical File Extensions *.dgn Automated Translation Yes User-Defined Attributes Yes Coordinate System Support No Generic Colour Support Yes Spatial Index Never Schema Required Yes Geometry Type Attribute igds_type 3D Support Yes Supported Versions Windows: V7, V8. Mac OS X: V7,V8 Supported Geometry Aggregate Circles Circular Arc Elliptical Arc Ellipses Polygon Donut Polygon Point Line Text No Yes Yes Yes Yes Yes Yes Yes Yes Yes Prior to the import process, additional Settings can be made, which will affect how the selected file will import. The following parameters can be applied to the import. Note: versions V7 and V8 are supported for import, attached raster files are ignored. • Group Elements - Choose how you want to group the elements of the file on import. If you group the elements by level, it may result in a large number of output files. By Level is the default. • Coordinate Units - Choose Master or UOR (Unit of Resolution) as the coordinate units. Master is the default. • White Lines and Fills - Enabling the Import as is option will instruct MAPublisher to import the data true to the original colour settings contained in the file. Check the Change white lines and fills to black box to import black lines instead of the files native white lines. Check the Create black background option to incorporate a layer containing a black background to mimic the AutoCAD environment. • Other - Check Drop complex chains if you want each component of a complex chain to be returned as its own feature, otherwise all elements of the complex chain will be merged into a single linear feature. TIGER/LINE (*.RT1) (*.BW1) Topologically Integrated Geographic Encoding and Referencing (TIGER). TIGER is the United States Census Bureau format for its digital database of geographic features. TIGER includes both land attributes such as roads, buildings, rivers, and lakes, as well as areas such as counties, ZIP codes, census tracts, and census blocks. Some of the geographic areas represented in TIGER are political areas, including counties, congressional districts, school districts, and ZIP codes. Others are statistical areas, including Metropolitan Statistical Areas (MSA), census tracts, census block groups, and census block. The database contains information about these features such as their location in latitude and longitude, the name, the type of feature, address ranges for most streets, the geographic relationship to other features, and other related information. More information on the TIGER/Line file format and data product can be found on the U.S. Census web page at: http://www.census.gov/geo/www/tiger/ Appendix 1: Technical Reference Guide MAPublisher Import Formats A1/7 This web site contains a detailed description of the current TIGER/Line format, with an explanation of field meaning for each feature type. A detailed description of the TIGER/Line 1998 format, with an explanation of field meaning for each feature type, is available at: http://www.census.gov/geo/www/tiger/tiger98.pdf Supported Elements Typical File Extensions *.rt1, *.bw1 Automated Translation Yes User-Defined Attributes Yes Coordinate System Support Yes Generic Colour Support Yes Spatial Index Never Schema Required Yes Transaction Support No Geometry Type Attribute tiger_type Supported Versions 1992, 1995, 1997, 1998, 1999, 2000, 2002 Supported Geometry Aggregate Circles Circular Arc Elliptical Arc Ellipses Polygon Donut Polygon Point Line Text No No No No No Yes Yes Yes Yes No USGS DIGITAL LINE GRAPH (*.DLG) (*.OPT) DLG is a fixed field record that may or may not have end of line markers. The DLG file structure was designed to accommodate all categories of spatial data represented on a conventional line map. DLG is a published ASCII format developed by the United States Geological Survey (USGS) Federal Agency and is intended to assist in data exchange with the National Digital Cartographic Data Base (NDCDB). The DLG reader supports all three distinct types of DLG data: • Large-scale DLG data (1:24,000-scale) • Intermediate-scale DLG (1:100,000-scale) • Small-scale DLG data (1:2,000,000-scale) The three scales of DLG data are physically formatted into files in one of these ways: standard, optional, and graphics formats. MAPublisher supports both the standard and the optional DLG distribution formats; however the graphics format is not supported. Most DLG data is distributed in the optional format. The DLG file structure was designed to accommodate all categories of spatial data represented on a conventional line map. Node, line, and area data types are present within the DLG format, along with linkages and attribute codes. Linkages are references to other features within the same DLG data set, used in a variety of contexts. DLG files do not explicitly store attribute values but use a feature coding approach in which unique feature codes are assigned to the different types of features stored within the data set. MAPublisher will look for the extension .dlg or .opt for the input DLG files. Supported Elements Typical File Extensions *.dlg, *.opt Automated Translation Yes User-Defined Attributes No Coordinate System Support Yes Generic Colour Support No Spatial Index Never Schema Required No Geometry Type Attribute dlg_type A1/8 Appendix 1: Technical Reference Guide MAPublisher Import Formats Supported Geometry Aggregate Circles Circular Arc Elliptical Arc Ellipses Polygon Donut Polygon Point Line Text No No No No No Yes Yes Yes Yes No USGS SDTS (*CATD.DDF) SDTS is the USGS robust way of transferring Earth-referenced spatial data between dissimilar computer systems with the potential for no information loss. It is a transfer standard that embraces the philosophy of self-contained transfers, i.e. spatial data, attribute, georeferencing, data quality report, data dictionary, and other supporting metadata all included in the transfer. More info can be found at http://mcmcweb.er.usgs.gov/sdts/. Files in the SDTS format will have the extension *.ddf. More information on this format can be found at: http://mcmcweb.er.usgs.gov/sdts/ A group of *.ddf files is normally identified by the catalog file, or *CATD.DDF file, which relates the files of a single SDTS transfer, and binds together all the files with a common prefix. Always select the SDTS file which ends in CATD, i.e. HP01CATD.DDF. Supported Elements Typical File Extensions *.ddf Automated Translation Yes User-Defined Attributes No Coordinate System Support Yes Generic Colour Support No Spatial Index Yes Schema Required N/A Transaction Support No Geometry Type Attribute sdts_type Supported Geometry Aggregate Circles Circular Arc Elliptical Arc Ellipses Polygon Donut Polygon Point Line Text No No No No No Yes Yes Yes Yes No KEYHOLE MARKUP LANGUAGE (*KML) KML is an XML-based language for managing the display of three-dimensional geospatial data in the programs Google Earth, Google Maps, Google Mobile and WorldWind. The KML file specifies a set of features for display. Each feature always has a longitude and a latitude and can have other data, such as tilt, heading, and altitude. KML shares some of the same structural grammar as GML. KML files are very often distributed as KMZ files, which are zipped KML files with a .kmz extension. Supported Elements Typical File Extensions *.kml, *.kmz Automated Translation Yes User-Defined Attributes Yes Coordinate System Support Yes Generic Colour Support Yes Spatial Index Never Schema Required No 3D Support Yes Supported Geometry Aggregate Circles Circular Arc Elliptical Arc Ellipses Polygon Donut Polygon Point Line Text Yes No No No No Yes Yes Yes Yes No Prior to the import process, additional Settings can be made, which will affect how the selected KML file will import. The following parameters can be applied to the import: • Allow Random Colour Mode - Enabling this option will allow Adobe Illustrator to generate random colour settings for your data. • Expand Network Links - Checking this box will enable the use of network linked KML files. Appendix 1: Technical Reference Guide MAPublisher Import Formats A1/9 DELIMITED ASCII TEXT (*CSV, *TSV,*TXT ) An ASCII file containing a tabular data where delimiters separate the columns and rows. Common delimiters are commas, spaces, or tabs. Microsoft Excel and many other spreadsheet programs will export data in these formats. Supported Elements Typical File Extensions *.csv, *.tsv, *.txt Automated Translation Yes User-Defined Attributes Yes Coordinate System Support No Generic Colour Support No Spatial Index Never Schema Required Yes Supported Geometry Aggregate Circles Circular Arc Elliptical Arc Ellipses Polygon Donut Polygon Point Line Text No No No No No No No Yes No No Prior to the import process, additional Settings can be made, which will affect how the selected file will import. The following parameters can be applied to the import: • Axis Column - Specify which columns contain the x and y coordinates for the point data to be read in. • Coordinate Format - Choose the formatting type of the data you wish to import (e.g. Decimal Degrees, Delimited Degrees Minutes Seconds, Packed DMS) • Use first line as header - Allows the user to enable the first line of the text file to be used as column headings. S57 FORMAT (*000) S57format is intended for the exchange of digital hydrographic data between national hydrographic offices and for its distribution to manufacturers, mariners and other data users. It is used for the supply of ENC cells (Electronic Navigational Charts) to ECDIS (Electronic Chart Display and Information System). The format is public, developed and maintained by the IHO (International Hydrographic Office) CHRIS working committee (Committee on Hydrographic Requirements for Information Systems). The objects spatial geometry can be of Point, Line or Area geometry, while object descriptions are categorized in object classes, organized in specific attributes schemas. For a full format description, please visit http://www.iho.shom.fr/PUBLICATIONS/IHO_Download. htm#S-57 (Appendix A in particular). An online object catalog is also available on www.s-57.com An S57 base file has the extension *.000, while the update files have extensions like .001, .002 and so on. It can also be accompanied by other files: *.000: main file *.001: update file 1 *.002: update file 2 *.00n: update file n files.TXT and files.JPG: ancillary text and picture files indicated in attribute definition Update files contains only the changed (new/deleted/modified) objects and are only used as a complement of a .000 file. Only the *.000 file is required for the import into MAPublisher. The update files will be applied at conversion, when present. However, text and image files linked to attributes will be ignored. A1/10 Appendix 1: Technical Reference Guide MAPublisher Import Formats Supported Elements Typical File Extensions *.000 (*.001 *.002...) Automated Translation Yes User-Defined Attributes No Coordinate System Support Yes Generic Colour Support No 3D Support Yes Schema Required N/A Transaction Support No Geometry Type Attribute s57_type Supported Geometry Aggregate Circles Circular Arc Elliptical Arc Ellipses Polygon Donut Polygon Point Line Text No No No No No Yes Yes Yes Yes No NOTE: Most ENC producers (private and public) publish their .000 files in encrypted formats. Only non-encrypted files can be imported in MAPublisher (from NOAA or USACE for example). GEOGRAPHIC MARKUP LANGUAGE - SIMPLE FEATURES (*.GML) GML was designed as a geographic interface language for the Geo-Web. It is currently in draft as an ISO standard (ISO 19136). The goal of the format is to provide users with a set of abstract base objects that can be built into working real world datasets. It uses as XML base to store geometry and feature information that can easily be transported across the Internet. The GML simple feature profile was created by the Open Geospatial Consortium as a restricted subset of the GML specification. It provides a reduced geometry and metadata profile that can be shared across many GIS tasks. This simple feature model can be used as a base to generate local application profiles for a specific work area. Since the GML models base abstract classes, these application profiles (schemas) are required for accessing and processing any GML datasets. Generally, GML data has a *.GML extension, and requires any application specific schema files (*.xsd). For more information on GML, and the GML simple features profile, please visit the Open Geospatial Consortium web site: www.opengeospatial.com Supported Elements Typical File Extensions *.gml (*.xml) *.xsd Automated Translation Varies User-Defined Attributes Yes Coordinate System Support Yes Generic Colour Support No 3D Support Yes Schema Required Yes (*.xsd) Transaction Support No Geometry Type Attribute xml_type Supported Geometry Aggregate Circles Circular Arc Elliptical Arc Ellipses Polygon Donut Polygon Point Line Text Yes No Yes No No Yes Yes Yes Yes No Appendix 1: Technical Reference Guide MAPublisher Import Formats A1/11 MAPublisher Unicode Support This section contains information regarding Unicode character encoding in MAPublisher. MAPublisher supports Unicode character encoding in MAP Views, MAP Attributes, MAP Stylesheets, and MAP Selection Filters. MAPublisher can also reference Adobe Illustrator layers, graphic styles and character styles using Unicode encoding. To use Unicode character encoding you require a Unicode compliant font. Mac OS X users will have Unicode compliant fonts installed with OS X. Windows users will require Unicode compliant fonts to render Unicode. For more information on Unicode visit http://www.unicode.org The following tables display Unicode—UTF8 support in MAPublisher, for GIS data formats that are Unicode—UTF8 compliant. Unicode support for importing and exporting data is different, so for each platform two tables have been created. For each data format there are four areas where Unicode character encoding can be used: 1. File Directory - when Unicode encoding is used in the path to where the file is located. 2. Filename - when Unicode encoding is used in the filename. 3. Attribute column name - when Unicode encoding is used in a column name for attributes. 4. Attribute value - when an attribute value contains Unicode encoding. Windows Unicode Support (Importing) Data Format Delimited Text CAD-DWG CAD-DXF ESRI Interchange File ESRI ArcInfo Generate ESRI Shapefile GML (Simple Features) MapInfo MIF/MID MapInfo TAB MicroStation Design KML S57 A1/12 File Directory Filename P P P P P P P P P O P P P P P P P P P P O P P P Attribute Value Data Format P P Delimited Text FORMAT HAS NO ATTRIBUTES CAD-DWG FORMAT HAS NO ATTRIBUTES CAD-DXF P P FORMAT HAS NO ATTRIBUTES P P O O P P P P FORMAT HAS NO ATTRIBUTES P P FORMAT USES SIMPLE ASCII TEXT FOR ATTRIBUTE NAMES AND MOST VALUES Appendix 1: Technical Reference Guide MAPublisher Unicode Support Windows Unicode Support (Exporting) Attribute Column Name ESRI Interchange File ESRI ArcInfo Generate ESRI Shapefile GML (Simple Features) MapInfo MIF/MID MapInfo TAB MicroStation Design KML File Directory Filename P P P P P P P P P O P P P P P P P P P P O P Attribute Column Name Attribute Value P P FORMAT HAS NO ATTRIBUTES FORMAT HAS NO ATTRIBUTES P P FORMAT HAS NO ATTRIBUTES P P O O P P P P FORMAT HAS NO ATTRIBUTES P P Mac OS X Unicode Support (Importing) Data Format File Directory Filename P P P P P P P P P O P P P P P P P P P P O P Delimited Text CAD-DWG CAD-DXF ESRI Interchange File ESRI ArcInfo Generate ESRI Shapefile GML (Simple Features) MapInfo MID/MIF MapInfo TAB MicroStation Design KML S57 P P Mac OS X Unicode Support (Exporting) Attribute Column Name Attribute Value P P Data Format Delimited Text FORMAT HAS NO ATTRIBUTES CAD-DWG FORMAT HAS NO ATTRIBUTES CAD-DXF P P ESRI Interchange File FORMAT HAS NO ATTRIBUTES ESRI ArcInfo Generate P P O O P P P P ESRI Shapefile GML (Simple Features) MapInfo MID/MIF MapInfo TAB FORMAT HAS NO ATTRIBUTES P MicroStation Design P KML File Directory Filename P P P P P P P P P O P P P P P P P P P P O P Attribute Column Name Attribute Value P P FORMAT HAS NO ATTRIBUTES FORMAT HAS NO ATTRIBUTES P P FORMAT HAS NO ATTRIBUTES P P O O P P P P FORMAT HAS NO ATTRIBUTES P P FORMAT USES SIMPLE ASCII TEXT FOR ATTRIBUTE NAMES AND MOST VALUES Windows Unicode Support (Working with Images) When using system encoding on Windows XP Û Data Format World File (.tfw) Image Report (.irp) MapInfo TAB (.tab) ListGeo (.lgo) GeoTIFF (.tif) File Directory (Register Image) P P P P P /P /P /P /P /P Û t Û t Û t Û t Û t Filename (Register Image) P P P P P Û /P /P /P /P /P t Û t Û t Û Û t t File Directory (Export Image) P P P P P /O /O /O /O /O Û t Û t Û Û Û t t t Filename (Export Image) P P P P P Û t Û t (for example, using the default Japanese encoding on Japanese Windows XP) t t Û /O /O /O /O /O Û t Û t hen using non-system W encoding on Windows XP (for example, using Japanese encoding on English Windows XP) Appendix 1: Technical Reference Guide MAPublisher Unicode Support A1/13 Mac OS X Unicode Support (Working with Images) Data Format World File (.tfw) Image Report (.irp) MapInfo TAB (.tab) ListGeo (.lgo) GeoTIFF (.tif) A1/14 File Directory (Register Image) P P P P P Filename (Register Image) P P P P P Appendix 1: Technical Reference Guide MAPublisher Unicode Support File Directory (Export Image) P P P P P Filename (Export Image) P P P P P Limited support (not all combinations of Unicode characters are supported) Frequently Asked Questions This section presents a number of frequently asked questions regarding the use of MAPublisher. If the answer to your question is not included here please consult the online FAQs at http://www.avenza.com/products.faq.html or the online MAPublisher Forum at http://www.avenza.com/forum/ . In addition, there is a US Census Bureau GIS FAQ database at http://www.census.gov/geo/www/tiger/faq-index.html INSTALLATION/ACTIVATION ISSUES The MAPublisher plug-in is in the Plug-ins folder but the filters do not all show up in Adobe Illustrator. Try exiting out of Adobe Illustrator, deleting the Adobe Illustrator preferences and plug-in cache files, and then restarting Adobe Illustrator. They are named AIPrefs (Windows) or Adobe Illustrator Prefs (Mac OS X) and Plug-in Cache. They are generally found in the directories: Illustrator CS2 and CS3: Windows XP: Documents and Settings\[user name]\Application Data\Adobe\Adobe Illustrator CSXX Settings\ Windows Vista: Users\[user name]\AppData\Roaming\Adobe\Adobe Illustrator CSXX Settings\ Mac OS X: Users/[user name]/Library/Preferences/Adobe Illustrator CSXX Settings/ Illustrator CS4: Windows XP: Documents and Settings\[user name]\Application Data\Adobe\Adobe Illustrator CS4 Settings\en_US\ Windows Vista: Users\[user name]\AppData\Roaming\Adobe\Adobe Illustrator CS4 Settings\en_US\ Mac OS X: Users/[user name]/Library/Preferences/Adobe Illustrator CS4 Settings/en_US/ Also check under Preferences > Plug-ins & Scratch Disks and ensure that the correct location of your plug-ins folder is indicated. I try to access the MAPublisher filters, but always receive a message saying MAPublisher cannot obtain a license. What should I do? 1.Check you have registered your copy of MAPublisher and received a license file. MAPublisher will fail to operate until you have received a license file for activation. For further details, please see chapter 1. 2.If you have purchased a machine-specific or fixed license you must ensure the License file is located in the following directory: Windows XP: C:\Documents and Settings\All Users\Application Data\Avenza\MAPublisher 8 Windows Vista: C:\ProgramData\Avenza\MAPublisher 8 Mac OS X: Applications/Avenza/MAPublisher 8/MAPublisher Plug-In/ 3.If you have a try-out version of MAPublisher, check that your copy has not expired. To do this, locate the *.lic file in the directory listed above. Open this file in a simple text editor. On the second line will be details of the expiration date of your try-out version. Note that this file has been automatically generated by Avenza and therefore manually editing will not re-activate MAPublisher. 4. If you have moved your license to a new computer you must notify Avenza and request a rehosting. To organize a rehosting email [email protected] and provide your MAPublisher 8 serial number along with the new machine ID. The new machine ID can be found by selecting the Telephone/Email option in the MAPublisher Activation Wizard on the new computer. Can I run two different versions of MAPublisher at the same time? You can run different full version releases (i.e.. 8.x and 7.x) if you have two versions of Adobe Illustrator. For example MAPublisher 8 using Adobe Illustrator CS3 and MAPublisher 7.6 using Adobe Illustrator CS2. You cannot run two point-releases of MAPublisher 8.x on the same machine even if you have two different versions of Adobe Illustrator. Appendix 1: Technical Reference Guide Frequently Asked Questions A1/15 How can I move my MAPublisher license to a new computer? Unless you have purchased a floating license, MAPublisher is licensed for use on one machine only and includes a protection mechanism that prevents activation on more than one computer. If you wish to move your license permanently to a new computer please perform the following steps: 1. Completely remove MAPublisher from the existing computer. 2. Install MAPublisher on the new computer. 3. Launch Adobe Illustrator on the new computer and start the menu Help > MAPublisher Licensing > License Management 4. Note the machine ID that will be displayed and email that 12-digit string along with your MAPublisher 8 serialnumber to [email protected] and indicate that you wish to move the license to a new computer. Why does the activation wizard repeatedly open when I have a valid license installed? If the activation wizard repeatedly prompts you to activate MAPublisher but you have already have a valid licence file from a previous activation installed then you should follow the procedure below. 1. Exit Adobe Illustrator 2. Locate your Adobe Illustrator preferences file typically named AIprefs (Windows) Adobe llustrator Prefs (Mac) 3. Once the file is located, delete the file and restart Adobe Illustrator. This should resolve the problem. NOTE: This applies to both floating and stand alone license users MEMORY AND SPEED ISSUES Why do I need so much more memory (RAM) than I do with my GIS? The graphics software environment of Adobe Illustrator loads the entire file into memory rather than just reading it from disk, thus more memory is required. MAPublisher builds a mini-GIS application inside Adobe Illustrator so that it can geo-code information and attach data to objects. This also has some overhead. When you are importing a lot of files with MAPublisher into Adobe Illustrator, you’ll notice that the amount of available memory will decrease rapidly and your computer loses speed. This is due to the memory management. MAPublisher reserves a fairly large amount of memory for each import-action, which is not always returned when the import is done. The solution is simple: save your file, close it and open it again. It’s not even necessary to close Adobe Illustrator itself. By closing the file the reserved memory is properly returned. How can I improve the speed of my data import? Many GIS data files are large and when a series of such files is imported, you may find that the import filter starts to run more slowly. This is because scratch and memory allocations are being used up. Try the following suggestions: • Close the MAP Attributes panel prior to importing data. • Periodically save your work then close and reopen the file. This will free up the available scratch memory. • Reduce the maximum number of undoes, since they all reside in memory. • See the Memory Considerations section for other suggestions in this appendix. A1/16 Appendix 1: Technical Reference Guide Frequently Asked Questions DATA IMPORT ISSUES Why do my files appear squashed after import? They are probably stored in geographic or lat/long coordinates. Data in lat/long usually looks “squashed”. You can project them into an alternate map projection using the MAP View Editor (see chapter 4). What alternatives are there for importing a file format not supported by MAPublisher? We provide a web page that has links to freeware, shareware and commercial GIS data translators at http://www.avenza.com/support.links.html. If you cannot find the translator that you need give us a call as we may have other suggestions. I am having trouble getting my layers to overlay correctly. Both files import correctly when they are imported alone, but when I import the second file, they do not line up as expected. They should overlay correctly. Probably they are in different coordinate systems. It is very important that you ensure that data used within a single mapped area have the same map projection. If different data sets for a geographic location have differing coordinate systems, the chances are high that they will not overlay on import. If the files are of differing coordinate systems, any software will give you the same results. If the coordinate systems are known, you can use the MAP View Editor filter to change all data to a common coordinate system. For more information about map projections see http://www.gisdevelopment.net/tutorials/tuman007pf.htm. Why do my MapInfo files crash on import or do not import properly? There are a couple of possible common causes of this. A couple of possibilities may be: 1. How did you transfer the file to the machine where it is being imported? If you have transferred these files from one operating system to another then you must always use ASCII FTP transfer, or the files may be corrupted. We have found that you can not rely on the automatic transfer with all ftp utilities. Some do not recognize the .MID files as being text. The .mid files may be inadvertently interpreted as binary music files, which often carry the same file extension. If they are transferred as binary you will have trouble importing them. 2. Were the files compressed? If the files are compressed using a Windows ZIP format, you must be careful when decompressing them. If this is the case and the utility you used was Stuffit, you need to make sure that it was set for a DOS zip file or the file can be corrupted. The shareware utility ZIPIT found at http://maczipit.com has been found to be quite good for decompressing Windows zip files. I am having trouble with importing SDTS files. Where am I going wrong? Be very careful how you receive a xxx.tar.gz file off the USGS web site and decompress it. These files are in a binary format and if you use Smart TAR CR/LF translation it will not import and may cause errors in MAPublisher. Make sure that you do all FTP transfers as binary. After you receive it, use gzip to decompress it and TAR to further decompress it. You should have about 20 separate files, look for the ones that end in xxxxCATD.DDF. Appendix 1: Technical Reference Guide Frequently Asked Questions A1/17 Why does my data sometimes vanish? If you imported some data and it appeared when selected, but when you deselected the data it seemed to vanish, here are a few things to check: • You may have inadvertently pressed cut or the delete key. Check under Edit in the menu bar, if the Undo Clear task is available this means that you just deleted something. Select Undo Clear, and the data should return. • Check the order of your layers. Try moving the layer in question to the top of the list of layers in the Layers panel so that it is drawn on top of the other layers. • Make sure that current layer is available for viewing in the Layers panel, by having a dot in the left-hand column under the eye (visualization) and beside the layer name. • Check that you have colours for the fill and stroke set in the paint panel. • Check the setting for the stroke width and increase if necessary. Why are my Shapefiles not imported? There are a couple of possible causes of this. The two items to check for are: 1. Make sure that you have all three required files. There should be a triplet for each layer/coverage with the extensions *.dbf, *.shp and *.shx. If you are missing any of these files, you will not be able to import your files successfully. 2. If you have transferred these files from one operating system to another, you must always use binary ftp transfer, or the files may be corrupted. We have found that you cannot rely on the automatic transfer with all ftp utilities. Some do not recognize the files as being binary and will transfer them as ASCII. EXPORTING ISSUES How do I strip all the attributes from a MAPublisher file? Simply drag your MAP Layers into the default MAP View entitled [Non-MAP layers], and all georeferencing and attribute information will be removed. Note that this function must only be used as a final step. What causes missing features when exporting MAPublisher layers? If you are using an pre-existing Adobe Illustrator file not created with MAPublisher you must correctly assign MAPublisher status to your layers and data. Only one feature type per layer is supported. The feature type icon next to your MAP Layer in the MAP Views panel is indicative of the features on that layer, and is the feature type which will be applied if the layer is exported. For example if you have Point symbols on a Line layer, they will not be recognized as being MAPublisher objects and will be dropped in the export process. Why is MAPublisher exporting the Area values as negatives? When exporting Area layers to GIS formats, polygon outlines must have a positive Area value, whereas holes held inside compound paths (or complex shapes) must have a negative Area value. If you have values for polygons in the #Area property column of your MAP Attribute table which contradict these guidelines, you can use the following tools to convert the MAPublisher area calculation from a negative to a positive value or vice versa: • Flip Lines tool (see chapter 8) for converting multiple areas. • Create a Selection Filter (see chapter 11) to select all elements that have an #Area of less than zero (to select negative values) or greater than zero (to select positive values). Then go to Filter > Flip Lines. • #AreaDirection property value (see chapter 5) for converting areas at a time. Select the area to edit and then choose the alternate value for #AreaDirection in the MAP Attributes panel. A1/18 Appendix 1: Technical Reference Guide Frequently Asked Questions LABELLING ISSUES I am having trouble with the MAP Tagger tool? Where am I going wrong? This can happen either when the layer or object to be labelled is not available for editing. Check to make sure that the desired layer is available for editing, the features in question are not locked, and you have a Text layer in your document to use to output the text to. In addition, if there is no fill to an area or polygon object the label tool (much like the Adobe Illustrator selection tool) can only find the paths defining the unfilled area. Therefore in such cases it cannot find the unfilled area and thus cannot label the unfilled area. PROJECTION ISSUES How do I know what coordinate system my files are in? In MAPublisher, the importers will automatically determine the coordinate system of the chosen files, if this information is included in the file header or is located in an associated file (e.g. *.prj). If MAPublisher returns a message of <No Coordinate System Specified> for the Projection, you should first ask your data provider to provide you with this information. Also there are a couple of strong hints that may indicate that a file is in lat/long. Both ArcView and MapInfo tend to store files in lat/long for rapid reprojection. This is why most files derived from such sources are stored in lat/long. A good test to see if a file is in lat/long is to look at the Map Anchor values in the MAP View Editor or in the MAP Location Tool. Typical Lat/Long values will be X between -180 and 180 and Y between -90 and 90. OTHER ISSUES How accurate is MAPublisher georeferencing? At this point in time we are restricted to 32 bit storage for numbers, which allows for seven digits of precision. The 32 bit storage restriction is controlled by the graphics environment software and not the MAPublisher software. We have asked for this storage restriction to be increased to 64 bit without success. We can and do all our internal calculations in 64 bit for accuracy, but the results still must be stored as 32 bit. MAPublisher values are roughly 4.3 billion times more precise than Adobe Illustrator. Adobe Illustrator is fundamentally an art program. The numbers used for its vertex data are more than sufficient to provide precision enough such that the human eye cannot tell the difference, even at its highest zoom level. Unfortunately, MAPublisher must translate its coordinates into Adobe Illustrator when placing them on the artboard. We do this using mathematical calculations based upon the parameters you provide (e.g. map and page anchors, scale, etc.). When MAPublisher does this, it is, in a sense, compressing its more-precise numbers into Adobe Illustrator less-precise numbers, and this is where the truncation may occur. An easier way to visualize this is to think of a pad of grid paper. If this paper was the artboard, Adobe Illustrator would only be able to place points where two grid lines meet, but MAPublisher could put points anywhere on the page. However, since Adobe Illustrator is ultimately where the information is plotted, when a MAPublisher point is plotted on the page it would get rounded to the nearest grid line intersection point. Appendix 1: Technical Reference Guide Frequently Asked Questions A1/19 I am receiving an “Error loading plug-ins” when I start Adobe Illustrator. What should I do? Search for and delete any copies of a file named Adobefnt05.lst. If that does not work, search for and delete any copies of a file whose name starts with Adobefnt and has a *.lst extension. The Adobefnt *.lst files are cached descriptions of the font environment. They can be rebuilt when needed so it is safe to delete them. Why do some art objects fail to display completely? Sometimes drawing with Adobe Illustrator shape creation tools results in the object not being displayed completely by Adobe Illustrator. The object’s geometry is complete because if you set the View to outline (View > Outline) as opposed to Preview you can see that the object is there in its entirety (you can also zoom in and out). However, once you restore the zoom level to the original extents at which the object was created, it will no longer appear as a complete shape. The solution to this is to disable the anti-aliasing option in the Adobe Illustrator preferences dialog box. Are there any sources for free GIS data? There are a multitude of web sites which offer free GIS data in several different forms. A list of several free download sites is indicated later in this appendix. What can cause attribute corruption? The most likely cause of attribute corruption (other than the files being corrupted before you got them) is that you have put layers with differing attribute structures into a single layer. As a rule of thumb you should use one layer for each external file that you are importing. Also, some Adobe Illustrator functions cause the link between artwork objects and their attributes table to be broken, and therefore attribute information gets lost. These functions are: • Compound path (Make). • Pathfinder. • Live Paint. • Blob brush (Adobe Illustrator CS4). If required, users should first duplicate their working layer in the Adobe Illustrator Layers panel before using these functions. What can I do when a filter does not appear to work? • Make sure that you have highlighted the desired Layer in the Layers panel and that it is unlocked and visible. • Make sure that what you have asked the filter to do makes sense. • Try closing Adobe Illustrator and deleting your Adobe Illustrator preferences file. A1/20 Appendix 1: Technical Reference Guide Frequently Asked Questions GIS Backgrounder WHAT IS GIS? A Geographic Information System (GIS) captures, stores, checks, analyzes, and displays georeferenced data about the Earth. A GIS uses a database management system (DBMS) to store and link data that relates to the same geographic area. This facilitates the following types of queries: • What if…? • What is it? • Where is it? • What spatial patterns exist? • What has changed since…? FEATURES OF A GIS Analytical Tool GIS systems are used by all levels of governments, academia and business for such diverse purposes as monitoring environmental changes, sales planning, census reporting, municipal zoning, land records, mineral resource management, and mapping telecommunications and cable television utilities. In short, a GIS serves many needs and can be thought of as an analytical tool since it can be used to determine spatial relationships between geographic areas. A GIS contains a database linking spatial data with geographic information and lets you associate information with map features and to create new relationships based on those associations. Areas An area is a closed, bounded object, which encompasses a homogeneous area (e.g., a park). Attributes Attributes store descriptive information and are stored as sets of characters (including numbers). Attributes are usually considered tabular data. Geographic Data Since a GIS is a digital map database storing both spatial (graphic) and descriptive (tabular) information, the integration of this information provides an opportunity for analysis and communication. Data is stored using the Cartesian system (X,Y coordinates) as follows: • Points are stored as a single X,Y location • Lines are stored as a series of ordered X,Y coordinates • Areas are stored as a string of X,Y coordinates defining the lines that bound the area. Labels, Symbols and Colour Map attributes can be represented by labels, symbols, and colour to make them easy to interpret (e.g. rivers may be represented with blue lines of varying widths depending upon their size). Appendix 1: Technical Reference Guide GIS Backgrounder A1/21 Layers Map features can be logically grouped into layers of related information. For example, a map could be layered by rivers, soils, mineral deposits, and municipality. This layering makes it easy to perform analysis that overlay geographic features and combine adjacent areas with similar characteristics. Lines A line represents the linear shape of a map element, which is too narrow to be an area (e.g., a contour line or road). Map Features A GIS stores two types of map information: spatial information (which describes the location and shape of geographic features) and descriptive information about those features. A GIS links these two types of data and maintains the spatial relationships between the map features. Features are portrayed on two-dimensional maps as points, lines, and areas. For example, a map may contain points representing location information (such as telephone poles), lines representing linear features (such as roads), and areas representing geographic features (such as lakes). Points Usually represented by a symbol or label, a point is a discrete location which is usually too small to be identified as an area or line (e.g. an oil wellhead or manhole). Spatial Relationships A map allows you to identify spatial relationships (e.g., a fire tower located inside a park) but it relies on you to derive this information from it. Topology Topology is a mathematical process for determining spatial relationships. It does this by expressing different spatial relationships as lists of features (i.e. an area is defined by the boundary lines). The primary advantage of this type of data storage is that it is more efficient and permits faster processing of larger data sets. A1/22 Appendix 1: Technical Reference Guide GIS Backgrounder Graphics Backgrounder WHY IS THE GRAPHICS ENVIRONMENT GOOD FOR MAPPING? Avenza supports the fact that performing map-related graphics tasks is best done in the right environment-a powerful graphics program like Adobe Illustrator. This environment offers practicality, freedom and easy maneuverability for fast, cost-efficient and professional graphic output results. The MAPublisher environment focuses on the map graphics first with the right GIS data management tools to facilitate the map production process in the easiest and most efficient way. This is in direct contrast to traditional GIS software that are designed and written, for the analysis of geographic data, with the graphic map production coming second, almost as an afterthought. This means that as powerful as most GIS are for analysis, they were never designed for cartographic or publication quality mapping. Cartographers have long been doing their mapping within graphics environments because they provide tools such as Bezier curves and true CMYK colour separation for publication quality mapping. FEATURES OF THE GRAPHIC ENVIRONMENT Accurate Colour Colours displayed on screen accurately reflect the colours as they will be printed. Proportional Symbology Symbology is accurately proportional to the map area you have zoomed into. Views You can display your document on–screen in a variety of ways using the View menu commands. For example, you can see a preview of the illustration as you edit, you can view only the outlines of your artwork, or you can preview selected parts of your artwork while displaying the rest as outlines. You can also create and save custom views of your document, retaining a particular magnification level, layering, and other viewing features for later retrieval. You can even display multiple views of a document at several different magnification levels simultaneously. Redrawing is Automatic Redrawing of the affected map objects is clean and automatic and impacts only the redrawn portion and possibly some immediately adjacent portions of the map. This eliminates the need to wait while the entire map is re-drawn or refreshed. This applies to text as well as to vector data. Broad Selection of Fonts A broad and flexible selection of text fonts, styles, sizes and enhancement features (e.g. Haloing) is available. Paste in Front or Behind When pasting map objects/elements, you have the option of deciding to paste the new object “in front” or “behind” the copied elements at the time of pasting. Postscript Pattern Fills You can use PostScript pattern fills and complex vector strokes. You can sample colours from images and apply them precisely to vector data. Appendix 1: Technical Reference Guide Graphics Backgrounder A1/23 Complex Colour Treatments Even with complex colours you can quickly and accurately create colour ramps with differing depths/intensity of 10%, 20%, etc. These can be set as individual colours on a panel or as a gradient across mapped features. Improved Symbology Improved symbology (e.g. road treatments and cartographic symbols) than is available in traditional GIS software. Speed Drawing You can easily turn on and off selected layers of a map to speed drawing. This can be done by turning off specified layers, and/or limiting the display of selected layers to simple vectors with all symbology removed. Not only will this speed the handling of the map, it lets you easily use underlying vectors for reference with no distraction or distortion caused by mapping symbology. Actual Size Viewing In addition to standard zooming and panning capabilities, you can view the details on a map at the actual size at which they will be plotted/printed. Rulers, Guides and Alignment Tools Rulers with adjustable guides and multi-combination alignment tools are available for use in aligning map objects. Grouping and Ungrouping There is grouping and ungrouping functionality. When items are grouped you still retain the option of separately accessing, querying and otherwise working with the individual components of a map group. Store Related Objects Individual but related map objects can be stored together by groups or by layers or both within the graphic file. This provides additional control and support in handling and organizing the map components. Text Placement The graphics environment offers a truly hands-on text placement environment and goes well beyond that of a GIS. For example text can be easily placed along any path or outside the map extents and is fully editable. A1/24 Appendix 1: Technical Reference Guide Graphics Backgrounder Memory Considerations RAM RECOMMENDATIONS Occasional User: 1 GB of RAM is recommended. A graphics or GIS user who uses MAPublisher with medium sized data sets with up to 20 layers, minimal text labels, and some low-resolution or small coverage raster images. Power User: 2 GB or more of RAM is recommended. A professional cartographer who uses MAPublisher daily and works with large urban data sets (including large transportation layers) with 20 or more layers, raster based air photographs, large numbers of text labels, complex fill patterns, etc. RAM USAGE HINTS Users often ask us why is so much RAM needed to operate MAPublisher. First of all, Adobe Illustrator requires a significant amount of RAM itself in order to run smoothly. Secondly, map data sets are often large which increases the need for RAM even further. Map data sets contain both vector and attribute data which must be stored in memory. Since we are adding a database to Adobe Illustrator this increases the file size, which increases the RAM requirements. MAPublisher builds a mini-GIS application inside Adobe Illustrator so that it can geo-code information and attach data to objects. This also has some overhead. GIS users also often ask why so much more memory is needed with MAPublisher than is with GIS software. The graphics environment software of Adobe Illustrator loads the entire file into memory rather than just reading it from disk, thus more RAM memory is required. When you are importing a large number of files into Adobe Illustrator using MAPublisher, you’ll notice that the amount of available memory will decrease rapidly and your computer loses speed. This is due to the memory management. MAPublisher reserves a fairly large amount of memory for each import-action, which is not properly returned when the import is done or even when it is cancelled. The solution is simple: save your file, close it and open it again. It’s not even necessary to close Adobe Illustrator itself. By closing the file, the reserved memory is properly returned. RAM SAVING TIPS Since a percentage of the memory is taken for attribute storage, drop any redundant or otherwise unnecessary attribute fields from the map attributes table. Many sources of street data include paths/vectors that are segmented based on street addressing information. You can use the MAPublisher Join Lines filter to join these into single linear features based on a selected attribute field. Reducing the number of objects (and data records) in the map file will free up memory. Many GIS data files are large and when a series of such files is imported, you may find that the import filter starts to run more slowly. This is because scratch and memory allocations are being used up. The best solution is to periodically save your work, quit out of Adobe Illustrator and then restart. This will free up the available scratch memory. Appendix 1: Technical Reference Guide Memory Considerations A1/25 The minimum number of undoes can be reduced (since they ALL reside in memory). Use polylined or pre-joined linear feature data sets where available. In your GIS application strip out the attributes you won’t be using for queries or labelling before importing the data into Adobe Illustrator. You can set a primary and secondary scratch disk under the Adobe Illustrator preferences option in order to draw additional storage from a partitioned or multi-drive environment. Turn off the layer preview icon that appears to the left of each layer name in the Adobe Illustrator layers panel. This can be done by clicking the options menu in the layers panel and then selecting small panel rows in the panel option dialog box. A1/26 Appendix 1: Technical Reference Guide Memory Considerations Online Links For Geographic Information System (GIS) users, the appeal of graphics is strong and the increasing ability to discover and share GIS across the Internet is fascinating. The Internet offers a large number of free-access GISrelated web sites from which you can access map and information data sets. For the general public, there’s general information about countries, states, and places; simple maps of areas (e.g., GIF, PS format); lists and maps of Internet resources in an area. For cartographers and geography researchers, there are cartographic/ GIS base map files (e.g., USGS Demos, DLGs, TIGER); thematic data of a geographic nature (e.g., census data); and complete GIS data sets (e.g., ESRI Interchange Files). As of the writing of this manual all the following links were active and functional. FREE MAP DATA The following are just some of the many sites on the Internet that offer free download of GIS data. Data is available from these and other Internet sites in a wide variety of formats. Please consult the sections in this manual on file formats (chapter 2 and MAPublisher Import Format section) to ensure that you obtain usable data. AUSLING data Australian national mapping agency offering digital map data, satellite imagery and elevation data. Data obtained here can be used for commercial purposes with permission. • http://www.ga.gov.au/ CAST data The Center for Advanced Spatial Technologies (CAST), University of Arkansas. Planned free access on the ARKNet statewide network. Among its high–tech offerings, CAST maintains a catalog of Arkansas, U.S. national and global data - e.g. GIS data in areas of archaeology, agriculture and population are downloadable as GIF files across the Internet. Obtain a map of historical land coverage data. Obtain data sets including Environment, Prehistoric and Historic Climate Reconstruction, Historic Census, and Tabular databases. • http://libinfo.uark.edu/gis/us.asp Directions Magazine Data Center Directions magazine is an internet-centred publication that provides news, analysis, commentary product information and free map data. • http://www.directionsmag.com/files EROS Data Center The Eros Data Center will be providing FTP access to a variety of USGS digital data sets. • http://edcwww.cr.usgs.gov Geocommunity and GIS Data Depot The GeoCommunity and GIS Data Depot are an excellent sources of free GIS data, geographic software (including data viewers, translators and compression utilities) and industry news. This site also has several GIS-related discussion forums. The data found on this site covers most areas of the world. • http://www.geocomm.com Appendix 1: Technical Reference Guide Online Links A1/27 Geoconnections/Geoconnexions This site from Canada Ministry of Natural Resources offers many links to GIS data and other informational resources. • http://www.cgdi.gc.ca Geography Network The Geography Network is an online resource for finding and sharing world-wide geographic content, including maps and data from many of the world’s leading providers. • http://www.geographynetwork.com Geogratis Geogratis is a Natural Resources Canada site offering maps, satellite imagery and tabular data. • http://geogratis.cgdi.gc.ca GISuser GISuser.com was launched in February, 2004. Their goal is to provide the geospatial technology user with the latest news, resources, and tools affecting the GIS industry. • http://www.gisuser.com National Atlas of the United States This site is a great source of a wide variety of data files for the United States. • http://www.nationalatlas.gov/atlasftp.html NOAA ENC Download NOAA distributes its Electronic Navigational Charts in S57 format, free of charge, on this site. http://www.nauticalcharts.noaa.gov/mcd/enc/download_agreement.htm Doug Price’s list of Free Digital GIS Data This site based at the Tennessee Geographic Information Council and the University of Tennessee offers an extensive list of data download links from around the world. • http://www.lib.utk.edu/~tngic/price.html Robert E. Kennedy Library @ California Polytechnic State University California Polytechnic State University has various links to US-based map inventories. • http://lib.calpoly.edu/collections/gis/webresources.html United State Geological Survey Department of the Interior – USGS home page. This is the primary source for Digital Line Graph (DLG) files. A must– have resource is the US Geological Survey Digital Format Standards manual published by the USGS. • http://www.usgs.gov - USGS Home page. • http://www.usgs.gov/ngpo/ - National Geospatial Program. • http://www.usgs.gov/pubprod/index.html - Products and Publications Listings. A1/28 Appendix 1: Technical Reference Guide Online Links • http://greenwood.cr.usgs.gov - The USGS Greenwood map server. United States Fish and Wildlife Service The FWS carries a variety of map data in the USGS DLG format. • http://www.fws.gov USACE IENC download The US Army Corps of Engineer distributes inland ENC files in S-57 format. They can be freely downloaded on the web site http://www.tec.army.mil/echarts/inlandnav/main.html#download OTHER VALUABLE MAPPING LINKS The following are some additional places on the Internet where you can find news, reviews, tips and general GIS, cartographic and geographic information. GIS Cafe: • http://www.giscafe.com GIS Dictionary • http://www.geo.ed.ac.uk/agidict/welcome.html GIS Lounge • http://www.gislounge.com GIS@Development • http://www.gisdevelopment.net University of Edinburgh • http://www.geo.ed.ac.uk/home/gishome.html University of Florida - Geoplan Center • http://www.geoplan.ufl.edu US Census Bureau • http://www.census.gov Appendix 1: Technical Reference Guide Online Links A1/29 Technical Support Options MAPublisher support is provided free of charge to customers with a current MAPublisher Maintenance Program (MMP) subscription. All new license and upgrade purchases include a one year MMP subscription. Customers without a current MMP subscription may obtain support from a qualified MAPublisher technical specialist at the rate of US$49 per incident. TECHNICAL SUPPORT Please consult the FAQs, the additional how-to’s on the following pages as well as the following online options before contacting Avenza technical support as your situation may be easily addressed by one of the answers contained therein. MAPublisher User Forum The MAPublisher User Forum is located at http://www.avenza.com/forum. Answers to common technical questions may be found in the Common Support Issues and FAQs category. All users with a MAPublisher license (evaluation or permanent) can post and read topics under the General Questions for Evaluation and Licensed Users category. Additionally, users with maintenance have access to the Maintenance Users category. There, users can find additional information relative to software updates, etc. Internet Mailing Lists There are two very popular Internet mailing lists that are populated by experienced MAPublisher users worldwide and offer an open forum for discussing problems, solutions, tips and other general issues relating to MAPublisher and cartography. These lists are also monitored by Avenza technical support staff who often participate with a solution or useful discussion item. • mp-mapublisher-l - This is the main MAPublisher list. Subscribe by sending an email to majordomo@avenza. com with the statement subscribe mapublisher-l <emailaddress> in the body of the message. Substitute your actual email address for <emailaddress>. • map-mac - This is a very popular mapping list to which many MAPublisher users belong. It is not limited to mac-related discussions. Subscribe by sending an email to [email protected] with the statement subscribe map-mac <emailaddress> in the body of the message. Substitute your actual email address for <emailaddress> Contacting Avenza Technical Support Avenza offers a number of methods for direct communication with our qualified and experienced technical experts. Please have your MAPublisher registration details handy to get prompt attention and include it in any email correspondence. Support issues are handled on a first come, first-served basis. Avenza does not guarantee a response within any specified time. MAPublisher Maintenance Program subscribers receive free and unlimited support. All others are eligible for support at the rate of US$49 per incident. • email: [email protected] • online form: http://www.avenza.com/support/form • phone: +1.416.487.6442 A1/30 Appendix 1: Technical Reference Guide Technical Support Options MAPUBLISHER MAINTENANCE PROGRAM (MMP) The MAPublisher Maintenance Program is a subscription-based service plan that guarantees its members: • unlimited priority technical support - guaranteed same business day (9-4 EST) or next business day response • unlimited telephone support (+1-416-487-6442) • free MAPublisher updates • free MAPublisher version upgrades • additional discounts and offers available to MMP members only Your MAPublisher purchase includes a one-year membership in the MAPublisher Maintenance Program so you are well on the way to worry-free use of MAPublisher for the first year and will be able to enjoy all the benefits of the MMP immediately. All MAPublisher Maintenance Program subscriptions begin on the date of purchase and run for one calendar year. Your email address has been automatically entered in the mp-maintenance-l online email list for MMP subscribers so that you are assured of receiving all the latest MMP news and access to all the update and upgrade files. If you purchased your MAPublisher license from a reseller or are the end user but not the person who purchased the software, please contact us at [email protected] to ensure that we receive your email address and add you to the MMP notification group. Renewal Approximately 6-8 weeks prior to the expiration of your annual MMP subscription you will be notified regarding renewal options. You will be contacted a minimum of five times prior to expiration in order to ensure that you have ample opportunity to renew or not at your discretion. You will have the option of renewing your MMP for an additional year at the then prevailing price or canceling without penalty. Of course, if you cancel or let your MMP lapse you will no longer be entitled to the benefits of the program as outlined above and will thus have to purchase future upgrades at the upgrade price. There is a grace period of approximately 30 days from the time of the MMP expiry during which you may still renew without penalty. All post-expiration renewals will be backdated to the actual expiry date. Lapsed Subscriptions Failure to renew your MMP within 30 days from the expiry date will result in a lapsed MMP subscription. Lapsed subscriptions may not be renewed and the licensee will be required to purchase support and upgrades accordingly. Please direct all MMP questions and purchase inquiries to [email protected]. WISHLIST As either a new or experienced MAPublisher user we value your opinions on how we can improve our product. Please let us know what functions you would like to see incorporated into future upgrades of MAPublisher. • email us at [email protected] Appendix 1: Technical Reference Guide Technical Support Options A1/31 General Tips and Hints CREATING ASCII DELIMITED POINT FILES There may be times when you wish to add a point or a series of points to your map but you do not have a GIS or ASCII file containing these points ready for import. Provided you have the real-world coordinates for the locations you wish to plot *, you can manually create a delimited ASCII file using a text editor (ex. Notepad, BBEdit, SimpleText, Ultra Edit etc.) or a spreadsheet program (ex. Excel, Lotus 123 etc.). This file can then be imported using either Simple or Advanced Import using the ASCII Point Data import format. One column in the file must contain the X coordinates of the points and another must contain the Y coordinates. You can add as many additional columns as you wish containing additional information to be imported as attribute data. If you are using a text editor, you can simply type in your data in the following format: “Column 1 Header”,”Column 2 Header”,”Column 3 Header”...etc “Column 1 Value 1”,”Column 2 Value 1”,”Column 3 Value 1”...etc “Column 1 Value 2”,”Column 2 Value 2”,”Column 3 Value 2”...etc Note that negative values for the X and Y coordinates denote west longitudes and south latitudes, respectively. Also make sure to enter a carriage return using the enter key on your keyboard after the last line of data otherwise the last line may be ignored by the MAPublisher Point Importer. If you are using a spreadsheet application you can enter your point information as a table and save the file in a text format, preferably .csv or .txt, choosing either comma or tab delimiting. The spreadsheet application will format the text automatically. The screenshot below illustrates an example of such a table in Microsoft Excel prior to exporting as a .csv or .txt for import into Adobe Illustrator using MAPublisher. * The MAP Location Tool can be used to generate the X and Y coordinate values suitable for building ASCII Point Files. See chapter 4 for more information. A1/32 Appendix 1: Technical Reference Guide General Tips and Hints JOINING SDTS TABLES The following information should be used in conjunction with the MAPublisher Join a Table function. When working with United States Geological Survey SDTS files it is necessary to join tables frequently in order to obtain the map attribute table you require to make the map you want. This is due to the fact that SDTS data is constructed such that the primary vector data is held separately from the various attribute tables that one might want to use for a particular mapping purpose. The attribute table that comes as part of the vector file usually contains a unique identifier (RCID) for each map element that is used to join it with the other data tables. For example, a particular vector file containing the geography of rivers would contain a data column called RCID. Various data tables containing information such as vegetation, fish counts or flow rates might be available each also with an RCID column. The desired tables are then joined to the initial map attribute table by RCID value using the techniques described in the previous pages. To find the SDTS tables to join with the vector map file look for the files which have names that start with the same character string as the name of the vector file. MAPublisher imports SDTS files that have the characters “CATD” at the end of the file name. A typical table to import and join with this file might be called HY01CATD.ddf. Use the MAPublisher table importer with SDTS file type chosen to import these files. When you join layer and table, you do the join based on the column from the layer matched to the RCID column of the table. Several SDTS sample files can be found on your MAPublisher CD in the SDTS_samples folder. Note that the CATD catalog file found amongst the SDTS files explains what each table is. ROTATING OBJECTS INDIVIDUALLY IN ADOBE ILLUSTRATOR On some occasions you may wish to rotate selected objects about their own centres rather than as a group about a common origin. This can be accomplished using the native Adobe Illustrator Transform Each function. To use this function, first select the objects you wish to rotate. Then go to Object > Transform > Transform Each. In the Rotate box enter a desired rotation value and click OK. Each of the selected objects will be rotated individually about their own centres. You may also use the #Rotation property column to individually rotate point symbols or text items based on a specified value. See chapter 5 for guidelines on how to use this function. GEOREFERENCING AN ADOBE ILLUSTRATOR FILE If you are using an existing Adobe Illustrator file that was created without the use of MAPublisher and as such does not contain any geographic parameters or attribute data, the following steps will enable you to georeference your Adobe Illustrator file and ultimately create an attribute-rich and accurate scale and world grid structure for your map. Please note that the steps that follow refer to functions that are outlined in more detail in the body of this user guide. Please familiarize yourself with the main MAPublisher functions and in particular those under the MAP Views section (see chapter 4) before proceeding. Before beginning to georeference an Adobe Illustrator file you must be in possession of the following information: 1. The real-world scale of your data 2. Details of the coordinate system the data is in (i.e. Projection, Datum etc) 3. The X-Y coordinates of one tie-in point in the coordinate system of your data When you have this information please use the following guidelines in order to georeferencing data with MAPublisher in Adobe Illustrator. Appendix 1: Technical Reference Guide General Tips and Hints A1/33 1. Go to View > Show Rulers. Set the 0,0 point to the lower left hand corner of the page by double-clicking the cross hairs in the upper right corner. 2. If you have a completed Adobe Illustrator vector file go to step 3. Otherwise, place and digitize your raster image. Identify a registration or tie-in point in your document. This should be a specific location in your document for which a real-world coordinate location is known or can be easily determined. Record the location of this point in real world coordinates on a piece of paper. 3. Locate the same tie-in point on the Adobe Illustrator document page and determine its X,Y coordinates in page units. Record this number as well using Window > Info. 4. You should now have the location of your tie-in point in both map and page units (e.g. –79.5, 43.5 in Lat/Long is located at 4cm, 2cm in the document). 5. Open the MAP Views panel, navigate to the Options section and select New MAP View. 6. Enter a name for the MAP View. Set the Scale to the proper scale of the map (i.e. a set distance in document units divided by a set distance in ground units). 7. Click the Specify button. Choose a projection which matches that of your vector data and click OK. 8. Click OK in the MAP View Editor to apply the information to the new MAP View. 9. In the MAP Views panel, navigate to the Options pullout, and then click Specify Anchors. 10. Set the Map Anchors to the value of the tie-in location in map units using the values determined in step 3 (e.g. –79.5, 43.5). 11. Set the Page Anchors to the value of the tie-in location in Page Units using the values determined in step 4 (e.g. 4, 2). Then click OK. 12. If you have not previously done so, ensure that each layer in your Adobe Illustrator file contains only one feature type (Point, Area, Line, Text, Legend). 13. In the MAP Views panel drag each of the layers which contain your data in to your new MAP View, ensuring that you set the appropriate Feature Type in the Define Layer dialog box. 14. Repeat steps 1-13 for any other coordinate systems which exist in your document (such as inset maps for example). 15. Your document is now a georeferenced MAPublisher file wherein each feature is also georeferenced and capable of accepting attributes using the MAP Attributes function (see chapter 5). You can also use the MAPublisher Export function to create a GIS file from this newly georeferenced Adobe Illustrator map. TIPS ON EXPORTING TO OTHER GIS SOFTWARE WITH MAPUBLISHER These strategies do not focus on how to do the procedures, as these are discussed in the Export section (page 63), but more on what you need to know and understand for successful export results. First and most importantly you need to understand that the MAPublisher export was designed to export MP imported or created data one layer and one feature at a time. Why is it important to know this? MAPublisher only recognizes objects that have been imported by or created with its filters. If a layer was not imported with MAPublisher or is not hosted by a designated MAP View, then MAPublisher will not allow you to export the layer. If you have an entire layer that was not created by MAPublisher then: 1. Ensure that your layer contains only a single feature type (Point, Area, Line or Text). 2. In the MAP Views panel, check that you have a designated MAP View with a matching coordinate system. If you do not, create a new MAP Views. 3. Select the layer in the MAP Views panel. 4. Drag the layer to the MAP View containing the matching coordinate system to georeference the layer. A1/34 Appendix 1: Technical Reference Guide General Tips and Hints There are also a couple of additional considerations to be aware of when exporting: Since the current exported vector formats are GIS formats that do not support the concept of Bezier curves you need to compensate for this. If you have Bezier curves in your Adobe Illustrator file they will not be recognized in the GIS software. In order for these features may be represented correctly you will need to add points to these lines in Adobe Illustrator first. Simply identify and select any objects that use Bezier curves and then select Object > Path > Add Anchor Points. Repeat this command until the line has a sufficient number of anchor points that the shape of your curves will not be lost on export. Adobe Illustrator stores the origin of text that has been applied along paths differently from other text objects. We have found the following steps to be the most successful way to get such Text exported to GIS files: 1. Create a new Adobe Illustrator layer 2. Select any text that has been created along paths. 3. Drag this text to the new Adobe Illustrator layer 4. Select Type > Create Outlines. The text will be converted to vector objects. 5. In the MAP Views panel, drag this layer back into your MAP View, specifying Area as the feature type You can now export your Text as Area objects. Since the text is no longer text, you can no longer modify the fonts. We recommend that you make a copy of the original text objects before you do this process. These hints on how to transfer Adobe Illustrator files are necessary because the graphics environment handles text and curves differently and they need some modification in order for the GIS software to represent these accurately. DOUGLAS-PEUCKER LINE SIMPLIFICATION The Douglas-Peucker algorithm was primarily designed to reduce the number of points required to represent a vector line. A common problem in digital cartography and geographic information systems can occur when lines are generated automatically from a mathematical function, which records points at a fixed interval regardless if they are all lying along a straight line. A reduction of the number of points makes for a cleaner and more readable cartographic line. As well in cartographic work within Adobe Illustrator the removal of points along a path can significantly improve the speed of file redraws and reduce the overall file size. The Douglas-Peucker Algorithm was created in Fortran 66 by David H. Douglas and Thomas K. Peucker at the University of Ottawa in 1970-71. It was extensively tested in 1972 and was publicly communicated in the following article: Algorithms for the Reduction of the Number of Points Required to Represent a Digitized Line or Its Caricature, Canadian Cartographer, Vol. 10, No. 2, December 1973. BEZIER CURVES AND OTHER MAPUBLISHER OPERATIONS Bezier curves are defined using four control points. Two of these are the end points of the curve, while the other two effectively define the gradient at the end points. These two points control the shape of the curve. The curve is actually a blend of the control points. This is a recurring theme of approximation curves; defining a curve as a blend of the values of several control points. Most GIS formats do not usually support Bezier curves used in graphics packages such as Adobe Illustrator. As such you will typically find that curved sections of GIS data will be composed of a series of small line segments rather than an actual curve. This is also how such features will first appear in Adobe Illustrator when imported with MAPublisher. The Adobe Illustrator Object > Path > Simplify filter can be used to convert this type of feature into a Bezier curve (see chapter 8). Appendix 1: Technical Reference Guide General Tips and Hints A1/35 If Bezier curves are exported from Adobe Illustrator using any of the MAPublisher Export filters they will be converted to link and node topology (i.e. the end points of the curve will simply be joined as straight lines). It is therefore necessary to create additional points to curves to retain their true shape. This can be done globally by using the Adobe Illustrator Add Anchor Points function via Object > Path > Add Anchor Points. This version of MAPublisher supports Bezier curve features during the following operations: • Scale and Projection transformations via the MAP View Editor • Area and length calculations CREATING SYMBOLS FOR USE IN POINT STYLESHEETS A MAPublisher Symbol Library and a National Parks Symbol Library are supplied in the Helpful Styles & Symbols folder on the MAPublisher CD. You may also find that a search on the internet may be useful for finding additional libraries. If you are required to create new symbols, the steps below will help you to quickly create symbols manually in Adobe Illustrator. 6. Use Adobe Illustrator Tools for the manual creation of artwork that will comprise the new symbol. If you wish to use a character that are contained in a font library, select the text character instance and click the menu Type > Create Outlines to convert the text to vector art. 7. Open the Adobe Illustrator Symbols panel (Window > Symbols). 8. Select the artwork that will comprise the new symbol and drag it into the Adobe Illustrator Symbols panel double-click the symbol in this panel to assign a name. 9. When MAP Stylesheet Editor is accessed for Point Stylesheets, this symbol will be available in the Style column. CREATING A STYLESHEET TEMPLATE You can create template files with legends to automate the production of a series of similar maps. 1. The procedure when using MAP Stylesheets is as follows: 2. Create a prototype map using the MAPublisher Stylesheet function to create the desired “look”. 3. Make a copy of your prototype map file. Delete all the layers from the file so that only the designated stylesheets exist 4. Save it to a new template file. 5. Use this template file as a base for future maps as follows: a) Make a copy of the template file. b) Import all map layers into the template file and do any needed processing. c) In the MAP Stylesheets panel, drag your MAP Layers into the desired MAP Stylesheets. d) Your new layers will be symbolized by the previously defined Stylesheet. CREATING A MULTI-CONDITION IF EXPRESSION In Edit Expression it is possible to assign symbology to map objects by assigning an expression to the #Style column. In the following example this is achieved by creating a multi-condition IF statement. In the following example, a point layer represents cities. Each point has the value “Y”, “N” or “C” in the CAPITAL attribute column, describing whether the city is a state capital (Y), is not a state capital (N) or is a country capital (C). A1/36 Appendix 1: Technical Reference Guide General Tips and Hints There are three point symbols to assign to the type of point. In this example the following expression can be assigned to the #Style column of the point layer. IF(CAPITAL = “Y”, “MAP Symbol 01”, IF(CAPITAL = “C”, “MAP Symbol 02”, “MAP Symbol 03”)) Therefore: If the capital is “Y”, assign the symbol “MAP Symbol 01”. If the capital is “C” assign the symbol “MAP Symbol 02”. All other symbols assign “MAP Symbol 03”. NOTES FOR EXPORTING IMAGES If the document colour mode is CMYK, exporting an embedded image may result in increased file size compared to RGB mode. If the image is LINKED consider the following: 1. The image will be exported in the original colour mode of the image irrespective of the current colour mode of the document (i.e. a linked grayscale image in a CMYK document will be exported as a grayscale image, whereas a linked RGB image in an CMYK document will be exported as a RGB image). 2. A linked image with Alpha channels may be exported in a different colour model. For example a grayscale with two alphas will export as an RGB or an RGB with an alpha channel will export as CMYK. 3. Linked images in CMYK mode (regardless of the color mode of the document) will export with an incorrect result and should therefore be avoided (see chapter 12). If the image is EMBEDDED consider the following: 1. The image will be exported in the colour mode of document (i.e. an embedded grayscale image in a CMYK document will be exported as a CMYK image, whereas an embedded CMYK image in an RGB document will be exported as an RGB image). 2. Embedded grayscales do NOT pick up the document colour model (i.e. an embedded grayscale image will be exported as grayscale). 3. The export of embedded Bitmap images is not supported. KEYBOARD SHORTCUTS This version of MAPublisher supports the use of keyboard shortcuts in order to increase the efficiency of the user and to make it easier to access commonly used dialog boxes and menus. By default the Simple and Advanced Import dialog boxes can be accessed by pressing Shift+Ctrl+I and Alt+Shift+Ctrl+A, respectively. All other MAPublisher tools can have keyboard shortcuts manually set by accessing the Adobe Illustrator Keyboard Shortcut dialog box which is located under Edit > Keyboard Shortcuts. Appendix 1: Technical Reference Guide General Tips and Hints A1/37 Appendix 2: Coordinate Systems Overview In the MAPublisher application, the coordinate system option must be entered at two levels: coordinate system of the source data (when importing GIS data) and coordinate system of the final map. SOURCE DATA COORDINATE SYSTEM The Source coordinate system is usually detected when the coordinate system information is available with the GIS data being imported and when supported in the native GIS format (such as Shapefile , e00). However, in some cases, this information is not imported because it is not supported in the original GIS format (e.g. DWG, DXF...) or when using a non-referenced Adobe Illustrator files. In that case, the coordinate system must be specified by the user. It generally can be found from an attached metadata document, by contacting the data provider or in textual information on the original data itself (e.g. title of a scanned map). In all cases, the source coordinate system must be known with certainty. Then only can the proper parameter be specified in the MAPublisher interface. A wrongly specified source coordinate system would make the map data unusable for transformations and merging with other datasets. FINAL MAP COORDINATE SYSTEM Most of cartographic projects are restricted in the choice of coordinate system for the final map. This parameter is usually part of the project requirement. It is the task of the professional cartographer to analyze carefully the situation to make the wise decision. For general purpose mapping projects (interpretive or marketing maps for example), a more approximative selection of the coordinate systems might be acceptable. Following the request from some of our users, who may not have a cartographic expertise, here are a list of simple considerations to take into account before making a choice: • Use of a Geodetic Coordinate system (angular coordinates, Lat/Long): • Appropriate for overlay with GPS data recorded in Lat/Long format. • WGS84 system is required to export vector data to KML format (for display in Google Earth, Google Maps). • Use of a Projected coordinate system: • Appropriate for printed map (so that users can use a ruler to measure distances on the map). • Required to add a scale bar. • Use of a particular system (within the list of projected and geodetic systems): • Maps that are part of a portfolio or Atlas have to comply to the same system to be consistent. • When a geo-referenced image (geotiff or world tiff ) is to be used together with the data, it is easier to use the same coordinate system for the vector data as of the raster. • Most countries or geographic areas have published standards or usual way for representing the land (e.g. for road maps or meteorological maps). In this case, the user should make some test with the systems listed in MAPublisher. For a convenient use, geodetic systems are sorted by continent>country>sub-division (state or county for example). Appendix 2: Coordinate Systems Overview A2/1 In doubt, it is recommended to test different coordinate systems and visualize the results. For more information on the supported coordinate systems and projections in MAPublisher, please refer to the MAPublisher Projections Guide pdf document installed with MAPublisher. Examples of appearance of the USA depending of the chosen coordinate system Geodetic > World > WGS84 (unprojected) Projected > World > Robinson Projected > North America > United States > US National Atlas A2/2 Appendix 2: Coordinate Systems Overview The Geodetic Datasource MAPublisher includes an extensive geodetic parameter database called the Geodetic Datasource. It contains all the latest updates from the widely used EPSG Geodetic Parameter Dataset maintained by the Geodesy Subcommittee of OGP (International Association of Oil and Gas producers)—EPSG v6.18— as well as custom systems maintained by Avenza. In addition, the MAPublisher Geodetic Datasource supports user's custom definitions and allows for importing external WKT (Well-Know Text) and PRJ (ESRI projection file) parameter files. Over 3500 pre-defined coordinates systems are readily available for use in most cartographic projects. Even though the current list of systems is comprehensive, there may be instances where the end users may wish to add a brand new coordinate system to meet their particular needs, or perhaps to duplicate and modify an existing definition to change the units for example. A complementary Projections Guide is installed with MAPublisher. It describes all the projections and datum shifts methods supported by MAPublisher, to assist users in the process of creating or editing a coordinate system. The default parameters installed with MAPublisher are stored within read-only XML database files referred to as the Geodetic Datasource (files named geodata.xml and avenza.xsp). The base datasource files shipped with MAPublisher are installed in the Data Source Files folder at the following location: Windows XP: C:\Program Files\Avenza\MAPublisher 8\Data Source Files Windows Vista: C:\Program Files\Avenza\MAPublisher 8\Data Source Files Mac OS X: Applications/Avenza/MAPublisher 8/MAPublisher Plug-In/Data Source Files Custom definitions and parameters are saved or loaded from separate XML files that must always accompanied with a file named geocalc.xsd (when not present, this file can be copied from the Data Source Files folder) NOTE: When MAPublisher is un-installed or a newer release is installed, an option will be given to backup the custom coordinates systems. The backup files can be found Windows XP: C:\Documents and Settings\All Users\Application Data\Avenza\MAPublisher 8 Windows Vista: C:\ProgramData\Avenza\MAPublisher 8 Mac OS X: Applications/Avenza/MAPublisher 8/file_backups/mm_dd_yy (date of the udpate) LOADING A GEODETIC DATASOURCE A geodetic datasource or coordinate system database can be loaded into MAPublisher, thus greatly extending the coordinate systems available for use. You can load a geodetic database within MAPublisher by choosing Load Geodetic Datasource… from the MAP Views panel options menu. The directory containing the xml file must also contain the file geocalc.xsd. This file can be found in the directory of the default geodata.xml file (see above). So the custom xml file can either be copied to the Data Source File directory prior to loading, or geocalc.xsd should be copied from there to the custom xml directory. Any additional change will be saved into the loaded xml file. Appendix 2: Coordinate Systems The Geodetic Datasource A2/3 Selecting a geodetic datasource to load NOTE: Coordinate systems may also be extracted from the input data formats (during import process). GEODETIC DATASOURCE EDITOR MAPublisher includes an extensive geodetic parameter database. The contents of the Geodetic Datasource can be browsed or searched by using a search frame. Users can extend MAPublisher Geodetic Datasource to support an unlimited number of custom linear and angular units, ellipsoids, datums, datum shifts, and coordinate systems. MAPublisher Geodetic Datasource Editor is accessed from the MAP Views panel options menu Edit Geodetic Datasource file. Coordinate systems may also be edited/created from the Specify Destination Coordinate System dialog box (started from Specify button in MAP Views panel and import dialog boxes), but the other geodetic objects are only accessible through Edit Geodetic Datasource. Individual entries in the Geodetic Datasource are known as Objects. There are different types of objects for different types of definition. Objects contained in the Geodetic Datasource are: A2/4 • Angular Units - Type of units for measuring rotation (e.g. degrees or radians) • Coordinate Points (Point Style)- A coordinate point is used to define the orientation of axes used and the type of units used in the system. • Coordinate Systems (Coordinate Reference Systems) - A coordinate system is a complete definition needed to express the context of a set of map data. • Datum Shifts - Parameters to transform coordinates from one Datum to another. • Ellipsoids - An Ellipsoid gives a horizontal datum its size and shape. An ellipsoid does not have an origin and cannot be used as a base model for coordinates on its own. • Envelopes - Defines a geographic area of use for a particular object. • Horizontal Datums - A horizontal datum, more commonly referred to as just datum is the base model maps are built on. All coordinate systems must have a datum associated with them to be related to any other map. Without a known datum, coordinates are meaningless. • Linear Units - Units for measuring straight line, cartesian distances. • Prime Meridians - The prime meridian represents the line of longitude that is designated as 0 degrees. All other lines of longitude are expressed by the angle by which they deviate from the prime meridian. Together with the equator of an ellipsoid, the prime meridian defines the origin of a geodetic coordinate system. A prime meridian is defined by the angle that separates it from the Greenwich meridian. Appendix 2: Coordinate Systems The Geodetic Datasource Users have the possibility to define new coordinate systems, make copy and modify existing objects. The custom objects are stored in a separate xml file saved by the user. Users can also re-organize the Geodetic Datasource (default and custom parameters) into categories and sub-folders. These changes are saved to a view file (.xvw). The view file may be deleted to reset the Geodetic Datasource Editor to its default state. Datasource - File containing the default geodetic parameter (geodata.xml). Custom Data - File containing the custom geodetic parameter. File loaded or saved by the user. Geodetic Objects - See list above. Add/Remove - Add and remove folders and categories. Search - Search parameters. Each category can be searched by it’s unique parameters (e.g. Name, EPSG Code) Save / Save As - Save changes to a custom file (data to xml and view to xvw). Lock Icon - Indicates readonly parameters (default ones). Warning Icon - Indicates incomplete parameters. Edits - Add, remove, edit, information or copy objects. At the top of the Edit Geodetic Datasource dialog box two paths will be listed, the path to the main Geodetic Datasource file which is protected from user modification, and the Custom parameter file, where all of the user-defined definitions are stored. On the left hand side of the dialog box, objects are organized into object type categories with sub-folders organized in a tree. To explore the sub-folders of a category, click the plus sign (Windows) or arrow (Mac OS) to the left to see categories listed underneath. Click a sub-folder name to list the contained objects on the pane to the right. New folders or sub-folder can be created by clicking the New Folder button . The default name is New Folder, right click and click Rename to type in another name. Only empty user-defined folders can be deleted using the Delete Folder button . Recently used objects are listed under the *Recent* sub-folder of each object category. To clear this list, right click on the *Recent* folder name and choose Clear Recent Object History. The *Search Results* sub-folder contains the recent search results. To run a query, use the Search frame, enter a text string and specify a category specific parameter to search from (e.g. Name, EPSG Code) in the In drop-down list. To find the containing sub-folder of an object found by a search query, right-click the object and click the menu Open Containing Folder. To clear this list, right click on the *Search Result* folder name and choose Clear Search History. Appendix 2: Coordinate Systems The Geodetic Datasource A2/5 The right hand pane lists the objects contained in the sub-folder selected in the Folder list on the left. For all objects, users can copy, query, or use drag and drop to move or create a short-cut. Only custom objects (written in blue) can be edited or deleted—default objects installed with MAPublisher in black and indicated with a lock icon are read-only. Incomplete objects are indicated in red with an exclamation mark (warning icon). Particularly, some of the default datum shifts are pointing to external grid files (.gsb) that are missing. These files cannot be distributed by Avenza due to copyright or government regulations and have be acquired separately. To find the required file, refer to the value column in the Definition tab of the Datum Shift Viewer. For example, the file nb7783v2.gsb from the datum shift "NAD83 (CSRS) (1) Canada - New Brunswick" is provided by Natural Resources Canada can provide the grid NTv2 (http://www.geod.nrcan.gc.ca/tools-outils/ntv2_e.php). Like other databases the columns are re-sizable, and when column headings are clicked will sort information alphabetically/numerically. When using the Save button, changes are saved in the custom parameter file (and when no custom file has previously been loaded, to customsystems.xml, located in the following directory): Windows XP: C:\Documents and Settings\All Users\Application Data\Avenza\MAPublisher 8 Windows Vista: C:\ProgramData\Avenza\MAPublisher 8 Mac OS Applications/Avenza/MAPublisher 8/MAPublisher Plug-In/Data Source Files And the default xvw file saved is customview.xvw, located in the following directory: Windows XP: C:\Documents and Settings\All Users\Application Data\Avenza\MAPublisher 8 Windows Vista: C:\ProgramData\Avenza\MAPublisher 8 Mac OS X: Applications/Avenza/MAPublisher 8/MAPublisher Plug-In/ The Save As button saves a copy of all the systems (default and custom). This creates xml and xvw files as well as a copy of geocalc.xsd, saved in a directory chosen by the user. These files can then be exchanged between computers. Custom xml and xvw files are loaded into MAPublisher through the MAP Views panel options menu Load Geodetic Datasource. NOTE: Please ensure that where the custom xml is saved there is a copy of the geocalc.xsd in the same folder, as this will be needed to load the file (geocalc.xsd is located in the Data Source Files folder). A2/6 Appendix 2: Coordinate Systems The Geodetic Datasource WORKING WITH GEODETIC DATASOURCE OBJECTS Creating or editing objects will prompt the object's editor dialog box, each editor contains two tabs: Identification and Definition tabs. The Identification tab of the editor is used to name the object and associate identifying codes with it (if applicable). The Name text box contains the definition name to be used to select the object in the main list. The Remarks text box is used to add notes and is optional. In the Identifiers list, identifying codes may be added for the object (e.g. reference to other databases). The GC code is a unique identifier assigned by MAPublisher and must not be altered. To enter additional codes use the spaces below. This tab is identical for all object types. Geodetic Datasource object Identification tab The Definition tab is used to define the object's parameters. Parameters are specific to each object type. Specific definition tabs per object are described here after. Angular Units For angular units, the new unit must be defined as a division of the scientific standard Degrees. The abbreviation is used to identify the unit within the application interface (Example: The abbreviation for Degrees is “deg”). Angular Units Editor - Definition Appendix 2: Coordinate Systems The Geodetic Datasource A2/7 Coordinate Points For Coordinate Points you must specify the coordinate point dimensions in either 2D or 3D. For Geodetic and Projected Coordinate Points, the Longitude and Latitude style of units must be entered for all 2D. Dimensional Points. The Longitude, Latitude and Ellipsoid Height style of units must be entered for 3D Dimensional Points. Geodetic Point Style Editor Projected Point Style Editor Datum Shifts For Datum Shifts, you must select an Envelope (appropriate geographic area of use). If you are unsure of a more specific envelope, leave it se to the default World Envelope. The Source and Target text boxes are used to specify the two geodetic models the Transformation is valid for. The Method specifies the necessary parameters to define a particular datum transformation. With the proper method selected, enter the appropriate parameters for your datum transformation. Be sure to define the appropriate units for each parameter by clicking the Units button. Datum Shift Editor A2/8 Appendix 2: Coordinate Systems The Geodetic Datasource Ellipsoids For Ellipsoids you must enter the parameters for the Semi-Major Axis and Semi-Minor Axis (often noted as “a” and “b” respectively) define the linear units the axes are specified in by selecting a predefined unit in the appropriate fields. The Inverse Flattening (often noted as “1/f”) will automatically calculate in the field below. Alternately, you can make the Inverse Flattening definitive by enabling the check box at the bottom. You can then manually enter the Inverse Flattening rather than the Semi-Minor Axis parameter. Envelopes Ellipsoid Editor The use of an envelope is not required, but very much recommended to indicate the geographical extents where a given coordinate system is applicable. To define Envelopes you must select whether or not there are extents points, and if so, what point style they are in, and what the values of the minimum and maximum points are. Envelope Editor Appendix 2: Coordinate Systems The Geodetic Datasource A2/9 Horizontal Datums For Horizontal datums you must select the Ellipsoid the datum is based on, as well as the prime meridian used. Horizontal Datum Editor Linear Units For Linear units you must enter a conversion for the new unit in terms of the scientific standard metres. The abbreviation is used to identify the unit within the application interface (Example: The Abbreviation for metres is “m”). Linear Unit Editor A2/10 Appendix 2: Coordinate Systems The Geodetic Datasource Prime Meridians For Prime Meridians you must enter the longitude value of the Prime Meridian and the angular unit that value is in. Prime Meridian Editor WORKING WITH COORDINATE SYSTEMS A coordinate system within MAPublisher defines a mathematical model of the conversion between a specific location on the Earth and a set of coordinates. This model is specified by the Geodetic Datasource parameters, including the Earth model (ellipsoid or datum), the units used to measure the coordinates, the projection type, and any parameters specific to the projection type. Geodetic coordinate systems use Latitude and Longitude to define the position on the Earth and incorporate angular units of measurement such as degrees. Projected coordinate systems consist of a two or three dimensional system in which each point on the plane is defined by an x,y coordinate and having an origin where the axes intersect. Projected coordinate systems incorporate linear units of measurement for the measurement of area, distance and direction. Within MAPublisher, coordinate systems are organized in coordinate system categories. This structure allows grouping into a logical collection for convenience (per continent, country or local sub-divisions). The folders listed below represent the default schema for the coordinate systems in the Geodetic Datasource dialog box. Each folder option may be expanded by clicking the node adjacent to the folder name. Appendix 2: Coordinate Systems The Geodetic Datasource A2/11 -ALL- (Lists all the coordinate systems available in the database) -RECENT- (Lists the last 10 coordinate systems used) Projected coordinate system options -SEARCH ________- (Lists the most recent results of a Search operation) -GEODETIC- (Lists the geodetic coordinate systems in the database) -PROJECTED(Lists the projected coordinate systems in the database) To define or edit Coordinate Systems, you must select an Envelope defining the appropriate area of use. If you are unsure of the appropriate envelope, you can leave it set to the default World envelope. The Point Style is how you will select the style of linear units for your system. For most systems, you will want to select Projected point in _____ (appropriate units). Then select the Geodetic model that using the appropriate datum for your system. When you select the appropriate Projection for your system, the parameters needed to define the system will appear in the table below. Enter the needed parameters and define the units each parameter is specified in. NOTE: Information on supported projections and their parameters can be found in the document MAPublisher Projections Guide.pdf installed with MAPublisher. Geodetic Coordinate System Editor A2/12 Appendix 2: Coordinate Systems The Geodetic Datasource Projected Coordinate System Editor CREATE, EDIT AND DELETE GEODETIC DATASOURCE OBJECTS Creating A New Object Category 1. Select Edit Geodetic Datasource from the options menu from the MAPublisher MAP Views panel. 2. When necessary, select the Geodetic or Projected category and then click the New Category button a new object category. to create Deleting An Existing Object Category 1. Select Edit Geodetic Datasource from the options menu from the MAPublisher MAP Views panel. 2. When necessary, select the Geodetic or Projected category and then click the Delete Category button delete an object category. to Creating A New Object Within A Category 1. Select Edit Geodetic Datasource from the options menu from the MAPublisher MAP Views panel. 2. When necessary, select the Geodetic or Projected category and then click the New Object button new object 3. In the New Object dialog box, Identification tab, enter a name for the new object. NOTE: The name must be unique. to create a 4. Select and enter the appropriate parameters for the envelope, point style, geodetic value, projection, vertical reference, angular unit, linear unit, or scale factor unit that the new object is based upon. NOTE: For a new coordinate system, the parameters themselves may be customized. Every parameter must be set in the following sequence: ellipsoid, datum, envelop, unit (angular or linear), geodetic system and then projected system.... 5. Press the OK button to create the object. 6. Press the Save button to commit your update to the Geodetic Datasource file. Changing An Existing Object 1. Select Edit Geodetic Datasource from the options menu from the MAPublisher MAP Views panel. 2. Select the object, and choose the Edit Object button . 3. Enter the modified parameters for the envelope, point style, geodetic value, projection, vertical reference, angular unit, linear unit, oe scale factor unit where appropriate. 4. Press the OK button to commit your changes. 5. Press the Save button to commit your update to the Geodetic Datasource file. Deleting An Existing Coordinate System Object 1. 2. 3. 4. Select Edit Geodetic Datasource from the options menu from the MAPublisher MAP Views panel. Select the object, and choose the Delete Object button . Press the OK button to commit your changes. Press the Save button to commit your update to the Geodetic Datasource file. Appendix 2: Coordinate Systems The Geodetic Datasource A2/13 Copying An Existing Object 1. 2. 3. 4. Select Edit Geodetic Datasource from the options menu from the MAPublisher MAP Views panel. Select the object, and choose the Copy Object button . Press the OK button to commit your changes. Press the Save button to commit your update to the Geodetic Datasource file. Renaming/Moving An Existing Object 1. 2. 3. 4. 5. 6. Select Edit Geodetic Datasource from the options menu from the MAPublisher MAP Views panel. Select the object, and choose the Edit Object button . Enter the modified parameters for the identification name. Press the OK button to commit your changes. In order to move the coordinate system object, select the record and drag it to another category if necessary. Press the Save button to commit your update to the Geodetic Datasource file. Saving Coordinate Systems xml file 1. Select Edit Geodetic Datasource from the options menu from the MAPublisher MAP Views panel. 2. Customized the coordinate systems (actions above) 3. Click the Save As button, type the file name This file can be exchanged with another computer using MAPublisher using Load Geodetic Datasource. EXPORTING A REFERENCE FILE The defined coordinate system for a Map View can be exported as a reference .wkt file via MAPublisher Export Coordinate System to File option. Select Export Coordinate System to File from the MAP Views panel options menu to access the export dialog box where you can save the wkt definition. Exporting a coordinate system A2/14 Appendix 2: Coordinate Systems The Geodetic Datasource IMPORTING ADDITIONAL COORDINATE SYSTEM DEFINITIONS By using the Import Coordinate System from File menu item in the MAPublisher MAP Views panel options menu, additional coordinate system definitions can be imported and merged with the existing datasource information. MAPublisher imports the following coordinate system file formats: WKT definitions (.wkt), MAP files (.map), ESRI PRJ files (.prj), and MapInfo TAB files (.tab). Importing an Additional Datasource NOTES: • • The Geodetic Datasource must be saved (Save or Save As button) after the import in order to be able to reuse it. New coordinate systems may also be added to the Geodetic Datasource during the map data import process; when the file coordinate system is not found in the existing lists of coordinate systems, it is automatically created with the proper required parameters. Appendix 2: Coordinate Systems The Geodetic Datasource A2/15 Appendix 3: MAPublisher 8 How To’s For Legacy Users Legend Functionality in MAP Stylesheets A number of functions have been redesigned in MAPublisher 8. Users of MAPublisher 6 or earlier should consult the following pages for information on how to perform common legacy MAPublisher tasks in MAPublisher 8. BUILDING COLOUR RAMPS TO CREATE STYLES You can enhance the look of your maps by using colour ramps, rather than random colours, for your area and line styles. A possible use for this would be in the creation of relief maps. 1. Determine the number of new graduated styles you wish to create. 2. Create two rectangles with the Rectangle Tool aligned vertically, one at the top of the page, the other at the base. 3. Colour the first (top) and last (bottom) elements with two end colours for the ramp. 4. Choose Object > Blend > Blend Options. 5. Choose Specified Steps from the list. Enter the value you determined in the first step minus two. Click OK. 6. Select the two rectangles. Choose Object > Blend > Make. The legend elements will be blended between the two end colours. 7. Choose Object > Expand, then choose Object > Ungroup. This ungroups the art so that the new styles can be added to the Graphic Styles panel and be used in the MAP Stylesheets. ASSIGNING INCREMENTAL VALUES TO STYLES It is very straightforward to assign styles to values for stylesheets based on Equal to expressions. The following examples can be used as a basis for new stylesheets, providing the functionality which was previously available in the Unique Occurrences option in Auto Assign Legend Info. Example 1 (Rule 1 assigned first listed value and first style): 1. Create the first Equal to rule, using the first listed style, and an expression based on the first listed value in a specified attribute column, i.e. Style A assigned to Column X = "Value 1”. 2. Click the Add button. The second rule will be automatically assigned an incremental expression, i.e. Style B assigned to Column X = "Value 2”. 3. Keep clicking the Add button until all the values or styles have been used. Example 2 (Rule 1 assigned first listed value and third style): 1. Create the first Equal to rule, using the first listed style, and an expression based on the third listed value in a specified attribute column, i.e. Style C assigned to Column X ="Value 1”. 2. Click the Add button. The second rule will be automatically assigned the first unused style, i.e. Style A assigned to Column X = "Value 2”. 3. Keep clicking the Add button. Assignments will be incremental, but will not include the third style again, i.e. Style B assigned to Column X ="Value 3”; Style D assigned to Column X = "Value 4”; etc Appendix3:MAPublisher8HowTo’sForLegacyUsers A3/1 CREATING STYLE RULES BASED ON MULTIBLE ATTRIBUTE COLUMNS Assign Legend Info previously provided options to assign legend criteria to legend elements based on values in multiple attribute columns. This functionality can now be achieved using Advanced expressions in the MAP Stylesheet Editor. Choose the Advanced option to compose advanced expressions. The following are some examples of multi-column expressions in a world countries stylesheet (using a string type column named CONTINENT and an integer type column named POPULATION). CONTINENT=“Africa” AND POPULATION<1000000 Result: only African countries with populations less than one million are assigned the selected style. CONTINENT=“Africa” OR POPULATION<1000000 Result: all African countries and all countries with populations less than one million are assigned the selected style. CONTAINS(CONTINENT,“America” AND POPULATION>1000000 Result: only countries in North and South America with populations more than one million are assigned the selected style. CONTINENT=“Europe” AND POPULATION>1000000 OR CONTINENT=“Asia” AND POPULATION>10000000 Result: countries in Europe with populations more than one million and countries in Asia with populations more than ten million are assigned the selected style. NUMBER OF UNIQUE ATTRIBUTES Unique values are displayed in the Simple expression builder (see page 76). Note the default maximum number of values which can be listed is set to 250. To increase the number of values listed in the MAP Stylesheet Editor value drop-down lists, please complete the following: • Quit Adobe Illustrator • Open your Adobe Illustrator preferences file in a text editor. The default location and name of the preferences file is: Illustrator CS2 and CS3: Windows XP: Documents and Settings\[user name]\Application Data\Adobe\Adobe Illustrator CSXX Settings\AIPrefs Windows Vista: Users\[user name]\AppData\Roaming\Adobe\Adobe Illustrator CSXX Settings\AIPrefs Mac OS X: Users/[user name]/Library/Preferences/Adobe Illustrator CSXX Settings/Adobe Illustrator Prefs Illustrator CS4: Windows XP: Documents and Settings\[user name]\Application Data\Adobe\Adobe Illustrator CS4 Settings\en_US\AIPrefs Windows Vista: Users\[user name]\AppData\Roaming\Adobe\Adobe Illustrator CS4 Settings\en_US\AIPrefs Mac OS X: Users/[user name]/Library/Preferences/Adobe Illustrator CS4 Settings/en_US/Adobe Illustrator Prefs • • • • Search for the text MaxValuesPref Edit the listed value from 250 to the required value Save the Adobe Illustrator preferences file Re-open Adobe Illustrator A3/2 Appendix 3: MAPublisher 8 How To’s For Legacy Users Grid and Scalebar Operations EDITING CUSTOM ART Manually editing type (position, font, colour, etc) is not possible on Grids and Scale Bars in their default grouped state. Manual editing is possible but objects must be first expanded (choose Object > Expand). Note that this will negate any opportunity to subsequently edit the art using MAPublisher editing tools. If you require a different design to be used for your Grid or Scale Bar, or wish to change any parameter without generating a new version, simply select the Grid or Scale Bar and choose Object > Edit Grid or Scale Bar. This will re-open the Grids and Graticules or Scale Bar dialog box with the current parameters of the object for subsequent editing. Editing the style of text (text colour, font, alignment, etc) used in the Grid or Scale Bar can be achieved by modifying the properties of the style in the Character Styles panel. Use the bounding box of the generated grid or scale bar (choose View > Show Bounding Box) to resize. Resizing scale bars horizontally will add or remove intervals from the bar(s). Resizing scale bars vertically will adjust the width of the bar(s). Resizing grids horizontally or vertically will add or remove component cells in the grid. EXPORTING GRIDS To export a grid you must first expand the object (choose Object > Expand), then move it to an Area layer. Alternatively expand your grid, move the legend layer to the [Non-MAP layers] category, then move it back into the MAP View specifying the feature type as Area. MISSING DATA IN GRIDS ON PROJECTED MAP VIEWS Certain projections may cause incomplete grids and graticules to be drawn. Such issues may occur if the MAP View is in a polar projection or the extents of the data cross the 180 degree west/east meridian. If the generation of a grid/graticule causes blank or incomplete results, the following workflow should be used: 1. Reproject the MAP View to a standard Lat/Long projection (e.g. NAD27 Lat/Long, Degrees). 2. Generate your grid or graticules on this MAP View. 3. Expand the object (choose Object > Expand). 4. Create a new Area layer in the MAP View. Drag the expanded grid to this new layer. 5. Reproject the MAP View back to the original projection. Appendix3:MAPublisher8HowTo’sForLegacyUsers A3/3 Copy and Paste The MAP Copy/Paste function has been removed. You can now achieve the same functionality via Adobe Illustrator native Copy/Paste tools. 1. 2. 3. 4. Use Edit > Copy or Edit > Cut to copy art. Deselect the art. Select the destination layer in the Layers panel Use Edit > Paste in Front or Edit > Paste in Back to paste the art into the new layer at its previous location. • When pasting to layers which already contain an attribute structure, the destination layer must have an attribute schema which matches the source layer. • When pasting to layers which contain no attribute structure, the destination layer will be assigned the same attribute schema as the source layer. • The destination layer can be contained in any MAP View as required. • The destination layer must be of a matching feature type as the source layer. • Pasted data will always maintain its attributes. If you paste into a non-map layer, drag this layer into a MAP View, then recreate the schema, attributes will be populated appropriately. Legacy Text Conversion Opening legacy files, you may be prompted to update text (legacy text conversion). Only text objects that are associated to attributes are required to be updated. For other text with no attributes, you do not necessarily need to update. All text art - Choose this option to convert all text to the Adobe Illustrator current version. MAPublisher text art only - Choose this option to convert only the MAPublisher text (on MAP layers) Nothing - Choose this option if no conversion is necessary A3/4 Appendix 3: MAPublisher 8 How To’s For Legacy Users Appendix 4: Helpful Styles and Symbols Files The following files may be found in the Helpful Styles & Symbols files folder on your MAPublisher 8 CD or with your MAPublisher 8 download. Windows XP: C:\Documents and Settings\All Users\Documents\Avenza\MAPublisher 8\Helpful Styles & Symbols Windows Vista: C:\Users\Public\Public Documents\Avenza\MAPublisher 8\Helpful Styles & Symbols Mac OS X: Applications/Avenza/MAPublisher 8/Helpful Styles & Symbols Helpful Styles & Symbols > QuickMap Styles QuickMap styles are graphic styles and symbol libraries meant to allow users to quickly style their maps by the use of MAP Stylesheets. To ease the process, areas are classified in land and water styles, lines are classified in borders, contours, roads, rails and rivers styles. QuickMap Styles - Area.ai Categorized graphic style library , for use in Area Stylesheets. QuickMap Styles - Line.ai Categorized graphic style library, for use in Line Stylesheets. QuickMap Styles - Point.ai Symbol library with common map symbols, for use in Point Stylesheets. Helpful Styles & Symbols > S-57 Symbolization The S-57 Symbolization folder contains nautical graphic styles and symbols libraries inspired from the International Hydrographic Office M-4 publication (Regulations of the IHO for international (INT) charts and charts specifications of the IHO). Graphic styles and symbol names are mostly based on the S-57 naming conventions. The folder also contains templates with a series of MAPublisher Stylesheets linking S-57 imported features to appropriate nautical symbols and graphic styles. The basic template allow users to quickly apply styles to the imported data. The advanced template is more detailed to help users learn the format and make use of the data. Nautical_Graphic_Styles.ai Graphic style libraries for use with S-57 data. Nautical_Symbols.ai Symbols library for use with S-57 data (main symbols). S57_Advanced_Template.ait Adobe Illustrator template with detailed MAP Stylesheets for use with S-57 data. S57_Basic_Template.ait Adobe Illustrator template with simplified MAP Stylesheets for use with S-57data. US5FL12M Sample ENC file in S-57 format (chart of Tampa Bay, courtesy of NOAA®). Use of the S-57 templates: • To create a new document, choose File > New from Template. Select S-57_Advanced_Template.ait. • Import a S-57 file (for example, use the sample file). • In the MAP Stylesheets panel, move the layers from [No MAP Stylesheet] to its corresponding stylesheet, when available: JJ Advance template: the corresponding stylesheet has the same name as the layer, but not all layers have a stylesheet (therefore stay under [No MAP Stylesheet]). JJ Basic template: all layers have a stylesheet, with the same name as the layer or, if not, the name "others". The letters A, L and P have be added to the names to sort the stylesheets per feature type (Area, Line or Point). Appendix 4: Helpful Styles and Symbols Files A4/1 NOTE: This representation is non-exhaustive and meant to assist users with limited knowledge of the S-57 format to interpret the data contents more easily. The created map must not be used for navigation, unless further processing is supervised by a trained hydrographer. Helpful Styles & Symbols > Graphic Styles This folder contains five graphic style libraries with various useful styles for areas and lines. MAP_AreaStyles.ai A custom library of styles, for use in Area Stylesheets. MAP_LineStyles.ai A custom library of style, for use in Line Stylesheets. DGN_LineStyles.ai A library of MicroStation DGN line styles 1-7, for use in Line Stylesheets. MIF_AreaStyles.ai A library of MapInfo MIF/MID area styles 1-71, for use in Area Stylesheets. MIF_LineStyles.ai A library of MapInfo MIF/MID line styles 1-77, for use in Line Stylesheets. Helpful Styles & Symbols > Symbols This folder contains eight symbols libraries, categorized per topics. Aeronautical symbols.ai A library of aeronautical point symbols. Bank Symbols.ai A library of symbols for major world banks, for use in Point Stylesheets. MAP Symbols.ai A library of useful map symbols. NorthArrows.ai A library of north arrow symbols, for use in the Create North Arrow filter. Parks Symbols.ai A library of symbols composed from the US National Parks Service font library. Subway Symbols.ai A library of symbols from the major subway lines in the world. Transit Symbols.ai A library of symbols for the major transit systems of the world. Weather Symbols.ai A library of weather-related point symbols. A4/2 Appendix 4: Helpful Styles and Symbols Files Appendix 5: Glossary A Accuracy The closeness of results of observations, computations or estimates to the true values or the values accepted as being true. Accuracy relates to the exactness of the result, and is distinguished from precision, which relates to the exactness of the operation by which the result is obtained. AGI Association for Geographic Information. Algorithm A set of rules for solving a problem. ASCII American Standard Code for Information Interchange, a widely used industry standard code for exchanging alphanumeric codes in terms of bit-signatures. ANSI American National Standards Institute, an association formed by the American Government and industry to produce and disseminate widely used industrial standards. Analog / Analogue A continuously varying electronic signal. Also refers to traditional paper mapping products and aerial photographs. Annotation The explanatory or descriptive alphanumeric text or labels on a map (or artwork), such as street or place names. Application A set of computer programs designed for a specific task. ESRI Interchange File File format with the extension .e00 for ArcInfo Interchange E00 files exported from ArcInfo. Area A bounded continuous two-dimensional object, which may or may not include its boundary. It is usually defined in terms of an external polygon or in terms of a set of grid cells. A fundamental unit of geographical information. See polygon. Aspect Individual azimuthal map projections are divided into three aspects: the polar aspect which is tangent at the pole, the equatorial aspect which is tangent at the Equator, and the oblique aspect which is tangent anywhere else. (The word aspect has replaced the word case in modern cartographic literature). Attribute Non-graphic alphanumeric textual information associated with a point, line, or area element in a GIS data set; tabular data associated with geographic features. Azimuth The angle measured in degrees between a base line radiating from a center point and another line radiating from the same point. Normally, the base line points north, and degrees are measured clockwise from the base line. Appendix 5: Glossary A-A A5/1 B Base data Fundamental cartographic information (e.g. coastlines, political boundaries) in relation to which additional data of a more specialized nature may be compiled or overlaid. Bezier Curve A Bezier curve consists of two anchor points connected by a curved segment, with at least one direction point and direction line attached to each anchor point. Binary A number system of base 2. Numbers are represented simply as a series of 0’s or 1’s in contrast to base 10 number systems that represent numbers using the characters 0-9. For example, the base 10 number 65535 translates to the base 2 number 1111111111111111. Binary numbers are the fundamental basis of computing. Bitmap A grid of small squares, cells or pixels stored in memory and used to generate an image. Boolean There are two types of values: true and false. True/false or yes/no usually represent these. C CAD(D) Computer-Aided Design (and Drafting). Cadastre A public register or survey that defines or re-establishes boundaries of public and/or private land for purposes of ownership and taxation. Cartogram An abstracted or simplified map for displaying quantitative data for which the base is normally not true to scale. Cartography The organization and communication of geographically related information in either graphic or digital form. It can include all stages from data acquisition to presentation and use. CAST Centre for Advanced Spatial Technologies at the University of Arkansas. Cell The basic element of spatial information in a raster image. Character encoding A character encoding consists of a codec that pairs a sequence of characters from a given set with something else, such as a sequence of natural numbers, octets or electrical pulses, in order to facilitate the storage of text. Choropleth map A systematic representation in which colour or shading is applied to areas bounded by statistical or administrative limits. Clipping A graphic process of cutting lines and symbols off the edge of a display area. A5/2 Appendix 5: Glossary B-C Colour Ramp A graduated range of colours between two extreme colour selections. Conformal A map projection is conformal when at any point the scale is the same in every direction. Therefore, meridians and parallels intersect at right angles and the shapes of very small areas and angles with very short sides are preserved. The size of most areas, however, is distorted. Contour A line connecting points of equal elevation. Coordinate system A graticule, or a Cartesian grid, in which points are located from two (or three) axes which intersect at a point. Curvature The amount of curve in a line as defined by a series of points. D Data model An abstraction of the real world which incorporates only those properties, being relevant to the application at hand. The data model would normally define specific groups of entities, and their attributes and the relationships between these entities. A data model is independent of a computer system and its associated data structures. Database A collection of data organized according to a conceptual structure describing the characteristics of the data and the relationships among their corresponding entities. Database management system (DBMS) A set of computer programs for organizing the information in a database usually containing routines for data input, verification, storage, and retrieval. Datum Any numerical or geometrical value, surface, line, or point which may serve as a base or reference for other quantities. DEM Digital Elevation Model. A digital elevation model is a digital file consisting of terrain elevations for ground positions at regularly-spaced horizontal intervals. Digital elevation models are typically used to represent terrain relief. A DEM can be represented as a raster (a grid of squares) or as a triangular irregular network. Demographics Any information relative to people in an area of interest (statistics of birth, death, population, etc). Developable surface A developable surface is a simple geometric form capable of being flattened without stretching. Many map projections can then be grouped by a particular developable surface: cylinder, cone, or plane. DGN Native file format of MicroStation from Bentley Systems Inc. Digital The ability to represent data in discrete units or digits. Digital Line Graph USGS standard output file format. These files can be in either Optional (.opt, .do) or SDTS (.ddf ) form. Appendix 5: Glossary C-D A5/3 Douglas-Peucker Line Simplification Algorithm A method of simplifying line data by removing unnecessary vertices. Drag To hold down the mouse button while you move the mouse cursor on the screen. Drag-and-drop The action of clicking on objects, such as icons or files, and dragging them to a different location or space. DTP Desktop Publishing. DWG AutoCAD Drawing file. DXF AutoCAD Drawing Exchange Format. E Element A fundamental geographical unit of information, such as a point, line, area, or pixel. EPS Encapsulated Post Script file format The EPS format is used to transfer PostScript language artwork between applications - also see PostScript. Equal areas A map projection is equal area if every part, as well as the whole, has the same area as the corresponding part on the Earth, at the same reduced scale. No flat map can be both equal area and conformal. Equidistant Equidistant maps show true distances only from the center of the projection or along a special set of lines. For example, an Azimuthal Equidistant map centered at Washington shows the correct distance between Washington and any other point on the projection. It shows the correct distance between Washington and San Diego and between Washington and Seattle. But, it does not show the correct distance between San Diego and Seattle. No flat map can be both equidistant and equal area. F FAQ Frequently Asked Question. Feature A set of points, lines or polygons in a spatial database that represent a real-world entity. The terms feature and object are often used synonymously. Feature code A set of characters (alpha, alphanumeric or numeric) within the GIS, which uniquely identifies a feature class or group of features. File A collection of related information that can be accessed by an assigned name. A5/4 Appendix 5: Glossary D-F Filter See Plug-in filters. Folder A storage area for files within the Macintosh OS, the equivalent of a DOS or UNIX directory. Format The way in which data is arranged for storage and for transmission between software and computers. FTP File Transfer Protocol. G Geographic features Points, lines, and areas that are components of a map. Geographic Imager A suite of geospatial imaging tools for Adobe Photoshop. Geographic Information System (GIS) Any system designed for the capturing, storing, checking, integrating, analyzing and displaying of spatially referenced data about the Earth. Georeference To establish the relationship between page coordinates on a planar map and known real-world coordinates. GeoTIFF An industry-wide standard for specifying information in TIFF tags which was developed by several organizations within the GIS community. GeoTIFF files are raster images that contain georeferencing information as well as image information in a single file. GIR Geographic Information Retrieval. GIS Geographic Information Systems. GPS Global Positioning Systems. Grain The frequency of vertices or points forming a line. Graticule The spherical coordinate system based on lines of latitude and longitude. Great Circle A circle formed on the surface of a sphere by a plane that passes through the centre of the sphere. The Equator, each meridian, and each other full circumference of the Earth forms a great circle. The arc of a great circle shows the shortest distance between points on the surface of the Earth. Grid A set of regularly spaced sample points or an exact set of reference lines over the Earth’s surface. Appendix 5: Glossary F-G A5/5 H Header File A file associated with an image that contains georeferencing information for the image. File extensions may be TFW or JPW (TIFF, JPG World Files), IRP (Image Report Files) or TAB (Table files). Hydrography The science of hydrography is the measurement and description of the waters on the surface of the Earth in the form of a chart and related publications. Hypsography Lines or points which depict the relief of the land or contours or spot elevations. I Icon An image representing a software function or tool. Image A graphic representation or description of a scene, typically produced by an optical or electronic device. Examples include remotely sensed or satellite data, scanned data, and photographs. Import sequence The order of steps required to import data. Integer A number without a decimal. Integer values can be less than, equal to, or greater than zero. Isoline A line on a surface connecting points of equal value for any of the characteristics used in the representation of the surface. J Join Lines A function in MAPublisher for joining a set of linear features based on a common value such as street name. JPEG Joint Photographic Experts Group is a lossy compression technique for raster file formats. L Label Text used to identify a map feature. LANDSAT The generic name for a series of Earth resource scanning satellites launched by the United States of America. Latitude Angular distance, expressed in degrees and minutes, along a meridian north or south of the equator. A5/6 Appendix 5: Glossary H-L Lat/Long Latitude/Longitude. Unprojected. Layer A designated level in artwork used for storing, organizing and editing graphic or mapping data. Legend The section of the map that explains the meaning of the symbols used to depict graphic or geographic elements. Legend element A legend key combined with its associated text. Legend key The graphic symbol used to illustrate attributes in a legend. Longitude The angular distance east or west from a standard meridian to another meridian on the Earth’s surface, expressed in degrees and minutes. Line One of the basic geographical elements, defined by at least two pairs of X,Y coordinates, usually too narrow to be an area. See also arc, path and vector. Listgeo A free utility for examining GeoTIFF header information. It can be used to dump the contents of the GeoTIFF header in human readable form. Linear scale The relation between a distance on a map and the corresponding distance on the Earth. Scale varies from place to place on every map. The degree of variation depends on the projection used in making the map. Lossless/Lossy Lossless techniques compress image data without removing detail, lossy techniques compress by removing detail. M Mac OS Apple Macintosh operating system. Map A graphic representation of features of the Earth’s surface or other geographically distributed phenomena. Map anchor The minimum X and Y coordinates of the data files. Map coordinates The X,Y representations of ellipsoidal Earth locations on a mapping plane. Map extent The geographic extent of a geographic data set specified by the minimum bounding rectangle. MAP Layer A MAPublisher term for an Adobe Illustrator layer containing georeferencing information. Map projection A map projection is a systematic representation of a round body such as the Earth on a flat (plane) surface. Each map projection has specific properties that make it useful for specific purposes. Also see Projection. Appendix 5: Glossary L-M A5/7 MAP Selection Filter Expression criteria used for making a selection in MAPublisher documents. MAP Stylesheet A MAPublisher Stylesheet, containing styles based on attribute information. MAP View A MAPublisher term for a distinct configuration for the geospatial parameters (coordinate system, anchor, map scale and rotation) that are applied to a common grouping of data layers. A MAP Layer must reside within a MAP View. Marquee A dashed rectangle drawn with a selection tool used to select multiple objects. Meridian A line of longitude running vertically from the north pole to the south pole. Metadata Data about data typically including information such as currency, accuracy, extent and geographic projection assigned. Metadata is typically stored in data models or data dictionaries. MIF/MID The MapInfo Map Interchange Format. An ASCII file format pair exported from MapInfo GIS software. The .mif file contains the geometry information and the .mid file contains the attribute data MrSID MrSID is a file format developed by LizardTech that reduces the size of large, high-resolution images to a fraction of their original size while maintaining the original image quality and integrity. N NAD North American Datum. Network Two or more interconnected computer systems for implementation of specific functions or a set of interconnected graphic lines defining some spatial features. Node The point or intersection at which areas or lines are joined; endpoints of an arc. NSDI National Spatial Data Infrastructure. O Orthophoto A modified copy of a perspective photograph of the Earth’s surface with distortions due to tilt and relief removed. Overlay A set of graphical data that can be superimposed on another set of graphical data through registration to a common coordinate system. The process of laying one set of digital spatial data over another for analysis purposes. A5/8 Appendix 5: Glossary M-O P Page anchor The location on the page where the map anchor is placed. Page extent Defines a rectangular portion of the graphics page to be displayed. Page size The size of the published document. Parameters Variable options or choices; boundaries of operations or of an object. Path A line/vector defined by a series of points (a string of X,Y coordinates). PDF Portable Document Format. Developed by Adobe, a PDF is a file type, which can be used to cross Macintosh, Windows, DOS, and UNIX platforms. Pixel The smallest unit of information in a grid cell map or raster image. Pixel scale The real world distance as represented by a single pixel in a georeferenced image Plug-in filter A module supplied separately from the Adobe Illustrator program, usually for creating special effects in artwork. The MAPublisher application plug-in filter is a module that enables the incorporation of GIS and mapping capabilities within the Adobe Illustrator graphics environment. PMS Pantone™ Matching System. Point A discrete location represented by a symbol or label, usually too small to be displayed as an area or line. Polygon Any area bounded by a straight or irregular closed line representing a map component or any other graphic feature. Polyline A line made up of a sequence of line segments. Positional accuracy The degree to which a position is measured or depicted, relative to its correct position as established by either other features or by other accurate processes. Postscript A page description language built into many desktop printers and virtually all high-end printing systems. See the Adobe Illustrator User Guide for more details. PPC Power PC (e.g. Macintosh PowerPC computer). Precision The number of digits used to express the fractional part of a number. The more digits, the more precision. Projection The representation on a plane surface of any part of the surface of the Earth. Also see Map Projection. Appendix 5: Glossary P-P A5/9 R Raster A method for the storage, processing and display of spatial data. Each given area is divided into rows and columns, which form a regular grid structure. Each cell must be rectangular in shape, although not necessarily square. Each cell within this matrix contains an attribute value as well as location coordinates. The spatial location of each cell is implicitly contained within the ordering of the matrix, unlike a vector structure which stores topology explicitly. Areas containing the same attribute value are recognized as such, however, raster structures cannot identify the boundaries of such areas as polygons. Also raster structures may lead to increased storage in certain situations, since they store each cell in the matrix regardless of whether it is a feature or simply empty space. Record A set of attributes relating to any entity; a set of related, contiguous data. Redundancy The duplication of data in a database. Remote sensing The technique of obtaining data about the environment and the surface of the Earth from a distance, for example, from aircraft or satellite. Render The process of generating an image by means of a computer program. Resolution The number of dots per inch displayed on screen or printed to an output device. Rhumb line A line on the surface of the Earth cutting all meridians at the same angle. A rhumb line shows true direction. Parallels and meridians, which also maintain constant true directions, may be considered special cases of the rhumb line. A rhumb line is a straight line on a Mercator projection. A straight rhumb line does not show the shortest distance between points unless the points are on the Equator or on the same meridian. RS Remote Sensing. Rubber sheeting A procedure to adjust the coordinates all of the data points in a dataset to allow a more accurate match between known locations and a few data points within the dataset. Rubber sheeting, also known as rubber banding, preserves the interconnectivity or topology, between points and objects through stretching, shrinking or reorienting their interconnecting lines. S SAIF Spatial Archive and Interchange Format. SAIF is a Canadian Draft National Standard for Geomatics data interchange. It is a specification for data, which includes an object-oriented data model, and a language for describing both spatial and non-spatial data. Scale The relation between the size of an object on a map and its size in the real world. Scanner A device for converting images from maps or photographs of part of the real world into digital form automatically. A5/10 Appendix 5: Glossary R-S Schema In MAPublisher 7 the term schema is used to define the structure and makeup of the map attributes table. SDTS Spatial Data Transfer Standard - a standardized format used by the USGS for transferring Earth-referenced spatial data between dissimilar computer systems that includes support for the inclusion of spatial data, attribute, georeferencing, data quality report, data dictionary, and other supporting meta-data within a single file transfer format. SEA Self-Extracting Archive, a file compression format for reducing the size of large files for archival or transfers. Shapefile The shapefile format is a public format that is the native file format for ESRI ArcView product. This format can be used to export data with attributes from both ArcInfo and ArcView. From ArcInfo, the command at the ARC level to create a shape file is arcshape Sliver A gap formed when two lines, which should be contiguous, are slightly separated in a graphical representation or map. Spaghetti data Vector data composed of line segments which are not topologically structured or organized into objects and which may not even be geometrically clean. Spaghetti data can be useful however, if all that is required is a visual image or plot of a map and no spatial analysis is to be performed. Spatial Of space, a two or three-dimensional position in space. Spatial data Any information about the location and shape of, and relationships among, geographic features. This includes remotely sensed data as well as map data. Sphere coordinates X,Y locations on the ellipsoidal Earth, usually expressed in degrees and minutes. Spheroid An ellipsoid of rotation that is flattened at the poles, like the Earth. Spline A function in MAPublisher that improves the smoothness of curved lines, drops redundant points from paths and changes the anchor points on paths to direction points for further manual modifications. SPOT An Earth resource satellite with high-resolution sensors launched by France in January 1986. Static graphic files Unchanging and uneditable graphic files. T Thematic Map A map displaying selected kinds of information relating to specific themes, such as soil, land-use etc. Theme A user-defined perspective on a geographic dataset specified, if applicable, by a name and feature class or dataset name, attributes of interest, or data classification scheme. Appendix 5: Glossary S-T A5/11 Thiessen Polygon A polygon bounding the region closer to a point than to any adjacent point. The polygons are drawn so that the lines are of equal distance between two adjacent points. Thiessen polygons, also known as Voronoi diagrams and Dirichlet tessellations, are sometimes used as a crude form of interpolation, particularly within the geosciences. Thinning Reducing the number of points defining a line while preserving the essential shape of the line. Common weeding algorithms include: distance traversed algorithm, Nth point selection algorithm, angle selection algorithm, William point relaxation algorithm and Douglas-Peucker algorithm. TIFF Tagged Image File Format, a common raster graphic file format. Tile A discrete part of the Earth’s surface. By splitting a study area into tiles, considerable savings in access times and improvements in system performance can be achieved. Topographic map A map showing natural and man-made features as well as relief, often in the form of contours. Topography The study of the relief of a given area on the Earth’s surface, usually on a large scale, including both natural and man-made features. Topology The way in which geographic features relate to each other. Spatial relationships among features, including adjacency and connectivity. Relative position, as opposed to absolute position specified by coordinates, angles, and distances. Toponym The place names of a region or map feature. Transform The process of changing the scale, projection, or orientation of a mapped image. TRIM A GIS data file format from the Terrain Resource Information Management of British Columbia, Canada. U Ungenerate The file format created by the ArcInfo Ungenerate function. UNIX A general-purpose, multi-user computer operating system. URL Universal Resource Locator or Internet address. USGS United States Geological Survey. UTM Universal Transverse Mercator projection. A5/12 Appendix 5: Glossary T-U UTM Grid A grid system based upon the Transverse Mercator projection. The UTM grid extends North-South from 80°N to 80°S latitude and, starting at the 180° Meridian, is divided eastwards into 60, 6 degree zones with a half degree overlap with zone one beginning at 180 degrees longitude. The UTM grid is often used for topographic maps and for georeferencing satellite images. V Vector linework / artwork One method of data type, used to store spatial data. Vector data is comprised of lines, defined by beginning and end points, which meet at nodes. The locations of these nodes and the topological structure are usually stored explicitly. Features are defined by their boundaries only and curved lines are represented as a series of connecting arcs. Vector storage involves the storage of explicit topology, which raises overheads, however it only stores those points which define a feature and all space outside these features is non-existent. Vector data An abstraction of the real world where positional data is represented in the form of coordinates. In vector data, the basic units of spatial information are points, lines and polygons. Each of these units is composed simply as a series of one or more coordinate points. A line is a collection of related points and a polygon is a collection of related lines. Vertex One of a set of ordered X,Y coordinates that constitute a line. A points representing spatial X,Y coordinates that occur along a line between the nodes and help define the shape of the arc. VPF Vector Product Format. A binary format used by the US Defense Mapping Agency. It is well documented and can be sued as an internal format and as a transfer format. It carries geographic and attribute information but no display data. VPF files are sometimes referred to as VMAP products. MAPublisher does not support VPF files. W World file A file associated with an image that contains georeferencing information for the image. File extensions may be TFW or JPW (tiff, jpeg World Files), IRP (Image Report Files) or TAB (Table files). WWW World Wide Web. Z Zone Any well-defined region of more or less belt-like form. Zoom To magnify or reduce the current view of a document. Appendix 5: Glossary U-Z A5/13