1
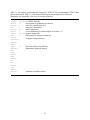
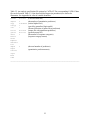
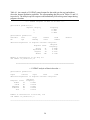
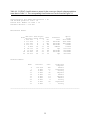
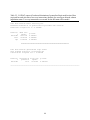
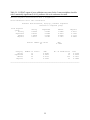
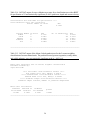
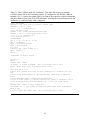
Table 4.1. An example of CATDAT general output for data with (otc.dat, top) and without
(bccu.dat, bottom) qualitative predictors. The corresponding data files are in Tables 2.1 and 2.2,
respectively. The analysis-specific output would immediately follow this general output during
program execution.
---- CATDAT analysis of data in otc.dat ---Qualitative predictor(s):
Mgnclus category
1
2
3
Frequency
0.3061
0.3187
0.3690
Quantitative predictors:
Hucorder
Hk
Elev
Ppt
Slope
Mntemp
Drnden
Solar
Bank
Rdmean
Baseero
Observed frequencies of response variable categories
Response Count
Strong
Depressed
Migrant
Absent
21
57
59
340
Marginal
frequency
0.0440
0.1195
0.1237
0.7128
Number of observations in otc.dat, 477
and number of predictors, 13
--------------------------------------------------------------------------------------- CATDAT analysis of data in bccu.dat ---Quantitative predictors:
Depth
Current
Veget
Wood
Cobb
Observed frequencies of response variable categories
Response
Riffle
Glide
Edgewatr
Sidchanl
Pool
Count
53
65
60
64
77
Marginal
frequency
0.1661
0.2038
0.1881
0.2006
0.2414
Number of observations in bccu.dat, 319
and number of predictors, 5
______________________________________________________________________________
28