1
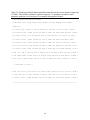
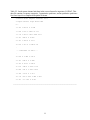
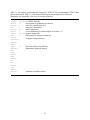
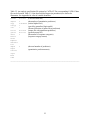
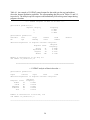
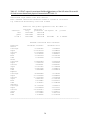
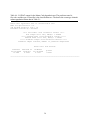
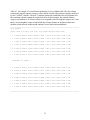
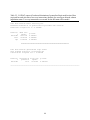
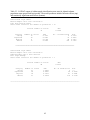
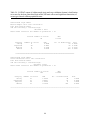
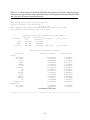
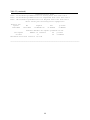
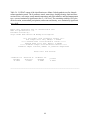
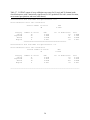
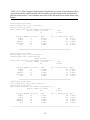
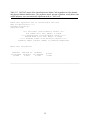
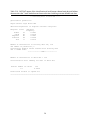
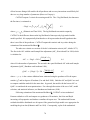
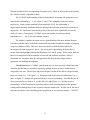
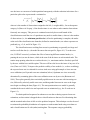
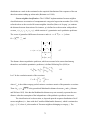
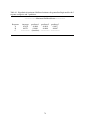
Table 5.3. CATDAT output of within-sample classification error rates for chinook salmon
population status generalized logit models. The model predictors include full main effects (top)
and statistically significant main effects (bottom).
Generalized Logit Model
Within-sample error rate calculation
Full main effects model
After model selection the number of predictors = 13
Overall number of errors
70
Category
Strong
Depressed
Migrant
Absent
Number of errors
15
30
8
17
EER
0.7143
0.5263
0.1356
0.0500
EER
0.1468
No. of Predictions
9
47
58
363
Perr
0.3333
0.4255
0.1207
0.1102
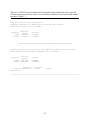
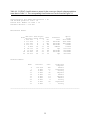
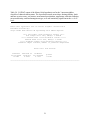
-------------------------------------------------------------------------------------Generalized Logit Model
Within-sample error rate calculation
Reduced model with 3 main effects:
Elev Slope Mntemp
After model selection the number of predictors = 3
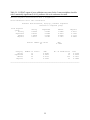
Overall number of errors
98
Category
Strong
Depressed
Migrant
Absent
Number of errors
21
38
18
21
EER
1.0000
0.6667
0.3051
0.0618
EER
0.2055
No. of Predictions
0
38
67
376
Perr
--0.4412
0.3881
0.1516
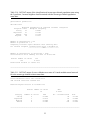
______________________________________________________________________________
45