1
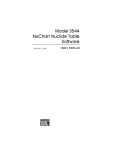
Clicking the “Add ROIs” button will add the selected ROIs to the current spectrum. An automatic ROI label will
be generated using the radionuclide name and the type of emission; e.g. “Cs137 X-ray KA1”.
Another quick and efficient way to set ROIs is by saving them into a file and reloading then at a later stage.
The bMCA software allows you to load ROIs that have been previously saved into a file (*.ROI). This can be
done by selecting “Load from file…” from the “Edit/ROI” menu. The figure below illustrates this process.
Figure 25 – Importing ROI definitions from stored files.
Using this form you can open any file that contains saved ROIs definitions. The dialog will list all the ROIs for
you to select. As with the dialogs previously seen, you can preview the ROIs by showing them in the current
spectrum. You can also decide whether to set the ROIs by using their channel boundaries or by their energy
limits. By checking their associated check box and clicking “Add ROIs”, the selected ROIs will be added to the
current spectrum and the corresponding computations performed.
Any set of ROIs can be saved into a ROI file (*.ROI) at any time. This is done by selecting “Save to file…” from
the “Edit/ROI” menu. ROI files are ASCII text files and contain all the ROI definition parameters. They can be
recalled at any time to re-establish those ROIs.
Finally, any ROI in the energy spectrum can be deleted. The menu item “Edit/ROIs/Delete All” will erase all ROIs
definitions from the current spectrum.
To delete a single ROI place the spectrum cursor inside the ROI boundaries and left-click with the mouse while
holding down the CTRL key.
PEAK SEARCH
The bMCA software provides a few spectrum analysis tools. One of them is a basic peak search in the energy
spectrum.
To perform this analysis select “Peak search” from the “Tools” menu. With the dialog that appears (Figure 15)
you can search for peaks in the spectrum using different parameters. The sensitivity and accuracy of the peak
search is affected by the values of “Threshold” and “Filter”. The values presented are the default ones for a
typical spectrum acquired with a NaI(Tl) scintillator detector of 2x2 inches and relatively good counting
statistics. If desired, you can change these parameters to fine tune your peak search routine.
The peaks found will be displayed on the list of this form. By selecting any item (peak search result) the
spectrum cursor will move to that position, so you can quickly check the accuracy of the results of the search or
chose the peaks that you are interested in.
29