1
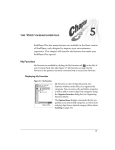
Editorial Manager(tm) MTAP
Manuscript Draft
Manuscript Number:
Title: RealTracer - Tools for Measuring the Performance of
RealVideo on the Internet
Article Type:
Keywords:
Corresponding Author:
Other Authors:
Manuscript
Streaming Media, RealPlayer, Performance Measurem, nt
Mr. yubing wang, MS. EMC Corporation
Mark Claypool
Manuscript
RealTracer - Tools for Measuring the Performance
of RealVideo on the Internet
Yubing Wang
[email protected]
EMC Corporation Hopkinton, MA 01748, USA
Mark Claypool
[email protected]
Computer Science Department, Worcester Polytechnic Institute, 100 Institute Road,
Worcester, MA 01609, USA
ABSTRACT. The increase in high-bandwidth connections and high-speed computers has spurred the
growth of streaming media across the Internet. While there have been a number of studies measuring the
performance of traditional Internet traffic, there has not been sufficient wide-scale empirical measurement
of video performance across the Internet. The lack of empirical work that measures streaming video traffic
may arise from the lack of effective video performance measurement tools. In this paper, we present
RealTracer, a set of tools for measuring the performance of RealVideo. RealTracer includes RealTracker, a
customized video player that plays RealVideo from pre-selected playlist and records user-centric video
performance information. RealTracer also includes RealData, a data analysis tool that helps manage, parse
and analyze data captured by RealTracker. We describe the software architecture and usage of RealTracker
and the usage of RealData, both publicly available for download. To illustrate the use of RealTracer, we
present some results from a previous study that used RealTracker to measure RealVideo performance
across the Internet. Using RealData, that study made several contributions to better understanding the
performance of streaming video on the Internet. Using RealTracer, we find typical RealVideos to have high
quality, achieving an average frame rate of 10 frames per second and very smooth playout, but very few
videos achieve full-motion frame rates. Overall video performance is most influenced by the bandwidth of
the end-user connection to the Internet, but high-bandwidth Internet connections are pushing the video
performance bottleneck closer to the server.
Keywords: Streaming Video, RealPlayer, Performance Measurement
1. INTRODUCTION
The increase in high-bandwidth connections and high-speed computers has spurred the growth of
streaming media across the Internet.
Web sites, traditionally text and graphics only, are
increasingly offering streaming videos such as news clips, concerts, taped presentations and
sporting events.
Applications to access popular streaming media, such as RealNetworks
RealOne, Microsoft Windows Media Player or Apple Quicktime, are freely available for most
operating systems platforms, providing the potential for nearly every Internet end-host to play
streaming video.
1
The impact of streaming video on the Internet will be largely impacted by the role of
commercial streaming media products, whose use has increased dramatically [7]. RealPlayer is
installed on over 90% of home PCs, Quicktime claims more than 100 million copies distributed
world-wide, and Media Player currently provides 220 million players [1]. RealPlayer, provided
by RealNetworks1, is the most popular streaming media player on the US Internet, with over 45%
of the commercial market share and an increase of over 50% from the previous year [7].
Over the years, there have been a number of studies measuring the performance of
Internet backbones and end-hosts [16, 21], as well as detailed studies on the performance of Web
clients [8, 11]. However, there has not been sufficient wide-scale empirical measurement of
video performance across the Internet. While the existing studies have been valuable in helping
understand Internet performance, they are not sufficient for characterizing streaming video
performance since video has application requirements that are different than the majority of
Internet traffic.
Unlike typical Internet traffic, streaming video is sensitive to delay and jitter, but can
tolerate some data loss. In addition, streaming video typically prefers a steady data rate rather
than the bursty data rate often associated with window-based network protocols. Recent research
has proposed rate-based TCP-Friendly transport protocols in the hope that streaming media
applications will use them [6, 17], but such protocols are not yet widely part of any operating
system distribution. For these reasons, streaming video applications often use UDP as a transport
protocol rather than TCP. Thus, previous Internet-wide studies that have captured primarily TCP
data do not necessarily reflect the traffic characteristics of streaming media.
The lack of empirical work that measures streaming video traffic may largely stem from
the lack of effective video performance measurement tools. Capturing streaming media traffic in
general is challenging because streaming video applications use a variety of protocols. Moreover,
1
http://www.real.com
2
while there have been efforts to develop common standardized protocols, many commercial
applications continue to use proprietary protocols.
Internet traffic is commonly measured using the tcpdump2 utility that can be used to filter
packets from a particular application based on protocol and port number. However, the port
number for many streaming media servers is not fixed, but is instead negotiated during the initial
connection using protocols such as RTSP [18]. Extensions to tcpdump [4, 11] can parse tcpdump
data to determine the ephemeral port for a particular session. However, none of these tools have
application level information, such as frame rate, data encoding rate, etc. Instead, application
level performance must be inferred from network trace information, as in [13], or by inferring
client performance from aggregate server side logs [22], adding inaccuracy to application level
measures of performance.
Commercial media players, including RealNetworks RealOne and Microsoft Windows
Media Player, provide a means of observing performance statistics, such as average bandwidth
and encoding rate. However, the same commercial players include no mechanisms for recording
data or controlling playout in an automated fashion. In addition, there are often additional
performance statistics that can help analyze streaming video performance that are unavailable via
the player itself, but can be accessed via an API to the player core or via additional system level
measurements.
In this work, we present RealTracer, a set of tools for measuring the performance of
RealVideo. RealTracer includes RealTracker, a customized video player that plays RealVideo
from a pre-selected playlist. For each video played, RealTracker records user-centric video
performance information, including frame rate, jitter and user ratings, and can either send the
performance information by email or FTP to a server or save it locally to disk. RealTracer also
includes RealData, a data analysis tool that helps manage, parse and analyze data captured by
RealTracker.
2
http://www.tcpdump.org/
3
Researchers and practitioners alike can use RealTracer in at least two ways to evaluate
RealVideo performance: (1) users can run RealTracker, saving the data locally, and then use
RealData to analyze RealVideo performance from their own PCs; or (2) users can generate
custom playlists and configuration files that have data sent to a central server, and distribute
RealTracker to a group of distributed users, allowing analysis RealVideo across a geographically
diverse set of PCs.
In this paper, we describe the software architecture and usage of RealTracker and the
usage of RealData. To illustrate the use of RealTracer, we present some results from a previous
study that used RealTracker to measure RealVideo performance across the Internet from
geographically diverse clients to geographically diverse servers. Using RealData, that study
made several contributions to better understanding the performance and impact of streaming
video on the Internet. In this paper, we illustrate the use of RealData by using data from that
study and providing new analysis on the effects of locality of access, such as is provided by
Content Distribution Networks, on RealVideo performance.
The rest of this paper is arranged as follows: Section 2 provides background needed to
help understand the RealTracer tools and performance results presented here; Section 3 describes
the RealTracer tools in detail; Section 4 presents some results we obtained in a wide-area study
using the RealTracer tools; Section 5 introduces some related work; Section 6 summarizes our
conclusions and presents possible future work.
2. REALVIDEO BACKGROUND
2.1 Connections and Protocols
RealServer primarily uses Real Time Streaming Protocol (RTSP) [18] for session control and
supports the RTP standard [19] for framing and transporting data packets. Earlier versions of
RealServer used the Progressive Networks Audio (PNA) protocol and, for backward
compatibility, newer real servers and players still support this protocol.
4
RealServer uses two network connections to communicate with RealPlayer clients: one
for communicating control information with the client, and one for communicating the actual
data. RealServer uses the control connection to request client configuration parameters and to
send information such as clip titles, and clients use the control connection to send instructions
such as fast-forward, pause, and stop. The video clips themselves, on the other hand, are actually
streamed over the data connection.
At the transport layer, RealServer uses both TCP and UDP for sending data. The initial
connection is often in UDP, with control information then being sent along a two-way TCP
connection. The video data itself is sent using either TCP or UDP. The actual choice of transport
protocol used is automatically determined by the RealPlayer and Real-Server. This autoconfiguration of protocols can be overridden by the user, but is the default and recommended
setting for RealPlayer [15].
2.2 Buffering
For each video clip, RealPlayer keeps a buffer to smooth out the video stream in case of changes
in bandwidth, lost packets or variance in packet arrival rates (jitter). Data enters the buffer as it
streams to RealPlayer, and leaves the buffer as RealPlayer plays the video clip. If network
congestion reduces bandwidth for a few seconds, for example, RealPlayer can keep the clip
playing with the buffered data. If the buffer empties completely, RealPlayer halts the clip
playback for up to 15 seconds while the buffer is filled again.
2.3 Bandwidth Characteristics
RealSystem uses a technology called SureStream in which one RealVideo clip is encoded for
multiple bandwidths [14]. A RealPlayer connects to a single video URL and the RealServer
determines which stream to use based on the RealPlayer’s specified minimum and average
bandwidths. The initial playback data rate of the video stream is based on the maximum client bit
rate (a RealPlayer configuration parameter) and other video settings. The actual video stream
5
served can be varied in mid-playout, with the server switching to a lower bandwidth stream
during network congestion and then back to a higher bandwidth stream when congestion clears.
Unlike previous versions of RealPlayer, RealOne does not need to re-buffer data during this
switching. If packets are lost during video delivery, special packets that correct errors are sent to
reconstruct the lost data.
Most RealVideo streams are created with a Scalable Video Technology option that allows
RealServer to automatically adjust the video stream according to the clients’ connection and
computer processing speed [14]. If the clip is unable to play at the encoded frame rate on a client
machine, it will gradually reduce the frame rate in a controlled fashion to maintain smooth video.
The initial size of the video stream is based on the maximum client bit rate (a RealPlayer
configuration parameter) and other video settings. If packets are lost during video delivery,
special packets that correct errors are sent to reconstruct the lost data.
3. REALTRACER TOOLS
3.1 Performance Metrics
Network throughput may have great impact on frame jitter [2] and therefore on the quality of the
video as perceived by the user. Also described in Section 2.3, RealSystem uses a technology
called SureStream to adjust the actual bandwidth of a video stream served in response to network
congestions. It is hence useful to record the variations of the network bandwidth during the clip
playout to better understand how frame rate and jitter change. RealTracker measures stream
bandwidth every second while a clip is playing.
A basic unit of video performance is the rate at which frames are played. The higher the
frame rate, the smoother the motion. Very low frame rates are perceived more like a slideshow of
still images than of streaming video. RealTracker records frame rate every second while a clip is
playing. For the reference purpose, RealTracker records the encoded frame rate for each clip as
well.
6
However, even a high frame rate can appear choppy if the frames are not played out at
even intervals. In previous work [3], we found that variance, or jitter, in frame playout intervals
can degrade perceived quality nearly as much as does frame loss. RealTracker measures jitter as
the standard deviation of the inter-frame playout time over an entire video clip (1 minute long by
default).
Even measures of frame rate and jitter alone are not always sufficient to determine the
quality of the video as perceived by the user. During encoding, RealVideo adjusts the frame rate
by keeping the frame rate up in high-action scenes, and reducing it in low-action scenes. Thus, an
encoded video clip will intentionally not have just one frame rate, but a mix of frame rates that
vary with the video scene content. In addition, our previous work [3, 20] shows that the temporal
aspect of a streaming video clip has an impact on the effects of reduced frame rate and jitter on
perceptual quality. Therefore in addition to the jitter, frame rate and bandwidth, RealTracker
records the ratings (from 0-10) of videos watched and rated by users to provide additional
performance data beyond measures of jitter and frame rate.
In order to help determine whether the bottleneck to streaming video performance is
actually in the end-user's PC itself, RealTracker records the CPU usages of a PC that is playing a
clip. RealTracker also records user information (country, state), and system information (CPU
type, memory size, and network configuration) to further help identify the performance
bottleneck.
The last performance metric RealTracker records is the transport protocol. As mentioned
in Section 2.3, at the transport layer, RealServer uses both TCP and UDP for sending data, which
have very different behaviors over network congestion.
7
3.2 Design, Implementation and Operation of RealTracker
3.2.1 Design and Implementation of RealTracker
Before describing the design of RealTracker, we briefly introduce the structure of a RealSystem
client. A RealSystem client such as RealPlayer consists of two major parts, the top-level
client and the client core. The core handles data transport with RealServer and provides
RealSystem features such as delay buffering and repairing. The top-level supplies the user
interface and communicates with the core and other components, such as rendering plug-ins,
through RealSystem interfaces. The RealSystem Software Development Kit3 provides the
interfaces required to link to the client core.
RealTracker has three layers in terms of software structure, as illustrated by Figure 3.1.
The first layer includes four modules that provide the RealTracker user interface: the user
information collection module records the user information entered by the user and
the
system information detected
by RealTracker;
the
RealVideo
statistics
collection module collects and displays RealVideo statistics through the interfaces provided
by layer two; the data delivery module delivers the statistics to the locations specified by
the user via either email or ftp; the RealVideo display module plays out the streamed video
by calling the layer two interface.
The second and third layers together form a RealSystem client where the second layer
represents the top-level client and the third layer corresponds to the client core. The second layer
acts as a bridge between the first layer and the third layer. It includes two RealSystem interfaces:
IRMAPlayer and IRMAClientAdviseSink. IRMAPlayer lets the top-level client control
the presentation playback by beginning, pausing, stopping, or seeking in a presentation timeline.
Through this interface, the RealSystem client can also gain access to the client engine, stream
3
http://www.realnetworks.com/resources/sdk/index.html
8
objects, and stream source objects. IRMAClientAdviseSink lets the top-level client receive
notifications from the client core about changes in a presentation's playback status and the
corresponding RealVideo statistics. The second layer of RealTracker also includes a module
called Jitter Analysis, which measures the frame-level jitter, a statistic that is not provided
by IRMAClient-AdviseSink. The third layer is the RealVideo core that provides the
foundation of RealTracker. Since the second layer is the most important part of RealTracker, in
the following paragraphs, we describe the three modules within this layer in detail.
To create a new IRMAPlayer interface, a client engine object is first created. On startup, the top-level client loads the client core (rmacore.dll) and calls that library's
CreateEngine method to return a pointer to the client engine object. The top-level client can
then use IRMAClientEngine to utilize the client core and create a player object by calling the
CreatePlayer method. On shutdown, the top-level client calls the C-style function
CloseEngine to close the client engine.
To add a new IRMAClientAdviseSink interface, the top-level client registers for a
specific IRMAPlayer object through that object's AddAdviseSink() method. Through the
method OnStatistics-Changed() provided by this interface, the top-level client can
receive notifications from the client core about changes in the presentation statistics. In this
method, the top-level client can further retrieve the statistics of both client and server by
accessing resources in the RealServer Property Registry, which is a dynamic repository for a
variety of server and client properties maintained by RealServer. Among the available properties,
Real-Tracker focuses on a comprehensive set of statistics for the clients such as the average
bandwidth, average latency, current frame rate, etc.
There are no entries in the RealServer Property Registry for jitter and frame inter-arrival
time. Therefore there are no means for RealTracker to retrieve these statistics through
IRMAClientAdviseSink interface or other RealSystem interfaces. Instead, RealTracker
measures jitter as the standard deviation of inter-frame playback times. Previous study [23] shows
9
that the result of frame-level jitter is consistent with our previous measurements of packet-level
jitter
for
different
end-host
network
bandwidths
[2].
Layer One
User Interface
User Information
Collection
RealVideo Statistics
Collection
Data Delivery
(Ftp / Email)
RealVideo
Display
Layer Two
IRMAClientAdviseSink
Jitter Analysis
IRMAPlayer
Layer Three
RealPlayer Core
Figure 3.1 RealTracker Structure
And further-more, to the user, frame-level jitter is more perceptible than packet-level jitter, and
hence more closely related to the quality of RealVideo as perceived by the user. To measure the
frame-level jitter, RealTracker catches the frame playback time through the ForceRedraw()
method provided by the IRMASite interface. This method provides a callback mechanism that
allows RealTracker to measure the inter-frame playback time that, in turn, is used to calculate the
frame-level jitter.
3.2.2 Operation of RealTracker
There are two targeted users of RealTracker. The first are users who want to conduct RealVideo
performance studies by distributing RealTracker with specific configuration files and playlists as
in [22], where RealTracker automatically delivers the RealVideo performance data back to the
distributor (see Section 3.2.2.1). The second are users who collect RealVideo statistics by using
10
RealTracker to display the RealVideo clips on the playlist created by the distributor or by
themselves (see Section 3.2.2.2).
3.2.2.1 For the Distributor
To plan a RealVideo performance study using RealTracker, the distributor needs to create a
playlist and a configuration file. The playlist is a text file that contains a list of RealVideo clips to
be played by each user. RealTracker randomizes the order of clips in the playlist. The
configuration file lets the distributor specify two email addresses and two FTP sites to which the
RealVideo statistics will be delivered.
3.2.2.2 For the User
Before users can run RealTracker, they must have RealPlayer or RealOne (either the free
version or a subscribed version) installed and the RealTracker support files4. Upon startup,
RealTracker requests country, state, and network configuration information from the user as
depicted in Figure 3.2a. In addition, RealTracker automatically detects the Operating System
type, CPU type, available RAM and IP address.
The main window, depicted in Figure 3.2b,
provides a playlist for video clip selection and allows users to start and stop playing the clip.
When each clip finishes playout, the user is solicited to assess the video quality by providing a
numeric rating from 0-10 as depicted in Figure 3.2c.
While the video is playing, RealTracer gathers system statistics: encoded bandwidth,
measured bandwidth, transport protocol, encoded frame rate, measured frame rate, playout jitter,
frames dropped and CPU utilization. The user data and specific clip statistics are then sent via
both email and FTP to a server. Users can also choose to save statistics locally to disk.
If so desired, the user can control the length of the clip playout and the requests for
quality ratings using the “Options” button. The defaults are to play the clip for 1 minute and
request a rating for each clip, proceeding to the next clip after 10 seconds if no rating is given.
4
See http://perform.wpi.edu/real-tracer/
11
Figure 3.2a RealTracker User Information
Window
3.2b Figure 3.2b RealTracker Main Window
Figure 3.2c RealTracker Clip Rating Window
3.3 Operation of RealData
RealData provides a file management structure called a RealFolder that is used to manage
statistics gathered by RealTracker. Each RealData file is associated with a RealVideo clip that
was played by RealTracker. All the RealData files and corresponding statistics data within one
RealFolder can be exported to a comma delimited file, suitable for import into most spreadsheet
programs, such as Microsoft Excel, for further analysis.
RealData provides a tool that can generate cumulative density data (used for drawing
CDF graphs) for measured bandwidth, frame rate and jitter.
4. RESULTS
In this section we present results obtained from our use of the RealTracer tools. The results
presented are meant to show some of the possible usages of the RealTracer tools rather than the
general results about the use of streaming media on the Internet.
12
4.1 Approach
In order to empirically evaluate the performance of RealVideo across the Internet using
RealTracker, we employed the following methodology:
•
Set up a Web site to allow users to download RealTracker.
•
Select RealVideo servers from geographically diverse Web sites and choose diverse video
clips from thoses sites.
•
Solicit users to run RealTracker and gather data.
•
Analyze the results using RealData.
In order to let users easily download RealTracker, we set up a Web site for the RealTracker
software and corresponding support files, along with the detailed usage instructions. We also
configured RealTracker so that the data could be sent via both email and FTP to a server at
Worcester Polytechnic Institute.
We chose RealServers accessible through Web pages from 6 geographic regions: Asia,
Australia, Europe, Japan, North America, and South America. Within each region, popular
RealNetworks sites were chosen from: Australia, Brazil, Canada, China, Italy, Japan, the United
Kingdom, and the United States. Figure 4.1 depicts a geographic representation of the RealServer
sites chosen. From each site, we selected a variety of video content among all the videos that
were offered.
Once the servers and videos were selected, we solicited friends, family and colleagues from
various parts of the world to help in the study. Since it was fairly easy for us to obtain data points
from Massachusetts, we asked friends and colleagues on campus and at work to solicit help from
people they knew outside of Massachusetts. We also posted messages asking for help to the
rec.video newsgroup and end2end-interest mailing list.
13
We then gathered data from users running RealTracker for an 11 day period from June 4, 2001 to
June 15, 2001. Figure 4.1 depicts a geographic representation of the locations of users that ran
RealTracker.
Figure 4.1Geographic Depiction of RealServers and Users
4.2 Results and Analysis
As described in Section 3, the system statistics gathered by RealTracker while a clip is being
played includes: encoded bandwidth, measured bandwidth, transport protocol, encoded frame
rate, measured frame rate, playout jitter, frames dropped, CPU utilization and perceptual quality
ratings. Here, our analysis of these statistics using RealData focuses on frame rate and bandwidth.
A total of 63 users from 12 different countries participated in the study, playing a total of
2855 clips, among which 2100 were from the US and 352 were from Europe.
We first analyze the recorded frame rates using RealData. The key frame rates we observe
are [14]:
•
The standard frame rate for full-motion video is 24 to 30 frames per second (fps). At this speed, the
human eye perceives movement as continuous, without seeing individual frames.
•
A common frame rate for computer video that approximates full-motion video is 15 fps. To most
people, a 15 fps video flows smoothly, although for some videos, it will not appear quite as fluid as it
would at a higher frame rate.
•
Below 15 fps, a video looks choppy.
14
•
Below 7 fps, a video looks very choppy.
•
Below 3 fps, a video essentially becomes a series of still pictures.
In our analysis, we concentrate on frame rates of 3, 15 and 25 frames per second. Figure
4.2 shows a CDF of the frame rate for all the video clips played. The mean frame rate is 10 fps,
above the range of really choppy video but well short of very fluid video. Approximately 25% of
all videos played are under the minimum acceptable 3 fps, while the same number (25%) of
videos is played at the approximate full-motion video rate, 15 fps. Only a very small fraction, less
than 1%, of all videos achieves true full-motion video frame rates.
With the increase in high-speed Internet connections for home users, we may see more
bottlenecks to performance in the server and not in the end-host network. Figure 4.3 depicts a
CDF of frame rate for different end-user network configurations. The frame rates afforded by
modem connections are clearly worse than the frame rates with higher speed connections. Over
half of all videos streamed over modems play out at less than 3 fps, and less than 10% of videos
streamed over modems achieve a smooth 15 fps. Contrast this to the higher speed connections in
which only 20% of videos have frame rates less than 3 fps, while nearly 30% of videos play out at
15 fps. Also, high-speed home-Internet connections afforded by DSL and Cable modems provide
nearly the same performance for streaming video, as do higher-speed T1/LAN connections. This
suggests that video performance bottlenecks are increasingly less likely to be the end-user
connection. Figure 4.4 depicts the bandwidth achieved by each class of end-host network
configuration. Notice that DSL/Cable modems that can typically achieve throughputs from 256–
512Kbps, operate near full capacity less than 10% of the time. This further suggests that the
bottleneck to video bandwidth is beyond the end-network connection. By comparing Figure 4.3
with Figure 4.4, it can be seen that modem connections get a proportionally higher frame rate for
their network bandwidth than do higher-speed connections.
15
1
0.9
Cummulative Density Function
1
0.9
Cumulative Density Function
0.8
0.7
0.6
0.5
0.4
0.3
0.2
0.1
0.8
0.7
0.6
0.5
0.4
56k Modem
0.3
DSL/Cable
T1/LAN
0.2
0.1
0
0
0
5
10
15
20
25
30
0
5
Frame Rate (fps)
Figure 4.2 CDF of Frame Rate for all Video Clips
10
15
20
Frame Rate (fps)
25
30
Figure 4.3 CDF of Frame Rate for Different
End-Host Network Configurations
1
Cumulative Density Function
0.9
0.8
0.7
0.6
0.5
56k Modem
0.4
DSL/Cable
0.3
T1/LAN
0.2
0.1
0
0
100
200
300
400
500
Average Bandwidth (Kbps)
Figure 4.4 CDF of Bandwidth for Different End-Host Network Configurations
It may be expected that servers in “wired” geographic areas, say North America, will
provide better streaming video performance than other locations, say Brazil. Figure 4.5 depicts a
Cumulative Density Function (CDF) of the frame rate for the servers used in our study, separated
into 5 different geographic regions. The 5 regions all provide very similar frame rate distribution
shapes, although the median of the best frame rate distribution is about 13 fps and the median of
the worst frame rate distribution is about 8 fps. Australia and Europe have the best frame rate
distributions, with Europe providing a larger percentage of frame rates above 20%. Asia provides
16
the worst frame rates, but the differences at very low frame rates is small, and Asia servers
actually have a larger percentage of frame rates above 15 fps than do North America servers.
While the peering richness of a client’s ISP may largely determine video performance, this is
difficult to measure. Thus, we consider geographic region, which is easy to measure, in place of
client ISP information. Similarly to servers, it may also be expected that users in well “wired”
geographic areas will observe better frame rates than users in more technologically remote areas.
Figure 4.6 depicts a CDF of frame rate for the users in our study, separated into 4 geographic
regions. In this case, geographic region appears to more clearly differentiate streaming video
performance than it did in the case of the servers. Australia/New Zealand provides the worst
frame rates for all ranges, with 75% of videos having fewer than 3 fps and less than 10% of
videos having more than 15 fps. Clips played in Europe have the best frame rates up to 15 fps,
with only 15% of videos having less than 3 fps and 25% of videos getting more than 15 fps.
North America is slightly better than Asia up to the 15 fps rate. Europe, North America and Asia
all provide about the same percentage of videos with frame rates above 20 fps.
Users often connect to local servers either explicitly or implicitly to get better
performance. Content Delivery Networks (CDNs), in particular, attempt to make content more
local for each user. While local access has been shown to be effective for improving the
performance of Web content [9], the effects of local content on the performance of streaming
media are not yet studied. We use RealData to analyze whether local access can achieve better
video performance, too.
Figure 4.7 depicts a CDF of frame rate for the combinations of RealServers and clients in
different geographic regions. The access of US clients to US servers provides a similar frame rate
distribution shape as that he access of European clients to European servers provides slightly
better frames rate than that of European clients to non-European servers. Overall, the 4
combinations all provide very similar frame rate distributions. This is consistent with our
observation in Figure 4.5, which suggests there is very little difference in streaming video that is
17
served from different geographic regions. In contrast, the bandwidth distribution shows strong
locality as shown by Figure 4.8. The US users to US servers achieve better bandwidth than that of
US clients to non-US servers while the European clients to non-European servers have better
bandwidth than that of European clients to European servers. This suggests media streaming may
benefit from the effects of localized proxy caches and CDNs.
1
1
0.9
0.9
0.8
0.7
Cummulative Density
Cummulative Density
0.8
0.6
Asia
0.5
Brazil
0.4
US/Canada
0.3
Australia
0.2
Europe
0.1
0.7
0.6
0.5
0.4
Australia/Newzealand
0.3
US/Canada
0.2
Asia
Europe
0.1
0
0
0
5
10
15
20
25
0
30
5
Average Frame Rate (fps)
Figure 4.5 CDF of Frame Rate for
Real-Servers in Different Geographic Regions
Cummulative Density
10
15
20
25
30
Average Frame Rate (fps)
Figure 4.6 CDF of Frame Rate for Users
in Different Geographic Regions
1
0.9
0.8
0.7
0.6
0.5
0.4
0.3
0.2
0.1
0
US User to US
Server
US User to Non US
Server
Euro User to Euro
Server
Euro User to Non
Euro Server
0
5
10
15
20
25
30
Average Frame Rate (fps)
Figure 4.7 CDFs of Frame Rate for Users/RealServers in Different Geographic Regions
18
1
Cummulative Density
0.9
0.8
US User to US Server
0.7
0.6
US User to Non US
Server
0.5
0.4
Euro User to Euro
Server
0.3
Euro User to Non Euro
Server
0.2
0.1
0
0
100
200
300
400
500
600
Average Bandwidth (Kbps)
Figure 4.8 CDFs of Bandwidth for Users/RealServers in Different Geographic Regions
We next use RealData to examine jitter as recorded by RealTracker. Since human
perception of delay for interactive applications is around 100 ms, we focus on the percentage of
videos that have a jitter of 50 ms or less.5 In addition, jitter events that are larger than the average
inter-frame playout are most noticeable by users, so we also focus on the percentage of videos
that have a standard deviations of about 300 ms (about the average inter-frame playout time for
the minimum acceptable 3 fps rate) or greater, as this may be a reasonable upper bound on an
acceptable amount jitter.
Figure 4.9 depicts a CDF of jitter (standard deviation of inter-frame
playout times) for all the video clips played. Just over 50% of all videos play with very little
perceptible jitter. This high percentage of smooth videos is most likely due to the large initial
buffer set by the RealPlayer core when the video connection is first made. Only about 15% of all
videos play out with a potentially unacceptable 300 ms or more of jitter.
Our expectation is that the frame rate results for different end-host network
configurations should hold for jitter, as well. We expect high-speed Internet connections to have
less jitter than slower Internet connections. Figure 4.10 depicts a CDF of jitter for different enduser network configurations. From the graph, jitter in video played out over a modem is typically
5
Based on the empirical assumption that approximately 95% of the playout times are within two standard deviations of the mean [5].
19
much greater than jitter over a higher-speed connection. Video clips played over a modem have
no perceptible jitter only about 10% of the time and have potentially unacceptable jitter nearly
45% of the time. DSL/Cable modems and T1/LAN connections have a nearly identical
percentage of perceptually jitter-free streams, while DSL/Cable modems also have a smaller
percentage of potentially unacceptable amounts of jitter (15% vs. 20%, respectively). Overall,
DSL/Cable modems have better jitter distributions, possibly because users contend with fewer
100
100
Cumulative Density Function (%)
Cumulative Density Function (%)
other users for bandwidth, causing less variance in bandwidth than occurs on corporate LANs.
90
80
70
60
50
40
30
20
10
90
80
70
60
50
56K Modem
DSL/Cable
T1/LAN
40
30
20
10
0
0
50
550
1050
1550
2050
2550
3050
50
Jitter (ms)
Figure 4.9 CDF of Overall Jitter
550
1050 1550 2050 2550 3050
Jitter (ms)
Figure 4.10 CDF of Jitter for Different Network
Configurations
The end-host network configuration has one of the biggest impacts on video frame rate
and jitter. We expect the impact of end-host network configuration to hold for perceptual quality
ratings, too. Figure 4.11 depicts a CDF of quality rating for different end-user network
configurations. The end-host network has a large impact on perceptual quality. The average video
watched over a modem is only about half as good in perceived quality as the average video
watched on a DSL/Cable modem.
DSL/Cable modems have better perceptual quality
distributions than do LAN/T1 connections. This difference was not evident in the frame rate
CDF for network configuration (Figure 4.4) but was evident in the jitter CDF for network
20
configuration (Figure 4.10), suggesting that jitter is differentiating the video quality between the
two configurations.
Cumulative Density Function
1
0.9
0.8
0.7
0.6
0.5
0.4
LAN/T1
0.3
DSL/Cable
0.2
56k Modem
0.1
0
0
1
2
3
4
5
6
7
8
9
10
Quality Rating
Figure 4.11 CDF of Quality for Different End-Host Network Configurations
5. RELATED WORK
5.1 Multimedia Tools
[12] described the mmdump tool for parsing typical multimedia control protocols in order to
dynamically setup filters to capture multimedia data traces. They presented the design and
implementation of mmdump and demonstrated the use of mmdump through results from
monitoring live traffic on a major ISP network. Although mmdump obtains both packet level
data and embedded control information, it does not provide application level information such as
frame rate, frame jitter, or video encoding rate. Nor does mmdump facilitate distribution to other
users for large, wide-area data collection.
Most commercial media players all provide ways that users can view video performance statistics
in real-time as videos play. Microsoft Windows MediaPlayer6, Real-Networks RealOne7 player,
6
7
http://windowsmedia.com/
http://www.real.com/
21
and Apple Quicktime8 all enable users to monitor frame rates, loss rates and more, through
pulldown menus in the Graphical User Interfaces.
However, the same players provide no
mechanisms to save performance data and do not facilitate automate playout in a controlled
fashion. Microsoft, Real-Networks and Apple all include Software Development Kits (SDKs)
that enable users to embed the proprietary video players into custom products, but do not provide
general tools to measure performance.
5.2 Internet Measurement of Multimedia
[10] streamed low-bit-rate video over dialup connections across all 50 states in the U.S.,
analyzing network level statistics such as packet loss and round-trip time. While their work
studied the impact of these parameters on streaming media traffic, they used a proprietary
streaming media protocol that may not be representative of commercial video products.
[13] presented the results of a brief study examining the traffic emanating from one
popular Internet audio service using RealAudio. While their results were useful in identifying
data protocols used and flow lengths, they did not provide information on RealVideo, which
potentially uses a much higher fraction of bandwidth that do RealAudio streams.
[4] collected traces from RTSP streaming-media sessions, which included both audio and
video, from clients from a large university to servers in the Internet. They compared streamingmedia workloads to traditional Web-object workloads, and explored the effectiveness of caching
on streaming-media workloads. While their analysis provided additional information on session
length and bandwidth usage, they did not provide additional video performance metrics such as
frame rate or image size.
6. CONCLUSIONS and FUTURE WORK
In recent years, the use of commercial streaming products has increased dramatically due to the
growth of high-bandwidth connections and high-speed computers. The future impact of streaming
8
http://www.apple.com/quicktime/
22
video on the Internet will be largely impacted by the role of commercial streaming media
products. However, there has not been sufficient wide-scale empirical measurement of video
performance across the Internet, which may largely stem from the lack of effective video
performance measurement tools.
In this paper, we have presented the design, implementation and operation of a new tool
suite, called RealTracer, for measuring and analyzing RealVideo performance. Real-Tracer
includes RealTracker, a customized player that can play streaming RealVideo clips, record
system performance statistics as well as user ratings, along with RealData, a tool that helps
analyze the statistical data collected by RealTracker. RealTracker is implemented using the
RealSystem RealOne G2 Software Development Kit, which provides two major interfaces,
IRMAPlayer and IRMAClient-AdviseSink, to control RealVideo playback and gather
the corresponding statistics. With RealTracker, users can create their own playlist and specify the
means of gathering statistics. With RealData, users can sort the RealVideo statistics, generate
cumulative density data, and export the statistical data in a comma-delimited file.
We have successfully used RealTracer to conduct a wide-scale empirical study of
RealVideo traffic from several Internet servers to many geographically diverse users [18]. The
RealTracer tools helped us find:
•
The average RealVideo clip streamed over the Internet has good quality, playing out at 10 fps
and, aided by a large, initial delay buffer, with nearly imperceptible amounts of inter-frame
jitter. Users connecting to the Internet with modems and/or slow computers still have their PC
or their network connection as the video performance bottleneck, while typical new
computers connecting to the Internet via DSL or Cable modem achieve even slightly better
performance than corporate network connections to the Internet. This suggests that increasing
broadband connections for home users are pushing the bottlenecks for video performance
closer to the server.
23
•
There is very little difference in streaming video that is served from different countries, but
there are distinct performance differences from video that is received in different countries.
•
While local access has been shown to be effective for Web content, media streaming may
also benefit from the effects of localized proxy caches and CDNs.
RealTracker only records user-centric video performance information. Our future work could
seek to broaden the data set of both users and servers. In doing so, RealTracker could also gather
statistics from Real-Servers. RealServer plug-ins can monitor resources in the RealServer
Property Registry, which is a dynamic repository for a variety of server and client properties.
These properties include such values as the number of clients currently connected, the total
bandwidth being utilized, and a comprehensive set of statistics for each of these clients. A
monitor plug-in can monitor any registry property, receiving notification when RealServer
updates the property. Monitor plug-ins can also add their own properties to the registry and
receive notifications when those properties change.
The major commercial competitor to RealNetwork’s RealPlayer is Microsoft’s
MediaPlayer9. Developing similar tools to RealTracer for Media Player, perhaps a MediaTracer,
would enable an empirical study of more general video performance on the Internet.
7. ACKNOWLEDGMENTS
We would especially like to thank Zheng Zuo for his help in implementing the
RealTracer tools.
8. RealTracer AVAILABILITY
The RealTracer programs and source code are publicly available at:
http://perform.wpi.edu/real-tracer/
9
http://www.microsoft.com/windows/windowsmedia/en/default.asp
24
REFERENCES
[1] D. Cunningham and N. Francis, “An Introduction to Streaming Video, Cultivate Interactive”,
European Commission's Digital heritage and Cultural Content (DIGICULT), May 2001.
[2] M. Claypool and J. Riedl, “The Effects of High-Speed Networks on Multimedia Jitter”, in Proc. of
SCS Euromedia Conference (COMTEC), Munich, Germany, April 1999.
[3] M. Claypool and J. Tanner, “The Effects of Jitter on the Perceptual Quality of Video”, in Proc. of the
ACM Multimedia Conference, Vol. 2, Orlando, Florida, USA, November 1999.
[4] M. Chesire, A. Wolman, G. Voelker, and H. Levy, “Measurement and Analysis of a Streaming-Media
Workload”, in Proc. of the 3rd USENIX Symposium on Internet Technologies and Systems (USITS),
March 2001.
[5] J. Devore and R. Peck, Statistics - The Exploration and Analysis of Data, 2nd edition, Wadsworth,
Inc., 1993.
[6] S. Floyd, M. Handley, J. Padhye and J. Widmer, “Equation-Based Congestion Control for Unicast
Applications”, in Proc. of ACM SIGCOMM Conference, pp. 45-58, 2000.
[7] Jupiter Media Metrix, “Users of Media Player Applications Increased 33 Percent Since Last Year,
Press Release”, April 2001, available at http://www.jup.com/company/pressrelease-.jsp?doc=pr01040
[8] B. Krishnamurthy and C. Wills, “Analyzing Factors that Influence End-to-End Web Performance”, in
Proc. of the Ninth International World Wide Web Conference, Amsterdam, Netherlands, May 2000.
[9] B. Krishnamurthy, C. Wills, and Y. Zhang, “On the Use and Performance of Content Distribution
Networks”, in Proc. of the ACM SIGCOMM Internet Measurement Workshop, San Francisco,
California, USA, November 2001.
[10] D. Loguinov and H. Radha, “Measurement Study of Low-bitrate Internet Video Streaming”, in Proc.
of the ACM SIGCOMM Internet Measurement Workshop, San Francisco, California, USA, November
2001.
[11] B. Mah, “An Empirical Model of HTTP Network Traffic”, in Proc. of ACM SIGCOMM Conference,
pp. 301-313, 1997.
[12] J.E. van der Merwe, R. Cáceres, Y-H. Chu and C.J. Sreenan, “mmdump - A Tool for Monitoring
Internet Multimedia Traffic”, ACM Computer Communication Review, Vol. 30, No. 4, October 2000.
[13] A. Mena and J. Heidemann, “An Empirical Study of Real Audio Traffic”, in Proceedings of the IEEE
Infocom, Tel-Aviv, Israel, March, 2000, pp. 101-110.
[14] Real Networks Incorporated, “RealProducer User's Guide”, copyright 2000, available at
http://www.service.real.com/help/library/guides/-producerplus85/producer.htm
[15] Real Networks Incorporated, “RealPlayer 8 User Manual”, copyright 2000.
[16] V. Paxson, “End-to-end Internet Packet Dynamics”, IEEE/ACM Transactions on Networking, Vol. 7,
No. 3, 1999, pp. 277-292.
[17] R. Rejaie, M. Handley and D. Estrin, “RAP: An End-to-end Rate-based Congestion Control
Mechanism for Realtime Streams in the Internet”, in Proc. of IEEE INFOCOM Conference, 1999.
[18] H. Schulzrinne, A. Rao and R. Lanphier, “Real Time Streaming Protocol (RTSP)”, RFC 2326, April
1998, available at Http://www.rfc-editor.org/rfc/rfc2326.txt
[19] H. Schulzrinne, S. Casner, R. Frederick, and V. Jacobson, “RTP: A Transport Protocol for Real-Time
Applications”, RFC 1889, January 1996, available at http://www.rfc-editor.org/rfc/rfc1889.txt.
[20] A. Tripathi and M. Claypool, “Improving Multimedia Streaming with Content-Aware Video Scaling”,
Technical Report WPI-CS-TR-01-02, CS Department, Worcester Polytechnic Institute, February 2001.
[21] K. Thompson, G. Miller and R. Wilder, “Wide-Area Internet Traffic Patterns and Characteristics”,
IEEE Network, Nov/Dec 1997.
25
[22] E. Veloso, V. Almeida, W. Meira, A. Bestavros and S. Jin, “A Hierarchical Characterization of a Live
Streaming Media Workload”, in Proc. of the SIGCOMM Internet Measurement Workshop, Marseille,
France, Nov 2002.
[23] Y. Wang, M. Claypool and Z. Zuo, “An Empirical Study of RealVideo Performance Across the
Internet”, in Proc. of the ACM SIGCOMM Internet Measurement Workshop, San Francisco,
California, USA, November 2001.
26
Affiliation of author and footnotes
Affiliation of author:
Yubing Wang
[email protected]
EMC Corporation Hopkinton, MA 01748, USA
Mark Claypool
[email protected]
Computer Science Department, Worcester Polytechnic Institute, 100 Institute Road,
Worcester, MA 01609, USA
Footnotes:
1
http://www.real.com
2
http://www.tcpdump.org/
3
http://www.realnetworks.com/resources/sdk/index.html
4
See http://perform.wpi.edu/real-tracer/
5
Based on the empirical assumption that approximately 95% of the playout times are within two
standard deviations of the mean [5].
6
http://windowsmedia.com/
7
http://www.real.com/
8
http://www.apple.com/quicktime/
9
http://www.microsoft.com/windows/windowsmedia/en/default.asp


![How to open your Preferences Windows Control Panel [Windows only]](http://vs1.manualzilla.com/store/data/005787188_1-657759d9a2a48c6bde523f6baebed157-150x150.png)