1
ServiceLab
ServiceLab 7.0
32-bit version for
Windows 98
Windows NT V4
Windows 2000
Windows XP Pro
Book 1:
User Guide
ServiceLab
License Agreement
By opening the sealed license envelope, you are agreeing to the following license:
ServiceLab Ltd. grants you a non-exclusive license to use this Software on one computer at a time.
You do not obtain title to the Software or any copyrights or proprietary rights in the Licensed Software. You may not transfer, sub-license, rent, lease, convey, copy, modify, translate, convert to
another programming language, decompile or disassemble the Licensed Software for any purpose,
except as expressly provided for in this license. You may not copy the Documentation.
You may copy the Licensed Software for backup purposes only, in support of your use of the Software in accordance with the terms and conditions of this license.
ServiceLab Ltd. warrants, for a period of ninety days after your receipt of the product, 1) the disks
on which the Software is distributed to be free from defects in materials and workmanship, and 2)
that the software will perform substantially in accordance with the Documentation. If the product
fails to comply with the warranty set forth above, ServiceLab Ltd.'s entire liability and your exclusive remedy will be replacement of the disks or ServiceLab Ltd.'s reasonable effort to make the
product meet the warranty set forth above. If ServiceLab Ltd. is unable to make the Product conform to the above warranty, then you may return the complete package to ServiceLab Ltd. or its
dealer, and ServiceLab Ltd., at its option, may refund all or a fair portion of the price you paid for
this package.
Although ServiceLab Ltd. has tested the Software and reviewed the Documentation, SERVICELAB
LTD. MAKES NO WARRANTY OR REPRESENTATION, EITHER EXPRESS OR IMPLIED,
WITH RESPECT TO THIS SOFTWARE OR DOCUMENTATION, THEIR QUALITY, PERFORMANCE, MERCHANTABILITY, OR FITNESS FOR A PARTICULAR PURPOSE. AS A
RESULT, THIS SOFTWARE AND DOCU-MENTATION ARE LICENSED “AS IS,” AND
YOU, THE LICENSEE, ARE ASSUMING THE ENTIRE RISK AS TO THEIR QUALITY AND
PERFORMANCE.
IN NO EVENT WILL SERVICELAB LTD. BE LIABLE FOR DIRECT, INDIRECT, INCIDENTAL, OR CONSEQUENTIAL DAMAGES ARISING OUT OF THE USE OR INABILITY TO
USE THE SOFTWARE OR DOCUMENTATION, even if advised of the possibility of such damages. In particular, ServiceLab Ltd. shall have no liability for any programs or data stored or used
with the Software, including the costs of recovering such programs or data.
Copyright © 2004 by ServiceLab Ltd.. All rights reserved.
ServiceLab Ltd.
Marlene-Dietrich-Str. 5
D – 89231 Neu-Ulm, Germany
www.servicelab.info
i
ServiceLab
Year 2000 Compliance Statement
ServiceLab 7.0 is Year-2000-compliant. It conforms to the British Standards Institution BSI DISC PD-2000-1 'A Definition of Year 2000 Conformity Requirements‘ document. Specifically, ServiceLab will:
Work correctly for the following the transition from December 31, 1999
to January 1, 2000
Recognize that 2000 is a leap year;
Work correctly for all dates in the range January 1, 1980 through December 31, 2037, but not before, and not after
Read and store dates correctly using its private (.DDF) data format, and
store appropriately for other date formats
ii
ServiceLab
Risky Applications
Warning:
(1) ServiceLab is not designed with components and testing for a level of reliability suitable for use in or in connection with surgical implants or as critical
components in any life support systems whose failure to perform can reasonably
be expected to cause significant injury to a human.
(2) In any application, including the above, reliability of operation of the software products can be impaired by adverse factors, including but not limited to
fluctuations in electrical power supply, computer hardware malfunctions, computer operating system software fitness, fitness of compilers and development
software used to develop an application, installation errors, software and hardware compatibility problems, malfunctions or failures of electronic monitoring
or control devices, transient failures of electronic systems (hardware and/or
software), unanticipated uses or misuses, or errors on the part of the user or applications designer (adverse factors such as these are hereafter collectively
termed "system failures").
Any application where a system failure would create a risk of harm to property
or persons (including the risk of bodily injury and death) should not be reliant
solely upon one form of electronic system due to the risk of system failure.
To avoid damage, injury, or death, the user or application designer must take
reasonably prudent steps to protect against system failures, including but not limited to back-up or shut down mechanisms.
Because each end-user system is customized and differs from the testing platforms of ServiceLab Ltd. and because a user or application designer may use
ServiceLab Ltd. products in combination with other products in a manner not
evaluated or contemplated by ServiceLab Ltd., the user or application designer
is ultimately responsible for verifying and validating the suitability of ServiceLab Ltd. products whenever ServiceLab Ltd. products are incorporated
in a system or application, including, without limitation, the appropriate design,
process and safety level of such system or application.
iii
ServiceLab
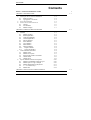
Contents
BOOK1: USER GUIDE
License Agreement
Year 2000 Compliance Statement
Risky Applications
i
ii
iii
CHAPTER 1: INTRODUCTION
1.
2.
Welcome to ServiceLab!
About your ServiceLab Documentation
2.1.
What’s Included
2.2.
Contents
2.3.
Typographic Conventions
3. What is ServiceLab?
4. Installation
4.1.
System Requirements
4.2.
Setting Up ServiceLab
4.3.
Hints for PC Hardware Configuration
5. ServiceLab Versions
6. New in ServiceLab Version 7.0
6.1.
General
6.2.
New Modules
6.3.
Module Changes
1-1
2-1
2-1
2-2
2-3
1-4
1-8
1-8
1-9
1-10
1-11
1-13
1-13
1-14
1-15
CHAPTER 2: GETTING STARTED
1.
2.
Basic Techniques
Starting ServiceLab
2.1.
Starting ServiceLab with a New Worksheet
2.2.
Starting ServiceLab with an existing Worksheet
3. Experiment Setup and Time Bases
4. Documenting your Worksheet
5. Context Menus
6. Documentation Properties Using the ServiceLab Help System
7. Creating your First ServiceLab Worksheet
2-1
2-4
2-4
2-4
2-5
2-5
2-6
2-7
2-7
CHAPTER 3: CREATING AN EXPERIMENT SETUP
1.
The Elements of a Worksheet
1.1.
Modules
3-1
3-1
v
ServiceLab
1.2.
Data Channels, Junction Points
The ServiceLab Screen
2.1.
The Worksheet Window
2.2.
The Display Tree View
2.3.
The Control Sequencer Window
2.4.
The Layout Window
2.5.
VITool Toolbox (optional)
2.6.
Title Bar
2.7.
Menu Bar
2.8.
Module Bar
2.9.
Function Bar
2.10.
Status Bar
2.11.
Display Windows
3. Module Groups Overview
2.
3-3
3-8
3-8
3-11
3-12
3-15
3-19
3-19
3-19
3-21
3-22
3-25
3-25
3-27
CHAPTER 4: MAIN MENUE
1.
Worksheet Window Menu
1.1.
File Menu
1.2.
Edit Menu
1.3.
Module Menu
1.4.
Experiment Menu
1.5.
View Menu Commands
1.6.
Options Menu
1.7.
Window Menu
2. Control Sequencer Menus
2.1.
File Menu
2.2.
Edit Menu
2.3.
Experiment Menu
2.4.
View Menu
2.5.
Options Menu
3. Tree View Menus
3.1.
File Menu
3.2.
Edit Menu
3.3.
Experiment Menu
3.4.
View Menu
3.5.
Options Menu
3.6.
Window Menu
4. Layout Window Menus
4.1.
File Menu
4.2.
Edit Menu
4.3.
Object Menu
4.4.
Experiment Menu
4.5.
View Menu
4.6.
Options Menu
vi
4-1
4-1
4-9
4-17
4-22
4-37
4-43
4-66
4-67
4-67
4-70
4-70
4-70
4-70
4-70
4-70
4-70
4-70
4-70
4-70
4-71
4-72
4-72
4-72
4-74
4-79
4-80
4-80
ServiceLab
4.7.
Window Menu
Help Menu
5.1.
Index
5.2.
Hardware
5.3.
Glossary
5.4.
Using Help
5.5.
System Information…
5.6.
About ServiceLab…
6. Customizing the Main Menu: External Programs
5.
4-82
4-83
4-83
4-85
4-85
4-85
4-85
4-85
4-86
CHAPTER 5: FILES AND FILE FORMATS / DDE / NETWORK
1.
Files and File Formats
1.1.
Worksheet Files (*.DSB)
1.2.
Control Sequencer Files (*.DSQ)
1.3.
Module Bar Files (.DML)
1.4.
Layout File (.LAY)
1.5.
Serial Port Settings (.SIN/.SOU)
1.6.
Initialization File (SERVICELAB.INI)
1.7.
Files with Reference Points (.DPF)
1.8.
Data Files
1.9.
DASYTEC Data Format (.DDF/.DDB)
1.10.
Vector File (*.VEC)
1.11.
FGEN File (*.TXT)
2. ServiceLab-Network: Communication with other programs
2.1.
TCP/IP Network Protocol
2.2.
Bibliography
3. DDE: Communication with Other Applications
3.1.
ServiceLab as DDE Input
5-1
5-1
5-2
5-2
5-3
5-3
5-3
5-3
5-4
5-5
5-10
5-10
5-11
5-12
5-13
5-13
5-13
CHAPTER 6: TIPS & TRICKS
1.
2.
3.
4.
Demo Worksheets
ServiceLab by Keyboard
ServiceLab Hotkeys
How to Start and Stop an Experiment
4.1.
Start/Stop/Pause/Resume an Experiment
4.2.
Controlling an Experiment Manually
4.3.
Automatic Program/Experiment Start
5. Exchanging Worksheets
6. Display Company Logo
6-1
6-1
6-2
6-3
6-3
6-3
6-4
6-7
6-8
APPENDICES
A: What’s Included in Your ServiceLab Package
B: Internal Data Flow and Precision Information
A-1
B-1
vii
ServiceLab
C: Error Messages and Troubleshooting
D: Product Support
INDEX
viii
C-1
D-1
ServiceLab
About your ServiceLab Documentation
Chapter 1: Introduction
1.
Welcome to ServiceLab!
You have acquired an easy to use software product that provides an enormous
range of functions and options for your data acquisition tasks. Install this electronic laboratory on your computer and start experimenting; you will quickly discover many of ServiceLab’s powerful features.
Use ServiceLab’s Online Help system to display information about the operation
that you are about to carry out on the screen. It may be unnecessary for you to
thoroughly study this printed manual.
If you are new to ServiceLab, we recommend that you read through the Step-byStep Instructions in the online Help system, or read this introductory chapter plus
Chapters 2 and 3. You will then know enough to start off with ServiceLab on
your own.
If you have upgraded from a previous version of ServiceLab, please review
Chapter 1 – Section 6 for information about new and changed features.
Later, this User Guide can help you find your way through
ServiceLab even when you are not at your computer. It can serve as a reference
book and it will provide background information that might seem out of place in
the immediacy of the online Help system.
2.
About your ServiceLab Documentation
2.1. What’s Included
The ServiceLab documentation consists of the following:
The context-sensitive online Help system provides quick on-screen reference to procedures and commands you may need while working with ServiceLab. In addition, hardware help is provided to describe the installation, setup, and use of your specific data acquisition device.
This User Guide contains a comprehensive description of all of ServiceLab’s functions and their uses. It serves as a reference book, providing background information.
The book, Volume 2 of the User Guide, the Module Reference Guide,
with complete descriptions of each Module Group and Module.
The Hardware Information Manual provides a description of the interface
between the data acquisition hardware and ServiceLab. This manual may
not be provided with all packages. If not, review the README.WRI file
and any hardware specific online help that is installed.
2-1
ServiceLab
Introduction
README.WRI, an information file that is copied to your hard disk when
you set up ServiceLab, provides information that was updated after this
User Guide was printed. You can easily read (or print) this file using
Windows Write.
We strongly recommend that you read the README.WRI file before you
start working with the software.
2.2. Contents
The ServiceLab User Guide is divided into the following parts:
Chapter 1: A general introduction to the software. It explains the basic concepts and provides setup information. It includes an overview of
the new features and changes in this version.
Chapter 2: Operating fundamentals. This chapter explains the skills you
need to work with ServiceLab, how you start the program, and
how you can use the online Help system. You can then follow a
tutorial.
Chapter 3: A systematic survey of the elements you will use when working
with ServiceLab.
Chapter 4: A description of all of ServiceLab menu commands and functions (except those from the Module menu). The chapter’s structure corresponds to the ServiceLab menu system.
Chapter 5: Background information about file formats and data exchange between Windows applications.
Chapter 6: Additional hints and background information structured along
particular tasks or problems that may arise during your work
with ServiceLab.
Appendices: Lists of program specifications and error messages, a glossary,
the License Agreement and a comprehensive Index of Topics
covering Chapters 1 to 7.
Please do not forget to send us your Registration Card.
The ServiceLab Module Reference Guide includes detailed descriptions for
each module.
The Hardware Information Manual contains a description of your device with information concerning setup and operation with ServiceLab.
2-2
ServiceLab
About your ServiceLab Documentation
2.3. Typographic Conventions
We have used visual cues and standard text formats in this User Guide to help
you locate and interpret information easily.
Text Formats
File names and directory names are printed in ALL CAPITALS.
All references to menus, menu commands and to the options available in dialog
boxes are printed in this sans serif typeface.
All references to keyboard keys and command entries are printed in this
text format. These are usually commands that you must type at the DOS
Prompt or in ServiceLab or Windows text boxes exactly as you find them printed
in this manual. It does not matter whether you type upper or lowercase letters.
Keyboard Formats
Key combinations and key sequences:
KEY1+KEY2 means to press and hold down the first key while you press
the second.
KEY1, KEY2 means to press and release the keys one at a time.
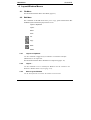
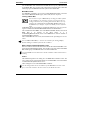
Symbols
We have used the following symbols throughout this User’s Guide to identify important information to guide you to information on a related topic:
Serious Warning! Neglecting the hints indicated by this symbol may result in severe program errors or even damage to your hardware.
Warning. Neglecting the hints indicated by this symbol may result in ServiceLab not operating properly; data may be misinterpreted or not calculated correctly. This symbol will remind you to check that parameters are set
correctly, or to check settings that must match.
When you have read a passage about a subject, this symbol may indicate that
explanations on a related subject can be obtained elsewhere in this User
Guide, or that similar commands, options, etc. might be of interest in the current context.
2-3
Introduction
3.
ServiceLab
What is ServiceLab?
Data Acquisition and Analysis under Windows
ServiceLab is a data acquisition, process control, and analysis system which
takes full advantage of the features and the graphical interface provided by Microsoft® Windows™.
The most important design requirements for ServiceLab were the integration of
the important measuring and control devices on the market, a truly intuitive operating environment which offers extensive help functions, a maximum signal processing speed, and the most effective graphical display of results.
Intuitive Operation
Using ServiceLab, a measuring, process control, or simulation task can be set up
directly on your screen by selecting and connecting modular elements that can
then be freely arranged. Even highly specialized tasks can be solved immediately
on the screen, interactively and without difficulty. It is no longer necessary to
find your way through lengthy and rigid menu structures.
Large Variety of Measuring, Control, and Analysis Functions
Among the module functions provided are A/D and D/A converters, Pre/Post and
Start/Stop Triggers, digital I/O, mathematical functions from fundamental arithmetic to integral and differential calculus, statistics, digital filters of several
types, frequency analysis including various evaluation windows, signal generators for simulation purposes, scopes for the graphic display of results, logical
connectors like AND, OR, NOR, etc., counters, a chart recorder, file I/O, timer,
digital display, bar graph, analog meter and more.
Measuring Technology under Windows
With ServiceLab it is now possible to achieve high signal input/output rates using the full power of the PC. Special buffers with large, selectable, memory address ranges enable continuous data transfer from the data acquisition device
through to the software. ServiceLab uses extremely sophisticated drivers to obtain real-time logging at a rate of up to 800 kHz and real-time on-screen signal
display at a rate of up to 70 kHz (depending on the type of data acquisition device and graphics board installed).
Flexible Worksheet Setup
In spite of its complexity and high performance, ServiceLab can be used easily.
The worksheet displayed on screen can be edited at any time. New modules can
be inserted; others can be moved to a different position or deleted altogether.
Dialog boxes prompt for all the necessary parameters to be set for an experiment.
1-4
ServiceLab
What is ServiceLab?
Use the Black Box module to take combinations of worksheet elements repeatedly
required in your experiments, and integrate them into a Black Box module, which
you can then insert into worksheets as ready-to-use units. This will save you time
and simplify your worksheets.
Integrated Autorouter Utility
While you are connecting the module inputs and outputs using the mouse, these
connections are displayed as direct lines, but as soon as the mouse button is released the integrated autorouter optimizes all these connections. This prevents
data channel lines being drawn through or behind existing module symbols or too
close to other lines.
In the same way, the integrated autorouter rearranges the display whenever a
module symbol has been moved. It thus creates a readable worksheet diagram
ready for documentation purposes.
Ample Resources
The maximum worksheet size is 2000 by 2000 pixels, and a worksheet can contain up to 256 modules. For most modules up to 16 inputs and/or outputs can be
configured.
The virtual working area at the user’s disposal is much larger than what can actually be presented in the active window on screen. When dealing with more extensive applications, where the complete arrangement of module symbols will
not fit on the screen, you can scroll through the screen window vertically and
horizontally. In addition, an overview command, several tagging functions, and
the ability to hide the worksheet diagram help you to keep track of the setup and
experiment.
Function Bar and Module Bar
Icon bars that provide commands and functions that might be repeatedly required when experiments are set up and carried out enhance ServiceLab’s
user-friendliness considerably.
You can define the Module Bar on the left of the screen to reflect your preferences. You can assign module functions that you need most often in your individual tasks to the buttons on the Module Bar. Once configured, these settings can
be saved and reused for other worksheets or experiments. Various configurations
adapted to the individual requirements of different tasks are easily reused.
1-5
Introduction
ServiceLab
Display of Results
Readings can be displayed graphically or numerically using specially assigned
modules. This can be done effectively by making use of scope modules. Each one
provides a resizable window in which data from several channels can be displayed; a system of suitable coordinates (linear, logarithmic, polar, waterfall),
and different color codes (for multiple signals) can be selected.
Scaleable analog instruments, bar graphs and LED indicators are especially
helpful when it comes to process control and testing. As these elements can be
freely placed and combined, all the instruments necessary for any process can be
integrated completely.
Storing the Setup
The complete experiment setup, including all the currently selected parameters,
window positions, and additional information can be saved to a file and opened
again later. Multiple ready-to-use standard setups for different tasks can be developed. The corresponding data acquisition process itself can even be started
automatically at a specified time, when your computer restarts or when Windows
starts.
Storing Data and Data Exchange
The acquired data and process results can also be saved to files so that they can
be retrieved for further processing at a later time. They can be analyzed in detail,
or used for simulation and training.
Use DDE (Dynamic Data Exchange) to transfer data directly to other Windows
applications supporting the DDE protocol. For example: Excel and applications
with DDE capabilities may be used to start ServiceLab and control it while running an experiment.
Process Control Applications
External systems can be controlled by employing appropriate modules for digital
I/O or D/A conversion. ServiceLab provides a wide range of powerful modules
for binary operations (AND / OR / NOT etc.), counters, and PID control functions.
Precise time-related process control operations depending on complex signals
can be realized with ServiceLab. Output frequencies, slopes, duration, dependencies on certain input source conditions, etc., can be determined for several
channels by the user.
Simulation – for Testing and Training Purposes
Pure simulations, even without a data acquisition device, offer excellent opportunities to test measuring or process control experiments that have been developed on the PC. In these cases, a signal generator module, or several of them, is
substituted for the measuring device. By combining signal generator modules
1-6
ServiceLab
What is ServiceLab?
with mathematical modules, complex stimuli can be generated. For example, a
sine or rectangle signal might be overlaid by a noise signal or by further sine,
rectangle, or saw tooth signals. Even signals that have previously been saved to
files may be retrieved and used again as stimuli using the file I/O module.
You can use ServiceLab in training courses, as trainees can directly observe the
effects and results of data acquisition and process control systems.
Publication
All the resources provided by Windows are at your disposal for publication purposes. Not only the measured results, but also the entire experiment setup can be
published comprehensively and professionally. ServiceLab can supply the worksheet diagram itself, or the graphic display of the measuring results, directly to
Windows WordPad, Microsoft Word, or PageMaker. ServiceLab provides integrated publishing tools to print the worksheet, graphic or numerical data displays, captions and explanatory text passages.
Custom Functions
As a service to customers who have to cope with highly specialized tasks, ServiceLab Ltd. will develop custom function modules and other software modifications on request to meet individual demands. For instance, specified mathematical operations or options concerning the graphic presentation can be implemented or modified as required, and further data exchange interfaces can also be
supplied.
An Extensions Tool Kit is available for experienced C programmers who wish
to design their own modules. Contact your dealer for more information.
Integrated Help System
In most situations, it is not necessary to refer to the complete manual, since almost any problem can be solved using the online help system.
The context-sensitive help system provides the user with detailed instruction on
hardware settings and software options, and it also supplies background information on measuring technology topics like FFT/spectral analysis.
Conclusions
In combination with one of the established PC measuring and process control devices, the ServiceLab system is a powerful tool for data acquisition, process
control and simulation.
1-7
ServiceLab
Introduction
4.
Installation
4.1. System Requirements
ServiceLab works with most personal computers available today. The minimum
software and hardware requirements your PC needs to run ServiceLab successfully are listed below. To get the best performance from the software, especially
when more than one Windows applications is to be run, we recommend additional hardware resources.
Minimum Requirements
A personal computer with an Pentium class processor, a standard keyboard, a mouse or similar pointing device
64 MB memory (RAM) for Windows 98, 128 MB for NT/2000/XP
40 MB of free hard disk space
CD-ROM Drive for installation
A monitor and a VGA display adapter , 1024 x 768 resolution
One parallel interface (Centronics) is required for dongled (hardware key
lock) versions of the product.
Windows 95/98 or Windows NT/2000/XP
Recommended Configuration
Pentium II class or better PC
Additional memory (RAM) (the amount of memory determines the display
capability of the Chart Recorder and Y/t Chart modules)
Free hard drive space to install optional components, such as DataSockets
High resolution color monitor (e.g. 1024 x 768)
Super VGA display adapter supported by Windows
Software, keyboard, mouse, hard disk, CD-ROM drive, and interfaces as
described above
Serial interface (RS232)
All printers and plotters supported by Windows can be used with ServiceLab.
No data acquisition hardware is required to run ServiceLab. To acquire input or
output analog signals one of the A/D or D/A devices that are supported by ServiceLab must be installed. Please refer to the Hardware Installation Manual or
the online help for details about the installation of your hardware.
1-8
ServiceLab
Installation
4.2. Setting Up ServiceLab
Preparations
1.
Make sure that your ServiceLab package is complete. It should contain a
CD-ROM disk and the registration card.
2. Make sure that there is at least 40 MB of free space on the hard disk
where you are installing ServiceLab.
3.
You must be running Windows. ServiceLab will not install from the DOS
prompt.
4. Insert the CD-ROM into your CD-ROM drive.
If you received the CD-ROM as the installation media, and your computer
does not have a CD-ROM drive, you can use another computer (with a CDROM drive and a diskette drive) to make diskettes. Insert the CD-ROM,
and follow the installation/make diskettes prompts. You will need 10 or 11
blank, formatted 3½” diskettes.
We strongly recommend that you read the README.TXT file before you
start with the installation. This file contains a detailed installation instruction.
Never install ServiceLab 3.5 (only S5-functionality) under Windows
NT/Windows 2000. A system breakdown or even a loss of datafile might
occur.
The S7-Interface have to be installed in order to give ServiceLab 7.0 its
full functionality (read the README.TXT).
Starting the CD-ROM Installation
1. Insert the CD-ROM disk into your drive.
2. The CD menu will offer you several choices. For detailed informations read
the README.TXT file on your CD.
3. Select Installation
4. Select Install to run Setup.
Setup Summary
The installation program will …
… Ask for the serial number which was provided for a new or upgraded installation (use your current number to re-install)
… Give you the opportunity to specify the directory and other installation options
… Allow you to specify the data acquisition driver to install.
… Check if the specified directory exists, and create it if necessary.
1-9
Introduction
ServiceLab
… Check if there is enough free space on your hard disk. If not, you will be
…
…
…
…
…
…
asked to enter another drive or to cancel setup.
Copy all the ServiceLab program files to the drive and directory.
Create a ServiceLab program group in the Windows Program Manager. If the
group already exists, it will be opened.
Create various program items within that group.
Add the appropriate hardware driver command lines to the [386Enh] section
of the SYSTEM.INI file if you specified a ServiceLab driver with a virtual
device driver (Windows 98), or load kernel mode driver (*.KMD) for Windows NT/2000/XP.
Add appropriate items to the Windows Registry
Optionally, install DataSocket Client and Server software
Completing Setup
If your data acquisition device does not require a virtual device driver, you can
exit the installation procedure and use ServiceLab immediately.
If you have installed a ServiceLab version that includes a virtual device driver,
Windows may need to be restarted so that the changes made to your system can
take effect.
If you choose Exit Installation to use your original Windows configuration, ServiceLab is ready to be used, but can only access any newly installed device
drivers (if required) after you exit Windows and restart it. If you choose Restart
Windows, the program will exit Windows completely and restart it.
With some data acquisition devices it may be necessary to modify the configuration of Windows. Please refer to the documentation that comes with
your hardware, or to the Software Installation section pertaining to your
hardware in the Hardware Installation Manual.
4.3. Hints for PC Hardware Configuration
PC’s used for data acquisition systems must fulfill other requirements than computers used as office systems or for games.
This means there are different considerations when installing a measurement system.
The following hints will help if your PC hardware has hardware problems.
Often these problems are related to the following components or functions:
Power Management
The Power Management System of some PCs sometimes obstructs the
measurement. Please completely disable the Power Management option
in the PC BIOS. You may also have to disable the "Support of Advanced
Power Management" in System/Device Manager/Hardware Components.
1-10
ServiceLab
ServiceLab Versions
PCMCIA / PC-Cards and USB based devices may have additional power
management settings. Disable all applicable power management to prevent Windows from stopping your devices while running.
Windows Time Zone Settings
Please disable the Time Zone property "Automatically adjust clock for
daylight savings changes" in the Window's Date/Time Properties. If ServiceLab is running when the operating system changes the clock time, it
pauses until the user clicks on the Dialog Box to acknowledge the change.
In addition ServiceLab will not have the correct start time for the Experiment. ServiceLab only checks the PC clock time at experiment start.
Graphic Card Drivers
New drivers from some Graphics Card manufacturers are often optimized
for maximum speed (e.g. to reach high performance in PC games). The
driver overrides and obstructs the measurement running in the background. When in doubt, do not use the driver of the card manufacturer but
use the original Standard VGA or SuperVGA driver shipped with Windows by Microsoft. Sometimes, there is a newer driver available from
your graphics card manufacturer that fixes problems. Please check with
your manufacturer for the latest drivers.
Printers
Several printer drivers also disturb the data acquisition. If you experience any problems, use a printer that is supported by the original Standard Printer Driver of Microsoft. Often these standard drivers support a
complete family of drivers. For example, you can control the
HP LaserJet family with the 'HP LaserJet Series II' driver from Microsoft.
Resource Conflicts
Please pay attention to resource conflicts between the hardware components of your PC. Often the data acquisition hardware uses the same IRQ
or DMA addresses as Sound Cards, Network adapters and other devices.
In case of doubt, remove the Sound Card from your system or, if it is
fixed in a notebook, disable it in the BIOS. Simply removing the driver
(!) in Windows 98 will not solve the problem.
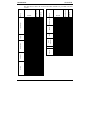
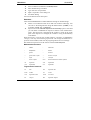
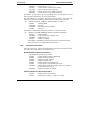
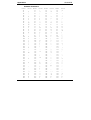
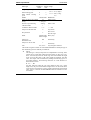
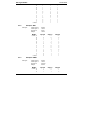
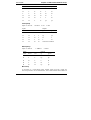
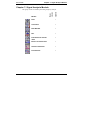
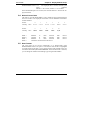
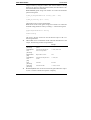
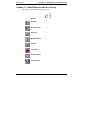
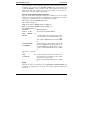
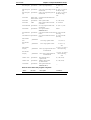
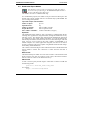
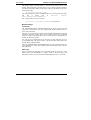
5.
ServiceLab Versions
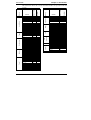
ServiceLab is available with optional features. The table below lists the features
available. Please contact your dealer or distributor for more information about
ServiceLab. Note that this User Guide includes information about optional features.
Optional features may vary by country. Check with your dealer or distributor
for details.
1-11
ServiceLab
Introduction
Control
Statistics
1-12
x
x
x
x
x
x
x
x
x
x
x
x
x
x
x
x
x
x
x
x
x
x
x
x
x
x
x
x
x
x
x
x
x
x
Network
x
x
x
x
x
x
x
x
x
Filter
Correlation
Data Window
Elektirc Characteristics
Harmonic Distortion
Period Check
FFT
Polar/Cartesian
Y/t Chart
X/Y Chart
Chart Recorder
Analog Meter
Digital Meter
Bar Graph
Status Lamp
List Display
Read Data
Write Data
Backup Data
ODBC In
ODBC Out
Average
Block Average
Separate
Merge/Expand
Cut Out
Shift Register
Time Slice
Circular Buffer
DataSocket In
DataSocket Out
Black Box
Ex/Import Black Box
Event Driven Actions
Message
Send E-Mail
Time Base
Signal Adaptation
x
x
x
x
x
x
x
x
x
x
x
x
x
x
x
x
x
x
x
x
x
x
x
x
x
x
Optional
Basic Version
Group
Signal Analysis
Display
x
x
x
Files
x
x
Module
Reduction
x
x
x
x
x
x
x
x
x
Data
x
Optional
Basic Version
Module
SIMATIC S7 read
Analog Input
Analog Output
Digital Input
Digital Output
Counter Input
Frequency Output
RS232 Input
RS232 Output
ICOMs Input
ICOMs Output
IEEE488 Input
IEEE488 Output
DDE Input
DDE Output
IVI Devices
MODBUS Devices
Combi Trigger
Pre/Post Triggering
Start/Stop Triggering
Trigger on Demand
Sample Trigger
Relay
Formula Interpreter
Arithmetic
Trigonometry
Scaling
Different./Integration
Logical Operations
Slope Limitation
Bit Logic
Gray Code
Flip-Flop
Channal Comparison
Reference Curve
Statistical Values
Position In Signal
Histogram
Regression
Counter
Minimum/Maximum
Pulse Width Analysis
Sort Channels
Check Reference Curve
Generator
Switch
Coded Switch
Slider
PID Control
Two-Point Control
Time Delay
Latch
TTL Pulse Generator
Global Variable Read
Global Variable Write
Signal Router
Blocktime Info
Stop
Special
Mathematics
Trigger
Input/Output
Group
The chart below shows the versions and which modules are provided with each
version.
x
x
x
x
x
x
x
x
x
x
x
x
ServiceLab
6.
New in ServiceLab Version 7.0
New in ServiceLab Version 7.0
Below, you will find an overview of the most important additions and changes
for the current ServiceLab Version. Please also read the README.WRI file for
additional changes made after this book was printed.
We have described the most important changes and additions to this ServiceLab
version on the following pages.
6.1. General
Replace Module
You can Replace modules by other modules of similar configuration. Use the
new command and select one of the available replacements from the list.
Start-Up dialog for Global Strings / Variables
Use the new Menu Command to configure the order in the list of strings/variables
that must be entered at the start of an experiment.
Import Global Strings / Variables
In addition to the *.VAR file format (generated by the global variables export
function) now you can import standard file formats *.CSV, *.TXT (Excel format)
with the command on the Options Menu. For the import an Excel table separated
by commas is needed.
In this way you can configure the global variables in an Excel table, where it is
easy to create similar configurations with Copy/Paste; ensure that you do not enter the same entries several times into the global variable dialog box.
Action/Layout Link Check
The renaming of modules which are referenced in Action modules or layout links
will now be handled appropriately. All action modules and layout objects with
references to the renamed module will use the new module name. You no longer
have to manually rename these links.
Also, deleting layout pages updates any links in action modules to the new Layout page numbering.
Block Move of Modules and Signal Connections
You can select a block of Modules and move them to another part of the Worksheet. All Connections are also moved.
1-13
ServiceLab
Introduction
User Defined Colors
If any user-defined colors are used in any dialog, such as for the layout background color, then these colours can be used in all other colour setting dialogs.
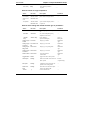
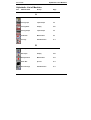
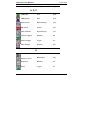
6.2. New Modules
See the Module Reference Guide for details of each new module.
Module
Module Group
Channel Comparator
Mathematics
BlockTime (optional)
Control
Shift Register (optional)Data Reduction
Multi-Speed Analog
Input
Input/Output (only available for selected drivers)
ICom Input
Input/Output
ICom Output (optional) Input/Output
MODBUS Analog Input/Output (optional)
Input/Output
MODBUS Digital Input/Output (optional)
Input/Output
Electric Characteristics
Signal Analysis
(optional)
Harmonic Distortion
(optional)
Signal Analysis
Period Check (optional)Signal Analysis
1-14
ServiceLab
New in ServiceLab Version 7.0
6.3. Module Changes
Statistical Values
The new Peak-to-Peak function computes the difference between the maximum
and the minimum of a block.
Scaling Module: Unit Conversion:
This new option converts the input value into one of several unit systems ServiceLab allows you to convert from one measurement system to another without
the knowledge of the necessary conversion constant. Conversions are included
for temperature, volume, pressure, length, mass, velocity, and more.
RS232 Interface (RS232 Input- and RS232 Output Modules)
Improved debugging and setup features are included in the RS232 monitor. Up to
30.000 characters of text are stored in the internal monitor buffer. The Format
String Debugging function is a useful tool for detecting errors in Format Strings
or to help in creating a Format String. A basic function of the Format StringDebugging is to mark Parser activities with colored characters. The parser divides the series of characters received into parts corresponding to the settings in
the Format String and assigns different colors to each of these elements.
Regression
The performance of the Regression Modules was improved. The block size of an
input block does not change, and the computation time per regression calculation
was more than halved.
Integration/Differentiation Module
The Differentiation/Integration module now allows a control input to reset the
module based on the control signal.
1-15
Introduction
1-16
ServiceLab
ServiceLab
Basic Techniques
Chapter 2: Getting Started
1.
Basic Techniques
Chapters 2 and 3 are designed to give you a quick first look at the program and to
let you start experimenting with it.
This chapter discusses the following subjects:
How to start ServiceLab.
How to obtain online help while working with ServiceLab.
How to create your first worksheet and become familiar with ServiceLab
’s basic functions.
You should be familiar with the basic techniques needed to operate your PC,
DOS commands (such as those concerning drives, directory changes and file
management), mouse operations and Windows fundamentals (like using menus or
window features, etc.).
If you require additional information, please refer to your Windows User’s
Guide and the documentation that comes with the corresponding software
and devices. The online tutorial supplied with Windows helps you to learn
basic mouse techniques.
ServiceLab uses features common to most Windows applications:
A menu structure with pull-down lists.
Scroll within windows using vertical and horizontal scroll bars on the
right and the lower window borders.
Drag elements across the working area by selecting the element and moving the mouse with the left mouse button pressed.
Drag groups of modules by selecting the group using the left mouse button
to click and drag a selection box. The left click on the selected area and
drag it to the desired location.
Dialog boxes provide option buttons, list boxes and text boxes to select
options and to enter parameters.
Right Mouse Button Functions in the Worksheet Window
The right mouse button has multiple functions within
ServiceLab, which are explained here and in Chapter 3.
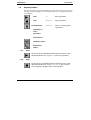
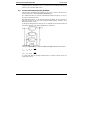
When the mouse cursor is on a module in the worksheet, you can display a context-sensitive pop up menu by pressing the right mouse button. The following
menu items are displayed:
Delete Module
Delete Input Channels (if module has any input channels connected)
2-1
Getting Started
ServiceLab
Delete Output Channels (if module has any output channels connected)
Cut (if module is selected)
Copy (if module is selected)
Replace Module
Search Module
Module Documentation (extended description of selected module)
Properties (Module dialog box for selected module)
If the mouse cursor is over a free area of the worksheet, the pop up menu
has the following entries:
Colors
Paste (insert previously copied or cut worksheet components at the position of pointer)
Properties (general worksheet settings)
To select the window mode:
Control Sequencer
Display
Worksheet
Layout
Worksheet Documentation Tool:
√ Edit Documentation (enables the documentation tool)
Create Documentation
Delete Documentation
Documentation Properties
Delete a Data Channel - Two separate clicks (not a double-click!) with the right
mouse button on the connection line between a module output and another module’s input deletes that data channel
Right Mouse Button Functions in the Control Sequencer
Click with the right mouse button on the background to open the popup context
menu to switch to the other window modes ( Worksheet, Layout, Display).
Right click on a flowchart junction to open a menu with the commands:
New (Flowchart or Action)
Comment Flowchart
Set Start Flowchart (The start flowchart is marked by an added “start”)
Load Flowchart
Delete Flowchart (with an additional security request)
For Action junctions the commands below are available:
New Action)
Edit Action
2-2
ServiceLab
Basic Techniques
Delete Action
Right Mouse Button Functions in the VITool Layout Window
If the mouse cursor is on an object in a VITool Layout Window, you can display
a context-sensitive pop up menu with the following items:
Cut
Copy
Delete
Up
To Front
Down
To Background Properties (Graphic Object)
If the mouse cursor is on a free area of the Layout Window, the pop up menu has
the following entries:
Paste
Object (to insert a new object)
Zoom
Full Screen
Delete Layout page
Switch to…
Worksheet
Displays
Control Sequencer
Global Layout Properties
Page Layout Properties
Right Mouse Button Functions in the Display Window
Display Windows: If the mouse cursor is on a display window, the pop up provides the window menu options (useful if the Menu Bar is hidden)..
Right Mouse Functions if the pointer is on Module, Function or
Status Bar
Module, Function or Status Bar (32-bit Version only): You can use the
right mouse button to activate or deactivate the Module, Function or
Status Bar. Activated bars are marked with a checkmark. The Module Bar
display can be defined by user (number of rows/columns).
Configure the Module Bar - Click on a Module Bar icon with the right
mouse button to assign any of the modules available in ServiceLab to that
button
2-3
Getting Started
ServiceLab
You can change the relative size of the Module Bar by choosing from the
selection of settings for the configuration of the Module Bar (1x40, 2x20,
4x10, etc.).
Configuring Hardware Module Input/Output Channels
Double-click the icon of an active channel on the Channel Selection Bar
with the right mouse button to deactivate that channel.
2.
Starting ServiceLab
2.1. Starting ServiceLab with a New Worksheet
From the Windows Start Menu
Click on the Windows Start button. Select Programs, then the
ServiceLab program group. Select the ServiceLab icon from that group to start
the program.
From the Windows Program Manager
Double-click the ServiceLab Icon displayed in the ServiceLab program group of
the Windows Program Manager. When you installed ServiceLab on your hard
disk, a new program group (“ServiceLab ”) was automatically created.
2.2. Starting ServiceLab with an existing Worksheet
From the Windows Program Manager
If you prefer to keep a program startup option without a worksheet, first
copy the ServiceLab icon. Select the icon, and press the F8 function key,
or choose Copy from the File menu.
Select either of the two icons (one mouse click), and press the
ALT+ENTER keys or choose Properties from the File menu.
Type the complete worksheet file name (including drive, directory, and
extension) after the ServiceLab command in the Command Line box. For
example:
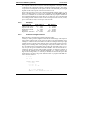
“C:\Program Files\SERVICELAB 7.0\SERVICELAB.EXE” D:\TESTS\TEST1.DSB
In the Description box, type a description that identifies the worksheet
that will be loaded onto the work area.
Press ENTER
Use this method to set up several icons to automatically open various
worksheets.
You will find additional information on Automatic Program Start options in
Chapter 6 of this User Guide.
2-4
ServiceLab
3.
Experiment Setup and Time Bases
Experiment Setup and Time Bases
General parameters for data acquisition and measurement control are set in the
Experiment Setup dialog. You can set the
Global Sampling rate per channel
Global block size
Global settings for Analog Output and Digital Output
Global clocking for the driver
Disk Streaming options
Driver specific settings, including driver buffer, acquisition mode, etc.
See Chapter 4: 1.4.8 Experiment Setup… on page 4-25 for more details.
In addition to the Global Sampling Rate, ServiceLab supports special drivers
that may also be able to generate their own clock. The NI-DAQ driver for National Instruments devices is one such special driver.
The Time Base Setup, in the Experiment Menu, allows you to review each of the
available time bases, and to configure them in one place. Various modules which
can generate data, such as the Switch or Slider Modules, have a user settable option to choose the time base, allowing you to synchronize the output with hardware generated data.
4.
Documenting your Worksheet
In addition to the module name and short description you can add an extended
description to each module inserted on a flowchart. You can also create documentation frames that are permanently shown on the worksheet background, behind or around one or more modules or just in an empty area.
Modules Documentation
The popup context menu, opened by right clicking the mouse over a module
shows the Module Documentation choice. Select this command to create a description with up to 256 characters.
Flowchart Documentation
In addition to the module documentation, you can insert information to the flowchart in text boxes, which are shown permanently on the background of the worksheet. A right mouse click on an empty area of the worksheet background opens
the popup context menu that offers several commands to Edit, Create and Delete
documentation frames where you can enter up to 256 text characters to be displayed. The Edit Documentation command activates (√ ) the documentation function. The Properties command enables you to modify the look of the frame (background, font and frame colors) and provides an edit area to insert any text up to
256 characters. You can choose any available font to apply to all of the charac-
2-5
Getting Started
ServiceLab
ters. Use the left mouse click to move (“catch” the upper left corner) or resize
(“catch” the lower right corner) the boxes.
A maximum number of 256 frames may be placed on each worksheet.
This new feature allows you to structure your flowchart with colored
frames. Put modules of the same functional group into boxes with
the same color (see the online help for a colored example).
5.
Context Menus
Right Mouse Click on Module
If the pointer is over a module on the worksheet, you can display a popup menu
by clicking the right mouse button. The following menu items are displayed:
Delete Module
Delete Input Channels (depending on position of pointer)
Delete Output Channels (depending on position of pointer)
Replace
Cut
Copy
Delete
Search Module
Module Documentation (Description of the lower module)
Properties (Dialog box for the module beneath the mouse pointer)
Context Menu: Right Mouse Click on Worksheet Background
If the pointer is on a free area of the worksheet, the popup menu has the following entries:
Colors
Paste (Insert components of worksheet at the position of the mouse
pointer)
Properties (general worksheet settings)
(to select the window mode)
Control Sequencer
Display
Worksheet
Layout
(Worksheet Documentation Tool)
Edit Documentation (enables the documentation tool)
Create Documentation
2-6
ServiceLab
Documentation Properties Using the ServiceLab Help System
Delete Documentation
6.
Documentation Properties Using the ServiceLab
Help System
Click on this Button to call up the ServiceLab Online Help or
choose Help from the Main Menu and select Index or one of the
other available options.
You can usually obtain information on the function you are currently using by
pressing the F1 function key or by clicking the Help button found in many dialog
boxes. Then, either specific information on the current function, command or dialog box, or the Help Index will be displayed.
You can obtain information on how to use the Windows Help system itself by
pressing the F1 function key while using a Help window or by choosing Using Help from the Help menu.
7.
Creating your First ServiceLab Worksheet
Follow this tutorial to create a simple worksheet and to learn about the basic
elements and functions of ServiceLab.
To start the program, double-click the ServiceLab icon in the
ServiceLab Program Group of the Windows Program Manager.
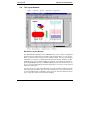
The ServiceLab screen will appear, displaying the Title Bar and the Main Menu
Bar, the Function Bar below them, and the Module Bar on the left of the window.
(These elements of the ServiceLab screen are described in Chapter 3.)
Press the F1 function key (or the Help button while working in a dialog box) to
obtain online help. If you prefer to follow these instructions on screen, press F1
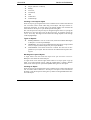
now, and choose Creating your First Worksheet from the Help Index page.
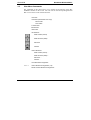
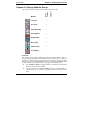
On the left hand side of the ServiceLab screen you can see the Module Bar. It
displays a selection of icons that represent modules frequently required in worksheets.
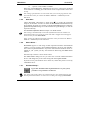
Place the mouse pointer on this Module Bar icon. It represents a
Generator module. Click the icon with the left mouse button. The
name of the module the mouse pointer is pointing at is displayed in
a small window above the module icons.
In the same way, choose the Y/t Chart module by clicking its icon
on the Module Bar with the left mouse button. You have now integrated these two modules into your worksheet; their symbols appear in the work area.
2-7
Getting Started
ServiceLab
Any module can be installed either by clicking the corresponding icon on the
Module Bar, or by choosing it from the Modules menu. While the Module Bar
can only offer a limited selection of icons, the Modules menu provides the complete list of available modules.
When you install a module from the Display group of the Modules menu (for example, a Y/t Chart module), an additional icon will appear at the bottom of the
screen.
The two modules in the worksheet must now be connected by data channels so
that data can be transferred between them.
To connect them, simply move the mouse pointer to the Y/t Chart module symbol,
press the left mouse button, and drag the module symbol to the Generator module
symbol (keeping the mouse button pressed down) until the output (O) and input
(I) symbols touch. When you release the mouse button, ServiceLab will automatically connect the two modules and route the wires.
You can also connect two modules without moving the module symbols – you’ll
do that in a few minutes.
The data channel is now complete; the output of the first module is connected to
the input of the second. The experiment can begin.
At the top of the ServiceLab screen, below the Main Menu Bar, you can see the
Function Bar. It contains icons that provide easy access to frequently used functions. When the mouse pointer is pointing at a Function Bar icon, a QuickInfo tag
with the name of that function will appear. Just click the icon representing that
function.
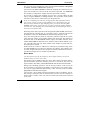
Use the left mouse button to click this icon on the Function Bar – the
first one on the left or press F5. This will start the experiment, and
soon the Generator module will generate a signal.
The signals and results of measuring processes can be displayed graphically using modules from the Display group. They consist of two elements each: the
worksheet symbol, which is integrated into the worksheet and connected to the
other modules by data channels, and the Display Window, which initially appears
minimized as an icon at the bottom of the computer screen, and which you must
separately restore (or “open”) to see the display during an experiment.
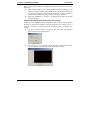
Open the Y/t Chart Display Window using the left mouse button, either
by clicking this Function Bar icon (it represents the Show Display
Windows command from the View menu) or by double-clicking on the
display window icon at the bottom of the desktop.
The Y/t Chart Display Window appears, and you can observe the signal generated
by the Generator module as it is shown on the display.
Before you perform the next steps, please drag the Y/t Chart Display Window to a
position above this Help window, so that it does not hide any elements of your
worksheet. It may be necessary to adjust its height first. You can drag a window
2-8
ServiceLab
Creating your First ServiceLab Worksheet
by clicking its Title Bar with the left mouse button and moving it to its new location with the mouse button pressed down.
By alternately clicking this Function Bar icon with the left mouse
button you can pause the running experiment or resume it at the same
stage at which you interrupted it. Pressing CTRL+F6 on your keyboard has the same effect.
Click the right mouse button on the Y/t Chart Display Window screen: the Color
dialog box appears. Select a new color for the display background by clicking
the colors on the palette and pressing OK.
Now stop the experiment. You can either click this icon on the Function Bar or press CTRL+F5 on your keyboard.
If you cannot see the Y/t Chart module symbol (in the work area) because it is
hidden behind the display window, drag the window to one side or reduce it to
an icon by clicking the Minimize button (the down arrow in the upper right-hand
corner of the display window).
Use the right mouse button to double-click the Y/t Chart module symbol on the
worksheet to open a dialog box. Select Delete Module and press OK to delete the
Y/t Chart module from your worksheet.
Now add the Bar Graph module to your worksheet by clicking its
icon on the Module Bar with the left mouse button. The module
symbol appears in the work area, and the icon representing the corresponding display window will appear on the lower edge of the
desktop.
Connect the input of the Bar Graph module symbol with the output of the Generator module symbol as described above.
Open the Bar Graph display window either by clicking this Function
Bar icon or by double-clicking the display window icon at the bottom
of the desktop.
Start the experiment again; the Generator signal will appear in the
Bar Graph display window.
Stop the experiment,
and click the Module Bar icon representing the Digital Meter module.
The module symbol appears on the worksheet next to the Bar Graph
module symbol, and the corresponding display window icon appears
at the bottom of the desktop.
Move the Digital Meter module symbol around the worksheet by clicking and
holding the left mouse button while you drag it to various locations.
2-9
ServiceLab
Getting Started
For example, drag it below the Bar Graph module symbol. ServiceLab will arrange the blocks evenly according to the grid settings defined in the Window
Setup dialog box from the Options menu.
The quickest way to connect the Digital Meter module to the Generator module is
to “tap” the existing data channel between the Generator module and the Bar
Graph module. To create a branch, use the left mouse button to click anywhere
on the data channel between the two module symbols. The mouse pointer takes
the shape of a hand holding a plug. Place the tip of the plug precisely onto the input symbol (I) of the Digital Meter module symbol, and click the left mouse button
again. This establishes the connection, and the Autorouter automatically finds the
correct path for the new data channel segment.
You can now start, pause, and resume the experiment. Practice changing the color
of the display by double-clicking the Digital Meter icon at the bottom of the
screen, to change the color of the display as described above.
The default signal generated by the Generator module is a square wave. Doubleclick the Generator module symbol with the left mouse button. You can select
various settings in the dialog box to define the signal to be generated. Refer to the
Module Reference Guide or press the F1 function key to obtain information on
the parameters.
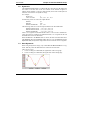
Click the Sine button in the Wave Form box, and then click the OK button. The
Display modules will display the selected signal type.
The Y/t Chart module can be used now to visualize the sine wave.
Since you previously deleted the Y/t Chart, click on the Module Bar
to bring the Y/t Chart back onto the worksheet. (If your experiment is
still running, you must first stop it before making changes in the experiment setup.)
Create another data channel branch to connect the Y/t Chart module
symbol, and then start the experiment again.
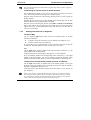
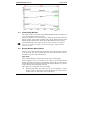
You should Save your first worksheet now, so that you can use it to try out some
more of ServiceLab’s options later on.
First, stop the current experiment,
And then click this Function Bar icon with the left mouse button. It
represents the Save command from the File menu.
A dialog box appears. In it, the File Name box displays a list of demo worksheet
files that were copied to the ServiceLab directory during the setup procedure.
These files will give you examples of the wide range of measuring and data acquisition tasks that can be solved by ServiceLab. You can open, run, modify and
re-run them all later. Their File Info box contains a description of each worksheet.
2-10
ServiceLab
Creating your First ServiceLab Worksheet
Type a file name of your choice (using no more than eight characters) in the File
Name box; for example, type TUTOR1. Choose the OK button, and your worksheet will be saved as TUTOR1.DSB in the ServiceLab directory. (ServiceLab
automatically adds its standard extension .DSB.) The ServiceLab window Title
Bar now shows the file name.
To open this (or any other) worksheet file later, click the File Open
icon on the Function Bar with the left mouse button. This icon is a
shortcut to the Open command on the File menu.
Congratulations! You have successfully finished the ServiceLab basic lesson and
are now ready to begin working with ServiceLab!
The next time you have a question or need help, you can
Read these instructions again
Find the answers in other chapters of the ServiceLab documentation
Use Online Help. You can obtain Online Help by pressing the F1 function
key whenever you need help; or use the Search function in the Help window
Unless you prefer to continue experimenting with ServiceLab, exit the program
now by double-clicking the Control Menu box in the upper left corner of the ServiceLab window, or by pressing ALT+F4 on your keyboard.
2-11
ServiceLab
ServiceLab
The Elements of a Worksheet
Chapter 3: Creating an Experiment Setup
This chapter describes ServiceLab’s basic elements and functions used to set up
a data acquisition experiment.
Read these pages at your computer so that you can try out all the functions provided by ServiceLab. This chapter can also be used as a reference.
This chapter addresses the following topics:
The elements of an experiment setup
The elements of the ServiceLab screen and how to use them effectively
A brief overview of the module groups
A systematic approach to a data acquisition task to be solved on screen.
An overview of the VITool Layout windows
1.
The Elements of a Worksheet
The worksheet graphically displays the complete experiment setup or measurement procedure, including all the modules and data channels. The maximum
size of a worksheet in pixels is 2000 (vertically) by 2000 (horizontally). It is independent of the screen resolution.
1.1. Modules
A module represents a functional element in the ServiceLab experiment setup
(worksheet). A worksheet can contain up to 256 modules.
The functions symbolized by the modules comprise all the operations required
for an experiment:
Data acquisition (by a data acquisition board) or signal generation (simulated by a software generator)
Data analysis, evaluation and processing (mathematics, statistics, control,
trigger and other functions)
Presentation on screen (display instruments) or export for documentation
purposes (printer, metafile, etc.).
Most modules can be configured with up to 16 inputs and outputs.
A module can be installed on the worksheet by choosing it from the Module menu
or by clicking the icon on the Module Bar.
You can find detailed information about the Module menu functions in Module
Reference Guide. The Module Bar is described in detail on page 3-21 in this
chapter.
Icons in the Module Bar appear slightly different from the worksheet symbols.
Additionally, modules from the Display module group have a display window
symbol.
3-1
Creating an Experiment Setup
ServiceLab
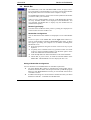
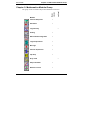
Module Bar Icons
On the Module Bar, the modules are represented as simplified icons at a slightly
reduced scale. The name of the module selected by the mouse is displayed above
the Module Bar.
Click the Module Bar icon with the left mouse button to add that module
as a symbol to the worksheet, where it takes the first available free space.
The exact position depends on the Spacing value entered in the Window
Setup box of the Options menu.
Click any Module Bar icon with the right mouse button to assign any of
the available ServiceLab modules to that position in the Module Bar (see
page 3-21 in this chapter for a complete description of the Module Bar
and techniques to customize it.)
The Module Bar can only display a limited selection of the modules
available in ServiceLab. The exact size of the Module Bar depends on the
screen resolution of your PC. All the available modules can be accessed
from the Module menu. Please refer to Module Reference Guide of this
manual for complete module documentation.
Worksheet Symbols
In the worksheet, modules are represented as complete symbols. These symbols
display each module’s name and the input and output channels you have selected
for it.
Use the left mouse button to double-click on the symbol to open the dialog box to configure the module.
Use the right mouse button to double-click on the symbol to open the dialog box to delete the module from the worksheet or to delete its input or
output data channels.
Click and hold the left mouse button to drag and drop the symbol to any
position on the worksheet (depending on the Spacing value entered in the
Window Setup box of the Options menu).
When positioning modules manually in the worksheet, leave enough
space between the module symbols for data channels to be created
later. If you try to connect two modules and there is not enough space
to arrange the data channels, an error message will appear: “Connection is not possible.”
The modules from the Display module group provide an additional display window, which initially appears minimized at the bottom of the
screen.
Module Manipulation by Keyboard
The modules on the worksheet can be manipulated in various ways. The module symbols on the worksheet can be dragged about, connected by data channels,
3-2
ServiceLab
The Elements of a Worksheet
configured, or deleted. The last two of these manipulations can also be done using the keyboard.
First, select the module. Only one module in the worksheet can be selected and
manipulated at a time. When a module is selected, the Module Name Title Bar is
highlighted in an inverse color.
To select a module, click it once with the left mouse button, or press the
TAB key on your keyboard until that module is selected.
When you press the ALT+ENTER keys, the module configuration dialog
box appears. Press the TAB or SHIFT+TAB keys to move from one field
or button to another; select items by pressing the arrow keys, the SPACE
and ENTER key.
Note: Channel selection can only be done using the mouse.
To copy setting for the selected channel to the other activated channels,
use the F7/F8 function keys. This procedure can only be done using the
keyboard.
To delete the selected module from the worksheet, or to delete all the input and/or output channels of that module, press the DEL key. In the dialog
box that then appears, select the desired option, or choose Cancel, and
press ENTER.
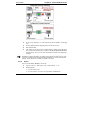
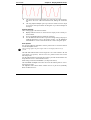
1.2. Data Channels, Junction Points
A data channel is the connection between the output of a module and the input of
another module. Data is transferred between the respective modules via these
connections.
A branch is a data channel segment that branches off from another data channel at
a junction point.
Branches allow you to connect the output of one module to the inputs of several
other modules.
By creating branches each module output can be connected to up to 16 inputs of
other modules.
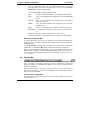
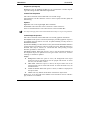
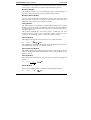
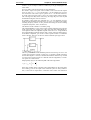
In the worksheet, lines like these represent data channels, branches and junction
points:
Data channel (wire)
Branches and junction points
No connections
You can choose the colors of the wires using the Colors command from the Options menu. Different colors can be specified for the wire cores and the wire
sleeves.
3-3
Creating an Experiment Setup
ServiceLab
When you connect the modules, the Options Autorouter menu function allows the
following.
When the Autorouter is active, ServiceLab automatically finds the correct
paths for the data channels. ServiceLab ensures that the data channels do
not run across modules or hide other data channels. A control window in
the Status Bar displays the progress of the autorouting operation.
When the Autorouter is not active, you determine the paths of the data
channels manually.
Channel FIFO Status while measurement is running
In addition to the Animation options (View Menu), there are three ways to monitor
the flow of data between modules while the measurement is running. This is a
useful set of features for ensuring that the worksheet logic is working as designed.
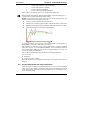
Use the left mouse button to click on a data line. This simple display
shows the data value and block size.
Press on the Shift key and click on the data line with the left mouse button. This auto scaling chart displays all of the data in a block.
3-4
ServiceLab
The Elements of a Worksheet
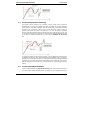
Press the Control (Strg) key and click on the data line with left mouse
button to display the status of the data channel during measurement.
1.2.1
Creating Data Channels or Branches
The Quick Way
To connect a module, simply drag it against the module to which it is to be connected until the output (O) and input (I) symbols touch. When you release the
mouse button, ServiceLab will automatically connect the two modules and route
the wires (whether the Autorouter option is active or not).
This procedure works with modules with any number of input or output channels,
and it is very useful when connecting modules with multiple inputs and outputs.
It works when both modules are configured differently, when different channel
numbers have been selected, and when some of their inputs or outputs are already connected to other (i.e., a third) modules.
For example, you can activate four output channels of a Generator module, then
connect two of them to Display modules, and the remaining two to modules from
the Signal Analysis group.
Once a connection has been established between two modules, no further connections (between the other – still unconnected – outputs and inputs of these two)
can be created in this simple way. You must then proceed as described below.
With the Autorouter Option ON
Click the left mouse button once at the point where you wish the data channel to
begin – the output symbol (O) of a module or – for a branch – any position on the
wire. The mouse pointer then changes into a plug symbol.
3-5
Creating an Experiment Setup
ServiceLab
Then place the tip of that plug symbol on the input symbol (I) of another module.
Note that the input of the second module must be open. While you do this, a thin
black line is drawn from the starting point of the connection.
Click the left mouse button again, on the input symbol at the end of the connection, to establish the connection.
Undo last Step: use ALT+BACKSPACE to remove the last connection
and restore the worksheet.
To cancel the process, click the left mouse button once anywhere outside
the input symbol.
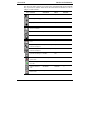
With the Autorouter Option OFF
Click the left mouse button once at the point where you want the data channel to
begin – the output symbol (O) of a module or – for a branch – any position on any
wire. The mouse pointer then changes into a branch symbol.
Draw the new data channel by moving the mouse. While creating each segment,
you can lengthen or shorten it only in the vertical or horizontal direction indicated by the branch symbol. You need not move the mouse pointer exactly along
the future track of the channel.
Click the left mouse button again to freeze the length of the data channel segment
you have just created and switch to the other axis (horizontal or vertical) for the
next segment.
When the data channel hits a module, you must guide it around it.
When the tip of the new data channel is aligned with the input symbol of the desired module input, click on the input symbol to complete the data channel connection.
To undo the last segment, click the right mouse button once.
To cancel the process, double-click the left mouse button anywhere.
To undo the last data channel connection, use the ALT+Backspace key
combination.
To Create a Branch
When the output of a module is to supply data to more than one input of a module,
simply create a branch. Click the left mouse button once anywhere on the data
channel where you want the channel to branch off. Create the connection to the
module input as described above.
1.2.2
Rearranging Data Channels or Branches
To Rearrange a Data Channel
First delete the data channel by clicking the channel twice with the right mouse
button, and then create it again on a different track.
3-6
ServiceLab
The Elements of a Worksheet
Note that the deletion of a data channel segment may delete further segments
and/or branches.
To Rearrange A Junction Point On A Data Channel
Use the left mouse button to click once at the junction point that you want to
move. The mouse pointer then changes into a branch symbol.
Drag the small box that now represents the junction point to its new position on
the data channel.
Establish the new position by clicking the left mouse button again. All the data
channels affected will be automatically rearranged.
Note that you can only drag the junction point either vertically or horizontally
along a data channel. If you want to move it around a corner you must first drag it
right to the corner, click the left mouse button, and then move it in the other direction in a second step.
1.2.3
Deleting Data Channels or Segments
The Quick Way
Use two separate right mouse button clicks (not a double-click!) on the data
channel to be deleted:
At the first click, the section that is to be deleted will change its color.
At the second click it will be deleted.
To cancel the process, click anywhere on the screen but on the same section the
second time. The data channel will then resume its previous color.
-OrUse the right mouse button to double-click at the end of the connection (i.e., the
input symbol of the second module).
Confirm the deletion in the dialog box that appears, or choose Cancel.
If you accidentally double-click the beginning of the connection (i.e., the output
symbol of the first module), you will be asked to confirm the deletion of that
module (instead of the data channel). Click the Cancel button in the dialog box.
To Delete ALL the Input and/or Output Channels of a Module
Use the right mouse button to double-click on the module symbol. To use your
keyboard, select the module first by repeatedly pressing TAB until the module’s
Title Bar is highlighted, then press DEL.
In the dialog box, click the desired option, then choose OK, or press ENTER on
your keyboard.
Please note that any confirmed deletion will always be executed in compliance with the other elements of the worksheet. This means that if, for example, you delete a channel section that divides up into branches in its further
course, and all those further branches will be deleted too.
3-7
Creating an Experiment Setup
2.
ServiceLab
The ServiceLab Screen
2.1. The Worksheet Window
Work Area: Worksheet Window
The work area is where you create the virtual ServiceLab experiment setup (the
worksheet). It consists of the module symbols and the data channels connecting
them.
You can install modules in the worksheet either by choosing them from the Modules menu or by clicking the corresponding icons on the Module Bar.
Data channels must then connect these modules. Every module input must be connected before you can start the worksheet. You do not have to connect every
module output.
3-8
ServiceLab
The ServiceLab Screen
A worksheet can contain up to 256 modules. The maximum size of a worksheet in
pixels is 2000 (vertically) by 2000 (horizontally) regardless of the screen resolution.
The size of the worksheet segment that is actually displayed in the workspace on
your screen depends on your display adapter. The area available for a worksheet
is much larger than can be displayed on screen at one time.
You can drag any module to any position on the entire worksheet. Click it
once with the left mouse button, and then move it with the mouse button
held down. If you touch the window frame, the window will automatically move on across the worksheet in that direction.
Use the scroll bars to pan horizontally and vertically around the worksheet.
You can also use the SPACE bar. The cursor will change into a MOVE
cursor within the worksheet area. You can now pan the worksheet just by
using the mouse. Press the SPACE bar again to switch to normal mode.
You can drag any module symbol to any location in the worksheet by
placing the mouse pointer on it, and pressing and holding down the left
mouse button while moving the mouse. If you touch the window border
while doing this, the worksheet display will scroll until you release the
mouse button, placing the module symbol at the new location.
To Display More of Your Worksheet
Remove the Function Bar and/or the Module Bar from the ServiceLab
window. Choose these options from the View menu, or press ALT, V, F or
ALT, V, M.
To view the complete worksheet in a separate window, choose the Overview option from the View menu, or click the corresponding icon in the
Function Bar. However, you cannot edit or change it there. The display is
automatically scaled to the size of the worksheet.
To enlarge the window to its maximum size, click the Maximize button in
the upper right-hand corner of the ServiceLab window, or choose Maximize from the Windows Control menu. The worksheet will fill the entire
screen. Other Windows applications, such as the Program Manager, run in
the background. After you enlarge the window, the Restore button replaces the Maximize button. Click the Restore button to return the window
to its previous size.
To Change the Appearance of the Worksheet
To change the grid, type of grid, or grid spacing of the ServiceLab worksheet, choose the Window Setup option from the Options menu.
To change the colors of the ServiceLab worksheet, choose the Colors option from the Options menu.
To change the colors of the ServiceLab window frame, Menu Bar, etc.,
choose the Color option from the Windows Control Panel.
3-9
Creating an Experiment Setup
ServiceLab
Shortcut menu: you can right-click over the worksheet work area to display a contextual menu. You can change colors, switch to other modes, or
display properties for this view.
Worksheet Documentation Area
You can insert information about the worksheet into text boxes that are shown on
the background of the worksheet. Use the right mouse button to click on an empty
area of the worksheet background and open a context menu that allows you to
Edit, Create and Delete text boxes. You can insert up to 256 characters of text,
change the font, or modify the background color/style.
Use the left mouse click to move (“catch“ the upper left corner) or resize
(“catch“ the lower right corner) the boxes.
Open a New Layout Window
Choose the New Layout Option from the Window menu. An empty window will
appear. The Layout Window Function bar and Tool box are now available.
You can place graphical objects and imported bitmaps on this worksheet. You
can create links to visualization modules of the flowchart. Previously opened
display windows stay open.
To hide all elements of the worksheet, choose the View: Full Screen option. The
Layout will be displayed, filling the complete screen. Open display windows are
hidden.
Since all control elements are hidden you can only start measurement by using
the F5 key. To stop, use ALT+F5. ESC switches to the window mode of the
VITool.
3-10
ServiceLab
The ServiceLab Screen
2.2. The Display Tree View
Work Area: Tree View/ Display View
The measurement setup is displayed in a structure similar to the Windows Explorer (32-bit version only). All elements of the worksheet are shown, starting
with the layout pages, the modules and black boxes, and finishing with global
setup, including global strings and variables. When you click on one of the tree
elements, the next branch opens or the appropriate Dialog box opens.
Shortcut menu: you can right-click over the worksheet work area to display a
contextual menu. You can change colors, switch to other modes, or display properties for this view.
3-11
Creating an Experiment Setup
ServiceLab
2.3. The Control Sequencer Window
To control a multi-step application consisting of more than one ServiceLab
worksheets calling each other, ServiceLab offers a new tool, shown as new display window (analogous to the worksheet, display and VITool windows), called
the Control Sequencer Window. The contents of the window is stored in a new
type of file, the Control Sequencer file (saved with the suffix *.DSQ.)
The window shows a tree display of the control sequence. You can add any
number of worksheets into the Control Sequencer File, whose name is shown as
root of the tree.
You can also multiple actions for each inserted worksheet to control the flow of
the worksheets.
In the Control Sequencer window you can load and save *.DSQ files using the
main menu file commands: New, Open, Save and Save As….
To insert flowcharts or actions you need to use the pop-up context menu that appears when you right mouse click on one of the junction points on the screen. Depending on the junction (flowchart or action) the pop-up menu offers several
commands to add, delete or to edit the object.
3-12
ServiceLab
The ServiceLab Screen
The Sequence file is a binary file type. You cannot edit it with ASCII Editor
programs such as Notepad.
Work Area: Control Sequencer View
The window shows a tree display of the control sequence. You can add any
number of worksheets into the Control Sequencer File. The Control Sequencer
filename is shown as the root of the tree.
Also you can define several actions for each inserted worksheet to control the
flow of the worksheets.
In the Control Sequencer window you can load and save *.DSQ files using the
main menu file commands: New, Open, Save and Save As….
To insert worksheets, simply right mouse click on the root symbol to open the
context menu. The new flowchart command opens the standard explorer window
dialog box to select any flowchart. If there is a flowchart already inserted, the
context menu offers additional items to handle flowcharts and actions (insert, delete…).
Control Sequencer Flowchart Junction
You can add any number of worksheets into the Control Sequencer File. The inserted flowchart is shown as new flowchart junction.
Double-click on the junction or select the Comment Flowchart context menu
command to add or edit a description of the junction.
Control Sequencer Action Junction
You can add any number of actions to each flowchart in the Control Sequencer
File. The inserted actions are shown as new branch of a flowchart junction.
Each action will be processed if the defined condition is fulfilled. The conditions depend on the settings of global variables or strings or are global events
such as Start/Stop of measurement. All global actions are allowed.
Double-click on the junction or use the Edit Action context menu command to
modify the action
Sequencer Action Dialog
You can edit the actions assigned to each flowchart in the control sequence file.
The Action selection field offers all global actions. The dialog box may change
depending on the action you have selected. Functions that control changing values
are always assigned to global Variables (Event Parameter: Variable No setting.).
Function
The action is initiated...
Rising Edge:
When the variable changes from TTL Low (value 0)
to TTL High (value 5).
Falling Edge:
When the variable changes from TTL High (5) to
TTL Low (0).
3-13
ServiceLab
Creating an Experiment Setup
When the variable rises above the specified
threshold value.
Threshold Underflow:
When the variable falls below the specified
threshold value.
TTL High Level:
When the variable is TTL High (5).
TTL Low Level:
When the variable is TTL Low (0).
Input larger than Threshold As long as the variable value is larger than the
threshold value.
Input smaller than Thresho As long as the variable value is smaller than the
threshold value.
Start/Stop of Measuremen At the beginning and/or at the end of the measurement.
Global String has changed If the named global string has changed during
measurement.
Input value has cha If the variable value has changed
Threshold Overflow:
0.001%):
Value is reached (+/- 0.001 If the variable reaches the defined value.
Always:
Never:
The action is constantly initiated.
The action is never initiated (NOP).
Global variables and strings are always saved with the corresponding flowchart. In exactly the same way, the Global Variables and Strings used in the
event-driven actions in the sequence window are stored in the worksheet file
of the corresponding flowchart where the action is defined in the sequence. If
the variables or strings are to be used in other flowcharts you must save them
using the actions Write String/Variable to INI file and Read String/Variable
from INI file to save and reload the values separately.
You will find more information about Event driven Actions parameters in the Action Module description.
Control Sequencer File
The Control Sequencer file stores all settings made in the tree. You can add any
number of worksheets into the Control Sequencer File.
You can define several actions for each inserted worksheet to control the worksheet flow.
The Control Sequencer files (*.DSQ) can be loaded and saved using the main
menu file commands: New, Open, Save and Save As….
Sequencer Comment Dialog
This dialog is used to add an additional description to each flowchart in the sequence file. The description is linked in the Control Sequencer mode to the name
of the corresponding flowchart.
3-14
ServiceLab
The ServiceLab Screen
2.4. The Layout Window
Work Area: Layout Window
The ServiceLab Visualization tool (VITool) allows you to connect a bitmapped
graphical object with the active Elements of the Layout Window, so you can generate a practical on-line display of relevant data values. You can use technical
worksheets or pictures as background and place the Display Windows of ServiceLab on the screen. Status Lamps, for example, are symbols of running engines, Digital Meters show rpm, and Bar Graphs can look like thermometers - all
to give you quick information about the temperature of a vessel or the status of
other parts of the plant.
You can create up to 200 Layout Windows for each worksheet window using the
main menu option window. The size of the working area can be specified in one
of several DIN formats or adapted to the screen size. The zoom function allows
you to scale parts of the screen for better handling.
3-15
Creating an Experiment Setup
ServiceLab
Full size mode allows you to hide all functional elements such as the Function
Bar, Title Bar, etc. This mode is very useful for Online Presentation where you
want to display only the custom designed display, not the program elements.
Work Area Layout Window
The work area is where you create a Layout belonging to the ServiceLab experiment setup (the Worksheet). The size of the worksheet segment that is actually displayed on your screen varies depending on your display adapter. In any
case, the area available for a worksheet is much larger than can be displayed on
screen at a time. You can use the scroll bars to pan horizontally and vertically
around in the worksheet. You can also use the SPACE bar. The cursor will
change into a MOVE cursor within the worksheet area. You can now pan the layout just by using the mouse. Press the SPACE bar again to switch to normal
mode.
You can create objects in the work area either by choosing them from the Object
menu or by clicking the corresponding icons on the Tool Box. These objects are
placed onto the worksheet by drawing a frame with the mouse. Linked objects
are connected to Display Modules of the Worksheet. You can scale or move objects on the worksheets
Shortcut menu: you can right-click over the worksheet work area to display a
contextual menu. You can select objects to add to your layout, switch to other
modes, or display properties for this view or the layout page.
New Layout
Window Menu Command: New Layout
Use this command to create a new Layout window. Up to 200 Layout sheets can
be created with 512 Layout objects. The name of worksheet and the first nine
Layout windows are displayed below the menu commands. If there are more than
ten windows you can use the more command to see them.
Properties of the Layout Page
Double-click with the left mouse button on an empty part of the Layout Window,
or, use the Properties Object Menu Command to view the Properties Dialog Box.
Tool Box
When a Layout window (optional) is active, the Tool Box will also be shown.
Select a tool by clicking on the Symbols.
The following tools are available:
Selection Tool
Line
Rectangle (filled or not filled)
3-16
ServiceLab
The ServiceLab Screen
Ellipse (filled or not filled),
Bitmap,
Text Line,
Text Block,
Grid
Linked Text
Linked Graph
Creating a new Layout Object
Select an object type using the menu or the ToolBox. Draw a frame of the desired
size. You must create a frame when using a Text Object. The object will be inserted into the frame. To set the object’s properties double click with the left
mouse button on the object to open the Properties Dialog Box.
The size and position of objects may be changed using the mouse or by using the
keyboard. To move the object just use the arrow keys, to resize the objects use
CTRL+ arrow key. The degree of movement and scaling depends on the settings
in VITool page setup.
Types of Objects:
Drawing Elements: You can create Lines, filled and unfilled Rectangles
or Ellipses. You can import Bitmaps.
Visualization: You can create Linked Elements that import strings (Linked
Text) or Graphs (Linked Graph) into your Layout Window.
Text Elements: Text frames with Line or Block Text can also be integrated into your Layout. The text itself can be edited in the Properties dialog box
Working with Layout Objects
A single mouse click will select the object. Now you can resize or move it.
Backspace will delete the selected object.
A single mouse click with the right mouse button on an object opens a pop up
menu. (You cannot change objects while the measurement is running.) Double
mouse click on the object to open the Properties dialog box for that object.
Creating an Object
Select an object type using the menu or the ToolBox. Draw a frame of the desired
size. You must create a frame for a Text Object. The object will be inserted into
the frame. Open the Properties dialog box by double clicking the left mouse button on the object.
3-17
Creating an Experiment Setup
ServiceLab
Passive Elements
In the ServiceLab Layout Window (optional) there are some objects that are created on the worksheet although they don’t have a direct connection to modules on
the worksheet. These passive elements are simple graphical objects such as
lines, circles, ellipses (filled or unfilled), or text. Position, size and color are
freely selectable for each element. You can modify other properties for each
element, too. Passive elements are useful to create an attractive layout page design. Block text with scaleable font size is useful to display information about the
layout (for example, the measurement parameters).
You can also specify the text line object: Using field placeholders, you can insert
the current time, date or other system information.
Active Elements
Another group of objects shows the unique features of the VITool (optional).
These active connected objects create a direct link with modules on the ServiceLab worksheet. Information that is displayed in the display window of the
visualization module can be integrated into the Layout Window and can be dynamically updated as the data changes. The VITool (optional) is a perfect instrument to create an online data acquisition and visualization setup that reflects
your ideas and creativity. Available active elements are linked with graphical
and text objects.
Linked graphical objects import graphical information from the display windows
of visualization modules into a Layout Window. You can show the curves of Y/t,
X/Y or Recorder module as well as the display of Analog, Digital Meter or Lamp
and Bar Graph or you can display an alert message from the message module.
A special feature links an object to the Switch module: You can show the state of
the switch and operate the module from the Layout Window. This allows you to
interact with the measurement when the Layout Window is in full screen mode.
Graphics
The ServiceLab VITool allows you to import bitmapped graphics objects and
use them as background in the Layout Window. You can use plant flowcharts and
other pictures as background in the Layout Window and you can place other passive or active elements over them. For example, status displays placed over machines show activated engines, a Digital Meter shows their rotational speed, Bar
Graphs shaped as thermometers quickly inform you of the temperature of several
parts of a plant. You can even insert your own logo into the layout. Only the reference address of the picture files (*.BMP and *.WMF format only) are saved
with the worksheet or with the layout file. The original picture file must be separately saved in the correct directory to be displayed in the Layout Window.
You cannot use pictures and drawings created by CAD programs. You must
first convert the files into .BMP or .WMF format using appropriate conversion
software.
3-18
ServiceLab
The ServiceLab Screen
2.5. VITool Toolbox
The Layout Window Toolbox allows you to quickly select a Layout
Window Drawing Object.
2.6. Title Bar
The Title Bar is the upper border of the ServiceLab window and shows the name
of the application (ServiceLab) and the file name of the current worksheet. If the
current worksheet has not yet been saved, “Untitled” appears as a placeholder.
2.7. Menu Bar
Below the Title Bar, the Menu Bar lists the Main Menu Options. Each menu contains a list of commands or actions. You can open each of these lists by clicking
the Main Menu Option on the Menu Bar with the left mouse button, or by pressing the ALT key and then typing the letter that is underlined in the Main Menu
Option.
In the picture above, you see the list of Options menu commands.
You can then choose an option from that list by clicking it, or by typing the letter
that is underlined in the menu item without pressing the ALT key, or by using the
arrow keys on your keyboard and pressing ENTER. The display field in the left
half of the Status Bar will often contain information describing the current menu
item.
3-19
Creating an Experiment Setup
ServiceLab
In the picture, the Wire Sleeve option from the Colors submenu is selected (highlighted). Click it, or press the ENTER key, to carry out that command.
The following Windows menu conventions provide additional information about
the menu items.
An ellipsis (…) following a command indicates that a dialog box appears
when you choose that command. There, further options must be selected
before the command can actually be carried out. For example:
Output Setup… (Experiment menu)
A triangle (X) next to a command indicates that a cascading menu appears
when you choose that command. That submenu contains further commands. For Example:
Module Bar X (Edit menu)
A check mark ( ) next to a command means that the command is already
in effect. After selecting that command again, the command is no longer in
effect, and the check mark disappears. For example:
Auto Start
(Experiment menu)
Dimmed commands cannot be used at the current time. For example, another command must be chosen first to enable that command. For example:
Stop
(Experiment menu)
Stop is only available after Start is chosen, and vice versa.
A key combination next to a command is a shortcut for the command. To
use your keyboard instead of your mouse, the key combination has the
same effect as clicking, or choosing, the command from the menu list. For
example:
Pause CTRL+F6 (Experiment menu)
The icons on the Module Bar and on the Function Bar also represent
menu functions. Clicking these icons with the left mouse button is the
easiest and quickest way of choosing a menu command.
3-20
ServiceLab
The ServiceLab Screen
2.8. Module Bar
The Module Bar, at the left of the ServiceLab window, displays a selection of frequently required modules in icon form. The size of the Module
Bar depends on the screen resolution of the computer’s display.
Use the left mouse button to click on the icon that symbolizes the module
you want to add to your worksheet.
There are only a limited number of spaces on the Module Bar; therefore
not every available module can be displayed on the Module Bar. You
can customize the Module Bar to display only the modules that are
needed most frequently.
Module Type Display
The name of the module the mouse pointer is pointing at is displayed in a
small window above the module icons.
Module Bar Configuration
You can determine which modules are displayed as icons on the Module
Bar.
Click on a square in the Module Bar with the right mouse button to assign any of the modules available in ServiceLab to that square. A dialog
box appears presenting the complete list of modules including their
Module Bar icons.
Scroll through the list using the scroll bar or the arrow keys on your
keyboard.
To quickly select a module in this list, type the first letter of its name
to move to the first matching module. Type the letter again to move
to the next module that starts with that letter.
Click the Help button to obtain information on the selected module.
Choose OK, or press ENTER, to install the selected module on the
Module Bar. The Module Bar will now display the new icon.
Saving a Module Bar Configuration
You can customize several Module Bars for individual experiments.
All of the Module Bar settings are automatically saved together with information about the window size and position when you exit the program.
When you start ServiceLab the next time, you will find the same work environment as before.
In addition the settings are saved with the worksheet file when you choose
the Save or Save As… commands from the File menu.
3-21
Creating an Experiment Setup
ServiceLab
You can individually save your customized Module Bars to files and
open them when you work with similar tasks or you can open the Default
Module Bar provided by ServiceLab.
Use the Module Bar command in the Edit menu:
provides a blank Module Bar to be configured individually.
Open…
opens a saved Module Bar configuration onto the ServiceLab
screen.
Save As… saves the current Module Bar configuration to a file under a
name of your choice.
Default
opens the default Module Bar configuration onto the ServiceLab screen.
Basic
Displays a limited number of modules, suitable for beginners
Displays more modules, appropriate for experienced usIntermediate
ers
Advanced Displays modules appropriate for “power users.”
New
For details about these menu functions refer to Chapter 4 of this manual.
Removing the Module Bar
To enlarge the display area for your worksheet, you can remove the Module Bar
from the screen. The visible worksheet then extends to the left border of the ServiceLab window.
Use the Module Bar command from the View menu to hide and to redisplay the
Module Bar. A check mark ( ) indicates that the Module Bar is displayed.
After you have hidden the Module Bar, you can still install modules by using
Module menu commands. To install a Signal Generator module, for example, select Control from the Module menu, then choose Generator, or press the ALT, M,
C, and G keys.
2.9. Function Bar
The Function Bar, below the Main Menu Bar of the ServiceLab window, displays a selection of icons that provide easy access to menu functions often used
during experiments. Use the left mouse button to click on the icon that represents
the desired command.
When the mouse pointer is pointing at a Function Bar icon, a tag with the name of
that function will appear. (You will find QuickInfo in all of the module windows
that provide a Function Bar.)
Function Bar Configuration
The configuration of the Function Bar is fixed. You cannot change it by removing
or adding any icons.
3-22
ServiceLab
The ServiceLab Screen
The following table contains a list of the icons included and the menu commands
they represent. For further details about the menu functions themselves refer to
Chapter 4 of this manual.
Icon Function
Start experiment
Pause experiment (toggle)
Command
Menu
Shortcut
Start
Experiment
F5
Experiment
CTRL+F6
CTRL+F5
Pause
Stop experiment
Stop
Experiment
Clear worksheet to create a new worksheet
New
File
Open worksheet file
Open…
File
Save worksheet to file
Save
File
Set up different time
bases
Time Base
Experiment
Set general experiment
parameters (dialog box)
Experiment Setup
Experiment
Set hardware-specific
parameters (dialog box)
Hardware Setup
Experiment
Open File Info dialog box File Info…
File
Switch to Control Sequencer mode
Control Sequencer
Windows
Switch to Display Window mode
Display Windows
Windows
F2
Switch to Worksheet
mode
Worksheet
Windows
F3
Switch to VITool Layout
Window mode
Layout
Windows
F4
3-23
ServiceLab
Creating an Experiment Setup
Icon Function
Command
Menu
Cut the marked object
and copy it to the Windows clipboard
Cut
Edit
Copies selected Worksheet part or Layout
object to clipboard
Copy
Edit
Inserts contents of clipboard into Worksheet or
Layout Window
Paste
Edit
Deactivate all the display Minimize/Hide Diswindows (reduce to icons play Windows
or hide, depending on
setting in Options/Window Setup)
View
Activate all the display
windows, depending on
setting in Options/Window Setup
Normalize/Show
Display Windows
View
Leave the Black Box,
return to preceding worksheet level (or to the main
chart). To enter a Black
Box, double-click its
module in the worksheet.
To Preceding
Black Box Level
or
Back to Main Chart
Edit
Select Window
Arrangement
View
Help
Help
(list) Re-arrange display windows into one of the
ways you have saved
Display ServiceLab
Online Help options
Shortcut
Removing the Function Bar
To enlarge the display area for your worksheet, you can remove the Function Bar
from the screen. The visible worksheet then extends to the Menu Bar of the ServiceLab window.
The Function Bar command from the View menu enables you to hide and to redisplay the Function Bar. A check mark ( ) indicates that the Function Bar is displayed.
After you have removed the Function Bar, you can still use any function by selecting it from the menu. To start an experiment, for example, choose Start from
the Experiment menu, or press the ALT, X, S keys, or press F5.
3-24
ServiceLab
The ServiceLab Screen
2.10. Status Bar
The Status Bar at the bottom of the ServiceLab window provides the following
information:
On the left of the display you will find an explanation of the menu function
you have selected on the Menu Bar.
The status bar on the right displays the progress of operations, for example, of the Autorouter function arranging data channels, or, during experiments, the driver buffer status.
If the bar turns red, this indicates that the acquisition rate is too fast to
collect data continuously. Left of the driver buffer indicator there is a
small indicator for lost samples. Many drivers acquire data using interrupts. Some boards allow ServiceLab to check whether the program has
processed all interrupts. A yellow flashing light indicates that some interrupts have been missed. For more detailed information see the hardware
help.
The current time is displayed on the far right.
2.11. Display Windows
Display Windows of the Display modules show data samples in various graphical ways. You can choose X/Y, Y/t Chart, Chart Recorder, Bar Graph, Digital or
Analog Meter. You can customize the appearance of Display Windows in many
ways.
Hiding and Showing Display Windows
The modules from the Display module group consist of two parts: the module
symbol in the worksheet, and a display window where the incoming data is visualized. When a display module is inserted into the worksheet, the display window initially appears minimized.
You can restore each of the display windows contained in your worksheet individually by double-clicking its icon at the bottom of the computer screen, or by
choosing Select Windows/Restore from the View Menu.
You can restore all the minimized display windows contained in your
worksheet simultaneously by choosing All Windows/Restore from the
View menu, or by clicking this Function Bar icon.
You can minimize each of the display windows individually by clicking its
Minimize button (in the upper right-hand corner of the display window).
You can minimize all the display windows contained in your worksheet simultaneously by choosing All Windows/Minimize from the View
menu, or by clicking this Function Bar icon.
3-25
Creating an Experiment Setup
ServiceLab
You can hide a display window without minimizing it. Use the View menu command Select Windows/Make Invisible. You can hide minimized display windows
to make your work area easier to read.
You can hide all display windows, including minimized windows, by
clicking on the Hide button or choosing All Windows/Make Invisible
from the View menu.
You can show (un-hide) a hidden display window by choosing the Select Windows/Make Visible from the View menu.
You can show (un-hide) all hidden display windows by clicking on
this Function Bar icon, or by choosing the all Windows/Make Visible
command from the View menu.
Window Arrangement
This field shows the number and name of the current Window Arrangement. ServiceLab allows you to save up to eight different Display Configurations to be
used by the experiment: Switch to another arrangement by choosing the name
displayed in the list. The Window Arrangement can also be switched using the
Action module.
While observing an experiment, with data being displayed on several instruments, you may find it useful to save certain arrangements of these display windows (i.e., their sizes and positions on the screen). You can then easily
restore any of these arrangements when it seems most suitable, and you can even
switch between various window setups to compare different display modes.
For these purposes, ServiceLab provides the following menu commands:
Save Window Arrangement
Select Window Arrangement
Delete current Window Arrangement
3-26
ServiceLab
3.
Module Groups Overview
Module Groups Overview
ServiceLab module functions are divided into ten Module Groups, each containing modules that perform related functions.
The Module menu provides all the available module groups. Choose a module
group from the Module menu to open a submenu with the list of the modules that
belong to that group. You can select any of the modules listed by clicking on it. It
is then placed on the worksheet as a module symbol.
The Input/Output and the Files modules provide data input and output
functions, including data archiving using the new Backup module.
The Trigger Functions and the Control modules perform control tasks.
The Mathematics, the Statistics, the Signal Analysis and the Data Reduction modules offer a large number of analysis, evaluation and calculation
operations.
The Display modules provide several ways of displaying data.
The Black Box module allows you to store complete worksheet segments
in one module as ready-to-use units.
Input/Output Module Group
This group provides all the function modules necessary to communicate with
SIMATIC and the data acquisition hardware, external devices and other programs. The modules Analog Input, Analog Output, Digital Input, Digital Output
and Counter Input represent different functions of the data acquisition hardware,
while DDE Input and Output implements DDE communication with other Windows applications. SIMATIC S7, Serial Input and Output and the IEEE488 Interface modules represent the interfaces to the corresponding devices.
Files Module Group
This module group provides file reading and writing functions. It consists of
Read Data, Write Data, Backup and FlexPro modules.
Trigger Functions Module Group
This module group contains the Start/Stop Trigger and the Pre/Post Trigger modules, which are used to control data flow in the worksheet depending on the acquired signal. The Combi Trigger allows you to detect a wide combination of
signal changes. The Relay module is used in conjunction with the trigger modules
to control the flow of data.
Control Module Group
This module group contains two different types of modules. There are four signal
generating modules: the Generator can generate periodic or random signals; the
Switch allows manual input of TTL low and high levels; the Slider is used to
manually define an analog signal; and the TTL Pulse Generator will generate a
3-27
Creating an Experiment Setup
ServiceLab
pulse of specific duration. The PID Control, Stop, Latch, and Time Delay modules may be used to control data flow within the worksheet.
Mathematics Module Group
This module group provides basic mathematical functions including Arithmetic
and Trigonometry, Logic Operations, Linear Scaling, Thermocouple Linearization, Interpolation, Differentiation/Integration and the general purpose Formula
Interpreter.
Statistics Module Group
This module group provides several statistical calculations including standard
deviation, min/max, mean values, and variance in the module Statistical Values.
It also contains function modules for Histogram calculation, Counting and the
calculation of Regression.
Signal Analysis Module Group (optional)
This module group contains several modules for signal analysis applications. It
implements digital (IIR) Filters of different types, the calculation of FFT s, frequency spectrum, amplitude and phase spectrum, Correlation functions and cepstrum. Another module provides a number of different Window functions. Polar/Cartesian coordinate transformation is now part of this module group.
Data Reduction Module Group
This module group contains different algorithms for data reduction including Averaging and Block Average, the selection of samples and blocks, and modules
that allow you to combine and separate signals from different channels, including
Time Slice, Merge/Expand and Cut Block.
Display Module Group
This module group contains all the display modules. It includes the scope display
(Y/t Chart), Chart Recorder, X/Y Chart, Analog and Digital Meters, Bar Graph,
and List modules.
Network Module Group (optional)
The high-speed, TCP/IP network capable modules are available in this optional
module group.
Special Module Group
This module group contains Black Box modules to be “filled” with worksheet
segments and with Export/Import modules which establish connections for data
transfer between the main worksheet and the Black Box worksheet embedded in
it. It also provides the Black Boxes that were saved to disk. Additionally, it includes modules that provide special functions, including the Action, Message and
Time Base modules, as well as the Signal Adaptation module.
3-28
ServiceLab
Worksheet Window Menu
Chapter 4: Main Menu
1.
Worksheet Window Menu
1.1. File Menu
The commands of the File menu enable you to save, open and print worksheets,
to manage your worksheet files, and to exit the program. Some of these functions
can also be chosen by clicking on the corresponding icons on the Function Bar.
The ellipsis (…) following a menu command indicates that a dialog box or submenu will appear when the command is selected.
New
Open…
Save
Save As…
File Info…
Print…
Printer Setup…
Page Format…
Exit
1.1.1
New
Choose the New command from the File menu, or click this
Function Bar icon to create a new worksheet.
This command will open a new worksheet. If you have a worksheet open and
have not saved it, you will be asked to:
save that worksheet before beginning work on the new one,
or to reject those changes,
4-1
ServiceLab
Main Menu
or to recall the New command.
After creating the new worksheet you can save it to a file by selecting the Save
or the Save As... command for the File menu. You can also click on the Save icon
in the Function Bar to save the current file.
1.1.2
Open…
Choose the Open command from the File menu, or click this Function Bar icon to open a previously saved worksheet.
If you have a worksheet open and have not saved it, you will be asked to save
that worksheet before beginning work on the new one.
After choosing the Open command you can select from a list of files using standard Windows dialog boxes. The default file extension for ServiceLab worksheet files is .DSB.
You can …
Open one of the files from the list directly by double-clicking the file
name,
Select a different directory by double-clicking the directory name,
Select a different file format for the file display, or
Select a different drive.
To use your keyboard, press the TAB or the SHIFT+TAB keys to move from one
field to another; select items from the lists by pressing ↑ , ↓ , SPACE and the
ENTER key.
In the File Name box you can define the filter for the file list. The default setting
for the filter (∗.DSB) will create a list of ServiceLab worksheet files, which
usually have the extension .DSB. ServiceLab can also load files with the extension *.DSA. This format is used to exchange worksheet files between the 16 and
32 bit ServiceLab versions. These files may have also other extensions such as
*.txt, but to be interpreted correctly, the contents MUST follow the conventions
of the ServiceLab ASCII file type.
You can type a different extension, or use wildcards (like ∗.∗), to get lists of different groups of files. For example, you may do this if you have saved ServiceLab worksheets with extensions other than .DSB.
ServiceLab can only open files in its own .DSB format, no matter what extension the files have.
If Password Protection is active, you will first be asked to enter the password
unless you have already entered it. Without the correct password, the file
will not be opened.
4-2
ServiceLab
Worksheet Window Menu
When you save a worksheet, the current Module Bar configuration is saved
with it. When you open a worksheet file, its Module Bar configuration will
replace the current one on your screen. If you prefer to retain the current
configuration, disable the Replace Module Bar option in the Options menu.
You can specify a standard directory for ServiceLab worksheet files in the
Options menu.
To create a new worksheet, select the New command from the File menu, or
click the New icon in the Function Bar.
1.1.3
Save
Choose the Save command from the File menu, or click this
Function Bar icon to save a worksheet.
If you have created a worksheet without saving it to a file, the Save command
will act like Save As… If this were a previously saved worksheet, the existing
file will be replaced without further messages.
The following settings are saved with the worksheet:
The current Module Bar configuration
All the entries in the File Info dialog box
All the entries in the Page Format dialog box
The settings for Display Window Arrangement
Text strings, with locations of where they were placed in the display
window
The following settings are not saved with the worksheet.
The settings for the Start/Stop at Time functions (Experiment menu)
The settings for the Auto Start function (Experiment menu)
The settings for the display of the Module Bar, the Function Bar and the
Animation function (View menu)
The Options Menu settings for the Window Setup, Colors, the Autorouter
functions
You can specify a standard directory for ServiceLab worksheet files (Options
menu command).
To save the worksheet with a new file name, select the Save As… command
from the File menu.
If Password Protection is active (Options menu, see page 4-49), the worksheet
will be protected using the specified password. If a password has not yet
been defined, you will be asked to specify it when the worksheet is saved.
4-3
ServiceLab
Main Menu
To save the worksheet with a different file name, select the Save As… command from the File menu.
1.1.4
Save As…
Choose the Save As command from the File menu to save a worksheet under a
new file name, in a different directory, or on a different drive.
See the previous section for a list of the settings and parameters that will be
saved together with the worksheet.
After you have chosen the Save As… command from the File menu you can select
the file name, the directory and the disk drive where the file is to be stored.
Type the file name in the File Name box. Note that the file name must be
chosen in accordance with MS-DOS conventions.
If you do not type an extension, ServiceLab will automatically add the
standard extension (.DSB). ServiceLab always saves worksheet files in
its own format, even if you select an extension other than .DSB.
You can…
… Select one of the file names in the list by double-clicking the file
name. The file that was originally saved under that name will be replaced with the new worksheet. A warning message will first appear, asking you to either confirm the procedure or to cancel it.
… Select a different directory by double-clicking the directory name.
… Select a different drive for the new file.
… In the List Files of Type box you can select the type of files (defined
by their extension) to be listed.
To use your keyboard, press the TAB or the SHIFT+TAB keys to move from one
field to another; select items from the lists by pressing ↑ , ↓ , SPACE and the
ENTER key.
You can specify a standard directory for ServiceLab worksheet files (Options
menu command).
To save the worksheet under its current file name, use the Save command
from the File menu.
To quickly save the current file, click the Save icon on the Function Bar.
If password protection is active (from the Options menu), the worksheet will
be protected by a specified password. If the password has not yet been defined, you will be asked to specify it when the worksheet is saved.
ServiceLab always saves worksheet files in its own format, even if you select
an extension other than .DSB.
4-4
ServiceLab
1.1.5
Worksheet Window Menu
File Info…
Choose the File Info command from the File menu, or click this
Function Bar icon to display, enter, or modify information
about the open worksheet.
ServiceLab will automatically provide the following fields. The user cannot
modify these fields.
Field
Worksheet
Created
Modified
Information
The file name of the current worksheet
The date and time the worksheet was created
The date and time the worksheet was last saved to file
You can add the following information:
Field
Information
Max. Number of Characters
Author
Company
Department
Title
Info Text
Your name
Your company
Your department
A descriptive worksheet title
Additional informative text
50
50
50
80
4000
To begin a new line in the Worksheet Info Text field, press
CTRL+ENTER.
To move from one field to the other, either use your mouse, or press the TAB or
SHIFT+TAB keys.
Click on the Clipboard button to copy all of the information to the Windows
Clipboard.
All the File Info entries will be saved with the worksheet when you choose
Save or Save as… from the File menu. The Author, Company, and Department
information is also stored in the SERVICELAB.INI file.
When you print a worksheet or the display of a module from the Display module group, you can include the information about Author, Company, Department, Title, and Worksheet file name from the File Info dialog box.
Choose Page Format from the File menu to select the information you wish
to include in the printing.
1.1.6
Print…
Choose the Print command from the File menu.
Choose Page Format from the File menu to select additional worksheet information you wish to include on the printout, and to specify the page layout and
page frames.
4-5
ServiceLab
Main Menu
Choose Printer Setup from the File menu to select paper size and paper source,
orientation, printer resolution, and other specific settings for your active printer
model.
ServiceLab only prints to the default Windows printer. To use a different
printer connected to your system, or to install and configure a new printer,
choose the Printers option in the Windows Control Panel. Refer to your Windows documentation for further information.
1.1.7
Printer Setup…
Choose the Printer Setup command from the File menu to select paper size
and paper source, orientation, printer resolution, and other specific settings
for your active printer model.
These settings are also valid when printing Layout Windows. You should pay attention to the settings of the Layout Window, especially the page orientation.
The options vary, depending on the printer you are using.
Change the specifications as needed.
To set options specific to your printer driver, choose the Options button,
set the options as needed, and then choose the OK button.
For information about the printer-driver options, choose the Help button
or press F1 while using the dialog box.
Choose the OK button.
Some Printer-Drivers allow you to choose user defined page formats. If the
minimum useable size (depending on the printer type) is under run, the printer
will not print. So if your printer will not work, check the settings in printer dialog box and enlarge the size of page or use one of the preset page formats (e.g.
A4, letter...)
1.1.8
Page Format…
Choose the Page Format command from the File menu to format printing. The
settings affect the following print commands:
4-6
Printout of…
Source module
Worksheet
Y/t chart
X/Y chart
Diagram
List of values
(Work area)
Print command from module
menu
File (Main Menu Option)
Y/t Chart
X/Y Chart
Chart Recorder
List Display
Display
Display
Display
Edit
ServiceLab
Worksheet Window Menu
You can select additional information to include in the printout, and you can
specify the page layout and page frames.
The upper part of the dialog box mirrors the basic layout of the printed page.
View port
The actual information or display that is to be printed is indicated in the center of
this area. Depending on the source module from which the printing will be activated, the worksheet, the graphic display, or the list of values will be positioned
here.
The final size of this area on the printed page is defined by the paper size, minus
the selected paper frames, and minus the space required for any additional information. The actual display will occupy the entire page if you select no additional information. The more information you select, the smaller the space remaining for the actual display.
Additional Information
In the text box and the check boxes above the View port area you can select the information that will be printed above the display at the top of the
page.
In the text box and the check boxes below the View port area you can select the information that will be printed below the display at the bottom of
the page.
You can enter one text line of up to 80 characters in the text boxes.
Select information already entered and saved elsewhere.
The Experiment Title, Author, Company, and Department will be printed
as entered in the corresponding text boxes of the File Info dialog box from
the File menu (see page 4-5). Commas will separate the printed information about Author, Company, and Department.
The date and the time of the printing will be printed at the position indicated by the Date/Time check box.
The Worksheet Name to be printed is the file name of the current worksheet.
When you select Description the worksheet file name will be printed
when you print the worksheet itself. The Worksheet Info Text from the
File Info dialog box will not be included in the printout.
When you wish to print a graphic display or a list of values, the module
description printed will be the Description text box of the source module’s configuration dialog box. This dialog box appears when you doubleclick that module symbol on the worksheet.
Page Frame
Set the margins for the printed page. These are the distances between the paper
edge and the printed area of the paper. The measurement system is always centi4-7
ServiceLab
Main Menu
meters. The default settings are 2.54 cm (one inch) or the values last saved with
a worksheet.
Printer…
Click this button to select paper size, source, orientation, printer resolution, and
other specific settings for your active printer model. This function is the same as
the Printer Setup command from the File menu.
All the Page Format entries will be saved with the worksheet when you choose
Save or Save as… from the File menu.
1.1.9
Exit
Choose the Exit command from the File menu to close ServiceLab.
You can also exit ServiceLab by double-clicking the system control button in
the upper left hand corner of the ServiceLab window, or by pressing ALTF4.
If you have not saved or have changed the worksheet in the work area, you will
be asked whether you want to save the changes or not, or cancel the exit request.
The following settings are saved when you close ServiceLab:
Size and position of the ServiceLab window on your screen
The Module Bar configuration
The information about Author, Company, and Department from the File
Info dialog box
The Autostart option (Experiment menu)
The Animation option (View menu)
The display settings of the Module Bar and the Function Bar
The Window Setup (Options menu)
The Color settings (Options menu)
The Autorouter option (Options menu)
The Password Protection option (Options menu)
If there is a worksheet on the screen which you have changed since you last
saved it, you will be asked to either save that worksheet now before exiting ServiceLab, or to reject those changes or to recall the Exit command (Cancel).
You can also exit ServiceLab by double-clicking the system control button in the
upper left hand corner of the ServiceLab window, or by pressing ALT+F4.
1.1.10
Recently Used File List
The worksheets displayed as numbers 1 to 5 in the File menu contain the five
worksheets worked on last. The list is automatically rebuilt when loading any
worksheet and is stored when the program is closed.
4-8
ServiceLab
Worksheet Window Menu
1.2. Edit Menu
The commands of this menu allow you to copy the ServiceLab worksheet displayed on the screen to the Windows Clipboard and to configure the Module Bar
according to your specific requirements. It also provides the functions necessary
to organize Black Box files.
Worksheet to Clipboard
Black Box Module
Save As…
Load…
Black Box Info
Back to Main Chart / To Next Higher Black
Box Level
Layout to Clipboard
Layout
Save As…
Load…
Module Bar
New
Open…
Save As…
Set to Default
Undo
Cut
Copy
Paste
Delete
Search for Module
4-9
ServiceLab
Main Menu
1.2.1
Worksheet to Clipboard
Use the Worksheet to Clipboard command from the Edit menu, or
click this icon on the Function Bar to create a Windows Metafile
image (WMF/CLP) of the worksheet on the Clipboard.
The worksheet is always copied to the Clipboard as displayed on screen, including any changes you have made since last saving it.
The worksheet background is not copied, even if you have selected a color and a
grid for it. For further information on these options, see Customizing the ServiceLab Screen.
The image on the Clipboard is automatically scaled to the size of the ServiceLab
worksheet. If the worksheet consists of only a few modules these will appear
larger on the Clipboard than if you have used a large number of modules all over
the worksheet.
Use the Paste function provided in any Windows application (usually in the Edit
menu) to transfer the metafile from the Clipboard to applications such as Paintbrush or Word for Windows for further use.
1.2.2
Black Box Module
Use the Black Box module to create worksheet elements frequently required in
your experiments, integrate them into one module (the Black Box) and insert them
into future worksheets as ready-to-use units. Similar to an integrated circuit, a
Black Box module contains a portion of the worksheet.
Use Black Box modules to implement standardized modules that perform customized algorithms not provided by ServiceLab. These menu commands provide all
the functions necessary to organize Black Box files.
For further information on the modules themselves, on how to create and edit
Black Box worksheets, and on the corresponding Module menu commands refer
to Module Reference Guide.
Save As…
To save a Black Box:
First, open the Black Box you wish to save. You cannot save a Black Box
while the ServiceLab main chart is active.
Make sure you have entered a Module Name and an ID Tag in the Black
Box Info dialog box.
ServiceLab can only list a Black Box file on the Module menu if a Module
Name has been entered for that Black Box before saving it.
ServiceLab can only install a Black Box icon on the Module Bar if an ID
Tag was entered for that Black Box before saving it.
4-10
ServiceLab
Worksheet Window Menu
The Black Box Info dialog box will appear when you try to save the Black
Box if the identifying tag is missing.
Then choose Save As… from the Black Box Module submenu of the Edit
menu. Specify the Name, Directory, and Drive of the file to be saved. ServiceLab automatically adds its standard extension for Black Box files
(∗.DBB).
If you save a worksheet containing a Black Box, a complete copy of the Black
Box will be included with the worksheet.
If you modify the original Black Box file independently, the Black Box saved with
the worksheet will not be updated. To insert the new version first delete the previous Black Box version from the worksheet.
The advantage to this system is that if you modify or delete the Black Box file, it
will not cause errors in the worksheets incorporating (and possibly based on) the
functions and settings of the original Black Box.
Black Box Info
Enter descriptive texts and identifying tags for the Black Box module.
The Module Name identifies the module symbol in the worksheet.
The Black Box module symbol in the main chart (or the preceding worksheet level) displays its name in its Title Bar.
The first 20 Black Box files in the ServiceLab directory (not the Worksheet directory!) automatically appear as menu items on the Black Box
module submenu of the Module menu after the program has been started.
Their Module Names appear as menu commands.
Enter a short comment in the Description box to describe the functions implemented by the Black Box.
The ID Tag is a string of up to 3 characters that is used to identify the
Black Box module in the Module Bar. The Module Bar icon representing
that Black Box displays that tag.
A Black Box can only be saved if the ID Tag has been entered. The Black Box
Info dialog box will appear when you try to save the Black Box if the identifying tag is missing.
Back to Main Chart / To Next Higher Black Box Level
You can insert another Black Box module in a Black Box worksheet. The module
can then contain a Black Box module, and so forth, down to any level. Thus, the
worksheet becomes three-dimensional, with the Main Chart (the actual ServiceLab work area) and several subordinate Black Box levels, each one embedded into the preceding level.
4-11
ServiceLab
Main Menu
You can open any Black Box by clicking its module symbol on the
worksheet; you can leave it again to return to the next higher worksheet by clicking this Function Bar icon, or by choosing the command from the Black Box Module submenu on the Edit menu.
The command can have two names: either Back to the Main Chart (if the current
Black Box is an element of the Main Chart), or To Next Higher Black Box Level
(if the current Black Box is itself an element of another Black Box worksheet).
After a Black Box has been closed, the worksheet on the next higher level is displayed.
If you start an experiment from a Black Box worksheet, the program will first
return to the Main Chart before acquisition begins.
You can enter a Black Box and activate its worksheet for editing by doubleclicking its module symbol on the worksheet.
By default the worksheet of a new Black Box has a blue background. Color settings can be selected individually for each Black Box. Choose the Colors command from the Options menu to do so.
Background color can be used as an indicator of the Black Box level. It will
be easier to find your way through several worksheet levels without losing
orientation by attributing a different background color to each of these levels.
1.2.3
Layout to Clipboard
Use this command to copy the Layout Window as a Windows Metafile
(WMF/CLP) to the Clipboard.
The layout is always copied to the Clipboard as displayed on screen, including
all the changes made since last saving it. The Layout will not be modified.
The size of the Layout Window in the Clipboard is automatically matched to the
size of the area used on the ServiceLab worksheet. If you arrange only a few
small elements they will appear larger on the clipboard.
Use the Paste function in any Windows application (usually in the Edit menu) to
copy the metafile from the Clipboard to applications such as Paintbrush or
Word for Windows.
1.2.4
Layout
Save as…
Use this command to save a Layout Window with a new name or to place it
into another directory.
You can select the file name, the directory and the disk drive where the file is to
be stored.
4-12
ServiceLab
Worksheet Window Menu
Type the file name in the File Name box. (Note that the file name must be
chosen in accordance with MS-DOS conventions.)
If you do not type an extension, ServiceLab automatically adds its standard extension for Layout file names (∗.LAY). (ServiceLab always saves
Layout files in a specific format, even if you select an extension other than
∗.LAY.)
You can…
… Select one of the file names offered on the list by double-clicking
on the file name. The file will be replaced with the Layout.
… Select a different directory (double-click the directory name)
… Select a different drive for the new file
… You can select the type of files in the List Files of Type box (defined by their extension) to be listed in the box above.
If you wish to use your keyboard, press the TAB or the SHIFT+TAB keys to
move from one field to another; select items from the lists by pressing ↑ , ↓ ,
SPACE and the ENTER key.
You can specify a standard directory for Module Bar files (Options menu
command).
Load…
Choose this command to load a Layout previously saved to a file.
Type the file name in the File Name box. (Note that the file name must be chosen
in accordance with MS-DOS conventions.)
You can…
… Select one of the file names presented in the list by double-clicking on the
file name.
… Select a different directory (double-click the directory name),
… Select a different drive for the new file.
… You can select the type of files in the List Files of Type box (defined by
their extension) to be listed in the box above.
If you wish to use your keyboard, press the TAB or the SHIFT+TAB keys to
move from one field to another; select items from the lists by pressing ↑ , ↓ ,
SPACE and the ENTER key.
4-13
ServiceLab
Main Menu
1.2.5
Module Bar
The Module Bar, at the left of the ServiceLab window, displays
a selection of frequently used modules in icon form.
Use the left mouse button to click the icon for the module you
want to add to your worksheet or select the module from the
Modules menu. Since there are only a limited number of spaces
on the Module Bar, not every module can be displayed.
You can customize the Module Bar by clicking on a square in
the Module Bar with the right mouse button to assign any of the
modules available in ServiceLab to that button. You can customize a Module Bar for individual experiments.
The menu commands provide the functions necessary to modify
the Module Bar for your requirements and to organize the Module Bar files.
New
provides a blank Module Bar to be configured
Open…
opens a saved Module Bar
Save As…
saves the current Module Bar configuration
to a file under a name of your choice
Set to Default
opens the default Module Bar
To enlarge the work area for your worksheet, Remove the Module Bar from
the screen. The visible work area will extend to the left border of the ServiceLab window. Use the Module Bar command on the View menu to remove
and to re-display the Module Bar (see page 4-39).
After you have removed the Module Bar, you can still use all the modules by
choosing the Module menu commands.
All of the Module Bar settings are automatically saved with information about
the window size and position when you exit the program and when you choose
the Save or Save As… commands from the File menu.
4-14
ServiceLab
Worksheet Window Menu
New
Choose this command to create a new Module Bar. The current Module Bar on
the ServiceLab screen will be cleared and you can assign the module of your
choice to each button.
Click on a square in the Module Bar with the right mouse button to assign any of
the modules available in ServiceLab to that button. A dialog box appears presenting the complete list of modules including their Module Bar icons.
To select a module in this list, type the first letter of its name to move to
the first matching module. Type the letter again to move to the next module that starts with that letter.
Click the Help button to obtain information on the selected module.
Choose OK, or press ENTER, to install the selected module on the Module Bar. The Module Bar will now display the new icon.
The Module Bar settings are automatically saved when you exit the program.
To save a configuration permanently, or to configure several Module Bars
for individual experiment tasks or users, choose the Save As… command
from the Edit / Module Bar menu.
Open…
Choose this command to open a saved Module Bar.
You can select the Module Bar file from a list of files presented in a dialog box,
using the standard Windows conventions. The default file extension (.DML) will
be used to create a list of ServiceLab Module Bar files.
Type a different extension here if you have saved ServiceLab Module Bars with
extensions other than .DML.
ServiceLab can only open Module Bar files in its own DML format, no matter
what extensions the files have.
When you open a Module Bar file, any modifications of the current Module
Bar on the screen are lost, unless you have saved them using the Save As…
command from the Edit / Module Bar menu.
You can specify a standard directory for Module Bar files (Options menu
command).
4-15
ServiceLab
Main Menu
Save As…
Choose this command to save the current Module Bar on the ServiceLab
screen to a file.
You can select the file name, the directory and the disk drive where the file is to
be stored. If you do not type an extension, ServiceLab will add the standard extension for Module Bar file names (.DML).
You can specify a standard directory for Module Bar files (Options menu command).
Set to Default
Choose this command to open the default Module Bar configuration onto the
ServiceLab screen.
The default Module Bar will be installed without further dialog. Any modifications of the current Module Bar on the screen will be lost, unless you have previously saved them.
The default Module Bar is not saved in a DML file but is saved internal to the
program. Therefore, you cannot change its setup.
The SERVICELAB.DML file always contains the Module Bar configuration
that was active when you last exited the program.
1.2.6
Undo
Choose this command to undo the last autorouter operation (moving or connecting modules).
Other worksheet changes like changing module settings, adding or deleting module input or output channels cannot be restored. Choose this function using the
menu or by the ALT+Backspace key combination.
1.2.7
Cut, Copy, Paste or Delete Flow Chart Parts
Modules and module groups with connections can be deleted, moved or duplicated.
Selection: First select the modules: click and hold the left mouse button inside
the worksheet and select the area by dragging the cursor across the area. When
you release the mouse button, the selected modules are highlighted. You can select or deselect single modules by clicking the left mouse button on the module
while pressing the SHIFT or CTRL key.
Cut: To move modules around the worksheet, choose the Edit/Cut menu command
or the SHIFT+DEL or CTRL-X key combinations. All connections to unselected
modules are deleted.
4-16
ServiceLab
Worksheet Window Menu
Copy: Choose the Edit/Copy menu command or the CTRL-INSERT or CTRL-C
key combinations. The selected modules will be inserted onto the worksheet with
their channel settings intact.
Paste: Paste the stored worksheet part by choosing the Edit/Paste menu command or by pressing SHIFT+INSERT or CTRL-V at any position on the worksheet. After activating the insert mode, the mouse cursor changes. Choose the position where the selection should appear. The entire worksheet can be used. The
window is scrolled automatically when the mouse cursor moves outside the window border. Once the mouse cursor is at the destination press the left mouse button to paste the cut chart modules into the worksheet, if there is enough room for
the operation. The paste operation can be repeated.
You can use the cut and paste function to integrate worksheet parts into a
black box, but references to those modules in Actions will need to be edited to
reflect the new name.
You cannot cut or copy hardware modules, including analog/digital inputs,
outputs, counter modules or black boxes.
1.2.8
Delete
Choose the Delete menu command or the Delete key to delete the selected modules.
1.2.9
Search for Module
This function offers you an easy way to find each module used in complex worksheets. This menu item opens a list box, in which all used modules are listed (including their position in black boxes). Double mouse click on one of the listed
modules to move to the module and mark it. This function is also available in the
popup menu that will be open with a left mouse click on any empty area of the
worksheet.
The modules may be sorted by name, module type or by Black Box.
Double click on one of the listed modules to move to the module and mark it.
This function is also available in the popup menu that will be open with a left
mouse click on any empty area of the worksheet.
The Open Button at the bottom of the list window opens the Properties dialog
box for the selected module.
1.3. Module Menu
Full details for each module are in the ServiceLab Module Reference Guide,
published as a separate volume.
4-17
ServiceLab
Main Menu
1.3.1
Module Groups
Use the Module menu functions to select any of the modules provided by ServiceLab to insert into your worksheet.
Within the Module menu, select a Module Group. A Module Group is made up of
a number of modules providing similar functions. The Module menu provides the
following module groups:
Input/Output
Trigger Functions
Mathematics
Statistics
Signal Analysis (optional)
Control
Display
Files
Data Reduction
Network (optional)
Special
1.3.2
Modules
Choose a module group to display a submenu with the individual modules belonging to that group.
Module Symbols
A module represents a functional element in the ServiceLab experiment setup
(worksheet). A worksheet can contain up to 256 modules. Each Black Box module can also contain up to 256 modules, including other Black Box modules.
The functions symbolized by the modules provide all the operations required for
an experiment,
From data acquisition (by a data acquisition board) or signal generation
(simulated by a virtual generator)
To data analysis, evaluation and processing (mathematics, statistics, control, trigger and other functions)
Up to their presentation on screen (display instruments) or export for
documentation purposes (printer, metafile, etc.).
4-18
ServiceLab
Worksheet Window Menu
Each of the available modules in ServiceLab is shown in two forms, both indicating the module’s function: Module Bar icons and worksheet symbols.
A limited number of module icons can be installed on the Module Bar. They can
be placed on the worksheet by a single mouse click on the Module Bar icon. Any
module can be installed on the Module Bar, including Black Boxes that you have
previously saved.
You can configure the Module Bar according to your specific requirements.
You can save various configurations to files for later use. For details, please
refer to Chapter 4 of this manual.
Installing Modules
A module can be installed on the worksheet either by choosing it from the Module menu or by clicking its icon on the Module Bar. Either way, the module will
be placed on the worksheet as a module symbol. For modules that provide more
than one basic operation, you must also select the function type.
Choose a Module Group from the Modules menu to display a submenu with the
individual modules that belong to that group. The submenus list all the modules
currently available. You can select any of the modules by clicking on its name. If
a module is not available in your version of the software it will be gray, and you
will be unable to select it.
A worksheet can contain up to 256 modules, including Black Box modules.
Configuring Modules
Use the left mouse button to double-click on the module’s worksheet symbol to
open the Properties dialog box to configure the module. The following parameters can generally be specified in the dialog box:
The Module Name,
A short Description,
The number of inputs/outputs (up to 16 for most modules).
Once you have activated more than one channel, you can select each of them to
display and define specific channel parameters.
Use the F7/F8 function keys to easily configure several channels for one module.
For specific module settings, please refer to the individual module descriptions.
The general parameters are described in the Module Reference Guide. The specific module settings are described in the sections for each module.
Connecting Modules
A data channel is the connection between the output of a module and the input of
another module. Data is transferred between modules via these connections.
4-19
ServiceLab
Main Menu
In the ServiceLab work area, lines like the ones shown below show connections,
which always connect the output and input symbols of the module symbols. By
creating junction points and branches, you can connect each module output to up
to 16 inputs of other modules.
Data channel
junction points and branches
no connections
For details on how to create, delete and rearrange data channels and branches,
refer to Chapter 3 of this User’s Guide.
While the experiment is running, you can hold the CTRL Key while you left
click on the data channel to get further information about the connected modules.
Moving Modules
A module can be moved to any position on the worksheet by dragging and dropping its worksheet symbol. Click on the worksheet symbol with the left mouse
button and, while holding the mouse button down, drag it to any position. When
the mouse button is released, the module symbol will automatically be aligned
based on the spacing value entered in the Window Setup box of the Options
menu.
Select Modules
Click on the worksheet symbol with the left mouse button or draw a box around
the module (or modules) while holding the mouse button down. All modules
within the frame will be selected.
Copy Modules
Selected modules can be copied using the Main Menu command Edit: Copy.
Paste Modules
Selected modules can be pasted into the worksheet using the Main Menu command Edit: Paste.
Deleting Modules
Modules can be deleted by double-clicking the worksheet symbol with the right
mouse button. This opens a dialog box allowing you to remove the module or to
delete its input or output connections. Modules also can be deleted using the Edit
command of the Main Menu.
4-20
ServiceLab
Worksheet Window Menu
Search for Modules
You can search for installed modules with the Search for Modules command.
You can select the command from the Edit menu or from the dialog box that appears when you double-click on the worksheet symbol with the right mouse button. The Search for Modules command opens a list box with all installed modules and black boxes. When you double click with the left mouse button on the
desired module, ServiceLab jumps to the module icon in the worksheet.
4-21
ServiceLab
Main Menu
1.4.
Experiment Menu
The most frequently required commands from this menu can also be chosen by
clicking the corresponding icons on the Function Bar or by using keyboard shortcuts (Hotkeys).
Start
F5
Start experiment
Stop
CTRL+F5
Stop experiment
CTRL+F6
Pause or resume paused
experiment
Pause/Resume
Start/Stop at
Time…
Auto Start
Select Driver…
Hardware Setup…
Experiment
Setup…
1.4.1
Start
Choose the Start command from the Experiment menu or click
this Function Bar icon, or press F5, to start an experiment.
1.4.2
Stop
Choose the Stop command from the Experiment menu or click
this Function Bar icon, or press CTRL+F5, to stop an experiment completely. All pipes will be cleared of data.
4-22
ServiceLab
1.4.3
Worksheet Window Menu
Pause/Resume Experiment
Choose the Pause command from the Experiment menu or click
this Function Bar icon, or press CTRL+F6, to pause the running experiment. (√ indicates that the experiment has been interrupted.)
This command stops the acquisition of new data, for example from a signal generator module, an A/D or digital input module, a PID or manual control. Data already acquired and still in the pipes will be retained, however, and processed
completely.
The Pause/resume command is available only if the worksheet does not contain
any module accessing the data acquisition hardware. The reason is that ServiceLab derives its own clock from the board's master clock. This is not available if the measurement is paused. To pause a running experiment, use the Stop
module.
1.4.4
Start/Stop Experiment at Time…
Choose this command to start, stop, and repeat an experiment at a specified
time.
The dialog box that appears provides three fields where you can specify the time
at which an experiment is to start, the duration of that experiment, and the interval
after which that experiment is to be repeated.
Select the function by clicking its option button: Start Experiment at Time, and/or
Stop Experiment after Time, and/or Restart Experiment after Time. A check mark
( ) next to the option button indicates that the function has been activated.
Then enter the time specifications:
Start Experiment at Time/after delay: Specify the time at which the experiment is to begin. The default setting is the current date and time plus
five minutes. You may either type the values for the date, the hour, the
minutes, and the seconds, or press the UP ARROW (↑) or DOWN ARROW
(↓) keys to scroll, or choose the values from the drop-down list.
Stop Experiment after Time: Specify the duration of the experiment. The
default setting is five minutes.
Restart Experiment after Time: Specify the interval after which the experiment is to be repeated. There is no default setting for this interval.
When this function has been activated, the experiment will be repeated
according to the specified data until you:
Stop the experiment, or
Deactivate this function by clearing the option button in this dialog
box, or
Modify the current worksheet, or
4-23
ServiceLab
Main Menu
Open or create another worksheet.
While any of the Start/Stop by Time functions are active, a message is displayed
on the status bar reminding you of the time at which an experiment is due to start
or stop.
The settings specified here are not saved when you exit the program nor with
the worksheet when you choose the Save or Save As… commands from the
File menu.
1.4.5
Auto Start
Choose Auto Start, indicated by a check mark ( ), to prepare the experiment
setup for an automatic start later on. Enter the ServiceLab command followed by
the worksheet file name (for example, in the DOS Command Line box of the Program Item Properties dialog box of the Windows Program Manager) to start the
experiment directly.
See Automatic Experiment Start in Chapter 6 for further details.
This setting is automatically saved with information about the window size
and position when you exit the program. The same configuration will appear
the next time you start ServiceLab.
These settings are not saved with the worksheet when you choose the Save or
Save As… commands from the File menu.
1.4.6
Select Driver…
ServiceLab supports a wide range of data acquisition hardware from different
vendors. You will typically need a different hardware driver for each manufacturer’s data acquisition hardware. If you have more than one hardware driver installed on your system you may switch between them using the Select Driver
function.
Note that only one driver can be used at a time.
The Select Driver dialog box lets you select one out of the installed hardware
drivers. The change only occurs after exiting and restarting ServiceLab.
If you do not see your hardware driver in the list, ensure that you have correctly
installed the driver.
1.4.7
Hardware Setup…
If you have installed a data acquisition device in your system,
you must set its parameters in this box.
The values entered here must correspond exactly to the configuration of your
data acquisition hardware to ensure correct data processing by ServiceLab.
4-24
ServiceLab
Worksheet Window Menu
Choose the Help button, or press F1, or choose Hardware from the Help menu, to
obtain help on the settings.
If you have to exchange worksheets between several PC’s (as in runtime applications), you must guarantee that the selection and sequence of measurement in ServiceLab is exactly the same as in your target PC.
Read the Hardware Installation Manual for further information concerning
installation and operation of your data acquisition device.
1.4.8
Experiment Setup…
Use this command to set the general parameters for data acquisition and measurement control.
Together with the resources provided by your system and the size of the worksheet you have designed, these settings determine the overall data processing
performance as well as the response time of the individual functions. Available
settings are:
The Sampling Rate per Channel
The Global Block Size
You can use Global Variables to define the sampling rate and block size
settings. The variables are read once at the start of the experiment. You
CANNOT use variables to change these settings while the experiment is
running.
The global settings for Analog Output and Digital Output
The Synchronization mode that determines the clock source for all internal data sources of ServiceLab (Generator, Slider, etc.). The two modes
available are PC Clock and Data Acquisition hardware.
Disk Streaming options
The Driver Settings, which contain - depending on the installed hardware
- the driver buffer size, the acquisition mode and the connected parameters Blocks per Series and Delay.
To internally equalize measurement time and system time in the analog input,
digital input and counter hardware modules, use the following settings:
• Synchronization: PC clock
• Sampling rate: ≤ 5 Hz
• Block size: = 1
Sampling Rate per Channel
If you operate channels at differing sampling rates, enter the highest sampling rate
here. The value entered here always defines the sampling rate for all the chan4-25
Main Menu
ServiceLab
nels. You can specify whether this value represents Hertz, Kilohertz or Megahertz
or minutes, seconds or milliseconds respectively.
You can also use Global Variables to define the sampling rate and block size settings. The variables are read once at the start of the experiment. You CANNOT
use variables to change these settings while the experiment is running.
If you wish to operate some channels at lower rates, you must reduce the data
rate by using the Separate or Average modules. This procedure yields channel
rates that are true divisors of the fastest rate (the global rate).
If you set a sampling rate which is too high for the data acquisition board
type in your system, or if the overall sampling rate is too high because you
have too many channels at high sampling rates, you will be alerted by ServiceLab, either before exiting this box, or before exiting the Analog Channel
selection box. The sampling rate will automatically be rounded up or down to
the nearest acceptable value.
With many of the data acquisition boards supported by ServiceLab, the board itself generates the sampling rate. It is possible to enter a value not supported by
the hardware. However, ServiceLab will automatically adjust the value.
If you use interrupt-driven boards at acquisition speeds too high for the system,
some interrupts and the corresponding samples may be missed. The indicator at
the bottom left of the ServiceLab window right to the buffer indicator shows
whether ServiceLab has detected such a situation. If this indicator flashes in yellow, interrupts have been lost, If the amount of lost samples is greater than 2%,
the experiment is aborted.
Some boards are not able to indicate lost interrupts by a hardware flag. In this
case, ServiceLab tries to look for lost interrupts by software. This software solution does not guarantee that all lost samples are detected. With these boards it is
possible that samples are lost without any indication.
Driver Buffer
Use this option to specify the temporary driver buffer memory size for the
hardware driver to use to store data.
The hardware Driver Buffer temporarily stores data coming in from the data acquisition hardware before the software processes it. The driver first stores the
acquired data to this buffer, and then ServiceLab reads the data from the buffer.
During time-consuming operations, such as moving windows on the screen, the
driver continues writing data to the buffer, so that no data is lost. Data acquisition will be stopped when the buffer memory is full. You may see the error Sampling Rate too Fast when this happens.
You can enter a driver buffer size between 4 Kbytes and 16,384 Kbytes. The default setting is 64 Kbytes. If the on-board memory resources of your computer are
limited, enter a smaller value. You will be warned if the value you have entered
is not valid.
4-26
ServiceLab
Worksheet Window Menu
The board driver will use the memory buffer selected;
neither ServiceLab nor Windows can use it.
The buffer size should be increased if you use a high global acquisition rate.
Note that the driver buffer setting should not exceed 50 to 75% of the total
available physical memory.
Block Size
Use the Block Size to set the number of samples that will be processed by
worksheet modules during a single processing cycle.
Any value from 1 to 32768 can be entered here; powers of 2 are preferred.
The input modules collect the specified number of samples before passing them
on to other modules.
You can also use Global Variables to define the sampling rate and block size settings. The variables are read once at the start of the experiment. You CANNOT
use variables to change these settings while the experiment is running.
Computing the data in blocks increases the speed of the measuring process considerably; but it strongly influences the real-time performance of the system.
Therefore, the block size should be selected carefully, taking the following principles into account:
For a high data transfer rate, but a long latency period where the response
time of subsequent modules, like control modules, is slower, use a large
block size.
For a short latency period, where the response time of subsequent modules is faster, but the data transfer rate is lower, use a small block size.
The actual data transfer capacity of a system depends upon many factors, therefore, a general formula for how to determine the ideal block size cannot be provided.
Generally, fast data acquisition operations require large block sizes, while small
block sizes work well for slow data acquisition and control operations.
We suggest that you initially set the block size to half the sampling rate (the default setting), and then try out various other values to determine the best value for
your individual task.
4-27
Main Menu
ServiceLab
Acquisition Mode
The available Acquisition modes depend on the installed hardware and the
modes supported by the driver.
Continuous mode: When continuous mode has been activated, indicated
by a check mark ( ), the data will be acquired without interruption at the
specified sampling rate and processed by ServiceLab.
One Series: After the experiment start, the data will be acquired without
interruption at the specified sampling rate the amount of data defined by
the parameter Blocks per Series setting has been reached.
Running Series: This mode is a repeated one series mode. After the
specified number of blocks the acquisition is interrupted for at least the
time specified by delay. If the delay is too short for ServiceLab to process the data, the acquisition is delayed for a longer time.
The display modules do not recognize the delays. That means that in this
mode there is no correspondence of time of day for the data samples.
They are treated as continuous data in ServiceLab.
This mode is especially useful for fast scope applications.
Isolated Series: This is the same mode as the Running Series, except that
ServiceLab recognizes the gaps. The resulting data stream is not continuous.
Quite obviously, this method leads to acquisition gaps between the
blocks. Their size depends on the number of active channels, on the block
size, on the complexity of the ensuing processing arrangement, and on the
hardware resources.
This mode may be useful in cases where a high sampling rate is essential,
while continuous high-speed data acquisition and processing cannot be
realized, e.g. due to limited hardware resources.
If you wish the acquisition to stop after a certain time, enter the corresponding number of values in the Count field. (This value can be freely
specified for each channel.) After that number of data has been acquired,
the acquisition will be stopped automatically. (The default setting for this
field - zero - means that the acquisition process is not supposed to be
aborted when a certain number of values have been acquired.)
Analog Output and Digital Output
Set the general output parameters for analog and digital output individually.
Output Mode: The output mode determines whether the data samples are sent out
synchronously with the acquisition rate or asynchronously, which means as fast
as possible but in undetermined intervals.
In the synchronous mode, data samples are sent out according to the acquisition rate specified for each output channel.
4-28
ServiceLab
Worksheet Window Menu
In the asynchronous mode, data is sent out as fast as possible. The maximum rate depends on your hardware, the speed of your PC and the complexity of the worksheet. You should experiment with these rates to find
out the best combination for your individual task.
Output Buffer
If the Fill once option is selected, the output buffer will be filled only
once, with the first block of data coming in after the experiment start.
When the buffer is full, that first block of data will be sent out repeatedly,
always beginning with the first data again. Any further values coming in
from the worksheet will be ignored.
If Continuous refill is chosen, the output buffer will continuously be filled
with the data samples coming in from the worksheet, and these samples
will then be sent out.
Output Rate: The output frequency defined in this list box only takes effect when the synchronous mode is selected. Only frequencies that are an
integer divider of the global acquisition rate are allowed. Changing the
global acquisition rate also affects the output rate.
Output Start: The value entered in the Output Start list box defines the
number of samples that are to be collected before the analog output actually starts. This value must be the same as the global block size, or a multiple of it. This feature can be used for a defined delay or to synchronize
the values that come from the worksheet.
Disk Streaming
This option enables or disables the fast storage of measurement data samples
as they are acquired.
Disk Streaming provides the ability to write ServiceLab data onto a mass storage
media. Unlike the Save Data module that writes data of the data stream of up to
16 data channels into a file, Disk Streaming stores the data of all channels in a
highly compressed 2-byte integer format. The amount of required mass storage
space is reduced and the time to write the data procedure is much faster since
only a fractional part of the data is produced. Additionally, the conversion of the
integer data of the driver into the floating-point data of ServiceLab is skipped.
This is the main reason why Disk Streaming can write data sampled at high Acquisition rates to the mass storage device.
No other channels should be connected to the A/D, Digital or Counter input
modules, since this would significantly reduce the time advantage.
Disk Streaming settings are made in the Experiment Setup dialog box.
Disk Streaming can be enabled or disabled by checking the Active box.
Select the File Name button to change the name of the streaming file. Then, a file
selection window opens to enter a file name.
4-29
ServiceLab
Main Menu
You can set the Default Directory for Disk Streaming files in the Options
menu.
Data samples are stored in the DASYTEC data format (Universal Format 0).
You can find a description of the data format in Chapter 5 of this manual.
Options
Warning if Channels are Connected
If this option is enabled, a warning message will be issued and the measurement is immediately stopped if channels are connected to the Analog,
Digital or Counter Inputs.
Don’t Overwrite Existing Files
This option prevents overwriting an existing Disk Streaming file. The
measurement is stopped immediately after starting. A message is displayed if a file with the specified name exists and would be overwritten.
Circular Buffer
This option implements an in-memory buffer, containing the last n Blocks
per Channel.
Disk streaming files are read (as other data files) using the Read Data module. If
the file to be loaded is a Disk Streaming file, the information Universal 0 is
shown in the Data format text field of the dialog box of the Read data module.
ServiceLab data files written without Disk Streaming are stored in the Universal 1 data format.
Use the Channel group combo box to select which channels you want from the
data stream: Analog 0 identifies the first 16 scanned analog channels, Analog 1
the next 16 scanned analog channels and so on. The same applies to Counter X.
For Digital port X the selected port will always be displayed, as it was saved
with the original worksheet.
Hints for Optimal Measurement Settings
Block Size/Sampling Rate
The performance of ServiceLab depends primarily on the sampling rate and
block size.
The sampling rate controls the resolution of the received signal (data bytes). The
block size affects the response time of the worksheet. The response time is determined by the ratio of sampling rate and block size (S/B ratio). A poor setting
causes data to accumulate in the driver buffer, shown by the Status Bar (the
green/red bar lower right in the worksheet main window.) If the driver buffer is
filled, ServiceLab displays the “Experiment stopped. Sampling rate too fast!”
error message.
4-30
ServiceLab
Worksheet Window Menu
General Hints for Sampling Rate and Block Size
In the data acquisition program the data is sent as data blocks via the connected
data channels between modules. ServiceLab works in a block dependent mode.
Each module output has a 64 Kbyte buffer to hold the processed data. The module at the end of a branch periodically checks whether a data block is available
in the buffer. If the answer is yes, the block is transmitted, processed and placed
in the output buffer to be processed by the next module.
Each block contains measurement data, called samples, and a block header. The
header contains information about the block, including the data type, the start
time of the block and the sample interval. The program calculates a time stamp
for each sample. Many modules verify the time stamp and data type to ensure that
only samples with the same characteristics are processed together.
Many multi-channel modules start processing data only if all inputs have data
with the same time stamp. If there is no data at available one input, the module
cannot process data at other inputs, and may start to block the data flow.
The module input buffer will fill until it is full. Because that module is unable to
process data, the buffer of the preceding module will be filled up.
The end result is that several branches of a worksheet will stop to work.
The first hint will be the “Animation bar” shown at each output in each module
symbol. If the animation stops, the module is no longer processing data. Detailed
information can be found in the channel debugger. Left click with CTRL key
pressed on the data channel (with measurement running!). Important entries are
“FIFO blocks” (max. buffer size) and “used” (buffer usage).
If you use different kinds of data in a multi-channel module (sampling rate, block
size or type of channel...), the module can't process the different samples together. ServiceLab will show a message like “Time information or block size is
different. These channels can't be processed together. ” and measurement stops.
The response time of ServiceLab depends mainly on the ratio of block size and
sampling rate.
The block size defines how many samples are collected as a data packet
and are sent as a block to subsequent modules.
The sampling rate defines how fast the data is generated or acquired by
the data acquisition board.
The resulting update interval of the worksheet depends on the fact that a new
block will only be released and processed once it is filled with samples.
The following example will show the context:
The following response times are will be expected with different setting for
block size and sampling rate.
4-31
ServiceLab
Main Menu
Block size
Sampling rate
(1/sec)
Minimum response time
(sec.)
1
1
1
1
1000
0.001
1000
1
1000
The smaller the ratio of block size to sampling rate, the more frequently the
worksheet will refresh (Visualization/Display elements).
If you use too small a block size (e.g. 1) the message ”Measurement
stopped. Sampling rate too high” may appear, and the program
stops!
Explanation of Response Time
When a new module is placed on the worksheet, it is placed in a module management list. The ServiceLab dispatcher manages the distribution of CPU time to
each module in that list. There is a physical speed limit that depends on the size
of the worksheet (number of modules and data channels) and the hardware configuration of the PC, because the dispatcher has to process all modules during the
refresh time. For example, take a worksheet with 100 modules/data channels and
a sampling rate/block size ratio (S/B ratio) 1/1000. In this case, the dispatcher
has just 1 msec to process 100 modules. Each module gets 10 µsec to process the
received data. That time simply is too short, data will start to back up, and eventually the program will be halted!! An accurate examination of your experiment
should define the sampling rate (resolution) of your measurement. The dispatcher’s cycle time is defined by the block size and parallels the time to process
the acquired data. The block size also defines boundary conditions such as the
refresh rate of the visualization elements, range of the FFT and so on.
In our experience it is advisable to select a S/B ratio from 1 to a
maximum 10.
ServiceLab has the option to show the system capacity usage (ratio
of needed CPU time and max. available CPU time). You can see at
the start at the measurement whether your system has enough capacities to fulfill the requirements of the measurement.
Hints for the resulting amount of data
The quantity of data to be transferred that loads the system also depends on the
S/B ratio and increases with a rising S/B ratio. Each block of data includes a
26 Byte sized Header that has to be transferred with each block. If you use a
block size of 1, the block has 4 actual data bytes and 26 bytes Header data, causing the system to transport more overhead information than actual data.
4-32
ServiceLab
Worksheet Window Menu
Example:
S/B ratio: 1000
Block size 1; Sampling Rate 1 kHz; 100 Data channels
Useful Bytes:
4 Byte * 1000 Hz *100 = 400.000 Byte
Header:
26 Byte * 1000 Hz*100 = 2.600.000 Byte
Sum:
3.000.000 Byte
S/B ratio: about 2
Block Size 512; Sampling Rate 1 kHz; 100 Data Channels
Useful Bytes:
4 Byte * 1000 Hz *100 = 400.000 Byte
Header:
26 Byte * 1000 Hz/512*100 = 5.078 Byte
Sum:
405.078 Byte
The same principle has to be considered when storing data to hard disk when using the DASYTEC file format. Long duration measurement sessions with small
block sizes may create unexpectedly large files. For low speed, long duration
files, consider using the ASCII or IEEE32 file formats to minimize file size. You
may want to experiment with different settings to determine the optimum
configuration.
1.4.9
Time Base Setup
Time Base Global Setting
Use this command to configure the available time bases for your
experiment.
You can use different Time Bases to synchronize data flow.
All time base settings can be configured here. Each available Time Base generates a tab on the top of the dialog box, to directly select the corresponding time
base setup.
Basically ServiceLab offers two time bases:
PC Clock: The standard time base is a free-running timer synchronized
with the PC clock. The default setting for the sampling rate is 10Hz, with
a block size of 1. You can change these settings to meet your specific requirements. Use this time base in modules that don’t have a direct connec4-33
Main Menu
ServiceLab
tion to the regular driver based data flow (e.g. Switches to control actions).
Driver: The driver time base is synchronized with the driver interface and
is used for data acquisition with the installed hardware. The available
settings depend on the installed DAQ Hardware.
There are additional DLL drivers that use their own sampling rates (NI-DAQ,
NI-CAN, instruNet, etc.). If one or more of these drivers are installed, the Time
Base Setup… will display additional tabs in the dialog box.
Selecting Time Bases in a Module
Data generating modules (such as Generator without Modulation, Switch, Slider,
Coded Switch, TTL Generator, Time Base without control input, and Sequence
Generator without control input) provide a setting to select one of the available
time bases allowing you to synchronize the module to a specific data flow. In
most cases you don’t need to use a control input or synchronization.
Tips for using different Time Bases
If you need a quick reaction to an event, it is recommended that you use small
block sizes (1 if possible). If you set up your flowchart with a “useful” relation
between sampling rate and block size (~ 1:10), you must set the block size from
100 up to 1000 using a sampling rate of 1 kHz. That block size is too large to get
a fast reaction. You can now use the second time base PC Clock with a separate
setting of the block size to 1.
(Also see Hints for Optimal Measurement Settings on page 4-30.)
Time Bases of imported (reloaded) worksheets
A time base (controlled by hardware), that was used while the worksheet was
created, but is not available on the PC at the time that the worksheet is
loaded, is still shown, but placed in brackets in the time base dialog.
Example: The worksheet was created on a system using the NI-CAN hardware. Now it is loaded on a PC without the NI-CAN hardware. In
the time base dialog you will find the entry for the NI-CAN time
base placed into brackets indicating that time base hardware isn’t
available.
Regardless, all settings can be made for the unavailable time base and these settings will be stored in the worksheet. If you run the worksheet without the hardware, all modules that use that time base are synchronized to the PC clock. It is
likely that they will work correctly with only a small time shift. Please use caution, and ensure that you test the worksheet with the correct hardware to ensure
that all timing related functions work correctly. For example, a relay controlled
by a PC-clocked switch may work correctly in this mode, but may fail when the
actual hardware time base is available.
4-34
ServiceLab
1.4.10
Worksheet Window Menu
Serial Devices
You can set up multiple Serial Devices using saved configuration files. This dialog links serial devices to a saved configuration file. When you insert a Serial or
ICOM Input or Output module into the flowchart, available linked devices are
shown in a selection list. You don’t need to load an additional configuration file.
Please note that any settings made directly in the module properties after
saving a configuration file are not automatically stored with the flowchart.
To save these changes you must use the Save button in the module dialog box.
Please pay attention that you select the correct configuration file name
linked to the selected device name.
Selection of the Type of Serial Module
You can select one of the available module types:
Serial In (Master)
Serial In (Slave)
Serial Out
ICom Input (Master)
ICom Input (Slave)
ICom Output
Buttons
OK: Verifies and saves the changes and closes the dialog box.
Cancel: Closes the dialog box without any changes. Any changes to set-
tings are lost.
Help: Opens the **Name1 Help.
Add: Adds a new entry to the list of predefined devices. You can name the
new configuration and link an existing configuration file to that entry. If
you don’t enter a name **Name1 will create a default name by using the
name of the assigned configuration file.
The file types to link are
for RS232 Input Master module = (*.SIM)
for RS232 Input Slave module = (*.SIS)
for RS232 Output module = (*.SOU)
for ICOM Input Master module = (*.IIM)
for ICOM Input Slave module = (*.IIS)
for ICOM Output module = (*.IOU)
Use a descriptive name to save your configuration files to easily identify a
specific device. Then you do not need to enter a specific name for configuration because ServiceLab creates a suitable name.
4-35
Main Menu
ServiceLab
Remove: Deletes an entry from the list of devices. You cannot cancel the
deletion in the dialog. To restore the entry, leave the dialog using the
Cancel button.
Change: You can rename an entry or change the link to the configuration
file using that button.
4-36
ServiceLab
1.5.
Worksheet Window Menu
View Menu Commands
The commands of this menu allow you to change the appearance of the ServiceLab worksheet on the screen. You can click on the corresponding Function
Bar icons to choose some of these functions.
Overview
Animation (Worksheet View only)
Block State
FIFO State
Function Bar
Module Bar
Status Bar
All Windows
Make Visible (Show)
Make Invisible (Hide)
Minimize
Restore
Select Windows
Make Visible (Show)…
Make Invisible (Hide)…
Minimize …
Restore…
Save Window Arrangement
ALT-x
Select Window Arrangement (1-8)
Delete Current Window Arrangement
4-37
ServiceLab
Main Menu
1.5.1
Overview
Choose this option to display the complete ServiceLab worksheet at a reduced
size in a separate window.
The display gives you an overview of your complete worksheet. The display is
automatically scaled so that the entire worksheet is shown in the window. A
check mark ( ) indicates that this function has been chosen.
You cannot edit or change the worksheet in the overview window.
1.5.2
Animation
Choose these option to visualize the data flow by switching the animation
(Block Status and FIFO Status) of the worksheet on or off. A check mark ( )
indicates that the function has been activated.
When Animation is active, small colored indicators in the output symbols of each
module will display the data flow and buffer (FIFO) status.
Block Status: Displays the status of data block processing. The bar will toggle
from red to green, indicating that the module is processing data.
FIFO Status: Choose this option to switch the animation of the FIFO Status in the
worksheet on or off (√ indicates that this function has been activated.)
When Animation is active, the load of the FIFO buffer of each module will be
displayed by a bar indicator replacing the output symbols of the respective modules above the small bar indicator of the Block Status indicator). The size of the
bar changes in steps of 10 % depending on the load of the buffer.
To guarantee that the worksheet runs smoothly, the bar should not exceed 10 %.
Larger values point to data flow problems that may cause delayed actions, loss
of data and, in the worst case, may force the program to stop.
Data may be processed more slowly when the Animation function is
active, since graphics operations use more system resources.
1.5.3
Function Bar
Choose this option to display or remove the Function Bar below the Main
Menu Bar of the ServiceLab window.
A check mark ( ) indicates that the Function Bar is displayed.
The Function Bar displays a selection of icons that provide easy access to menu
functions often used during experiments. Click the icon representing the function.
(For a detailed description of the Function Bar configuration, refer to Chapter 3
of this manual.)
To enlarge the work area for your worksheet, remove the Function Bar from the
screen. With the Function Bar removed, use the menu commands or hot-keys. To
4-38
ServiceLab
Worksheet Window Menu
start an experiment, for example, choose Start from the Experiment menu, or
press the ALT, X, S keys, or press F5.
When the mouse pointer is pointing at a Function Bar icon, a QuickInfo tag with
the name of that function will appear. You will find such tags in all of the module
windows providing a Function Bar, such as the display windows of the Y/t Chart
or the List Display modules.
To redisplay the Function Bar, choose this command from the View menu.
1.5.4
Module Bar
Choose this option to display or to remove the Module Bar on the left hand
side of the ServiceLab window.
A check mark ( ) indicates that the Module Bar is displayed.
The Module Bar displays a selection of frequently used modules in icon form.
Use the left mouse button to click on the icon that symbolizes the module you
want to add to your worksheet. (For a detailed description of the Module Bar
configuration, refer to Chapter 3 of this manual.)
To enlarge the work area for your worksheet, you can remove the Module Bar
from the screen. With the Module Bar removed, use the Module menu commands
to add modules to the worksheet. For example, choose Display from the Module
menu, and then choose Chart Recorder.
To redisplay the Module Bar, choose this command from the View menu.
1.5.5
All Windows
You can use the View Menu to control the state of the Display Windows. There
are two modes: Visible/Invisible, and Restored/Minimized. Invisible windows
are hidden from view, whether restored or minimized. Invisible windows cannot
be restored or minimized. The follow commands apply to All Windows. To
change one or more windows, use the Select Windows command of the View
menu.
All Windows: Make Visible
Choose this function, or click the icon on the Function Bar, to show
all the hidden display windows and icons contained in the worksheet
as restored windows or in icon form. This command does not restore
iconized windows.
To show only selected hidden display windows, see the Select Windows: Make
Visible function.
4-39
ServiceLab
Main Menu
All Windows: Make Invisible
Choose this function or click on the icon on the function bar, to hide
all display windows contained in the worksheet. Minimized windows
(represented by an icon at the bottom of the screen) are also hidden.
To hide selected display windows, see Select Windows: Make Visible function.
All Windows: Restore
Choose this function or click on the icon on the function bar, to restore all the minimized display windows contained in the worksheet.
This command has no effect on invisible windows or icons.
When you first activate several display windows of the same type (e.g. Y/t
Charts or Bar Graphs) using this function, they will all be automatically
opened in the center of the screen, on top of each other. Drag the top window
to one side to view the next display window.
All the minimized display windows will be restored. To restore only one display
window, double-click its icon at the bottom of the computer screen or choose
Select Windows: Restore from the View Menu.
All Windows: Minimize
Choose this function or click on the icon on the function bar, to minimize all activated display windows contained in the worksheet.
To minimize one display window, click its Minimize button (in the upper righthand corner of the display window).
To re-activate all the display windows contained in your worksheet, choose
Normalize Display Windows from the View menu, or click the corresponding
Function Bar icon.
1.5.6
Select Windows
You can use the View Menu to control the state of the Display Windows. There
are two modes: Visible/Invisible, and Restored/Minimized. Invisible windows
are hidden from view, whether restored or minimized. Invisible windows cannot
be restored or minimized. The follow commands apply to one or more selected
Windows. To change all windows, use the All Windows command of the View
menu.
To select more than one window at a time, use the standard windows controls:
click and drag to select a contiguous range of lines; SHIFT-click to select contiguous lines; or CTRL-click to select any two or more lines.
4-40
ServiceLab
Worksheet Window Menu
Select Windows: Make Visible
Choose this function to open a list box with all hidden (invisible) display windows or display icons contained in the worksheet. To show one or more display
window, select them from the list. Press the OK button to accept the selection
and leave the dialog box. The selected will be shown as a restored window or
an icon, depending on the state that it was in when hidden.
Select Windows: Make Invisible
Use this function to hide one or more display windows or icons. A list of all
visible display windows and icons will be listed. To hide one or more display
windows or icons, select them from the list, and press OK to accept the selection
and leave the dialog box.
Select Windows: Restore
Use this function to open a list box with all visible iconized windows. To restore
one or more display windows, select one or more from the list and press the OK
button to accept the selection. The selected windows are restored and shown as
windows.
Select Windows: Minimize
Choose this function to open a list box with all visible restored display windows. To minimize one or more display windows to an icon, select them from
the list and press the OK button to accept the selection. The selected windows
are minimized and shown as icons at the bottom of the Windows Desktop.
1.5.7
Window Arrangements
Save Window Arrangement
Choose this function to save the sizes and positions of all the activated display windows and to define an identifying tag for that arrangement.
Use this function to easily switch between different display window arrangements even while an experiment is running. You can save up to 8 different display window setups.
To activate this function,
Press ALT+SHIFT+Arrangement Number (1-8) on your keyboard, or
Choose the Save Window Arrangement command from the View menu.
The Window Arrangement dialog box appears, displaying the Arrangement Number and Text either of the current setup, or, if you have used the keyboard
shortcut, of the setup whose number you have typed after ALT+SHIFT.
You can now save the current arrangement under any Arrangement Number from
1 to 8 and add a name or short description of your choice in the Text field. Click
4-41
Main Menu
ServiceLab
OK, or press ENTER, to complete the procedure. If an arrangement has already
been saved under this number, you will be warned.
The name or description you have entered in the Text field appears in the list of
window setups on the Function Bar.
Choose Select Window Arrangement to re-arrange the display windows in
one of the arrangements you have previously saved.
Choose Delete Current Window Arrangement to delete the current setup from
the list of saved arrangements.
Select Window Arrangement
Choose this function to re-arrange the activated display windows on the screen in
one of the arrangements you have previously saved. Each of the activated display windows appears in the same position and size as previously saved.
Additional display windows (not contained in the arrangement when it was
saved) remain in their positions while the others return to their defined places on
the screen.
To activate this function,
Click on the list box on the Function Bar (or on the down arrow on its
right), or
Press ALT+0 on your keyboard, or
Choose the Select Window Arrangement command from the View menu.
In the Function Bar list box, the nametags of all the saved arrangements are
listed. Click on the name of the arrangement that you want to restore, or choose
that tag by pressing the arrow keys on your keyboard; then press ENTER.
Using a keyboard shortcut, you can select any of the saved arrangements by
pressing ALT+Arrangement Number (1-8).
If you restore one of the saved window arrangements as described,
the sizes and positions of the current display windows will be lost,
unless you have saved them under another Arrangement Number.
If you delete one of the display modules contained in the saved window arrangement from the worksheet, its display window is permanently removed from the saved arrangement, too. To restore the
original setup, you must re-install the display module in the worksheet, and save the display window arrangement again.
Choose Save Window Arrangement to save the current sizes and positions of all the activated display windows.
Choose Delete Current Window Arrangement to delete the current
setup from the list of saved arrangements.
4-42
ServiceLab
Worksheet Window Menu
Delete Current Window Arrangement
Choose this function to delete the currently displayed setup of display windows from the list of saved arrangements.
Only the information concerning the sizes and the positions of the display windows are removed; the display windows themselves remain in the
worksheet unchanged.
To activate this function, press ALT+CTRL+Arrangement Number (1-8) on
your keyboard, or choose the Delete current Window Arrangement command
from the View menu. You will be asked to confirm your decision before the information is actually deleted.
Choose Save Window Arrangement to save the current sizes and
positions of all the activated display windows.
Choose Select Window Arrangement to re-arrange the display windows in one of the ways you have saved before.
1.6. Options Menu
The commands of this menu allow you to change the display of the ServiceLab
worksheet and to switch the Autorouter function on and off.
Global Setup…
Directories…
Default Fonts…
Colors…
Autorouter
Password Protection…
Password Definition
Screen Locking
Key Events…
List of Actions
Overview of Actions
Define Global Strings…
Define Global Variables…
Copy Channel Names
Switch to Runtime
4-43
ServiceLab
Main Menu
1.6.1
Global Setup…
Choose this command to change the ServiceLab screen settings and program
start options.
The settings are automatically saved when you exit ServiceLab. The same
window setup will be used the next time ServiceLab is started. These settings
are not saved with the worksheet when you choose the Save or Save As…
commands from the File menu.
Window Type
Select this option to place a background grid on the worksheet.
Type of Grid
Dots
Lines
The grid intersections will be marked by dots.
A complete grid will be displayed.
Spacing
Choose a value between 8 and 48 points to specify the minimum distance between the module symbols in the work area and to specify the size of the screen
grid.
After setting the spacing, new modules will be placed using this setting. When
the spacing value is changed, it will not affect the layout of existing modules on
the worksheet. When you move a module, it will be positioned using the new settings.
The spacing value should be at least 16 points, to ensure that there is enough
space for data channels between the module symbols.
Start Options
By default, ServiceLab copyright information is displayed at program
start. In the Show Copyright Information box you can choose if you wish
this information to be displayed each time or not.
When you open a worksheet, the Module Bar settings that were saved
with it will be loaded, possibly modifying the current Module Bar settings that you'd rather maintain.
Activate the Load Module Bar with Flow Chart box if the current
Module Bar configuration is to be replaced with the new one from
the worksheet file.
Deactivate this box if you wish to retain the current Module Bar
configuration whenever you open a worksheet file.
Common Options
Choose Open dialog box when Module is created to automatically open
the module properties dialog box when the module is added to the worksheet.
4-44
ServiceLab
Worksheet Window Menu
Choose Show File Information with Flow Chart to display the File Info
each time the experiment starts.
Choose Show Warning if Data Stream stops to cause the program to display a message if one module isn’t able to process the incoming stream of
data.
In all write data operations, the Create Directory if Necessary option
causes ServiceLab to create the named directory when it does not exist
Example:
Bad entry in Edit field:
Default Directory:
C:\SERVICELAB\DATA
New Directory: C:\ SERVICELAB\DATA\
Correct entry in Edit field:
Default Directory:
C:\SERVICELAB\DATA
New Directory: C:\SERVICELAB\DATA\${STRING_001}
Where {STRING_001} contains the advanced path and file name, such
as <NEW-DIR\FILE1>.
The full path of the newly created directory and file will be:
C:\SERVICELAB\DATA\NEW-DIR\FILE1.DDF
For example, creating new directories is useful when writing files into
subdirectories with a time stamp, such as creating day, month or year to
store the files into them using an event driven action.
To create the time stamp, don’t use the global string ${DATE}, because
the punctuation marks (dots) in this string may be incompatible with the
Windows file structure. Instead, combine the ${DAY}-${MONTH}${YEAR} strings and use another punctuation mark.
The Hide Flowchart Load Progress Bar option turns off the progress bar
when the elements of the worksheet are loaded.
Choose Create Module via Drag & Drop to insert new modules onto your
selected location on the worksheet under user control. The modules are
not inserted at default places, but ServiceLab first shows an insert cursor
to allow you select the position the new module will be placed.
If the Release CPU time if idle Option is active ServiceLab releases the
reserved CPU time to other programs
Start/Stop Options
If the Save Backup Flow Chart setting is active, the current worksheet is
saved under the file name LAST.DSB when the ServiceLab worksheet is
started.
The Copy Channel Names at Start of Experiment option enables or disables the ServiceLab default setting to Copy The Channel Names of the
connected modules into newly connected modules
4-45
ServiceLab
Main Menu
The Switch to Displays at Start of Experiment option allows you to specify that the Worksheet view will be hidden, and the Display Window
view will be activated when the experiment starts.
The Switch to Worksheet at Stop of Experiment option allows you to
specify that the Worksheet view will be restored when the experiment
stops.
1.6.2
Default Directories
Use this menu item to set and modify the locations of drives and directories that
ServiceLab uses by default for loading or saving files. Different directories can
be set up for various file types.
When you select this menu item, a dialog box is opened, displaying each file type
with the currently valid directory. Clicking on the respective switches can
change the setup.
Default drives and default directories can be specified for the following file
types:
Item
File type
Worksheet
Streaming
Data
Devices
ServiceLab worksheet files (extension ∗.DSB)
data files for fast disk streaming
data files of the Write Data module
configuration files for the serial interface and the
IEEE interface
Module Bar, Interpolation and other files
By clicking on a switch a dialog window opens allowing the selection of a drive
and a directory. New directories can also be created here.
The drives and directories specified here are only used as defaults. If a file name
must be assigned while working with ServiceLab, these pre-set locations are
shown in the input window for the respective file type. If required, a different
drive and directory can be selected.
After the initial installation, the ServiceLab installation directory is used for all
default settings.
The settings made here are saved in the SERVICELAB.INI file in the Windows
directory.
Other
1.6.3
Fonts
This option allows you to define the module display windows font style and size.
Choose from the following 4 options:
One Font, Fixed Size
If this option is used, all text elements of the display windows use the
same type of fonts. The size is fixed and is always used even if the dis4-46
ServiceLab
Worksheet Window Menu
play window is stretched or compressed. Use the Font... button to select
type and size.
One Font, Variable Size
If this option is used, all text elements of the display windows use the
same type of fonts, but the size is adapted to the proportions of the text areas of the display window if the window is stretched or compressed.
Variable Font, Fixed Size
This setting allows you to select several types of fonts for the elements of
the display window. Use the buttons on the bottom of the dialog box to select individual font styles and sizes for these elements. The selected fonts
size is always used even if the display window is stretched or compressed.
Variable Font, Variable Size
This setting allows you to select several types of fonts for the elements of
the display window. Use the buttons on the bottom of the dialog box to select individual font styles for these elements. The size of fonts is adapted
to the proportions of the text areas of the display window if the window
is stretched or compressed.
The buttons to select the different text elements in display windows depend on
the kind of display window module. For example the buttons names for the
Digital Display module are Channel Name..., Value... and Scale..., or while
the Status Lamp module only shows Channel Name... and Status text....
If you activate these functions from the Options menu, the setting is applied to
all newly created modules on the worksheet; but existing modules are not affected. You can change this default setting by opening the individual text dialog box of the modules.
Apply Button
Use this button to change the font of all text elements to the chosen default
type. All existing modules are changed.
1.6.4
Colors
Use this command to choose the colors for the ServiceLab worksheet display.
You can specify colors for the background, the grid and the data channels wire
core and sleeve.
The settings are automatically saved with information about the window size
and position when you exit ServiceLab. The settings are not saved with the
worksheet when you choose the Save or Save As… commands from the File
menu.
4-47
ServiceLab
Main Menu
Standard Colors
Select the item you want to change. The Windows color selection dialog
box appears.
Click on the color of your choice in the Standard Colors palette using the
left mouse button.
If you prefer to create your own custom color, click Edit Colors.
Edit Colors
You can create custom colors for the background, the grid and the data channels,
wire cores and sleeves.
Select the item you want to change. The Windows color selection dialog
box appears.
Click on the color you want to edit using the left mouse button.
Choose Edit Colors.
To increase or decrease the amount of primary color, brightness and/or
saturation used in a color, drag the crosshairs and/or the vertical scroll
bar keeping the left mouse button depressed.
You can also type numbers from 0 to 255 in the corresponding boxes. The
resulting color is displayed in the Custom box.
To reset all the values for the standard color that comes nearest to the
custom color you have just defined, double-click the Standard box.
Choose the OK button to change the color of the selected screen element
to the custom color.
To save the custom color you have defined:
Click any of the boxes in the Custom Colors palette first.
Then modify its color as described above.
Click Add Color to Palette.
Specify further colors from the Custom Colors palette and modify
them.
Choose the OK button to change the color of the selected screen
element to the custom color.
To return to the color originally displayed on the screen, choose
the Cancel button.
1.6.5
Autorouter
Choose this option to switch the Autorouter function on or off. A check mark
( ) indicates this function has been activated.
When the Autorouter is active, ServiceLab automatically finds the correct paths
for your data channels. ServiceLab ensures that the data channels do not run
4-48
ServiceLab
Worksheet Window Menu
across modules or hide other data channels. The Status Bar displays the progress
of the autorouting operation.
When the Autorouter is not active, you can determine the paths of your data channels.
The Autorouter function cannot automatically rearrange existing data channels to take the shortest or most direct way between modules. You must
manually rearrange a data channel or move a junction point to a different
position to improve the clarity of your worksheet structure.
1.6.6
Password Protection/Password Definition
Use a password to protect a worksheet against unauthorized use or modification. A check mark ( ) indicates that this function is active.
Password protection is activated by
Clicking the Password Protection command,
Specifying the password itself by using the Password Definition command,
And then saving the worksheet.
Password protection applies to the entire worksheet. Black Boxes may also be
protected via Passwords. The settings are made in an active Black Box in the
Edit: Black Box Properties.
If Password Protection is activated without entering a password at the same
time, you will be prompted to specify the password when the worksheet is
saved.
Once Password Protection has been activated and the worksheet has been stored,
it can only be opened again by entering the correct password.
This function is only relevant when you save a worksheet or use the
Screen Locking function. It does not affect any other function or module.
If you have forgotten or do not know the password of a worksheet, you will
not be able to open the worksheet. Take this into consideration when you
choose a password, and take adequate precautions so that you will always
remember your passwords.
A password must contain at least 4 and up to 10 alphanumeric characters. If the
number of entered characters is less than 4, a warning message will appear when
you close the dialog box.
For security reasons, the password must be entered twice. If the two passwords
are not identical, you must reenter the password.
While you type the password, the characters are not echoed, but appear as asterisks (∗). Password recognition is case-sensitive; the same combination of upper
and lower case characters must be specified.
4-49
ServiceLab
Main Menu
A correctly entered password is valid
Until you exit ServiceLab, or
Until a different password is entered, or
Until you open a different worksheet requiring a different password, and
you enter that new password correctly.
1.6.7
Screen Locking
Activate Screen Locking to disable all keyboard and mouse inputs after starting measurement.
To unlock, use the ESC key. If Password Protection is active, the password
will be requested. You must enter the correct password to Unlock.
Screen locking also can be activated and deactivated via Event Driven Actions.
When Screen Locking is activated, Key Events, as defined in the Options Menu,
are available.
1.6.8
Key Events
Use Key Combinations to cause actions on the worksheet.
It is possible to cause all Actions of modules that are used in a worksheet by using an Action module or using key or key combination (1 or 2 Special key + one
normal key for example CTRL+SHIFT+S).
Select the option menu command key events. If the Show Window with defined
Key Events switch is set, the window shows all defined key actions. You can
hide single key events in the dialog box define key events
The New button opens a key events dialog box where you can define parameters
used by the key actions.
To change existing Key Events, choose the line and click the Change button. The
dialog box will show the active parameters. Click in the parameter field to
change them.
The Delete button deletes selected key action.
The Reset button deletes all defined key events.
To use Key Events you need:
The key or key combination,
The Receiver for the action,
The Action itself and
The Action-dependent Parameters
4-50
ServiceLab
Worksheet Window Menu
Receiver
The Receiver entry specifies the module that is to execute the initiated action.
In the Module pull-down list box, all the modules in the worksheet (which
can perform actions) are listed together with the ServiceLab main window.
Use Channel to specify which channel(s) of the selected module is to perform the actions. Individual channels can be separated with spaces or
commas. Channel groups are entered with hyphens.
Example: To use the channels 1, 3, 7 and 9 up to 12 of the Receiver module for
the event, enter: 1 3 7 9−12 or 1,3,7,9−12.
This setting does not influence actions relating to the entire module.
Parameters
You can define Parameter values to be used by the action (Worksheet name,
Layout number, Global String, etc.).
Screen Lock mode
You can allow key events while Screen Locking is active. The default setting is
Do Not Execute Action.
Description
While the Show Window With Defined Key Events option is active, key actions
will be displayed in an overview window. The default is Display. You can insert
a descriptive text string in the entry field that will be shown in the window. If the
string is empty, the Action text will be displayed.
1.6.9
List of Actions
The List Actions ... item opens a dialog box that allows you to copy a description
of any actions and their parameters, as defined in the worksheet, into the clipboard or to store it into a text file.
You can select one of the defined action modules from the list window. The parameters of the selected action module are shown in the display area.
You can also select one of the actions defined in the selected module. The parameters of the selected action are shown at Event Parameter, Receiver Channel
and Parameter of action (Number, Value).
Buttons
Copy: This button opens a dialog box to copy the data into the clipboard.
You can select whether the parameters of the selected or all defined action modules are copied. Click on OK to start the copy.
Save: This button opens a dialog box to save the data into a text file. You
can select whether the parameters of the selected or all defined action
4-51
ServiceLab
Main Menu
modules
are
stored.
The File name button opens the file menu to select/create the file the data
become stored. Click on OK to start saving data.
The text file has the following format:
Module name:
Action00
Channel:
0
Channel name: Action 0
Event:
Rising Edge
Receiver:
<SERVICELAB>
Receiver Channels:
All Channels
Action:
Activate Layout
Layout:
1
Asynchronous action
Channel:
1
Channel name: Action 1
Event:
Falling Edge
Receiver:
Generator00
Receiver Channels:
All Channels
Action:
Change Amplitude
To:
2,0000
Asynchronous action
...
Module name:
Action01
Channel:
0
Channel name: Action 0
Event:
Rising Edge
Receiver:
<SERVICELAB>
Receiver Channels:
All Channels
Action:
Activate Layout
Layout:
2
Asynchronous action
And so on.
1.6.10
Overview of Actions
The Overview of Actions… command opens a list box, showing all Event Driven
Actions defined in the actual flowchart.
The four columns show the name of the action module, the defined condition, and
the event such as the receiver of the action. You can choose each of these four
items to be displayed in each column. The entries in the list will be ordered alphabetically.
Copy: This button opens a dialog box to copy the data into the clipboard.
You can select whether the data of the selected or all defined actions are
copied.
4-52
ServiceLab
Worksheet Window Menu
OK button starts copying the information
Save: This button opens a dialog box to save the data into a text file. You
can select whether the parameters of the selected or all defined actions
are stored.
File Name opens the file menu to select/create the file where the data will
be stored.
OK button starts saving data.
To get more detailed information about the defined actions you can use the List of
Actions... command. There you can select each action module defined in worksheet and display all of its settings and parameters.
1.6.11
Define Global Strings
Global Strings allow you to define and modify ASCII text strings used in ServiceLab while a measurement is running. You can pass text strings to ServiceLab
worksheets running in succession (See the Working Example below). You can
define up to 999 Global Strings. When the measurement is running a Global
String can be defined or modified using the menu command Define Global
Strings. Defined strings are stored with the worksheet.
You can display Global Strings as text objects in Layout Windows. Use the
placeholder ${STRING_xxx} in the line text object. Replace xxx with the number of the string.
Several System/Program Information strings and variables (such as Free Memory, System Resources, Author, Company, etc.) are implemented in ServiceLab
as fixed placeholder strings/variables. If an Edit field will accept placeholders,
right mouse click in the Edit field to open a Popup menu with the Global Strings
displayed as a menu item. This Item opens a list with all available strings. Double-Click on the requested placeholder to insert it into the Edit field
You can use the RS232 Input module to receive strings instead of measurement
values and then assign them to a Global String.
Optionally, you can to load a Global String after starting a worksheet or save a
string into the SERVICELAB.INI file when you stop. Other applications are able
to modify strings via DDE. And, you can define, load or save a Global String using Event Driven Actions or key events.
Each Global String consists of a number, text (max. 255 char.) and options. The
Reset button sets all strings in the list to the default settings. The Reset all button
deletes all strings.
You can select and modify more than one string simultaneously using the SHIFT
and CTRL keys to select the strings.
You can define the following Options to handle Global Strings:
Read from INI file at start of experiment
Write to INI file at stop of experiment
No DDE access to Global String
4-53
ServiceLab
Main Menu
Write to data file (DASYTEC or ASCII) Header
Show Global String in window
Type In at start of experiment
Input is required to close dialog box
File Name Dialog
You can also define a short description.
Extended…
Click on the Extended button to make additional settings for Global Strings.
Name: You can define a name to be used with variables and strings. You
can refer to the String/Variable using the defined name: ${NAME} or by
its number {$VAR_xxx} or {$STRxxx}.
Expressions: If the Calculate Expression automatically option is activated
you can define a mathematical expression similar to the Formula Interpreter. The expression is allocated to the variable or string. If one of the
parts in the expression is changed, the variable or string is automatically
recalculated.
Each expression is a special type of data (numeric <variable> or alphanumeric
<string>). You only can link string expressions with strings and numerical expressions with variables; otherwise the program generates an error message.
The numerical expressions are the same as in the Formula Interpreter.
Mathematical functions:
+
Addition
-
Subtraction
*
Multiplication
/
Division
>
greater
<
less than
>=
greater than or equal
<=
less than or equal
=
equal
<>
not equal
^
raise to a power
MOD
Modulo remainder of Division operation
OR
logical OR
XOR
logical XOR
AND
logical AND
NOT
logical NOT
Trigonometric functions:
4-54
sin
Sine
sinh
Hyperbolic Sine
arcsin
ArcSine
cos
Cosine
cosh
Hyperbolic Cosine
arccos
Arc Cosine
tan
Tangent
tanh
Hyperbolic Tangent
ServiceLab
Worksheet Window Menu
arctan
ArcTangent
sqr
Square
sqrt
Square root
frac
Fractions
trunc
Truncate
round
Round
abs
Absolute value
rand
Pseudo random function
exp
Exponential function
ln
Logarithm, base e
log
Logarithm, base ten
sign
Sign
String functions: Relational Operators
+
Link/concatenate
>
Greater than
<
Less than
>=
Greater or equal
<=
Less than or equal
=
Equal
<>
Not equal
Results are: true=1; false=0
For comparison operations with strings, the characters of the strings are
weighted corresponding to the value in the ASCII Table, shown in the ASCII
Table on page C-1. The strings are checked character by character and
sorted by priority.
Additional String Operations
Operation
Parameter
Description
strlen
(String)
Length of strings (numerical result)
strind
(String, Search-string)
Position of the search-string in a string (numerical result)
strval
(String)
String-value, Numerical value of the strings.
substr
(String, Start, Length)
Substring, Result is a substring with defined length and start
position (Start and Length are numerical and also may be expressions!).
upper
(String)
Convert characters of string to upper case
lower
(String)
Convert characters of string to lower case
strsel
(Condition, TrueString,
Select string depending on a special condition
FalseString)
Constants
PI
Pi (π)
e
e function
True
Is true (=1)
False
Is false (=0)
4-55
ServiceLab
Main Menu
(
Open parenthesis
)
Close parenthesis
Priority of Strings
1st Step
Sort =>
2nd Step
= Result
sand
Position 1
Sand(1)
SAND(1.1)
Sand
Position 2
SAND(1)
Sand(1.2)
sAnd
Position 3
sand(2)
sAnd(2.1)
SAND
Position 4
sAnd(2)
sand(2.2)
SAND > Sand > sAnd > sand
1st Step
Sort =>
2nd Step
3rd Step
4th Step
= Result
Sund
Position 1
Sund(1)
Sand(1.1)
Sand(1.1.1)
Sand(1.1.1.1)
sOnd
Position 2
Sand(1)
Sund(1.2)
Sund(1.2.1)
Sund(1.2.1.1)
Sand
Position 3
sOnd(2)
sOnd(2.1)
sOnd(2.1.1)
sOna(2.1.1.1)
sOna
Position 4
sOna(2)
sOna(2.1)
sOna(2.1.1)
sOnd(2.1.1.2)
Sand > Sund > sOna > sOnd
Characters that influence the sort are bold! The priority after each step is shown
in the brackets. If all strings have a different priority, the operation is aborted
because the resulting step is reached.
Value of Strings
The string has to start with a numerical character or decimal point (point or
comma); otherwise the string value is 0. Leading blanks are ignored. If there is a
blank within a numerical string it is interpreted as an alphanumerical character.
Any following numerical characters are lost.
String
Value
String
Value
1.0
1
,2
0,2
1,05
1,05
12, 35 EUR
12
1 EUR
1
1EUR 95 Cent
1
3,045.23
3,045
EUR 1,05
0
Global Strings used in Modules
Most modules can process Global Strings. ServiceLab is constantly improving,
and adding places where you can use Global Strings. One way to determine if a
parameter box permits a Global String is to right click in the parameter box. If
the popup menu shows Global String… then you can use a string successfully in
that location.
4-56
ServiceLab
Worksheet Window Menu
Predefined Global Strings
The global strings in the following list are predefined and are offered in selection list for quick insert:
Strings with System Information:
String
Description
${DATE}
Current Date
${TIME}
Current Time
${DAY}
Day of current date (numeric, 1-31)
${MONTH}
Month of current date (numeric, 1-12)
${YEAR}
Year of current date (e.g. 2001)
${HOUR}
Hour of current time
${MINUTE}
Minute of current time
${SECOND}
Second of current time
${DAY_LZ}
Current day with leading zero (e.g. 07)
${MONTH_LZ)
Current month with leading zero
${YEAR_2)
Current year with last two digits (e.g. 01)
Worksheet specific Strings
String
Description
${FLOWCHART}
Name of Flowchart without path
${FULL_FLOWCHART)
Name of Flowchart with full path
${CREATION_DATE}
Date of Worksheet Creation
${CREATION_TIME}
Time of Worksheet Creation
${MODIFY_DATE}
Date when Worksheet was last changed
${MODIFY_TIME}
Time when Worksheet was last changed
${START_DATE}
Measurement Start Date
${START_TIME}
Measurement Start Time
${AUTHOR}
Author, as defined in DASYTEC File Info
${COMPANY}
Company, as defined in DASYTEC File Info
${DEPARTMENT}
Department, as defined in DASYTEC File Info
${TITLE}
Title, as defined in DASYTEC File Info
${DRIVER_MESSAGE}
Driver specific message
4-57
ServiceLab
Main Menu
1.6.12
Define Global Variables
You can define and modify Global Variables while a measurement is running.
You can pass variables to subsequent worksheets running in succession (see the
Working Example below). You can define up to 999 Global Variables. When the
measurement is running a Global Variable can be defined or modified using the
menu command Define Global Variables.
Defined variables are stored with the worksheet.
Optionally, you can load a Global Variable after starting a worksheet or save a
variable into the SERVICELAB.INI file when you stop. Other applications are
able to modify variables via DDE. And you can define, load or save a Global
Variable using Event Driven Actions or Key Events. You can display Global
Variable as text objects in Layout Windows. Use the placeholder ${VAR_xxx}
in the line text object. Replace xxx with the number of the variable.
Several System/Program Information strings and variables (such as Free Memory, System Resources, etc. /Author, Company, etc.) are implemented in ServiceLab as fixed placeholder strings/variables. If an Edit field will accept
placeholders, right mouse click in the Edit field to open a Popup menu with the
additional menu item Global Variable.... This Item opens a list with all available
variables. Double-Click on the requested placeholder to insert it into the Edit
field
Use the Action module to save the variable to the INI file while the experiment is running
Each Global Variable is composed of a number, numerical value (max. 255
char.) and one or more Options. The Reset button sets all variables in the list to
the default settings. The Reset all button deletes all variables.
You can select and modify more than one variable simultaneously using the
mouse to select a range, using the SHIFT key to select a contiguous range and
the CTRL key to select non-contiguous variables.
You can define the following Options to handle Global Variables.
Read from INI file at start of experiment
Write to INI file at stop of experiment
No DDE access to Global Variable
Write to DASYTEC Header
Show Global Variable in window
Type In at start of experiment
You can also define a short description.
Extended…
Click on the extended button to make additional settings for Global Strings.
4-58
ServiceLab
Worksheet Window Menu
Name: You can define a name to be used with variables and strings. You
can refer to the String/Variable using the defined name: ${NAME} or by
its number {$VAR_xxx} or {$STRxxx}.
Expressions: If the Calculate Expression automatically option is activated
you can define a mathematical expression similar to the Formula Interpreter. The expression is allocated to the variable or string. If one of the
parts in the expression is changed, the variable or string is automatically
recalculated.
The settings made in the Extended… dialog box are not permanent until
the main Define Global Variables... dialog is closed using the OK Button.
See Define Global Strings Extended… on page 4-54 for details of the settings and features.
Global Variables used in Modules
The following list shows you the modules that can process Global Strings. ServiceLab is constantly improving, and adding places where you can use Global
Variables. One way to determine if a parameter box permits a Global Variable is
to right click in the parameter box. If the short menu shows Global Variable…
then you can use a variable successfully in that location.
Predefined Global Variables
The global variables in the following list are predefined and are offered in the
selection list for quick insert:
Variables with system information:
Variable
Description
${SYS_RES}
Free System Resources: This variable shows the
load of the Windows system resources. If the
value decreases (in %), the load increases.
Free GDI Resources: This variable shows the
load of the resources of the Windows Graphic
Device Interface. If the value decreases (in %),
the load increases.
Free User Resources: This variable shows the
load of the Windows user resources. If the value
decreases (in %), the load increases.
${GDI_RES}
${USER_RES}
ACTUAL_YEAR}
${ACTUAL_MONTH}
${ACTUAL_DAY}
Actual Year: shows actual year as numerical
value, shown in 4-digit format (yyyy).
Actual Month: shows actual month as numerical
value.
Actual Day: shows the actual day as numerical
4-59
ServiceLab
Main Menu
${ACTUAL_HOUR}
${ACTUAL_MINUTE}
${ACTUAL_SECOND}
${WEEK_DAY}
values.
Actual Hour: shows the actual hour as numerical
values.
Actual Minute: These Variables show the actual
time (Year, Month, Day, Hour, Minute or Second)
as numerical values.
Actual Second: actual time (Second) as numerical
value.
Actual Day of the week: This Variable shows the
day of the week as numerical value. The order
starts with Sunday (value=0) end ends with Saturday (value=6).
ServiceLab / Worksheet specific Variables
Variable
Description
${BLOCK_SIZE}
Global Block Size: This value shows the preset
global block size
Sampling Rate: This value shows the preset
global sampling rate
Total Program Load in percent: This variable
shows the loading of the data acquisition program.
Values of 100% and higher are displayed if the
program is fully loaded or overloaded. In this
case, it threatens to interrupt the running measurement by the program. To reduce the load, decrease the sampling rate, increase the block size,
disable the animation and so on.
The displayed value isn’t very precisely calculated because the time base used is 55 msec. So
fluctuations in display are normal.
${SAMPLE_RATE}
${TOTAL_LOAD}
4-60
${TOTAL_DELAY}
Total Program Load in milliseconds
Time delay shows the time a sample needs to pass
all modules in worksheet. This may give an impression of the processing time that is needed to
perform all operations defined by the function
modules. The displayed value isn’t very precisely
calculated because the time base used is 55 msec.
Fluctuations in the display are normal.
${USED_BUFFER}
Used Driver Buffer: This value (in %) shows the
usage of the driver buffer of the program. If the
buffer is completely filled (100%), the measure-
ServiceLab
${DAPx_FREE_MEM}
${DRV_DATA_LOST}
${ELAPSED_TIME}
Worksheet Window Menu
ment stops with an error message Sampling rate
too high.
First check your flowchart and optimize it as
much as possible (see also Tips & Tricks in the
User Guide). Then check the buffer settings in
Experiment setup and increase if possible. Also
check whether other applications are running in
the background, which may delay data processing
in the program. Decrease the sampling rate and/or
increase the block size.
Free Memory on DAP Boards x (x=1 ... 8): This
value (in %) shows the usage of the driver buffer
of the Microstar DAP board. If the buffer is completely filled (100%), the measurement stops with
an error message Sampling rate too high.
First check your flowchart and optimize it as
much as possible (see also Tips & Tricks in the
User Guide). Also check whether other applications are running in the background, which may
delay data processing in the program. Decrease
the sampling rate and/or increase the block size.
Driver specific: shows the number of values lost
in the driver since the start of measurement. May
indicate performance problems with the driver’s
ability to capture data at the specified sampling
rate.
Elapsed time of measurement in seconds from the
start of measurement
Options for Global Strings and Variables
Read from INI File at start of experiment
If this option is chosen, entries in the INI file will be read and imported as actual
settings. ServiceLab will start the experiment with these Global Strings and
Variables.
Write to INI File at stop of experiment
If this option is chosen, all defined Variables or Strings are written to the INI file
when the experiment stops. These Global Strings/Variables are available in INI
File the next time you start the experiment.
4-61
Main Menu
ServiceLab
No DDE access to Global String/Variable
If this option is chosen, there is no DDE access to Variables or Strings. The Default setting is DDE access allowed.
Write to DASYTEC Header
When this option is chosen, this Variable/String is written into the file header
when you save data using the DASYTEC or ASCII format file formats. When using the ASCII format you must define whether the strings/variables should be
written as readable entries or just as information in the Write Data module. This
information can be read back using the Read Data module.
If Take variables or Take strings option in the Read Data module is active,
previously defined strings or variables will be overwritten.
Type In at Start Of Experiment
When this option is chosen, a dialog box will open when the experiment starts.
All defined Strings or Variables are listed in the input area. Up to 10 Strings and
Variables are displayed on each page. If there are more than 10 entries, you can
select the next page. You can change each String or Variable before starting
measurement.
If the Read from INI File at start of experiment option is also chosen, all entries in
the INI file are read and displayed in the dialog box.
Click the Start button to start measurement with the defined parameters. If you
choose Cancel, measurement will not start and the program will switch to the
ServiceLab worksheet window.
To change the order of the Variables/Strings shown in the startup dialog box, use
the Design Startup Dialog command in the Options menu.
Show Global String/Variable in Window
Choose this option to open a display window showing the contents of selected
Global Strings and Global Strings. The display will update when the values
change. The description and the contents are displayed, but not the number of the
Variable or String. Use this option to display the current file name when the File
Name -> Global String option is selected in the Read Data or Write Data modules.
Input is required to close dialog box
With this option activated, the input dialog box will not close unless at least one
character is entered into the entry field. This option affects the input of global
strings at start of measurement or using event driven actions.
4-62
ServiceLab
Worksheet Window Menu
File Name Dialog
Select this option to specify that the string will be used as a file name. At the
start of the experiment or via an Event Driven Action, an Explorer window will
be opened to select an existing file name. Double click on the file name to copy it
directly into the string window. In the Pull down window you can select the type
of file to be loaded. Choose whether the selected file will be used to load data
(Read Data) or to write it (Write Data).
Working Examples of Global Strings and Variables
Global Strings and Global Strings are useful in several modules. To use Global
Strings, an identifier ${STR_xxx} is inserted into an arbitrary alphanumeric
string, where xxx is a numeric character from 1 to 999 (${STR_0001} to
${STR_999}). Spelling is not case sensitive. You cannot have blanks between
the $ character and the curly bracket. Terms that are not recognized return an
empty string. Global Strings are specified by the identifier ${VAR_0001} to
${VAR_999}. ServiceLab automatically recognizes whether it should be used as
text or as a numerical value. The preset format is used for text. Maximum number
of characters in Strings or Variables is 256.
To manipulate Global Strings or variables via DDE, there are 4 new DDE items
available to the Menu topic: SetGlobalString, GetGlobalString,
SetGlobalVar and GetGlobalVar. With both Get functions, only the number is transferred as an ASCII value (in which case ServiceLab acts as a DDE
Server. The connection is a Cold Link). The result is sent back by ServiceLab as
an ASCII value. When there is no result (wrong number, etc.) ServiceLab answers with a string containing “Parameter Error.” To set Strings or Variables
(ServiceLab acts as a DDE Server. Connection has to be a DDE Poke) the number and the defined character string or the numerical value is sent separated by a
semicolon. ServiceLab doesn’t send an answer message.
Input strings/variables using actions
The Action Module has two global (ServiceLab) actions: Set Variable and Set
String which allow you to enter strings and variables. In the Action Module parameter settings you can define any string that will then be displayed as the title
of the input window.
These entries are only accepted if each global string With Input Required ... contains at least one character.
To access the variable/string No 1, the entry in channel 1 has to be 0, for No 2
use 1, in No 3 use 2 and so on. Only first 16 variables or strings can be accessed
(channel = 0 ... 15)
4-63
ServiceLab
Main Menu
Automatic Creation of directories with time stamp
To store data files automatically into separate directories with names containing
the actual month and day in their name, and with the hour of storing in the file
name, use the following entry in the Write Data module:
C:\SERVICELAB\DATA\${MONTH}-${DAY}\${HOUR}h
Additionally, the worksheet has to contain an Action module with the Close/open
worksheet action with the Global String has changed event on two channels. The
event parameter for the first channel is the ${DAY} string and on the second it is
the ${HOUR} string. On the third channel, the Save Data action must be initialized on the ${HOUR} event.
After measurement has started the following actions will happen:
(Starting date and time of measurement: May, 28th, 1998, 13:30)
Reaching the next full hour, a new directory
C:\SERVICELAB\DATA\05-28 is created and the file 14h.ddf is stored
in that directory.
When starting the next full hour, a new the file 15h.ddf is written into the
same directory and so on, until midnight is reached.
Now the new sub-directory 05-29 is created in ..\DATA\ and the first file
00h.ddf. Until the next change of date is reached, each hour a new file is written into the sub-directory.
This cycle repeats until measurement stops. The following file structure is created:
1.6.13
Export and Import Global Strings and Variables
Use this menu commands to export or import all Global Variables and Strings
into or from a file with the extension *.VAR. This feature allows you to exchange the of Global Strings and Variables settings between several worksheets.
This file format is binary, so you cannot edit it directly.
In addition to the *.VAR file format (generated by the Global Variable Export
function) you can now select the *.CSV and *.TXT (Excel format) file formats.
To import an Excel table the values need to be separated by a comma. The entries to configure the global variables are (Strings are not valid.):
4-64
ServiceLab
Worksheet Window Menu
Col 1
, Col
2
, Col 3
, Col 4
, Col 5
, Col
6
, Col 7
Num-
, Nam
, Descrip-
, No.
, No.
, Value
, Expres-
ber
e
tion
Chars
digits
sion
In this way you can configure the global variables in an Excel table. It is very
easy to use Copy and Paste functions to create similar configurations. You must
use caution to ensure that you do not enter the same entries several times into the
global variable dialog box.
Blanks at the beginning and end of the entries are removed. If the entry is longer
than the maximum length (name 19, description 23, and expression 255), it is
truncated.
If errors in are found when the file is read (for example, if the name contains a
reserved character, VarNumber is out of range, the expression is not defined,
etc.) then the offending entry is ignored. If the Expression field is empty then no
expression is defined for the variable.
You cannot import Variables/Strings while the worksheet is running.
1.6.14
Design Startup Dialog
Use this command to configure the order of the dialog box that is displayed when
the program starts. All Strings/Variables with the Type in at Start of Experiment
option activated are listed in the dialog box. Only the Short description is displayed (not the String/Variable number.) If there is no description the line is
empty, but is still available. Use the mouse or the cursor keys to select an entry.
Use the arrow button to move the selected line up or down. When the experiment
starts the next time, the Startup dialog shows the Variables/Strings in the new order.
If you disable the Type in at Start of Experiment option for one or several Variables/Strings, the entries are removed from the list and the following items move
up to the next free position. If you subsequently re-enable the option, the Variables/Strings are re-inserted at the first line of the list.
1.6.15
Copy Channel Names
This function causes ServiceLab to copy the channel names from each module to
connected modules. By default, the option is activated in the module dialog box
1.6.16
Switch to Runtime
Choose this function or click on the icon on the function bar, to reduce the ServiceLab worksheet window to its Runtime size. In its place, a minimized control
panel appears which contains only the status bar (displaying the current time and
the buffer status) and the control icons from the function bar which allow you to
start, stop, pause and continue the experiment.
4-65
ServiceLab
Main Menu
Additionally, all active display windows (analog/digital meters, scopes etc.) are
displayed on screen.
This option allows you to determine how your worksheet will appear when
loaded with the ServiceLab Runtime version; you can concentrate on those elements that are essential for the control and evaluation of the actual experiment.
1.7.
Window Menu
Use the commands of this menu to switch between Worksheet, Display and Layout windows or to create new VITool Layout pages.
New Layout
Control Sequencer
Display Windows
Worksheet
Layout
ServiceLab lists the names of all created windows, starting with the display and
followed by name of the worksheet. Then all Layout windows are listed. Click
on the name to activate a window. The Menu Bar will change depending on the
type of the activated window (Control Sequencer, Display, Worksheet or Layout).
You can also switch between display modes by clicking on the function bar icon.
1.7.1
New Layout
Use this command to create a new Layout Window. The name of worksheet and
the first nine Layout Windows are displayed below the menu commands. If there
are more than ten windows you can use the More command to see them.
1.7.2
Control Sequencer
Use this command or click on the function bar icon to switch to
the Control Sequencer View.
1.7.3
Display Windows
Use this command or click on the function bar icon to switch to
the Display Tree View
4-66
ServiceLab
1.7.4
Control Sequencer Menus
Layout
Use this command, or click on the function bar icon, to switch to
the Layout View
1.7.5
Worksheet
Use this command, or click on the function bar icon, to switch to
the Worksheet View.
2. Control Sequencer Menus
The commands of the Control Sequencer File menu enable you to save and open
Control Sequence files, to print worksheets, to manage your worksheet files, and
to exit the program.
Control Sequencer File
To control a multi-step application consisting of more than one ServiceLab
worksheets calling each other, ServiceLab offers a new tool, shown as new display window (analogous to the worksheet, display and VITool windows), called
the Control Sequencer Window. The contents of the window is stored in a new
type of file, the Control Sequencer file (saved with the suffix *.DSQ.)
The window shows a tree display of the control sequence. You can add any number
of worksheets into the Control Sequencer File, whose name is shown as root of the tree.
You can also multiple actions for each inserted worksheet to control the flow of the
worksheets.
In the Control Sequencer window you can load and save *.DSQ files using the
main menu file commands: New, Open, Save and Save As….
To insert flowcharts or actions you need to use the pop-up context menu that appears when you right mouse click on one of the junction points on the screen. Depending on the junction (flowchart or action) the pop-up menu offers several
commands to add, delete or to edit the object.
The Sequence file is a binary file type. You cannot edit it with ASCII Editor
programs such as Notepad.
2.1. File Menu
See Worksheet Window Menu: File Menu (page 4-1).
2.1.1
New
Choose this command to create a new Control Sequence file. The ServiceLab
Control Sequencer work area will be cleared completely.
4-67
ServiceLab
Main Menu
If there is already a Control Sequencer file loaded on the screen that has changed
since you last saved it, you will be asked to
save that file before beginning work on the new one,
or to reject those changes,
or to recall the New command.
After creating the new Control Sequencer file you can save it to a file by selecting the Save or the Save As... commands from the File menu.
Click on the Save icon in the function bar to save the current file.
2.1.2
Open...
Choose the Open command, or click the function bar icon, to open a Control Sequence file that has been previously saved. The ServiceLab Control Sequence
work area will be cleared completely.
If there is already a Control Sequencer file loaded on the screen that has changed
since you last saved it, you will be asked to
save that file before beginning work on the new one,
or to reject those changes,
or to recall the Open command.
After choosing the Open command you can select the file on which you want to
work from a list of files.
You can ...
open one of the files from the list directly by double-clicking the file
name,
select a different directory by double-clicking the directory name,
select a different file format for the file display, or
select a different drive.
To use your keyboard, press the TAB or the SHIFT+TAB keys to move from one
field to another; select items from the lists by pressing -, ¯, SPACE and the
ENTER key.
In the File Name box you can define the filter for the file list. The default setting
for the filter (*.DSQ) will create a list of ServiceLab Control Sequencer files,
which usually have the extension *.DSQ.
Type a different extension, or use wildcards (like *.*), to display lists of different groups of files. For example, if you have saved ServiceLab Control Sequencer files with extensions other than *.DSQ (using the Save As... command
from the File menu).
However, ServiceLab can only open files in the special own DSQ format no
matter what extension the files have.
4-68
ServiceLab
2.1.3
Control Sequencer Menus
Save...
Choose the Save command, or click the function bar icon, to save a Control Sequence file.
If you have created a new Control Sequence file (New from the File menu) without saving it to a file (untitled is displayed in the ServiceLab window title bar),
you can select the file name, the directory and the disk drive where the file is to
be stored:
Type the file name in the File Name box.
If you do not type an extension, ServiceLab will automatically add the
standard extension (*.DSQ). **Name1 always saves worksheet files in its
own format, even if you select an extension other than *.DSQ.
You can...
select one of the file names in the list by double-clicking the file name.
The file that was originally saved under that name will then be replaced
with the new worksheet. A warning message will first appear, asking you
to either confirm the procedure or to cancel it.
select a different directory by double-clicking the directory name, or
select a different drive for the new file.
(To use your keyboard, press the TAB or the SHIFT+TAB keys to move from
one field to another; select items from the lists by pressing -, ¯, SPACE and the
ENTER key.)
If you have previously saved the Control Sequence to a file (using the Save As...
or Save commands from the File menu), or if you have opened an existing file
(command Open... from the File menu), its name is displayed in the ServiceLab
window title bar.
Select the Save command, or click the function bar icon, to save the current Control Sequence file. The existing file will be replaced without further messages.
2.1.4
Save As…
Choose the Save As command to save a Control Sequence with a new file name,
in a different directory, or on a different drive.
After you have chosen the Save As... command from the File menu you can select
the file name, the directory and the disk drive where the file is to be stored.
Type the file name in the File Name box.
If you do not type an extension, ServiceLab will automatically add the
standard extension (*.DSQ). ServiceLab always saves Control Sequence
files in its own binary format, even if you select an extension other than
*.DSQ.)
You can...
select one of the file names in the list by double-clicking the file name.
The file that was originally saved under that name will then be replaced
4-69
ServiceLab
Main Menu
with the new Control Sequence. A warning message will first appear,
asking you to either confirm the procedure or to cancel it.
select a different directory by double-clicking the directory name, or
select a different drive for the new file.
(To use your keyboard, press the TAB or the SHIFT+TAB keys to move
from one field to another; select items from the lists by pressing -, ¯,
SPACE and the ENTER key.)
2.2. Edit Menu
This view does not include an Edit Menu.
2.3. Experiment Menu
See Worksheet Window Menu: Experiment Menu (page 4-22).
2.4. View Menu
See Worksheet: View Menu (page 4-37).
2.5. Options Menu
See Worksheet: Options Menu (page 4-80).
3. Tree View Menus
3.1. File Menu
See Worksheet Window Menu: File Menu (page 4-1).
3.2. Edit Menu
This view does not include an Edit Menu.
3.3. Experiment Menu
See Worksheet Window Menu: Experiment Menu (page 4-22).
3.4. View Menu
See Worksheet: View Menu (page 4-37).
3.5. Options Menu
See Worksheet: Options Menu (page 4-80).
4-70
ServiceLab
3.5.1
Tree View Menus
Tree Display Setup
Use the menu command to change the properties of the Display Window.
Display:
Normal: In the 32-bit version, this setting shows the measurement setup as
a structured tree similar to the Windows Explorer. Click onto the elements of the tree to open the next branch or an accompanying dialog box.
In the 16-bit version, the window is empty.
Bitmap: Choose this option to insert any picture in BMP or WMF format
into the Window. Use the Bitmap... button to select the bitmap file.
The bitmap is not stored with the worksheet, but only a link to that file is
stored. The specified bitmap file has to exist in the named directory to be displayed.
Sorting (not available in 16 bit version): Select the order the modules are
displayed in the tree:
Alphabetically: All modules are listed in alphabetic order.
Alphabetically, Black Boxes separately: All modules are listed alphabetically, but the modules inserted into Black Boxes are listed separately.
Class of modules: Modules are assigned to the several module groups and
then are listed in alphabetic order.
Creating order: Modules are listed in the order they were inserted into
the worksheet.
Bitmap Display: The Original Size of Bitmap option shows the inserted
bitmap scaled 1 / 1 (Pixels) centered in window. The background of the
window is colored as selected in the Option Menu of the Worksheet Window.
The Stretch Bitmap switch adapts the Bitmap to the window frame. Proportions of picture may be distorted.
The Tiled setting fills the complete frame with pictures of the bitmap
(sized 1/1).
Background: Click on this button to choose a color for the background.
3.6. Window Menu
The options of this menu are described in Worksheet: Window Menu (page 466).
4-71
ServiceLab
Main Menu
4. Layout Window Menus
4.1. File Menu
See Worksheet Window Menu: File Menu (page 4-1).
4.2. Edit Menu
The commands of the Edit menu allow you to copy, paste and delete the ServiceLab Layout Elements displayed on the screen.
Layout to Clipboard
Layout…
Select
Undo
Cut
Copy
Paste
Delete
4.2.1
Layout to Clipboard
Use this command to copy the Layout Window as a Windows Metafile
(WMF/CLP) to the Clipboard.
See Worksheet Window Menu: Worksheet to Clipboard (page 4-12).
4.2.2
Layout…
Use this command to save or load Layout Windows onto the worksheet. See
Worksheet Window Menu: Layout (page 4-12).
4.2.3
Select Layout Window
Use the menu function to activate the toolbox selection tool.
4-72
ServiceLab
4.2.4
Layout Window Menus
Undo
Use this command to undo the last operation. All changes to Layout Objects
(like modifying colors, size or other properties) are canceled. Choose this
function using the Undo menu command or by using the ALT+Backspace or
CTRL-Z key combinations.
4.2.5
Object Cut, Copy, Paste and Delete
You can copy and paste objects of the Layout Window including their properties:
Selection: First select the objects: click and hold the left mouse button
inside the worksheet and select the area by dragging the cursor. When you
release the mouse button, the selected modules are highlighted. You can
select or deselect single objects by clicking the left mouse button on the
module while pressing the SHIFT or CTRL key.
Copy: Choose the Edit/Copy menu command or the CTRL-INSERT or
CTRL-V key combinations. The selected objects are inserted onto the
worksheet with their properties settings intact.
Cut: To move modules around the worksheet, choose the Edit/Cut menu
command or the SHIFT+DEL or CTRL-X key combinations to remove
the objects from the worksheet and to save them for a Paste operation.
Paste: Now paste the stored objects by choosing the Edit/Paste menu
command or pressing SHIFT+INSERT or CTRL-V. After activating
the insert mode, the mouse cursor changes. Choose the position where the
selection should appear. The window is scrolled automatically when the
mouse cursor moves outside the window border. Once the mouse cursor
is at the destination, press the left mouse button to paste the objects into
the Layout Window. The paste operation can be repeated.
Delete: Choose the Delete menu command or the Delete key to delete the
selected objects
4-73
ServiceLab
Main Menu
4.3. Object Menu
Choose the objects you want to insert into the Layout Window. You can also
choose objects using the Layout Window Toolbox. The Properties command allows you to change the characteristics of the selected object.
Drawing Elements
Visualization
Text Elements
Properties
Placement
4.3.1
Drawing Elements
Choose this command to select Drawing Elements to be inserted into the Layout:
Line
Bitmapped Graphics
Ellipse – filled or not filled (outline)
Rectangle – filled or not filled (outline)
You can also choose an element by using the Tool Box buttons.
Click the left mouse button inside the Layout Window to define the start position
of the Element. Click and hold the mouse button to draw a frame that defines the
size of the element. Release the left mouse button to complete the command. To
set properties of an element, select it with a left mouse click. Display the Properties Dialog Box by double clicking on the frame.
Properties (all objects)
Placement: Units for Position and Size are set in Centimeters or Inches depending on the settings in Main Menu File: Page Format.
Color: Use the Color button to select the color in the Windows Color Menu Box.
The object will be drawn in the selected color.
Bitmapped Graphics Properties
Drawing Mode:
This Option changes how the imported bitmap is shown in the frame.
Adjusted: The Bitmap is resized to the borders. Because the aspect ratio
is not maintained, the picture can be contorted.
4-74
ServiceLab
Layout Window Menus
Scaled: The picture is completely shown in the frame. It is displayed
enlarged or reduced with original aspect ratio
Original: The Bitmap is displayed in its original pixel size (number of
pixel in the bitmap = number of pixels on the screen). If the frame is
smaller than the bitmap, all parts of the picture rising above the lower and
right border are cropped (not displayed).
File Name: This entry shows the name of the Bitmapped Graphics File that will
be displayed. You cannot edit this entry. To change the File you must use the
File… Button.
The left window of the dialog box shows all available files in directory, the right
window shows the directory file structure. The File Format command selects the
Bitmapped Graphics File Format (*.BMP, *.WMF). The Drive command selects
the drive you want to read from.
External Bitmapped Graphics are not stored in the worksheet. Only the name
and path of the files will be stored. To display the specified bitmap, the file
must be available in the specified directory. Bitmapped Graphics inserted by
using the clipboard are stored with the worksheet.
4.3.2
Visualization
Choose this command to select a Visualization Element to be inserted into the
Layout. These elements are linked with the Display Modules of the worksheet.
You can create a maximum of 512 linked elements in the VITool Layout Windows.
Text
This Visualization Element shows the contents of the alphanumerical displays such as List module or Digital Meter module as dynamic text elements on the Layout page. Only the alphanumeric characters are displayed
but not window elements such as borders or window caption.
Graph
This Visualization Element shows the contents of the display modules on
the Layout page. Only the contents of the display area are displayed but
not window elements such as borders or window caption.
You can also choose an element by using the Tool Box buttons.
Click the left mouse button inside the Layout Window to define the start position
of the Element. Click and hold the mouse button to draw a frame that defines the
size of the element. Release the left mouse button to complete the command. To
set properties of an element, select it with a left mouse click. Display the Properties Dialog Box by double clicking on the frame.
4-75
Main Menu
ServiceLab
Properties (all objects)
Placement: Units for Position and Size are set in Centimeters or Inches depending on the settings in Main Menu File: Page Format.
Linked Text Properties
Link: Choose the name of the module that will send the strings.
Text: Insert the text that should be shown in front of (pre) and after (post) the
linked string.
Options
Alignment: Text can be aligned right, left or centered.
90° Rotation: The text Frame will be rotated 90° counter clockwise.
Font: Use the Font button to select font and size in the Text Menu Box.
Use only TrueType fonts with rotated Linked Text Objects to prevent problems.
Linked Graph Properties
Link: Choose the name of the module that will send the graphical information.
Auto Update: If this option is turned off, the display of linked graphical objects is
not updated when new data is received. To update manually, use Key Events or
Event Driven Actions.
Sync Event Handling: Use this function with synchronous Event Driven Actions to
synchronize the Layout display with an event driven action. While this function is
disabled, there may be incorrect or inconsistent data when printing a Layout
Window (premature or late blocks).
Fast Draw Function: While this Option is active, only the dynamic Elements of
the Graphical Object are updated. You will get a better screen view, with less
“flashing” as the data is updated.
Display:
Background: While this option is active, the background in the object
frame will not be transparent but will be opaque and colored. To select
the color, use the Color... button.
With frame: While this option is chosen, the object frame will not be
transparent but will be visible and colored. To select the frame color, use
the button Color....
Frame as shadow: While this option is chosen, a shadow is displayed on
the object frame.
Width: This entry defines the thickness of the drawn object frame.
Zoom: X/Y, Y/t or Recorder Chart modules can be zoomed as well as in the display windows on worksheet:
4-76
ServiceLab
Layout Window Menus
Zoom-In: With the Ctrl-key pressed, you can draw a rectangle with left
mouse button pressed. The marked area will be scaled to the size of the
display area in the graph link.
Zoom-Out:You can resize the zoomed display with Ctrl-key pressed and a
right mouse click in the display area.
Cursors: If there are cursors shown in the display window in worksheet or display views, they are also shown in the linked object in the VI-tool Layout Window. You can move the cursors using the mouse. If you want to display the cursor data on your layout page, you must activate the Survey Print Cursor Data in
VI-Tool menu command in the display window menu. You can access this menu in
from the Layout Windows object by right-clicking the mouse. A tear-off menu
will appear where you can select command.
Setup: This button opens the Display window Setup dialog of the module linked
to that graphic object.
4.3.3
Text Elements
Choose this command to select between two types of Text Elements that can be
inserted into the Layout.
Text Line
Text Block
Text Grid
Also you can choose the Elements by using the Tool Box buttons.
Click the left mouse button inside the Layout Window to define the start position
of the Element. Click and hold the mouse button to draw a frame that defines the
size of the Element. Release the left mouse button to complete the command. To
set properties of an Element; select it with a left mouse click. Display the Properties Dialog Box by double clicking on the frame.
Text Line / Block Properties
Placement: Units for Position and Size are set in Centimeters or Inches depending on the settings in Main Menu File: Page Format.
Text: Insert the text that will be shown on Layout.
A Text Line is always shown in one line. It will be cut (truncated) at the end
of the line. The text of a Text Block will be broken at the end of the line and
continued in the next line.
A Text block is always shown in one complete block. It will be broken at the
end of line and continued on the next line.
You can use placeholders to insert special system information including the
date, time, file name, or global variables and strings.
4-77
ServiceLab
Main Menu
Grid Text Properties
Select the following Properties:
Placement: Units for Position and Size are set in Millimeter or Inches depending on the Main Menu File: Page Format settings. Depending on the
number of columns, the List is split into columns of the same width. The
height of rows depends on the selected font size.
Setup: The list is shown with the defined number rows and columns.
Text Setup: The input of row and column number selects the cell to be
edited. The text has to be inserted into the edit field below. You can use
placeholders to insert special system information (e.g. data, time...).
Text in the cells will not be wrapped at the cell border but written above the text
of the next cell.
Alignment: You can set the alignment to left, right or centered.
Font: Use the Font button to select the font and color in the Text Menu
Box. The font size takes effect to the height of the rows of the list on the
layout.
Display
Background: when this option is active, the background in the object frame
will not be transparent but will be opaque and colored. To select the color,
use the Color... button.
With frame: when this option is chosen, the object frame will not be transparent but will be visible and colored. To select the frame color, use the button
Color....
Frame as shadow: when this option is chosen, a shadow is displayed on the
object frame.
Width: This entry defines the thickness of the drawn object frame.
Options
Alignment: Text can be aligned right, left or centered.
90° Rotation: The Text Frame will be rotated 90° counter clockwise.
Font: Use the Font button to select the font and size in the Text Menu Box.
Use only TrueType fonts with rotated Linked Text Objects to prevent
problems.
Placeholders in Text Objects
You can use placeholders to insert special system information including the date,
time, file name, or Global Strings and Strings. The following placeholders are
available:
4-78
ServiceLab
Layout Window Menus
Placeholder
Information Inserted
Available in
${DEPARTMENT}
${AUTHOR}
${DATE}
${COMPANY}
Department from File Info
Name of Author from File Info
Actual System Date
Name of Company from File
Info
Actual System Time
List of defined Key Actions
Text line
Text line
Text line
Text line
${TIME}
${KEY_ACTIONS
}
${STRING_[No]
}
${STR_[No]}
${VAR_[No]}
Text line
Block text
String No X, defined in Op- Text line
tions Menu
String No X, defined in Op- Text line
tions Menu
Variable No X, defined in Op- Text line
tions Menu
Insert Strings and Variables Number without the square bracket inside the
curly brackets, for example, ${STRING_33} will insert the Global String number 33.
Right-click on the text entry box to see a pop-up menu that allows you to
choose from available Global Strings or Variables, including system variables.
4.3.4
Properties
This command opens the Properties Dialog Box for the Layout page or for the
selected Layout object.
4.3.5
Placement
Choose this command to change the position of layered elements. You can
move the selected element one layer Up or Down or move them into the Front
or Background.
4.4. Experiment Menu
See Main Menu: Worksheet Window Menu: Experiment (page 4-22).
4-79
ServiceLab
Main Menu
4.5. View Menu
The commands of this menu allow you to change the appearance of the ServiceLab layout on the screen. Some of these functions can be chosen by clicking
the corresponding icons on the Function Bar.
Function Bar
Module Bar
Status Bar
The above options of the menu are described in the Worksheet: View Menu
(page 4-37).
Zoom / View
Full Screen
Zoom / View Layout Window
Use this command to zoom the Layout Window (25% to 200%). Use command Fit
to Screen and Fit to Page to adapt the Layout Window format of the screen or the
page.
Full Screen
Use this command to show the Layout Window in Full Screen Mode. Its size will
be adapted to show the whole Layout Window. All elements such as Function
Bar, Menu Bar and so on are hidden. Use the ESC key to change to normal mode.
To get best results for Full Screen Display use the screen Page Format. You
can select it using the properties command of the Object Menu.
4.6. Options Menu
The commands of this menu allow you to change the display of the ServiceLab
Layout window.
Global Layout Properties
Layout Page Properties
Default Directories
Default Fonts
Colors
Autorouter
Password Protection
Password Definition
4-80
ServiceLab
Layout Window Menus
Screen Locking
Key Events
Define Global Strings
Define Global Variables
The above options of the menu are described in Worksheet Window Menu:
Options Menu (page 4-43).
Layout Window…
Layout Page…
4.6.1
Global Layout Properties
This option allows you to define the starting options of all defined Layout Windows. These options apply to all layouts of the open worksheet. The following
settings are available:
Mouse: While Mouse To Interact With Instruments is active, you can only
operate elements like switches or push buttons. You are not able to create
objects or modify them.
To create or modify elements in the Layout Window, you have to switch
to the Mouse to interact with Layout Window option.
View: Choose the Load As Full Screen option to load the first Layout
Window into the foreground when ServiceLab is next started. If the worksheet window was active when ServiceLab was closed, it will be placed
in the foreground.
4.6.2
Layout Page Setup
Use this menu command, or double click anywhere on the Layout Window to
open the Properties dialog box. You can change the following:
Format: Select between DIN or US page formats (Landscape or Portrait)
or choose Screen format.
Name: In the edit field below the format you can define an individual
name for this layout window. Instead of the default name, Layout X, the title of the Layout window will be Name X. The layout number is still used
by in Action modules to control switching between several layouts.
Border: You can define Borders. All text objects outside the defined border will be cut off. The Visible option allows you to fade out/in lines that
mark the defined borders. The Use border switch activates the clip function.
Grid: The Snap to grid option places all objects according to the defined
grid.
The default Distance of the grid is 5 mm (0.2 inch). To display the grid on the
screen, activate the visible option.
4-81
ServiceLab
Main Menu
The following settings control the display properties of layout objects.
Object Display:
Show objects only: Only the origin object is displayed on the layout.
Objects with frames: Objects with their position borders are shown.
Only frames: Only the position borders are shown.
Objects outside the page
Hide objects: This selection hides all objects that are placed out of the
defined working area.
Show objects: This option shows all objects, regardless of where they are
placed.
Delete objects automatically: All objects placed out of the working area
are deleted automatically.
Moving Objects via keyboard:
This setting defines the steps objects are moved using they arrow keys of keyboard:
Pixel Size: The selected objects are moved pixel by pixel. Absolute
movement of object depends on the chosen zoom factor and resolution of
screen.
Steps of XXX mm: All objects move in steps of millimeters. Relative
width of step on the screen depends on the chosen zoom factor and defined size of page.
Grid Distance: The objects move in steps of the chosen width of grid.
Relative width of step on the screen depends on the chosen zoom factor
and defined width of grid.
Color Buttons
Use the background... or Grid... color button to change the colors of the
background of the layout sheet or the grid.
The Default button loads the default settings of that dialog box.
4.7. Window Menu
The options of this menu are described in Worksheet: Window Menu (page 466).
4-82
ServiceLab
5.
Help Menu
Help Menu
The commands of the Help menu allow you to obtain on-line help for the following program functions and for your data acquisition hardware. It also provides
overviews and on-line tutorials.
5.1. Index
This option activates the Help system and displays the index of topics for
which help can be obtained.
5.1.1
Instruction
Click this button to display on-line instruction on
how to use the ServiceLab Help System.
Printed instructions on how to use the Help system are found in Chapter 2 of this
manual.
Further information on how to use the Windows Help system can be obtained by
pressing the F1 function key while using a Help window, or by choosing Using
Help from the Help menu.
5.1.2
References
Alphabetic Index of Help Topics / Alphabetic List of Modules
Choose this menu function to view the alphabetical lists containing all the topics
for which help is available. Use the scroll bars or press the ↑, ↓, PgUp or PgDn
keys to scroll through the lists then click on the topic for which you want information. You can also select a topic by pressing the TAB key until the topic is
highlighted, then press ENTER.
Click the Search button at the top of the Help window or press the S key on
your keyboard for information on a specific topic.
Glossary
Choose this menu function to view the alphabetical list of terms with definitions
that can be displayed as pop-ups on the screen.
A line indicates the end of each of these definitions. If a line does not appear
at the bottom of the text box, your Help window is too small. Enlarge its size
by dragging its borders or corners while pressing the left mouse button, and
click the term again. Or, you can use the Scroll Bar to move around the window.
4-83
ServiceLab
Main Menu
Main Menu Options
Choose this menu function to view the Help pages for all of the ServiceLab menu
options and commands.
Module Selection Menu
Choose this menu function to view the Help pages for all of the module groups
and modules.
5.1.3
Step by Step Instructions
The Elements of the ServiceLab Screen
Choose this menu function to view the overview of the ServiceLab screen elements found in Chapter 3.
Module Configuration and Manipulation
Choose this menu function to view general comments on how to install, configure, connect, move and delete modules. This information can be found in Module
Reference Guide.
Creating your First Worksheet
Choose this menu function to view the instructions found in Chapter 2 of this
manual.
5.1.4
Surveys
How to Start/Stop an Experiment
Choose this menu function to view the overview of the menu commands and instructions for automatic experiment control methods that can also be found in
Chapter 6 of this manual.
Customizing the ServiceLab Screen
Choose this menu function to view the information found in Chapter 3 of this
manual.
Worksheet Examples
Choose this menu function to view instructions for using the sample worksheets
that are installed with ServiceLab.
ServiceLab by Keyboard
Choose this menu function to view the instructions found in Chapter 6 of this
manual.
4-84
ServiceLab
5.2.
Help Menu
Hardware
If you have installed a data acquisition board in your system, choose this menu
function to obtain specific help about that board.
Read the Hardware Installation Manual for additional information concerning
installation and operation of your data acquisition device.
5.3.
Glossary
Choose this menu function to view the alphabetical list of terms with definitions
that can be displayed as pop-ups on the screen.
5.4.
Using Help
This option provides help for how to use the online help system.
5.5.
System Information…
Choose this menu function to view information on your hardware, operating system, Windows version, system resources, etc.
5.6.
About ServiceLab…
Choose this menu function to view information on the current ServiceLab version.
Your own company logo can be displayed in the INFORMATION box (see
Chapter 6 for details).
4-85
Main Menu
6.
ServiceLab
Customizing the Main Menu: External Programs
You can easily insert menu items into ServiceLab’s main menu to start external
programs directly from within ServiceLab.
Use a text editor, such as Notepad, to make the following entries in the
SERVICELAB.INI file (located in the ServiceLab directory):
[External Tools]
ToolNumber=number
ToolMenuText1=&name1
ToolMenuText2=&name2
……Etc.
ToolPathName1=path\programname1
ToolInitialDir1=startingdirectory1
ToolArguments1=startingparameters1
ToolAskArguments1=0
ToolPathName2=path\programname2
ToolInitialDir2=startingdirectory2
ToolArguments2=startingparameters2
ToolAskArguments2=0
……Etc.
Each external program has a separate entry as described above. Items shown in
italic text must be replaced with the actual name, path, and any parameters necessary to start your program. Up to 16 external programs can be defined.
4-86
ServiceLab
Files and File Formats
Chapter 5: Files and File Formats / DDE / Network
1.
Files and File Formats
1.1. Worksheet Files (*.DSB)
A worksheet file (standard extension .DSB) contains the complete worksheet
with its most important settings.
The following worksheet settings will be saved:
The type and screen position of all the modules,
The number of inputs and outputs of each module,
The settings specified in each module configuration dialog box,
All the data channels, branches and their exact positions,
Global settings including the acquisition rate and the block size (Experiment menu),
All the entries in the File Info dialog box (File menu).
The following environment settings will be saved with the worksheet:
The mode (normal, minimized…), position and size of the main window
and the visualization window,
The Module Bar configuration,
All the entries in the Page Format dialog box (File menu).
The following settings will not be saved with the worksheet:
The settings of the Start/Stop at Time functions (Experiment menu),
The settings of the Auto Start function (Experiment menu),
The View menu settings for the display of the Module Bar, the Function
Bar, and the Animation function,
The Options menu settings (Window Setup, Colors, and the Autorouter
function).
A worksheet file can be viewed in part by using the MS-DOS command TYPE.
Some global information like the current time and date, comments, etc., is contained in human readable format at the beginning of the file.
1.1.1
Worksheet Exchange Files (*.DSA)
The file with the extension *.DSA stores a worksheet with the same information
as the original ServiceLab worksheet file (*.DSB), but formatted in ASCII. This
format is uses to exchange worksheets between different program versions (16
bit and 32 bit). Saving ASCII format will take a longer time and needs more disk
space than storing in DSB format
5-1
Files and File Formats / DDE / Network
ServiceLab
In addition to the *.DSA file ServiceLab creates a file with the extension
DMX, which contains the graphical matrix of the worksheet, such as data
channels position of modules and so on. To load a worksheet as ASCII file
both files *.DSA and *.DMX has to be available.
1.1.2
Worksheet Text Files (*.TXT)
This file format with the extension *.TXT contains simple text, which describes
the modules and settings used in the worksheet. This file is only useful to rebuild
worksheets manually. ServiceLab is not able to reload these files, because all
graphical information, such as position of modules or data channel links, is not
stored.
1.1.3
HTML Text Files (*.HTM)
This file format is used to save worksheets as HTML files, using HyperText
Markup Language, as used in the Web. These files contain all elements and important settings of a worksheet. The files cannot be reloaded but are a powerful
help for documentation and rebuilding your projects
1.2. Control Sequencer Files (*.DSQ)
To control large application controlled by more than one worksheet calling each
other use the Control Sequencer Window. The contents of this window is stored
in a binary file, the Control Sequencer file with the suffix *.DSQ.
You can add any number of worksheets into the Control Sequencer File and also
you can define several actions for each inserted worksheet to rule the course of
the
worksheets.
The contents of the Control Sequencer File is shown and edited as new display
window (in analogy to the worksheet, display and VITool windows).
The file format type is binary, so you cannot edit it in a standard ASCII Editor.
1.3. Module Bar Files (.DML)
These files contain configurations of the Module Bar and are used to define ServiceLab environments for different application areas. They can be created by
choosing the Save As… command from the Module Bar submenu of the Edit menu.
The current configuration of the Module Bar will be saved by ServiceLab in the
file SERVICELAB.DML. This file will by default be used for the next start of
ServiceLab.
5-2
ServiceLab
Files and File Formats
1.4. Layout File (.LAY)
These files contain configurations of the Layouts and are used to save user defined Layout settings to import into different worksheets. They can be created by
choosing the Save As… command from the Edit submenu: Layout…
1.5. Serial Port Settings (.SIN/.SOU)
The settings of the serial interface are stored in these files. They can be created
by choosing the Save Button in the module dialog box of the serial modules.
Load these files to quickly configure the ports with previously defined settings.
1.6. Initialization File (SERVICELAB.INI)
ServiceLab automatically creates this file in the Windows directory. It contains
the current global settings concerning the main windows and parts of the file info.
Also in these files defined Global Strings or variables are saved. If necessary
ServiceLab can read them while measurement is running.
1.7. Files with Reference Points (.DPF)
These ASCII files contain lists of reference points that are required for Interpolation in the Scaling module. Use an ASCII editor such as Windows Notepad or
any other non-formatting text editor to create such a file.
The file can be created as one channel file or multi channel file and must be
structured as follows:
Line 1: INTERPOLATION
Line 2: identifier (maximum 40 characters)
Line 3: number of columns (minimum 2)
Line 4: number of pairs of data
The lines containing the data pairs follow. Their total number must
correspond exactly to the value specified in line 4.
Last line: EOF
The reference pairs are arranged in one line with the independent value first and
the dependent value second. Blanks or Tabs must separate the two columns. The
lines must be sorted in increasing order.
5-3
Files and File Formats / DDE / Network
ServiceLab
Example of an Interpolation file:
INTERPOLATION
This is an example file.
2
5
-2000
0
-1500
1.5151
-100
3.7456
10
7.78569
400
0.12
EOF
Example of a Multi Channel Interpolation file with 3 channels separated by
blanks:
INTERPOLATION
This is a 3-channel example file.
3
5
-2000
0.00
1.00
-1500
1.5151
2.50
-100
3.7456
3.5678
10
7.87569 2.222
400
12.587
3.334
EOF
1.8. Data Files
ServiceLab can store data in different formats so that data can be used by other
applications. It can read data stored as IEEE-32 or ASCII formats, in addition to
its own format. Use the Read File and Write File modules from the Files module
to read and write files.
ASCII Format (.ASC)
Data is stored as ASCII strings, so that it can be read without an additional converting program.
Only continuous time-dependent data can be stored in the ASCII format.
IEEE Format (.I32)
Data is stored as IEEE 32 bit floating point values in the Intel format.
Only continuous time-dependent data can be stored in this format.
5-4
ServiceLab
Files and File Formats
External Formats
ServiceLab supports saving data in any of the following formats:
Format
Extension
Format
Extension
ASCII
DADiSP
DIA/DAGO
Famos
*.ASC
*.DSP
*.DAT
*.DAT
IEEE-32
Remus
Signalys
*.I32
*.DAT
*.VH, *.K??, *.D??
FFT, Histogram, or Relay data cannot be stored in the DIA/DAGO format.
The same block size and sampling rate must be specified for all the channels
if data is to be stored in this format.
There are no restrictions for the Famos or the Signalys formats.
DASYTEC Data Format (.DDF/.DDB)
This format is the DASYTEC format that exactly fits the requirements of ServiceLab.
Data can be stored and read in this format. All types of data can be saved and the
full information is stored together with the raw data.
Please refer to the section 1.9 for further details.
1.9.
DASYTEC Data Format (.DDF/.DDB)
(Extended Version 1.01 / Oct. 1994)
1.9.1
Basics
The header can either be stored in the same file as the data or in another file with
a different extension.
The extension for the main file is .DDF (“DASYTEC Data Format”). If a separate data file is created, its extension will be .DDB (“DASYTEC Data Block”).
The format itself is not fixed completely, but contains options for future development. Any variants of the format that are not described explicitly here are not
fully developed and should not be used.
1.9.2
Basic File Structure
Each file consists of four sections, of which the one containing the data may be
stored in a separate file:
1. Two global headers,
2. A number of channel headers (one for each channel),
3. One or several series of data blocks,
4. The End of File mark;
Or
1. Two global headers,
5-5
Files and File Formats / DDE / Network
ServiceLab
2. A number of channel headers (one for each channel),
3. The End of File mark,
Plus an additional file containing only the series of blocks of data.
The current version allows only one series of blocks of data.
1.9.3
Storing Different Types of Data
Binary data are stored following the conventions of the Intel Format. This documentation uses the following identifiers for data types:
CHAR
single character
CHAR[n]
an array of exactly n characters
INT
2 Byte signed
LONG
4 Byte signed
WORD
2 Byte unsigned
DWORD
4 Byte unsigned
DATUM
date and time in the current MS-DOS format
FLOAT
4 Byte real
DOUBLE
8 Byte real
STRING
a series of characters with NULL Byte terminator
(variable size)
Strings will be encoded according to Windows 3.1 conventions.
1.9.4
The First Global Header
The first global header has the following structure:
CHAR[4] fixed file identifier: 'D', 'T', 'D', 'F'
CHAR
fixed file identifier: CTRL-M ($0D)
STRING data source, comments, etc. (see below)
CHAR
fixed terminator: CTRL-Z ($1A)
CHAR[2] fixed CPU identifier: 'I', 'N'
WORD
size of this header in Bytes
WORD
file type (see explanation below)
WORD
version number (currently: 1)
WORD
size of the second global header in Bytes [*]
(see explanation below)
WORD
size of a channel header in Bytes [*]
WORD
size of a block header in Bytes
WORD
flag for a separate data file
WORD
number of channels
DOUBLE time delay between two samples
DATUM
start time
The “Data Source” string is structured by ServiceLab as follows:
5-6
ServiceLab
Files and File Formats
SERVICELAB V 3.00 [APRIL 15, 1993] -- Copyright
(c)
1992,93,94,95
by
NATIONAL
INSTRUMENTS
WORKSHEET = WIND.DSB
AUTHOR = W. Inner
COMPANY = Faster Than Light Inc.
DIVISION = Development
TITLE = Wind channel experiment 4711
SAMPLE RATE = 1000.0 Hz
DATA FORMAT = 1
DATA CHANNELS = 5
START TIME = MAY 25, 1995 11:55
If data blocks are stored in a separate file, the following line is added:
DATA FILE = NAME.DDB
You can view this information using the MS-DOS command TYPE.
“File Type” may be one of the following values:
0
streamer format (data are raw data in WORD format,
coming directly from the DAQ)
1
Universal Format 1 (FLOAT)
2
Universal Format 2 (DOUBLE)
3 – 1000
reserved
1001 – 65535 unused
Currently only File Type 1 is supported.
The second global header is dependent on the file type.
For the above sizes marked with an asterisk [*] (and only those), strings are
counted as 1 Byte each. Otherwise the real size will be entered. The data block
headers cannot contain any strings.
The flag for separate data files may have either of these values:
0
1
1.9.5
(FALSE)
(TRUE)
one file only / header and data are in the same file.
separate file for data blocks. Both files must have the same
file names, but the extension of the main file is .DDF
(“DASYTEC Data Format”), and the extension of the separate data file is .DDB (“DASYTEC Data Block”).
End of File Mark
The end of file is marked by:
CHAR[4]
fixed label: 'D', 'T', 'D', 'F'
5-7
Files and File Formats / DDE / Network
1.9.6
ServiceLab
The Universal Format 1
This is the standard format of ServiceLab. All the different types of signals can
be stored in this format.
Global Header for Universal Format 1
This header has the following structure:
WORD
size of this header
WORD
number of channels
(with multiplexed data total amount of channels)
WORD
Flag, whether the data are multiplexed
(0=no; 1 = yes)
WORD[16}
Array of the channels collected on each input channel
Channel Header for Universal Format 1
Each channel has its own header:
WORD
size of this header
WORD
channel number
WORD
maximum size of a block in samples. The maximum value is
8192. The actual sizes of the blocks may be smaller.
DOUBLE
time delay between two samples in this channel
WORD
channel type (see explanation below)
WORD
channel flags (see explanation below)
DOUBLE
unused, must be 0.0 for future extensions
DOUBLE
unused, must be 0.0 for future extensions
STRING
channel unit
STRING
channel name
The following channel types may be used:
Value
for a channel containing data of the following type:
Channel Type = 0
continuous time dependent signals
Channel Type = 10
frequency dependent data (full block size)
Channel Type = 11
frequency dependent data (half block size)
Channel Type = 20
Histogram values
Channel Type = 21
Histogram values with time information
The channel flags may be used for special properties of a signal or block;
currently only one flag is defined:
Channel Flag $0001 data in this channel may have gaps
Channel Flag $0002 this channel may contain shorter blocks
The different channel headers follow one by one without gaps. The first header
corresponds to channel 0, the second to channel 1 and so on.
1.9.7
Data Block Header for Universal Format 1
Each series of data blocks is preceded by a small header structured as follows:
5-8
ServiceLab
Files and File Formats
CHAR[4]
fixed label: 'D', 'A', 'T', 'A'
WORD
overall number of bytes in this channel
DATUM
start time for the following blocks
DWORD
unused, must be 0.0 for future extensions
DWORD
unused, must be 0.0 for future extensions
This header is followed by the corresponding series of data blocks, each of
which is again introduced by its own separate header.
The individual pairs of headers and blocks directly follow each other. The
blocks are not sorted according to channels but according to their start time.
Channels of types 0, 1, 10, 11 or 12 have headers as follows:
WORD
channel number
DOUBLE
start time
DOUBLE
time delay between samples
WORD
block size
This header is immediately followed by the data in 4-byte float format.
Channels of type 20 (Histogram data) have the following header:
WORD
channel number
DOUBLE
position of the first histogram value
DOUBLE
width of the classes
WORD
number of samples
This header is immediately followed by the data in 4-byte float format.
These data are not provided with time information.
1.9.8
The Universal Format 0
Universal Format 0 is used for streaming data. It may contain more than 16 channels and it may contain data in raw integer format.
Global Header for Universal Format 0
This header has the following structure:
WORD
overall number of bytes in this header
WORD
number of analog channels
WORD
number of counter channels
WORD
number of digital ports
WORD
number of bits in each digital port
WORD
original block size when data was stored
DWORD
sample number of the first sample (when cyclic buffer is
not activated, always zero)
DWORD
number of samples per channel
Channel Header for Universal Format 0
WORD
WORD
number of bytes in this header
channel type 0: analog, 1: digital, 2: counter
5-9
Files and File Formats / DDE / Network
CHAR
WORD
DOUBLE
DOUBLE
ServiceLab
array 16 by 24 with channel names (channel names with
24 chars for digital ports)
data format 0 unsigned integer, 1: signed integer
factor for calculation of Volts
offset for calculation of Volts
1.10. Vector File (*.VEC)
The vector file (Extension *.VEC) stores information used in the module Convolution.
You can create this file with an ASCII editor such as Windows Notepad or any
other non-formatting text editor. The file must be structured as follows:
(Quotation marks are inserted for better view. They are not allowed to be used
in original vector file!)
1st line:
“VECTOR“
2nd line:
Name (free text, max 40 characters)
rd
3 line:
Number of columns; only „1“ is allowed
4th line:
Number of data lines
Next lines: Data (number of lines exactly as defined in previous line)
Last line: „EOF“
Example of Vector file
VECTOR
Example of vector file name
1
number of columns „1“
5
number of data lines „5“
121
Data line 1
244
Data line 2
305
Data line 3
476
Data line 4
599
Data line 5
EOF
1.11. FGEN File (*.TXT)
The FGEN file (Extension *.TXT) stores Coefficients of Filter, which are used
in the Convolution module.
It is possible to use the program FGEN for Windows (Version 1.00, 20 October
1995, Microstar Laboratories) to import immediately coefficients of digital filters into the convolution module. Because the FGEN program isn’t able to store
the coefficient matrix you must use the menu item „View...“ to show the coefficient values and copy them into the clipboard.
5-10
ServiceLab
ServiceLab-Network: Communication with other programs
You can import this data into an ASCII editor such as Windows Notepad or any
other non-formatting text editor and store it as a TXT file.
Example FGEN FILE
; vector v: Taps = 95, Type = Lowpass, Window = Blackman
; vector v: Actual Taps = 101 (before zero stripping)
; vector v: Edges = 0,09, 0,14
; vector v: Scale = 8
vector v = (-1, -1, -2, -1, 1, 6, 14, 24,
35, 43, 44, 34, 8, -36, -97, -170,
-243, -300, -321, -284, -173, 20, 288, 608,
937, 1214, 1369, 1332, 1045, 479, -356, -1398,
-2530, -3589, -4372, -4665, -4268, -3023, -848, 2246,
6140, 10610, 15343, 19968, 24091, 27345, 29429, 30147,
29429, 27345, 24091, 19968, 15343, 10610, 6140, 2246,
-848, -3023, -4268, -4665, -4372, -3589, -2530, -1398,
-356, 479, 1045, 1332, 1369, 1214, 937, 608,
288, 20, -173, -284, -321, -300, -243, -170,
-97, -36, 8, 34, 44, 43, 35, 24,
14, 6, 1, -1, -2, -1, -1)
2.
ServiceLab-Network: Communication with other
programs
ServiceLab -Network is able to control other programs (like OPC servers) running on connected machines. A typical configuration is a central computer that
controls all functions (a master) and many measuring points that are controlled
(slaves).
There are always two machines involved in any communications connection.
Usually they are called Client/Server. Also we will use the terms Master/Slave
or Active/Passive Partner.
The computer that actively builds and controls the connection is the Client, Master or Active Partner. It sends commands and performs supervising functions. It
also sends or receives data initiated by itself. The Client or Master computer always has the main control.
The Server, Slave or Passive Partner is the computer that waits for another computer to contact it. It accepts commands, receives data and sends data controlled
by the far side. Server or Slave computers are not able to operate without the
control inputs of the Server. It only executes commands of the Master unit.
5-11
Files and File Formats / DDE / Network
ServiceLab
The Remote Control Dialog Box allows you to define ServiceLab -Network as
Client or Server. With Server mode there are no further settings. With Client
mode you can define a list of Servers that should be controlled. The settings of
each of these Servers can be defined using the Option button or the servers can
be ordered to execute immediate instructions.
The Options Dialog Box defines the settings of the remote control operations.
Start/Stop simultaneously
When this option is active, the Server starts and stops each time the measurement starts and stops. Please note that Clients and Servers never start
at exactly the same time because the transmission of the start command is
dependent on the utilization and capacity of the network. Also network
configuration, speed of network boards, etc., will affect the speed of the
transfer.
The Start, Stop and Load Options are executed immediately. Start measurement, stop measurement or loading a worksheet will be performed on
the remote side “instantly.”
2.1. TCP/IP Network Protocol
The TCP/IP Protocol is the basis of ServiceLab -Network functions. It is not included in the standard Windows or Windows for Workgroups installations. You
will need to install the TCP/IP Stack to use the ServiceLab -Network functions.
Availability
Several manufacturers provide TCP/IP Protocol Stacks as a supplement to Windows 3.1 and/or Windows for Workgroups 3.11. ServiceLab -Network only
works correctly with TCP/IP Stacks that include a WINSOCK DLL file. This file
should meet the Windows Sockets Specification Version 1.1, Jan 20, 1993.
MS TCP/IP-32
The TCP/IP-32 Protocol Stack is provided free of charge by Microsoft. This
stack (in contrast with others) cannot only be used with Windows 3.1 but also
with Windows for Workgroups 3.11. It is very easy to install. New operating
systems such as Windows 95 will contain the TCP/IP Protocol in the standard
distribution.
The following section refers to the MS TCP/IP-32 Protocol stack.
Installation
MS TCP/IP-32 installation is started using the network setup from the Network
Group. You can install it as an additional protocol using the driver options.
Typically you would first install the Microsoft Windows Network with an installed Ethernet board. Then install the TCP/IP-32 as an additional protocol.
Installation of additional Network protocols (such as Novell Net or others) is not
required because each additional protocol running on the network diminishes the
overall performance.
5-12
ServiceLab
DDE: Communication with Other Applications
IP-Address
During the installation of TCP/IP, all mounted computers must have an IP Address (= Internet Address). The string is constructed of 4 numbers divided by
decimal points (for example: 192.153.120.3) and has to agree with established
declarations (for example, the first number defines the Address Type.)
If you want to connect your local network with the worldwide Internet, you must
request the first three numbers from the network provider. The last number will
define the local computer.
Also, while the network will work, local Internet conventions must be obeyed.
For example, usable addresses are 192.153.120.x in which each local computer
gets its station identification defined in the x component (range: 1 up to 255). The
first three numbers of all local computers must be identical. Each local machine
must be named unambiguously. This name is also used by ServiceLab.
2.2. Bibliography
Reviewing the literature, there are many books, articles, etc., which discuss
TCP/IP, Internet and Windows Sockets.
References with subjects of Ethernet, FDDI, Using IP-Addresses, etc., are interesting if you want to install a TCP/IP Network.
Subjects of FTP, TELNET, NFS, EMAIL, WWW (Worldwide Web), GOPHER,
and so on are descriptions of public domain services that are not necessary to run
ServiceLab.
You won’t need descriptions of Windows Sockets. You only need to know that
ServiceLab needs Windows Sockets. The software manufacturer has to deliver
them with the TCP/IP Stacks.
3.
DDE: Communication with Other Applications
DDE (Dynamic Data Exchange) is defined as a dynamic data exchange between
Windows applications using a defined protocol. Although this conversation is
two-way, the role of each program is determined by the protocol. The program
asking for data is called the Client. The called program is defined as the Server.
The Client always initiates a DDE conversation. It sends an initialization message (WM_DDE_INITIATE) to all running tasks. The parameters describe the
general type of the required data. A program with that data type responds with an
acknowledgment and declares itself to be the Server. A DDE conversation is restricted to two partners.
3.1. ServiceLab as DDE Input
Using the Windows DDE Interface, external programs are able to initiate ServiceLab functions (load file, start measurement…) in a running ServiceLab pro-
5-13
Files and File Formats / DDE / Network
ServiceLab
gram. Other Windows applications can control ServiceLab. In this case ServiceLab is the Server, a Visual Basic application, for example, is the Client.
The format of the DDE instructions has to conform to the following rules:
Service:
ServiceLab
Topic:
Menu
Item:
Command e.g. Load
The name of the application (service) ServiceLab and the topic Menu starts the
DDE conversation. Available items are Command (standard menu command)
with start measurement, stop measurement, pause measurement and continue
measurement functions and the item Load to load file.
There are 6 additional DDE items to manipulate Global Strings or Variables using DDE:
SetString
GetString
SetVar
GetVar
GetData
SetData
In both GET functions the number is chosen as item and the function as topic
(ServiceLab is the DDE server. Connection is a Cold Link). ServiceLab will
send back the result as an ASCII value. If there is no result (wrong number, etc.),
ServiceLab will send back the string ‘Parameter Error’. To set strings or variables (ServiceLab is DDE server, connection is defined as DDE Poke) the number and the defined alphanumeric string or numerical value separated by a semicolon will be sent. ServiceLab gives no feedback.
Protocol
Application:
ServiceLab
Start measurement,
measurement:
Topic:
Item:
String:
Communication:
Load file:
Topic:
Item:
String:
Communication:
5-14
stop measurement, pause measurement, continue
Menu
Command
START, PAUSE, CONT, STOP
Poke
Menu
Load
FILEname
Poke
ServiceLab
DDE: Communication with Other Applications
Set Global String:
Topic:
Menu
Item:
SetString
String:
Number;String
Example:
3;test.ddf
Communication:
Poke
Get Global String:
Topic:
Menu
Item:
GetString
String:
Number
Communication:
Cold link
Set Global Variable:
Topic:
Menu
Item:
SetVar
String:
Number;(ASCII)Value
Example:
2;5.923
Communication:
Poke
Get Global Variable:
Topic:
Menu
Item:
getVAR
String:
Number
Communication:
Cold link
Get DDE data
Topic:
GetData
Item:
MODULEname
String:
Line with x channels, (ASCII)
Communication:
ColdLink or HotLink
Set DDE data
Topic:
SetData
Item:
MODULEname
Communication:
Poke
Visual Basic - example
Private Sub cmdPoke_Click()
txtData.LinkMode = vbLinkNone
txtData.LinkTopic = "ServiceLab" & "|" & "Menu"
txtData.LinkItem = "Load"
txtData.LinkMode = vbLinkManual
txtData.Text = "c:\ServiceLab\last.dsb"
txtData.LinkPoke
End Sub
5-15
Files and File Formats / DDE / Network
ServiceLab
Private Sub cmdRequest_Click()
txtData.LinkMode = vbLinkNone
txtData.LinkTopic = "ServiceLab" & "|" & "GetVariable"
txtData.LinkItem = "1"
txtData.LinkMode = vbLinkManual
txtData.Text = ""
txtData.LinkRequest
End Sub
In VisualBasic 5.0 the type of communication is declared as follows:
Poke:
Linkmode: txtdata.LinkMode = vbLinkManual
Initialization:
txtdata.Poke
ColdLink: LinkMode: txtdata.Linkmode = vbLinkManual
Initialisation:
txtdata.Request
HotLink: LinkMode: txtdata.LinkMode = vbAutomatic
When the connection is successful, an acknowledgment signal (“CONNECT”)
will be sent.
Net DDE
It is also possible to exchange data between programs running on different machines using an available network.
You need to ensure the following:
On the server side there must be one or more DDE shares entries. This
authorizes other applications (in the following example Excel) to connect via Net DDE. Shares are inserted in the SYSTEM.INI file section
[DDEShares].
Example:
[DDEShares]
CHAT$=winchat,chat,,31,,0,,0,0,0
SCHAT$=winchat,chat,,31,,0,,0,0,0
CLPBK$=clipsrv,system,,31,,0,,0,0,0
DL_MENU$=ServiceLab,Menu,,15,,0,,0,0,0
DL_DATA$=ServiceLab,DdeData,,15,,0,0,0
XL_TAB1$=Excel,Tab1,,15,,0,0,0
ServiceLab requires the last three lines.
You need to restart Windows to initiate the connection.
On the client side the following entries are necessary:
When ServiceLab and the other application are installed on the same machine:
Application: Excel
Topic:
Tab1
5-16
ServiceLab
DDE: Communication with Other Applications
Item:
R1C2
When ServiceLab and the other application are connected via Net DDE:
Application: \\ComputerName\NDDE$
Topic:
XL_1TAB1
Item:
R1C2
Adjustments of the client must match the enabled DDE shares settings.
5-17
ServiceLab
Demo Worksheets
Chapter 6: Tips & Tricks
1.
Demo Worksheets
When you set up ServiceLab on your hard disk, several Sample Worksheets are
copied to the ServiceLab directory.
You can open these files onto the working area by choosing Open
from the File menu or by clicking this Function Bar icon.
These worksheet examples can give you some idea of the wide range of measuring tasks that can be solved by ServiceLab.
If you choose the File Info command from the File menu, or click the
corresponding icon on the Function Bar, you will find information
on that worksheet in the Worksheet Information box.
2.
ServiceLab by Keyboard
Most Windows applications are designed with mouse operation in mind, but the
keyboard may also be used. The following keyboard operations can be used in
ServiceLab:
Menu Commands
Menu commands can be chosen by pressing ALT to move to the Menu Bar, then
typing the underlined letter in the menu name to open the menu, and then typing
the underlined letter in the menu command.
Experiment Control
Keyboard shortcuts are provided for commonly used Experiment menu commands. Instead of opening the menu and choosing the command, press the key
combination.
These keys are listed to the right of the menu entry. The online help pages also
list them.
A list of the commands and their shortcut-key combinations is provided on page
6-2.
Module Manipulation and Configuration
The module symbols in the worksheet can be dragged, connected by data channels, configured, or deleted. The latter two manipulations can also be done with
the keyboard.
Only one module in the worksheet can be selected and manipulated. It is identified among the module symbols in the work area by the inverse coloring of its
Title Bar, where the module name is displayed.
6-1
ServiceLab
Tips & Tricks
To select a module, click it once with the left mouse button or press the
TAB key on your keyboard until that module is selected.
When you press the ALT+ENTER keys, the module configuration dialog
box appears. Press the TAB or the SHIFT+TAB keys to move from one
field or button to another; select items by pressing the arrow keys, the
SPACE and the ENTER key.
Channel Selection can only be done using the mouse.
To copy settings entered for the selected channel to the other activated
channels, use the F7/F8 Function Keys. This procedure can only be performed using keyboard operation.
To delete the selected module from the worksheet, or to delete all the input and/or output channels of that module, press the DEL key. In the dialog
box, select the desired option, or choose Cancel, and press ENTER.
3.
ServiceLab Hotkeys
F1
F2
F3
F4
F5
CTRL+F5
CTRL+F6
CTRL+F6
F7
F8
ESC or CTRL+F
CTRL+F
ALT+SHIFT+Number
Alt+Number
ALT+CTRL+Number
6-2
Online Help
Show Display Window
Show Worksheet Window
Show Layout Window
Start Measurement
Stop Measurement
Pause Measurement
Resume Measurement
Copy selected channel properties
Copy all channel properties
Switch Layout into window
mode
Switch Layout into full screen
mode
Save window arrangement
Choose window arrangement
Delete window arrangement
ServiceLab
4.
How to Start and Stop an Experiment
How to Start and Stop an Experiment
This section contains
Some basic information on the options provided by ServiceLab to control
an experiment or data acquisition process;
An overview of the manual control options;
And a review of the methods for automatically controlling an experiment.
4.1. Start/Stop/Pause/Resume an Experiment
ServiceLab allows you to control your data acquisition procedures in various
ways. Besides starting and completely stopping an experiment you can also interrupt it and later resume it at that point.
When you pause an experiment, the acquisition of new data is stopped
(for example, Generator, A/D or Digital Input, PID or Manual Control
modules) but data already acquired will be processed completely.
The acquisition of new data is resumed when the experiment is continued.
4.2. Controlling an Experiment Manually
There are three methods for controlling an experiment manually:
Choose the commands from the Experiment menu: click the menu item, or
press the ALT, X keys, then type the letter that is underlined in the item
name.
Click the icons on the Function Bar. Each icon symbolizes a menu commands.
Use keyboard shortcuts. When available, shortcut-key combinations are
listed to the right of the menu item; to use, press the key combination.
Icon
Experiment
Menu Command
Hotkey
Function
Start
F5
Start experiment
Stop
CTRL+F5
Stop experiment
√ Pause
CTRL+F6
Pause experiment /
resume experiment
6-3
Tips & Tricks
ServiceLab
4.3. Automatic Program/Experiment Start
The experiment setup (the worksheet) and/or the computer can be configured so
that the experiment will start and stop automatically.
The following describes the menu commands needed and the details on how to
automatically set up experiments using batch files and Windows resources.
The concept of Event Driven Actions enlarges the capabilities of ServiceLab
in the field of automatic measurement control. An Action module can react to
detected events with certain activities, such as opening and starting a new
worksheet, printing displays, resetting values, etc. See the Module Reference
Guide for more information.
4.3.1
Start/Stop via DDE
Other Windows applications with DDE capabilities can be used to start and stop
the ServiceLab experiment. Refer to the DDE section in Chapter 6 for details on
the DDE protocol.
4.3.2
Start/Stop at Time
Choose the Start/Stop at Time option from the Experiment menu to start, stop,
and repeat an experiment at specified times. You can specify the time at which an
experiment is to start, the duration of that experiment, and the interval after which
the experiment is to be repeated. Refer to Chapter 6 for details.
4.3.3
Using the Auto Start Function
Use the Auto Start option from the Experiment menu to set an experiment to start
automatically.
Activate the Auto Start option from the Experiment menu (indicated by a
check mark √).
Choose Save or Save as… from the File menu, or click the Function Bar
icon, to save your worksheet. When you exit ServiceLab, the setting of the
Auto Start option is saved with other window settings.
To use Auto Start, append the file name of the worksheet to the program
file name at the command line. ServiceLab opens the worksheet and starts
the experiment immediately.
4.3.4
Starting a Worksheet from the Windows Desktop
Drag and drop your worksheet files onto the Windows desktop. To automatically
start ServiceLab by double clicking on the worksheet, you first have to manually
create a link from ServiceLab to the file type. First, use the Drag & Drop method
to place a worksheet file icon on the desktop. Because there is no defined link to
any program, double clicking on this icon will open a dialog box. Windows will
ask you what program should be used to open that file. Select the: File always
6-4
ServiceLab
How to Start and Stop an Experiment
with
...
radio button and select the Others... button.
Windows will open an Explorer Window that allows you to select a program.
Choose the ServiceLab installation path and select the SERVICELAB.EXE program. Use the Open button to confirm. Leave the dialog box using the OK button.
In the future, ServiceLab will automatically start when a worksheet icon is double clicked.
If you have installed several copies of ServiceLab on your system, the created
link connects only to one version of ServiceLab from the Windows Program
Manager or File Manager.
open
4.3.5
Starting Control Sequence Files from the Windows desktop
Using Windows 95/98 or 2000/NT you can place your Control Sequence files
with Drag&Drop onto the Windows desktop. To automatically start ServiceLab
by double clicking on the Control Sequence file, you first have to manually create
a link from ServiceLab to the file type. First, use the Drag & Drop method to
place a Control Sequence file icon on the desktop. Because there is no defined
link to any program, double clicking on this icon will open a dialog box. Windows will ask you what program should be used to open that file. Select the: File
always open with... radio button and select the Others... button.
Windows will open an Explorer Window, which allows you to select a program.
Choose the ServiceLab installation path and select the SERVICELAB.EXE program. Use the Open button to confirm. Leave the dialog box using the OK button.
In the future, ServiceLab will automatically start when a worksheet icon is double clicked.
If you have installed several copies of ServiceLab on your system, the created
link connects only to one version of ServiceLab.
4.3.6
Tips for starting worksheetscontrol sequences if you have more
than one ServiceLab versions on the same computer
If there are several ServiceLab versions (e.g. German and English versions) installed on your system, you can create links to worksheets for each version. Because ServiceLab doesn’t use the extension to identify the worksheet file, you
can rename the worksheets of each version to a special extension (e.g. German
worksheets with *.dws). Now you can create a new link in Windows as described before and each worksheet will start with the corresponding ServiceLab
version by a double click. You have to pay attention to previously defined extensions, so that you don‘t affect other installed software.
6-5
Tips & Tricks
4.3.7
ServiceLab
Various Application Icons or Batch Files
You can customize the start-up modes described above.
Batch Files
Create a batch file containing the command line described above, including the
worksheet file name and save it with a descriptive file name. Set up several
batch files, each with an experiment setup.
Any experiment can be then started by typing the corresponding batch file name.
Application Icons in Windows Program Manager
Add a new option to the ServiceLab application icon displayed in the Windows
Program Manager, or create a special icon for an experiment in your ServiceLab
program group in the Windows Program Manager.
To keep the current program startup option without a worksheet, copy the
ServiceLab icon first. Select it, press the F8 function key, or choose
Copy from the Program Manager File menu.
Select the copied ServiceLab icon with one mouse click, and press the
ALT+ENTER keys, or, choose Properties from the File menu.
Type the complete worksheet file name including its drive, directory, and
extension after the ServiceLab command in the Command Line box.
For example:
C:\SERVICELAB\SERVICELAB.EXE D:\FLCS\FLC1.DSB
where FLCS is the directory on drive D: where your worksheet files are
saved, and FLC1.DSB is the experiment setup file which is to be automatically started.
In the Description box, type a description that identifies the worksheet.
Press ENTER.
Any experiment can be started directly by clicking on the corresponding Program
Manager icon.
4.3.8
Starting an Experiment at the same time as Windows
Copy one of the experiment icons to the Windows Program Manager
AUTOSTART group to start the experiment when Windows is started.
4.3.9
Starting an Experiment when your Computer System Restarts
Add the Windows command to the AUTOEXEC.BAT file and the experiment
will start when you start your computer system.
6-6
ServiceLab
5.
Exchanging Worksheets
Exchanging Worksheets
Between Computers
If you have to exchange worksheets between several PCs (for example, when setting up runtime applications), you must guarantee that the selection and sequence
of measurement hardware (Experiment: Hardware Setup) in the source ServiceLab are exactly the same as in your target PC. If not, there may be problems
with hardware specific modules. This is usually only a problem when using
more than one DAQ board (multifunctional drivers) or boards with extension
boards. The hardware configuration specified in the hardware setup is stored as
a list of indices in the worksheet without a board-specific indication. The result
of a different sequence is an incorrect setup of hardware modules.
Similarly, the hardware settings, including the base address and/or channel of the
single components have to be identical.
The following picture shows parts of the hardware setup of different PCs with
the same set of measurement hardware but with a different setup sequence, which
causes incorrect hardware assignment.
Between Versions Of The Software
ServiceLab worksheet files, *.DSB, are forward compatible with newer versions of the software. Generally, however, a worksheet created with a newer
version, such as V7.0, cannot be read by an earlier version, V4.0.
To read a worksheet file with an earlier version, save the file as the worksheet
ASCII format (.DSA). You may have to reconfigure some modules, but the older
ServiceLab is more likely to be able to read the ASCII format worksheet.
6-7
Tips & Tricks
6.
ServiceLab
Display Company Logo
The ServiceLab logo appears in the Copyright Information dialog box (About
ServiceLab from the Help menu). You can display your company logo by creating
the logo as a Windows Metafile (∗.WMF). Copy that file to the ServiceLab directory as LOGO.WMF. The next time you start ServiceLab, your logo will be
displayed in the Copyright Information window. It may be necessary to fine-tune
the size and proportions of the picture.
6-8
ServiceLab
Appendices
Appendices
A: What’s Included in Your ServiceLab Package
The ServiceLab package consists of the following parts:
CD-ROM with the installation files for the ServiceLab program files, the
setup program files
Registration card and license.
ServiceLab user-manual
A-1
A-2
ServiceLab
Appendices
B: Internal Data Flow and Precision Information
Data values are represented in ServiceLab as single precision floating point values. All calculations except the FFT are carried out in double precision (8 Byte
floating point).
Single Precision Format
Data Format:
Range:
Accuracy:
Double Precision Format
Data Format:
Range:
Accuracy:
32 Bit
1 Bit sign
8 Bit exponent
23 Bit mantissa
3.4E-38 to 3.4E+38
at least 7 decimals
64 Bit
1 Bit sign
11 Bit exponent
52 Bit mantissa
1.7E-308 to 1.7E+308
at least 15 decimals
B-1
Appendices
B-2
ServiceLab
ServiceLab
Appendices
C: ASCII Table
Control Characters (not printable)
Decimal
0
1
2
3
4
5
6
7
8
9
10
11
12
Octal
000
001
002
003
004
005
006
007
010
011
012
013
014
Hex
0x00
0x01
0x02
0x03
0x04
0x05
0x06
0x07
0x08
0x09
0x0A
0x0B
0x0C
Characters
Ctrl-@
Ctrl-A
Ctrl-B
Ctrl-C
Ctrl-D
Ctrl-E
Ctrl-F
Ctrl-G
Ctrl-H
Ctrl-I
Ctrl-J
Ctrl-K
Ctrl-L
13
14
15
16
17
18
19
20
21
22
23
24
25
26
27
28
29
30
31
127
015
016
017
020
021
022
023
024
025
026
027
030
031
032
033
034
035
036
027
0177
0x0D
0x0E
0x0F
0x10
0x11
0x12
0x13
0x14
0x15
0x16
0x17
0x18
0x19
0x1A
0x1B
0x1C
0x1D
0x1E
0x1F
0x7F
Ctrl-M
Ctrl-N
Ctrl-O
Ctrl-P
Ctrl-Q
Ctrl-R
Ctrl-S
Ctrl-T
Ctrl-U
Ctrl-V
Ctrl-W
Ctrl-X
Ctrl-Y
Ctrl-Z
Ctrl-[
Ctrl-\
Ctrl-]
Ctrl-^
Ctrl-_
Code
NUL
SOH
STX
ETX
EOT
ENQ
ACK
BEL
BS
HT
LF
VT
FF
NP
CR
SO
SI
DLE
DC1
DC2
DC3
DC4
NAK
SYN
ETB
CAN
EM
SUB
ESC
FS
GS
RS
US
DEL
Notes
Null prompt
Start of heading
Start of text
End of Text
End of transmission
Enquiry
Acknowledge
Bell
Backspace
Horizontal tab
Line feed
Vertical tab
Form feed
New page
Carriage return
Shift out
Shift in
Data link escape
X-ON
X-Off
Not acknowledged
Synchronous idle
End transmission blocks
Cancel
End of medium
Substitute
Escape
File separator
Group separator
Record separator
Unit separator
Delete or rubout
C-1
ServiceLab
Appendices
Printable Characters:
Decimal
32:
36:
40:
44:
48:
52:
56:
60:
64:
68:
72:
76:
80:
84:
88:
92:
96:
100:
104:
108:
112:
116:
120:
124:
128:
132:
136:
140:
144:
148:
152:
156:
160:
164:
168:
172:
176:
180:
184:
188:
192:
196:
200:
204:
C-2
Character
$
(
,
0
4
8
<
@
D
H
L
P
T
X
\
`
d
h
l
p
t
x
|
€
„
ˆ
Œ
”
˜
œ
¤
¨
°
´
¸
¼
À
Ä
È
Ì
Decimal
33:
37:
41:
45:
49:
53:
57:
61:
65:
69:
73:
77:
81:
85:
89:
93:
97:
101:
105:
109:
113:
117:
121:
125:
129:
133:
137:
141:
145:
149:
153:
157:
161:
165:
169:
173:
177:
181:
185:
189:
193:
197:
201:
205:
Character
!
%
)
1
5
9
=
A
E
I
M
Q
U
Y
]
a
e
i
m
q
u
y
}
…
‰
‘
•
™
¡
¥
©
±
µ
¹
½
Á
Å
É
Í
Decimal
34:
38:
42:
46:
50:
54:
58:
62:
66:
70:
74:
78:
82:
86:
90:
94:
98:
102:
106:
110:
114:
118:
122:
126:
130:
134:
138:
142:
146:
150:
154:
158:
162:
166:
170:
174:
178:
182:
186:
190:
194:
198:
202:
206:
Character
"
&
*
.
2
6
:
>
B
F
J
N
R
V
Z
^
b
f
j
n
r
v
z
~
‚
†
Š
Ž
’
–
š
ž
¢
¦
ª
®
²
º
¾
Â
Æ
Ê
Î
Decimal
35:
39:
43:
47:
51:
55:
59:
63:
67:
71:
75:
79:
83:
87:
91:
95:
99:
103:
107:
111:
115:
119:
123:
127:
131:
135:
139:
143:
147:
151:
155:
159:
163:
167:
171:
175:
179:
183:
187:
191:
195:
199:
203:
207:
Character
#
'
+
/
3
7
;
?
C
G
K
O
S
W
[
_
c
g
k
o
s
w
{
ƒ
‡
‹
“
—
›
Ÿ
£
§
«
¯
³
·
»
¿
Ã
Ç
Ë
Ï
ServiceLab
Decimal
208:
212:
216:
220:
224:
228:
232:
236:
240:
244:
248:
252:
Appendices
Character
Ð
Ô
Ø
Ü
à
ä
è
ì
ð
ô
ø
ü
Decimal
209:
213:
217:
221:
225:
229:
233:
237:
241:
245:
249:
253:
Character
Ñ
Õ
Ù
Ý
á
å
é
í
ñ
õ
ù
ý
Decimal
210:
214:
218:
222:
226:
230:
234:
238:
242:
246:
250:
254:
Character
Ò
Ö
Ú
Þ
â
æ
ê
î
ò
ö
ú
þ
Decimal
211:
215:
219:
223:
227:
231:
235:
239:
243:
247:
251:
255:
Character
Ó
×
Û
ß
ã
ç
ë
ï
ó
÷
û
ÿ
C-3
ServiceLab
Appendices
D: Error Messages and Troubleshooting
The following error messages may be encountered while using ServiceLab.
Analog output had to be interrupted
Cause
the D/A buffer is empty, ServiceLab could not generate data to
be sent by the D/A module fast enough
Correction
reduce the output rate, or increase the output buffer size
Cannot create DDE Link
Cause
the specified server application is not active or the specified
Topic or Theme is not available
Correction
start application and make sure that Topic and Theme are defined
Cannot execute the worksheet at this module - aborted
Cause
the worksheet contains a loop that means the output of a module is (indirectly) needed for its input
Correction
insert a time delay module or remove the loop completely
Cannot open COMx
Cause
the serial port is used by another application under Windows
and is not available for ServiceLab
Correction
make sure that the specified COM-port is not used by the
mouse or by any other Windows application
DDE Link was interrupted
Cause
the DDE Link was interrupted by the Server program
Correction
make sure that the Server program is still running
Digital output had to be interrupted
Cause
the digital output buffer is empty, ServiceLab could not generate data to be sent by the Digital Out module fast enough
Correction
reduce the output rate, or increase the output buffer size
Error No 15
This message may occur with some drivers that have not replaced the default
message text.
Cause
(and meaning) data acquisition could not be started because a
hardware conflict (like interrupts) has been detected. This is a
driver error code and you should report this message to technical support for more information. Please be prepared to describe the exact situation in which it occurs.
D-1
ServiceLab
Index
File read error
Cause
Correction
the data file you want to read is corrupt or has the wrong file
format
check for the correct settings in the dialog box and make sure
that the file format is correct
Illegal block size STOP
Cause
the FFT related module can only handle block sizes that are a
power of 2
Correction
use the Data Windows module to change the block size at the
FFT input to a power of 2
Output rate does not match the channel rate for one channel.
STOP
Output rate does not match the input rate at an input. STOP
Cause
these messages indicate that the global acquisition rate is not
an integer multiple of the defined output rate. Synchronized
output can only be realized in a way that one sample is sent to
the D/A Card after a certain number of input samples has been
acquired. Therefore the input rate divided by the output rate
has to be an integer value. In both cases ServiceLab does not
use the channel rates, but the summed rates.
Correction
adjust the analog or digital output rate
The sample frequency is too high for this module
Cause
The Chart Recorder does not check the rate of input signals.
Correction
slow down the input rate by separate or average modules
The sampling rate is too fast. The measurement has been stopped
Cause
the speed ServiceLab can acquire data from an analog input
card is limited. The limits depend on the hardware structure
and the computer you use as well as on the worksheet you run.
There may be different circumstances causing this message.
The most common reason is that the driver buffer in ServiceLab had an overrun and that the driver did not know where
to store the next samples. In this case the measurement is
stopped. Usually the bar in the status line indicates how much
of the driver buffer is used, there are some situations where
there may be no time to update the indicator. Another possible
reason is that the interrupt frequency that is needed to acquire
data at the desired rate was too high and that ServiceLab noticed that interrupts have been lost. This may be caused by extreme bus activities of the graphics or hard disk controllers.
Index-2
ServiceLab
Appendices
Correction
When this happens, the message also appears without having
the buffer status indicator filled.
slow down the sampling rate or increase the driver buffer
You cannot display signals from these input channels together in
one scope
Cause
the Y/t Chart module can only display signals of the same type
in one display. The same type means that they are all time dependent, all frequency dependent or all histograms. When the
signals are time dependent they have to have the same gap
structure, that means that they may have gaps, but all at the
same time and of the same length.
Correction
use the Signal Adaptation module before the Y/t Chart or use
different Y/t Charts for the different types
You cannot display signals from these input channels together in
one X/Y chart
Cause
the X/Y Chart module can only display signals of the same type
in one display. The same type means that they are all time dependent, all frequency dependent or all histograms. When the
signals are time dependent they have to have the same gap
structure, that means that they may have gaps, but all at the
same time and of the same length
Correction
use the Signal Adaptation module before the X/Y Chart or use
different X/Y Charts for the different types
D-3
ServiceLab
Appendices
E: Product Support
ServiceLab is an innovative Windows application that has been developed over
a period of several years by a team of committed engineers. To ensure that our
software product will meet the changing needs of its users, we will continue to
develop ServiceLab. If you fill in the registration form included in this package
and send it back to us, you will automatically receive the latest information on
any updates of the software.
Information about changes or features that were included after this user guide
was printed is covered in the README.WRI file on your setup disk. Use Windows “ Write” (or a similar word processor) to read this file. Read this file to
find out about improvements and about conversions that may be necessary before
you can use the latest ServiceLab version.
If you have any questions, suggestions, or requests regarding the ServiceLab
software and documentation, please contact us – we will be glad to help.
ServiceLab support
Tel. +49-731-98588-792 FAX +49-731-98588-794
email: [email protected]
www.servicelab.info
ServiceLab Ltd.
Marlene-Dietrich-Str. 5
D – 89231 Neu-Ulm, Germany
E-1
Index
*.ASC
5-4
*.DDB
5-5
*.DDF
5-5
*.DPF
5-3
*.DSQ
3-12, 3-13
*.I32
5-4
*.IIS
4-35
*.INI
5-3
*.IOU
4-35
*.SIM
4-35
*.SIS
4-35
*.SOU
4-35
Acquisition
Mode
4-28
Rate
4-25
Action Junction
3-13
Actions
Key Events
4-50
List
4-51
Screen Locking
4-50
Active/Passive Partner
5-11
Alphabetic Index (Help Index)
4-83
Analog Output Setup
4-28
Animation
4-38
ASC
5-4
ASCII Data Format
5-4
Auto Start
Experiment Menu
4-24
Automatic Experiment/Program Start 6-4
Automation
Key Events
4-50
Autorouter
3-5
Options Menu
4-48
Back to Main Chart (Black Box) 4-11
Background Color
4-48
Black Box
Colors
4-12
Edit Menu
4-10
Info
4-11
Leave ~
4-11
Save
4-10
Black Box Levels
4-11
Block Size
2-5
Maximum
4-27
New Feature
4-27
Block Size
4-27
Branches
3-3
Create
3-5
Delete
3-7
Rearrange
3-6
Buffer
Driver
4-26
Calculate Expression
4-54
Channel Status
3-4
Channels
differing sampling rates
4-25
Channels Names
Copy
4-65
Client
5-11
Clipboard, Copy to ~
File Info
4-5
Layout
4-12
Worksheet
4-10
Clocking
2-5
CLP
4-10
Colors
Background
4-47
Black Box
4-12
Data Channels
4-47
Edit Custom ~
4-48
Grid
4-47
Options Menu
4-47
Screen Customization
3-9
Worksheet
2-2
Command Line
4-24
Comment Flowchart
2-2, 3-13
Company Logo
6-8
Configuration
Function Bar
3-22
Module Bar
3-21
Module Bar Menu
4-14
Configure
Module
4-19
Continuous
Acquisition Mode
4-28
Control Sequencer
3-12
Control Sequencer View
3-13
Control Sequencer Window
3-12
Conventions
2-3
Copy
Channel Names
4-65
File Info to Clipboard
4-5
Layout to Clipboard
4-72
Layout Window
2-3
Module
2-2
VITool
2-3
Worksheet to Clipboard
4-10
Copy/Paste
Layout Window
4-73
List Actions
4-51
VITool
4-73
Copyright Information
4-44
Create
Data Channels/Branches
3-5
Create Directory
4-45
Cut
Layout Window
2-3
Module
2-2
VITool
2-3
Cut/Paste
Copy Layout
4-12
Modules
4-16
Worksheet parts
4-16
DASYTEC
Data Format
5-5
Data Channels
Autorouter
4-48
Colors
4-48
Create
3-5
Delete
3-7
Rearrange
3-6
Data format
Disk Streaming
4-30
Data Format
ASCII
5-4
DASYTEC
5-5
I32
5-4
Universal 0
4-30
DBB
4-11
DDB
5-5
DDE
5-13
DDF
5-5
Debugging Aids
3-4
Default
Module Bar
4-16
Default Directories
4-46
Data
4-46
Devices
4-46
Other files
4-46
Streaming
4-46
Worksheet
4-46
Define
Global Strings
4-53
Global Variables
4-58
Delete
Data Channels/Branches
3-7
Layout Window
2-3
Module
2-1, 4-19, 4-20
Modules
4-17
Output Channels
2-2
VITool
2-3
Window Arrangement
4-43
Delete Input Channels
2-1
Digital Output Setup
4-28
Directories
Default
4-46
Data
4-46
Devices
4-46
Other files
4-46
Streaming
4-46
Worksheet
4-46
Global Strings/Variables
4-64
Disk Streaming
2-5, 4-29
Data Format
4-30
Read Data
4-30
Display
Function Bar
4-38
Module Bar
4-39
Display Window
Dialog Box
3-11
Display Tree
3-11
Display Window
3-11
Display Window Icon
3-11
Fixed Arrangements
3-26
Function Bar
3-11
Hide ~
4-40
Make Visible ~
4-39
Menu Bar
3-11
Restore ~
4-39
Scroll Bar
3-11
Status Bar
3-11
Title Bar
3-11
Display Windows
Saved Arrangements
3-26
DLL drivers
4-34
DML
4-15, 5-2, 5-3
DMX (File Extension)
5-2
Documentation
3-10
List Actions
4-51
DOS Prompt
4-24
Dots (Grid)
4-44
DPF
5-3
Drawing Elements
4-74
Layout Windows
3-17
VITool
3-17
driver
1-9
Driver
4-34
Driver Buffer
4-26
Driver Selection
4-24
DSA (File Extension)
5-1
DSB
4-2, 5-1
Dynamic Data Exchange
see DDE
Edit
~ Menu Commands
4-9
Custom Colors
4-48
Edit Action
3-13
Embedding (Black Boxes)
4-11
Ethernet
5-12
Event-Driven Action
Screen Locking
4-50
Events
Key
4-50
Examples
Global Strings
4-63
Global Variables
4-63
Exit
Black Box
4-11
Program
4-8
Experiment
~ Menu Commands
4-22
Auto Start
4-24
Automatic ~ Start
6-4
Pause
4-23
Setup
4-25
Acquisition Mode
4-28
Block Size
4-27
Driver Buffer
4-26
Sampling Rate
4-25
Start
4-22
Start/Stop
6-3
Stop
4-22
Expressions
4-54
Extended
4-54
Extension (File-)
VEC
5-10
Extensions
ASC
5-4
Black Boxes
4-11
DBB
4-11
DDB
5-5
DDF
5-5
DML
4-15, 5-2, 5-3
DPF
5-3
DSB
4-2, 5-1
I32
5-4
IIS
4-35
INI
5-3
IOU
4-35
List Module Bar Files
4-15
Save Module Bar
4-16
SIM
4-35
SIS
4-35
SOU
4-35
Extensions (File-)
DSA
5-1
TXT
5-2
Extensions (File~)
DMX
5-2
External Programs
4-86
Fast Fourier Transform
see FFT
FIFO Status
3-4
File
~ Menu Commands
4-1
Default Directories
4-46
Formats
Initialization
5-3
Interpolation
5-3
Module Bar
5-2, 5-3
Open Module Bars
4-15
Open Worksheets
4-2
Reference Points
5-3
Worksheets
5-1
Info
4-5
Open
Module Bar
4-15
Worksheet
4-2
Files
Default Directories
4-46
Find Modules
4-17
Flow Chart
see Worksheet
Flowchart Junction
3-13
Font Sizes
Global Setting
4-46
Format
see File ~s
Page ~
4-6
Worksheet
5-2
Worksheet Files
5-1, 5-2
Function Bar
Configuration
3-22
Display/Remove
4-38
Screen Element
3-22
Window Arrangements
3-26
Global Block Size
2-5
Global Clocking
2-5
Global Sampling Rate
2-5, 4-25
Global Setting
Font Sizes
4-46
Global Strings
4-53
Directory Example
4-64
Examples
4-63
Module Use
4-56
Start-Up Dialog
1-13
System
4-57
Global Variables
4-58
Directory Example
4-64
Examples
4-63
Start-Up Dialog
1-13
System Information
4-59
Use in Modules
4-59
Graph Object
Properties
4-76
Grid
~ Type
4-44
Color
4-48
Hardware
Requirements
1-8
Hardware Setup
4-24
Hide
~ Display Window
4-40
~ Display Windows
4-40
I32
5-4
IIS
4-35
Index
Help Menu
4-83
Information
Black Box
4-11
File ~
4-5
INI
5-3
Input Channels
Delete
2-1
Install
Module
4-19
Installation
Setup
1-9
System Requirements
1-8
Instruction
First Worksheet
2-7
Help Index Option
4-83
Interpolation
File Format
5-3
IOU
4-35
Isolated Series
Acquisition Mode
4-28
Junction Points
3-3
Pop Up Menu
3-12
Rearrange
3-6
Key Events
4-50
Keyboard
3-2
Screen Locking
4-50
Keyboard Operations
6-1
Lamp
see Status Display Module
Layout Object
Properties
2-3
Layout page
4-81
Layout Window
3-16
Bitmap Objects
3-15
Copy
2-3
Cut
2-3
Delete
2-3
Display Objects
3-15
Drawing Object
3-15
Function Bar
3-15
Menu Bar
3-15
Text Objects
3-15
Title Bar
3-15
ToolBox
3-15
View
4-80
Visualization Objects
3-15
Zoom
4-80
Layout Windows
Active Elements
3-18
Bitmapped Graphics properties4-75
Copy
4-72
Copy Layout to Clipboard 4-12
Copy/Paste
4-73
Delete
4-73
Drawing Elements
3-17, 4-74
Linked Graph Properties
4-76
Linked Text Properties
4-76
Load
4-72
Load from file
4-13
New Layout
3-16
Page Properties
4-81
Passive Elements
3-18
Properties
3-16
Save
4-72
Save to file
4-12
Text Block
4-77
Text Elements
3-17
Text Grid
4-77
Text Line
4-77
Toolbox
3-19
Visualization
4-75
Visualization Elements
3-17
Leave Black Box
4-11
LED
see Status Display Module
Levels (Black Boxes)
4-11
Lines
Grid option
4-44
List Actions
4-51
Load
5-12, see Open
Program
4-60
Logo
6-8
Main Chart (Black Box)
4-12
Main Menu
Customizing
External Programs
Margins
Master
Maximum
Block Size
Memory Requirements
Menu
Display Window
Layout
New Layout
Window
Worksheet
Menu Bar
Screen Element
Mode
Acquisition
Module
~ Menu Commands
Copy
Cut
install/configure/etc.
Properties
Module Bar
~ Menu
New
Open
Save As ...
Set to Default
~ Menu
Configuration
Display/Remove
File Format
Icons
Removing
Saving
Screen Element
Module Groups
~ Overview
Module Replace
Modules
Delete from Worksheet
Global Strings
Global Variables
Search
Mouse Button, Right ~
Move
Module
MS TCP/IP-32
Network
TCP/IP
4-86
4-86
4-7
5-11
4-27
1-8
4-66
4-66
4-66
4-66
4-66
3-19
4-28
4-18
2-2
2-2
4-19
2-2
2-3
4-15
4-15
4-16
4-16
4-14
3-21
4-39
5-2, 5-3
3-2
3-22
3-21
3-21
3-27
1-13
4-17
4-56
4-59
4-17
2-1
4-19
5-12
5-12
5-12
New
Module Bar
4-15
Worksheet
4-1
New Line (text boxes)
4-5
NI-DAQ
2-5, 4-34
Numerical Display
see List Display
One Series
Acquisition Mode
4-28
Open
Module Bar
4-15
Worksheet
4-2
Operations
Keyboard
6-1
Options
Program Start
4-44
Options Menu
4-80
Options Menu Commands
4-43
Output Channels
Delete
2-2
Overview
4-38
Page
~ Format
4-6
~ Frame
4-7
Page Properties
4-81
Paper
4-7
Parameter
Module
4-19
Passive Partner
5-11
Password
~ Protection
4-49
Password Protection
Black Boxes
4-49
Paste
Modules
4-16
Worksheet
2-2
Worksheet Parts
4-16
Pause
Experiment
4-23
PC Clock
4-33
Pointer Instrument
see Analog Meter
Preceding Level (Black Box)
4-11
Precision
B-1
Print
List Actions
4-51
Page Format
4-6
Viewport
4-7
Worksheet
4-5
Printer Setup
4-6
Processing Cycle
4-27
Program Automation
Key Events
4-50
Program Item Properties
4-24
Program Load
4-60
Program Operation Fundamentals 2-1
Properties
Bitmapped Graphics
4-75
Layout Object
2-3
Layout Objects
4-74
Layout Window
4-79
Module
2-2
VITool Objects
4-74
Worksheet
2-2
Protocol
TCP/IP
5-12
Quit
4-8, see Exit
Read
see Open
Read Data
Disk Streaming
4-30
Rearrange Data Channels
3-6
Recorder
see Chart Recorder
Reference Points
File Format
5-3
References (Help Index option)
4-83
Remote Control
5-12
Remove
Display Window
4-40
Display Windows
4-40
Function Bar
4-38
Module Bar
4-39
Replace Module
1-13
Requirements
Memory
1-8
Response Time
4-32
Restart after Time
4-23
Restore Display Windows
4-39
Right Mouse Button
2-1
RS232 Interfacesee Serial Interface Module
Running Series
Acquisition Mode
4-28
S/B ratio
4-32
Sampling Rate
2-5, 4-30
differing ~ s
4-25
Sampling Rate
4-25
Sampling Rate/Block Size Ratio 4-32
Save
Black Box
4-10
Module Bar
4-16
Window Arrangement
4-41
Worksheet
4-3
Save As
Module Bar
4-16
Worksheet
4-4
Save Data
Disk Streaming
4-29
Screen
Customization
3-9
Screen Locking
4-50
Search for Modules
4-17
Security
Black Box Passwords
4-49
Editing Passwords
4-49
Screen Locking
4-50
Worksheet Passwords
4-49
Select
Window Arrangement
4-42
Sequencer
3-12
Sequencer Comment
3-15
Serial Devices
4-35
serial number
1-9
Server
5-11
ServiceLab
Master/Slave
5-11
TCP/IP
5-12
ServiceLab.DML
4-16
SERVICELAB.INI
5-3
Setup
Analog Output
4-28
Digital Output
4-28
Disk Streaming
4-29
Experiment ~
4-25
Hardware ~
4-24
Output Buffer
4-29
Output Rate
4-29
Output Start
4-29
Printer ~
4-6
Show
Copyright Information
4-44
Show Display Windows
4-39
Show File Information
4-45
Signal Generator
see Generator
SIM
4-35
Slave
5-11
Sockets
5-12
Spacing
4-44
Start
Automatic Experiment/Program Start6-4
Experiment
4-22, 6-3
at Time
4-23
Auto Start
4-24
Restart after Time
4-23
Start Options
4-44
Start/Stop
5-12
StartUp
From Windows
2-4
Start-Up Dialog
Strings and Variables
1-13
Status Bar
2-3, 3-4, 3-25
Stop
Experiment
4-22, 4-25, 6-3
after Time
4-23
Streaming
2-5
Strings
Examples
4-63
System Information
Global Strings
4-57
Global Variables
4-59
System Requirements
1-8
TCP/IP
5-12
Text
Block
4-77
Elements
4-77
Grid
4-77
Text Block
Layout Object
4-77
Text Boxes
3-10
Text Elements
Layout Windows
3-17
VITool
3-17
Text Line
Layout Object
4-77
Text Object
Properties
4-76
Text Objects
Strings and Variables
4-78
Time
Restart after ~
4-23
Start at ~
4-23
Stop after ~
4-23
Time Base Setup
2-5
Time Bases
2-5, 4-33, 4-34
Time Zone
1-11
Timer
see TTL Pulse Module
Title Bar
3-19
Tutorial
2-7, see Instruction
TXT (File Extension)
5-2
Undo
4-16, 4-73
Universal 0
Data Format
4-30
Variables
Examples
4-63
VEC (File-Extension)
5-10
Vector-File
Data format
5-10
View Menu
4-80
View Menu Commands
4-37
Viewport
4-7
virtual device driver
1-10
Visualization
Layout Window
4-75
Visualization Elements
Layout Windows
3-17
VITool
3-17
VITool
Active Elements
3-18
Bitmapped Graphics properties4-75
Copy
2-3
Copy Layout to Clipboard 4-12
Copy to Clipboard
4-72
Copy/Paste
4-73
Delete
2-3, 4-73
Drawing Elements
3-17, 4-74
Layout Window
3-15, 3-16
Layout Window Properties 3-16
Linked Graph Properties
4-76
Linked Text Properties
4-76
Load Layout Window from File4-72
Load Layout Windows
4-13
Menus
4-72
New Layout
3-16
Page Properties
4-81
Passive Elements
3-18
Save Layout Window
4-12
Save Layout Window to File 4-72
Text Block
4-77
Text Elements
3-17
Text Grid
4-77
Text Line
4-77
Toolbox
3-19
Undo
4-73
Visualization
4-75
Visualization Elements
3-17
Window Arrangement
3-26
Delete
4-43
Save
4-41
Select
4-42
Window Menu
4-66
Window Setup
4-44
WINSOCK
5-12
WMF/CLP
4-10
Work Area
Layout Window
3-16
Worksheet Window
3-8
Worksheet
Open
4-2
Worksheet
Colors
Element
Modules
Properties
Symbols
Worksheet
Save
Worksheet
Save As
Worksheet
Print
Worksheet
File Format
Worksheet Documentation
Notes:
2-2
3-1
3-1
2-2
3-2
4-3
4-4
4-5
5-1
3-10
worksheet settings
Worksheet to Clipboard
Worksheet Window
Dialog Box
Display Window Icon
Function Bar
Menu Bar
Module Bar
Scroll Bar
Status Bar
Title Bar
Work Area
Worksheet Window
∗.DSB
2-2
4-10
3-8
3-8
3-8
3-8
3-8
3-8
3-8
3-8
3-8
3-8
4-46
ServiceLab 7.0
32-bit version for
Windows 98
Windows NT V4
Windows 2000
Windows XP Pro
Book 2:
Module Reference
Guide
Copyright 2004 by ServiceLab Ltd. All rights reserved.
ServiceLab
License Agreement
By opening the sealed license envelope, you are agreeing to the following license:
ServiceLab Ltd. grants you a non-exclusive license to use this Software on one computer at a time.
You do not obtain title to the Software or any copyrights or proprietary rights in the Licensed Software. You may not transfer, sub-license, rent, lease, convey, copy, modify, translate, convert to
another programming language, decompile or disassemble the Licensed Software for any purpose,
except as expressly provided for in this license. You may not copy the Documentation.
You may copy the Licensed Software for backup purposes only, in support of your use of the Software in accordance with the terms and conditions of this license.
ServiceLab Ltd. warrants, for a period of ninety days after your receipt of the product, 1) the disks
on which the Software is distributed to be free from defects in materials and workmanship, and 2)
that the software will perform substantially in accordance with the Documentation. If the product
fails to comply with the warranty set forth above, ServiceLab Ltd.'s entire liability and your exclusive remedy will be replacement of the disks or ServiceLab Ltd.'s reasonable effort to make the
product meet the warranty set forth above. If ServiceLab Ltd. is unable to make the Product conform to the above warranty, then you may return the complete package to ServiceLab Ltd. or its
dealer, and ServiceLab Ltd., at its option, may refund all or a fair portion of the price you paid for
this package.
Although ServiceLab Ltd. has tested the Software and reviewed the Documentation, SERVICELAB
LTD. MAKES NO WARRANTY OR REPRESENTATION, EITHER EXPRESS OR IMPLIED,
WIT H RESP ECT TO THIS SOFTWARE OR DOCUMENTATION, T HEIR QUALITY, PERFORMANCE, MERCHANTABILITY, OR FITNESS FOR A PART ICULAR PURPOSE. AS A
RESULT, THIS SOFTWARE AND DOCU-MENTATION ARE LICENSED “AS IS,” AND
YOU, THE LICENSEE, ARE ASSUMING THE ENTIRE RISK AS TO THEIR QUALITY AND
PERFORMANCE.
IN NO EVENT WILL SERVICELAB LTD. BE LIABLE FOR DIRECT, INDIRECT, INCIDENTAL, OR CONSEQUENTIAL DAMAGES ARISING OUT OF THE USE OR INABILITY TO
USE THE SOFTWARE OR DOCUMENTATION, even if advised of the possibility of such damages. In particular, ServiceLab Ltd. shall have no liability for any programs or data stored or used
with the Software, including the costs of recovering such programs or data.
Copyright © 2004 by ServiceLab Ltd.. All rights reserved.
ServiceLab Ltd.
Marelene-Dietrich-Str. 5,
D – 89231 Neu-Ulm, Germany
i
ServiceLab
Year 2000 Compliance Statement
ServiceLab 7.0 is Year-2000-compliant. It conforms to the British Standards Institution BSI DISC PD-2000-1 'A Definition of Year 2000 Conformity Requirements‘ document. Specifically, ServiceLab will:
Work correctly for the following the transition from December 31, 1999
to January 1, 2000
Recognize that 2000 is a leap year;
Work correctly for all dates in the range January 1, 1980 through December 31, 2037, but not before, and not after
Read and store dates correctly using its private (.DDF) data format, and
store appropriately for other date formats
ii
ServiceLab
Risky Applications
Warning:
(1) ServiceLab is not designed with components and testing for a level of reliability suitable for use in or in connection with surgical implants or as critical
components in any life support systems whose failure to perform can reasonably
be expected to cause significant injury to a human.
(2) In any application, including the above, reliability of operation of the software products can be impaired by adverse factors, including but not limited to
fluctuations in electrical power supply, computer hardware malfunctions, computer operating system software fitness, fitness of compilers and development
software used to develop an application, installation errors, software and hardware compatibility problems, malfunctions or failures of electronic monitoring
or control devices, transient failures of electronic systems (hardware and/or
software), unanticipated uses or misuses, or errors on the part of the user or applications designer (adverse factors such as these are hereafter collectively
termed "system failures").
Any application where a system failure would create a risk of harm to property
or persons (including the risk of bodily injury and death) should not be reliant
solely upon one form of electronic system due to the risk of system failure.
To avoid damage, injury, or death, the user or application designer must take
reasonably prudent steps to protect against system failures, including but not limited to back-up or shut down mechanisms.
Because each end-user system is customized and differs from the testing platforms of ServiceLab Ltd. and because a user or application designer may use
ServiceLab Ltd. products in combination with other products in a manner not
evaluated or contemplated by ServiceLab Ltd. , the user or application designer
is ultimately responsible for verifying and validating the suitability of ServiceLab Ltd. products whenever ServiceLab Ltd. products are incorporated
in a system or application, including, without limitation, the appropriate design,
process and safety level of such system or application.
iii
ServiceLab
Contents
BOOK 2: MODULE REFERENCE GUIDE
CHAPTER 1: INTRODUCTION
1. Welcome to ServiceLab!
2. About your ServiceLab Documentation
2.1.
What’s Included
2.2.
Typographic Conventions
3. ServiceLab Versions
4. New in ServiceLab Version 7.0
4.1.
General
4.2.
New Modules
4.3.
Module Changes
I
1-1
1-1
1-2
1-2
1-3
1-3
1-6
1-6
1-6
1-7
CHAPTER 2: MODULE GROUP OVERVIEW
1. Module Groups
2. Modules
2.1.
Module Symbols
2.2.
Installing Modules
2.3.
Configuring Modules
2.4.
Connecting Modules
2.5.
Moving Modules
2.6.
Select Modules
2.7.
Copy Modules
2.8.
Paste Modules
2.9.
Deleting Modules
2.10.
Replace Module
2.11.
Search for Modules
3. General Module Parameters
3.1.
Module Name
3.2.
Module Description
3.3.
Selecting the Number of Channels
3.4.
Channel Name
3.5.
Channel Units
4. Special Module Functions and Options
4.1.
Modules with Multiple Function Types
4.2.
Module Option: Copy to Outputs
4.3.
Module Manipulation by Keyboard
4.4.
F7/F8 Function Keys
4.5.
Module Info
2-1
2-1
2-1
2-2
2-2
2-3
2-3
2-3
2-3
2-4
2-4
2-4
2-4
2-4
2-4
2-5
2-5
2-8
2-8
2-10
2-10
2-10
2-11
2-11
2-12
2-1
CHAPTER 3: INPUT/OUTPUT MODULE GROUP
1. SIMATIC S7 Input
3-2
3-1
v
ServiceLab
2.
Analog Input Module (optional)
3-6
2.1.
Module Configuration
3-7
2.2.
Channel Setup
3-7
2.3.
Scaling
3-7
2.4.
Channel Information
3-8
2.5.
Input Range
3-8
3. Multispeed Analog Input Module 3-9
4. Analog Output Module (optional)
3-9
5. Digital Input Module (optional)
3-10
6. Digital Output Module (optional)
3-11
7. Counter Input Module (optional)
3-12
7.1.
Hints for frequency measurement
3-14
8. Frequency Output Module (optional)
3-15
9. DDE Input Module
3-16
10.
DDE Output Module
3-19
11.
RS232 Input Module
3-23
11.1.
Data Request Command
3-24
11.2.
Options
3-26
11.3.
Additional Data
3-27
11.4.
COM Port
3-27
11.5.
Monitor
3-28
11.6.
Additional Controls
3-33
11.7.
RS232/ICOM Input Data Format
3-33
11.8.
RS232 Input Examples
3-38
12.
RS232 Output Module
3-41
12.1.
RS232 and ICOM Modes
3-42
12.2.
Com Port
3-42
12.3.
Additional Controls
3-42
12.4.
RS232 and IEEE488 Output Data Format
3-43
12.5.
Global Strings/Variables
3-44
13.
ICOM (TCP/IP) Input Module
3-45
13.1.
Module Settings
3-46
13.2.
Interface Configuration
3-47
13.3.
Monitor
3-48
13.4.
Additional Controls
3-48
14.
ICOM Output Module
3-49
15.
IEEE488 Input and Output Modules (optional)
3-51
15.1.
IEEE488 Input Module (optional)
3-52
15.2.
IEEE488 Output Module
3-58
15.3.
IEEE488 Hardware Settings
3-60
15.4.
IEEE488 Options
3-60
15.5.
Command overview - IOtech IEEE card
3-62
15.6.
Command overview - National Instruments IEEE card3-63
16.
IVI Scope (optional)
3-64
vi
ServiceLab
17.
18.
19.
20.
IVI Function Generator (optional)
IVI Digital Multimeter (DMM) (optional)
MODBUS Analog Input and Output Modules (optional)
MODBUS Digital Input and Output Modules (optional)
3-66
3-67
3-69
3-71
CHAPTER 4: TRIGGER FUNCTIONS MODULE GROUP
1. Combi Trigger Module
4-2
1.1.
Trigger Applications
4-3
2. Pre/Post Trigger Module
4-3
2.1.
Hysteresis
4-5
3. Start/Stop Trigger Module
4-6
4. Trigger on Demand
4-7
4.1.
Trigger Condition
4-7
4.2.
Option
4-7
4.3.
Function of the Trigger on Demand
4-8
4.4.
Function without Check Sign Inversion
4-8
4.5.
Function with Check Sign Inversion
4-8
5. Sample Trigger
4-8
5.1.
Trigger modes
4-9
5.2.
Trigger condition is fulfilled by more than XXX values 4-9
5.3.
Trigger condition is fulfilled less than XXX values
4-10
6. Relay Module
4-10
4-1
CHAPTER 5: MATHEMATICS MODULE GROUP
1. Arithmetic Module
1.1.
Arithmetic Operation with One Operand
1.2.
Arithmetic Operation with One Operand and Constant
1.3.
Arithmetic Operation with Two Operands
1.4.
Arithmetic Operation with Two or More Operands
2. Trigonometry Module (optional)
3. Scaling Module
3.1.
Linear Scaling
3.2.
Interpolation
3.3.
Thermocouple Linearization
3.4.
Pt 100/Ni100 Linearization
3.5.
Offset Adjustment
4. Differentiation/Integration Module
4.1.
Action Controlled Differentiation/Integration
4.2.
Input Controlled Differentiation/Integration
5. Logical Operations Module
6. Bit Logic Module
6.1.
Bit Operation: Mask Bits
6.2.
Bit Operation: Extract/Combine bit masks
6.3.
Bit Operation: Link channels bit by bit
7. Channel Comparator Module
5-1
5-2
5-2
5-3
5-4
5-4
5-5
5-6
5-7
5-8
5-8
5-9
5-9
5-10
5-10
5-11
5-12
5-13
5-14
5-14
5-15
5-18
vii
ServiceLab
7.1.
Compare Channel with a Constant
7.2.
Compare Channel with another Channel
8. Flip-Flop Module (optional)
9. Gray Code Module (optional)
10.
Slope Limitation Module
10.1.
Additional Amplitude Limitation
10.2.
Global Variables
11.
Reference Curve Module
11.1.
Function
11.2.
Structure of the Reference Curve File
12.
Formula Interpreter Module
12.1.
Overview: Mathematical Operands and Functions
12.2.
Order of Operations
12.3.
General Operation
12.4.
Syntax
12.5.
Mathematical Operands
12.6.
Mathematical Functions
12.7.
Error messages
CHAPTER 6: STATISTICS MODULE GROUP
1. Min/Max Module
1.1.
Output mode
1.2.
Hysteresis
1.3.
Start Hysteresis
1.4.
Start Hysteresis and Reset Asynchronous Action
2. Statistical Values Module
3. Position in Signal Module
4. Histogram Module
5. Regression Module
6. Counter Module
7. Pulse Width Analysis Module (optional)
8. Sort Channels (optional)
9. Check Reference Curve Module
9.1.
Settings
9.2.
Tolerance Band
9.3.
Min/Max Curve
9.4.
Reference curve ± %
9.5.
Reference curve ± (Constant + %)
9.6.
Explanation Reference Curve ± Constant
9.7.
Reference Curve ± n * Standard Deviation
CHAPTER 7: SIGNAL ANALYSIS MODULE
1. Filter Module (optional)
2. Correlation Module (optional)
2.1.
Correlation Coefficient and Cross correlation
viii
5-19
5-19
5-20
5-22
5-23
5-24
5-24
5-24
5-24
5-25
5-26
5-26
5-27
5-28
5-28
5-29
5-32
5-38
6-1
6-2
6-2
6-3
6-3
6-4
6-4
6-5
6-7
6-8
6-10
6-12
6-13
6-13
6-13
6-14
6-15
6-15
6-15
6-15
6-16
7-1
7-2
7-3
7-4
ServiceLab
2.2.
Auto Correlation and Cepstrum
Data Window Module (optional)
3.1.
Window Types
3.2.
Window Specifications
3.3.
Vector Size
3.4.
Amplitude Correction
4. Fast Fourier Transform Module (optional)
4.1.
FFT: General Remarks
4.2.
Real FFT of a Real Signal
4.3.
Complex FFT of a Real Signal
4.4.
Complex FFT of a Complex Signal
4.5.
Cross Spectrum of Two Real Signals
5. Polar/Cartesian Coordinates Module (optional)
6. Electric Characteristics Module (optional)
6.1.
Inputs
6.2.
Outputs
6.3.
Options
6.4.
Error Messages
7. Harmonic Distortion Module (optional)
7.1.
Inputs
7.2.
Outputs
7.3.
Options
7.4.
Error Messages
8. Period Check Module (optional)
8.1.
Inputs
8.2.
Outputs
3.
CHAPTER 8: CONTROL MODULE GROUP
1. Signal Generator Module
1.1.
Generator without Modulation
1.2.
Generator with Frequency Modulation
1.3.
Generator with Amplitude Modulation
1.4.
Generator with Frequency and Amplitude Modulation
1.5.
Generator with Get Global Variable
2. Switch Module
3. Slider Module
4. Coded Switch Module (optional)
5. PID Control Module (optional)
5.1.
PID Control Circuit
5.2.
P / I / D Components
5.3.
Kr, Tv, Tn Parameters
6. Two Point Control (optional)
6.1.
Two-point control: Change type of control via action
6.2.
Control with switch free range of tolerance
6.3.
Control with premature switching
7-5
7-6
7-7
7-9
7-10
7-10
7-11
7-11
7-12
7-13
7-14
7-14
7-15
7-15
7-16
7-16
7-18
7-18
7-19
7-19
7-19
7-21
7-21
7-22
7-22
7-22
8-1
8-3
8-5
8-6
8-6
8-7
8-7
8-8
8-10
8-12
8-14
8-15
8-15
8-16
8-24
8-24
8-25
8-26
ix
ServiceLab
6.4.
Control with delayed feedback
6.5.
Control with delayed yielding feedback
7. Time Delay Module
8. Latch Module
8.1.
Data throughput depending on set input
8.2.
Latch all channels on action
8.3.
Latch all channels on TTL high on set input
8.4.
Synchronize output data rate to set-input
8.5.
Set Global Variable
9. Signal Router (optional)
9.1.
Input Controlled Router
9.2.
Amplitude Controlled Router
10.
TTL Pulse Generator Module (Timer)
11.
Stop Module
12.
Global Variable Read
13.
Global Variable Write
14.
Block Time (optional)
CHAPTER 9: DISPLAY MODULE GROUP
1. Y/t Chart Module
1.1.
X-Axis Settings - Time Scale
1.2.
Y Scale… (Amplitude Scaling)
1.3.
Reference Curve
1.4.
Display Window Menu Options
1.5.
Axes Functions
1.6.
Display Functions
1.7.
Survey Functions
1.8.
Options
2. X/Y Chart Module
2.1.
Display Window Menu Options
2.2.
Write Cursor Data
2.3.
Options Write Cursor
2.4.
Write all Cursor Data
2.5.
Data Formats
3. Chart Recorder Module
3.1.
Chart Display Window
3.2.
Display Window Menu Options
4. Analog Meter Module
5. Digital Meter Module
6. Bar Graph Module
7. Status Lamp Module
7.1.
Mode TTL Input
7.2.
Single BitMode s
8. List Display Module
x
8-26
8-28
8-29
8-29
8-29
8-30
8-31
8-32
8-32
8-33
8-33
8-34
8-35
8-36
8-37
8-38
8-39
9-1
9-4
9-5
9-7
9-7
9-8
9-8
9-10
9-14
9-15
9-18
9-19
9-20
9-20
9-21
9-21
9-22
9-24
9-24
9-27
9-30
9-33
9-36
9-36
9-36
9-39
ServiceLab
CHAPTER 10: FILES MODULE GROUP
1. Read Data Module
1.1.
Read Options
1.2.
Multiple Files
2. Write Data Module
2.1.
Multi-File
2.2.
File Formats
3. Backup Data Module
4. ODBC Input Module
5. ODBC Output Module
10-2
10-5
10-6
10-7
10-10
10-11
10-20
10-22
10-23
10-1
CHAPTER 11: DATA REDUCTION MODULE GROUP
1. Average Module
1.1.
Options
1.2.
Arithmetic Mean
1.3.
Quadratic Mean
1.4.
Median
1.5.
Options
2. Block Average Module
2.1.
Peak Hold
3. Separate Module
4. Merge/Expand Module
5. Cut Out Module
6. Time Slice Module (optional)
6.1.
Time Controlled Multiplexer
6.2.
Amplitude Controlled Multiplexer
7. Circular Buffer Module
8. Shift Register Module (optional)
11-2
11-2
11-2
11-3
11-4
11-6
11-6
11-7
11-8
11-9
11-10
11-11
11-11
11-12
11-13
11-13
CHAPTER 12: SPECIAL MODULES GROUP
1. Black Box
1.1.
New Black Box
1.2.
Export / Import Module
1.3.
List of up to 20 Black Boxes
2. Event Driven Actions
2.1.
Action Module
2.2.
Message Module
2.3.
EMail Module
3. Manipulating the Time Base
3.1.
Time Base Module
3.2.
Signal Adaptation Module
12-2
12-3
12-6
12-7
12-8
12-9
12-18
12-23
12-24
12-24
12-26
CHAPTER 13: NETWORK MODULE GROUP
1. Network Modules
2. DataSocket Communication
2.1.
Overview
13-2
13-2
13-2
11-1
12-1
13-1
xi
ServiceLab
2.2.
2.3.
2.4.
xii
Other Information
DataSocket Import Module
DataSocket Export Module
13-3
13-3
13-6
Chapter 1
Introduction
ServiceLab
Chapter 1: Introduction
Chapter 1: Introduction
1.
Welcome to ServiceLab!
This is the second volume of the ServiceLab User Guide – The Module Reference Guide. It contains complete descriptions of each module, including some
guidance on how to use it.
Use ServiceLab’s Online Help system to display information about the operation
that you are about to carry out on the screen. It may be unnecessary for you to
thoroughly study this printed manual.
If you have upgraded from a previous version of ServiceLab, please review
Chapter 1 – Section 4 for information about new and changed features.
The ServiceLab team will continue to develop ServiceLab as software that
matches its users’ requirements and preferences.
ServiceLab Ltd.
Marlene-Dietrich-Str. 5
D-89231 Neu-Ulm
Germany
1-1
About your ServiceLab Documentation
2.
ServiceLab
About your ServiceLab Documentation
2.1. What’s Included
The ServiceLab documentation consists of the following:
The context-sensitive online Help system provides quick on-screen reference to procedures and commands you may need while working with ServiceLab. In addition, hardware help is provided to describe the installation, setup, and use of your specific data acquisition device.
The printed or the digital User Guide contains a comprehensive description of all of ServiceLab functions and their uses. It serves as a reference
book, providing background information.
This printed or digital book, Volume 2 of the User Guide, the Module
Reference Guide, with complete descriptions of each Module Group and
Module.
README.WRI, an information file that is copied to your hard disk when
you set up ServiceLab, provides information that was updated after this
User Guide was printed. You can easily read (or print) this file using
Windows Write.
We strongly recommend that you read the README.WRI file before you
start working with the software.
1-2
ServiceLab
Chapter 1: Introduction
2.2. Typographic Conventions
We have used visual cues and standard text formats in this User Guide to help
you locate and interpret information easily.
Text Formats
File names and directory names are printed in ALL CAPITALS.
All references to menus, menu commands and to the options available in dialog
boxes are printed in this sans serif typeface.
All references to keyboard keys and command entries are printed in this
text format. These are usually commands that you must type at the DOS
Prompt or in ServiceLab or Windows text boxes exactly as you find them printed
in this manual. It does not matter whether you type upper or lowercase letters.
Keyboard Formats
Key combinations and key sequences:
KEY1+KEY2 means to press and hold down the first key while you press
the second.
KEY1, KEY2 means to press and release the keys one at a time.
Symbols
We have used the following symbols throughout this User’s Guide to identify important information to guide you to information on a related topic:
Serious Warning! Neglecting the hints indicated by this symbol may result in severe program errors or even damage to your hardware.
Warning. Neglecting the hints indicated by this symbol may result in ServiceLab not operating properly; data may be misinterpreted or not calculated correctly. This symbol will remind you to check that parameters are set
correctly, or to check settings that must match.
When you have read a passage about a subject, this symbol may indicate that
explanations on a related subject can be obtained elsewhere in this User
Guide, or that similar commands, options, etc. might be of interest in the current context.
3.
ServiceLab Versions
ServiceLab is available with optional features. The table below lists the features
available. Please contact your dealer or distributor for more information about
ServiceLab. Note that this User Guide includes information about optional features.
Optional features may vary by country. Check with your dealer or distributor
for details.
1-3
ServiceLab Versions
1-4
ServiceLab
ServiceLab
Chapter 1: Introduction
Control
Statistics
x
x
x
x
x
x
x
x
x
x
x
x
x
x
x
x
x
x
x
x
x
x
x
x
x
x
x
x
x
x
x
x
x
x
Network
x
x
Filter
Correlation
Data Window
Elektirc Characteristics
Harmonic Distortion
Period Check
FFT
Polar/Cartesian
Y /t Chart
X/Y Chart
Chart Recorder
A nalog Meter
Digital Meter
Bar Graph
Status Lamp
List Display
Read Data
Write Data
Backup Data
ODBC In
ODBC Out
A verage
Block Average
Separate
Merge/Expand
Cut Out
Shift Register
Time Slic e
Circular Buffer
DataSocket In
DataSocket Out
Black Box
Ex/Import Black Box
Event Driven A ctions
Message
Send E-Mail
Time Base
Signal Adaptation
x
x
x
x
x
x
x
x
x
x
x
x
x
x
x
x
x
x
x
x
x
x
x
x
x
x
Optional
Basic Version
Group
S ignal Analysis
Display
x
x
x
Files
x
x
x
x
x
x
x
x
Data
x
x
x
Module
Reduction
x
Optional
Basic Version
Module
SIMATIC S7 read
A nalog Input
A nalog Output
Digital Input
Digital Output
Counter Input
Frequency Output
RS232 Input
RS232 Output
ICOMs Input
ICOMs Output
IEEE488 Input
IEEE488 Output
DDEInput
DDEOutput
IVI Devic es
MODBUS Devices
Combi Trigger
Pre/Post Triggering
Start/Stop Triggering
Trigger on Demand
Sample Trigger
Relay
Formula Interpreter
A rithmetic
Trigonometry
Scaling
Different./Integration
Logical Operations
Slope Limitation
Bit Logic
Gray Code
Flip-Flop
Channal Comparison
Reference Curve
Statistical V alues
Position In Signal
Histogram
Regression
Counter
Minimum/Maximum
Pulse Width Analysis
Sort Channels
Check Reference Curve
Generator
Sw itch
Coded Sw itch
Slider
PID Control
Tw o-Point Control
Time Delay
Latch
TTL Pulse Generator
Global Variable Read
Global Variable Write
Signal Router
Blocktime Info
Stop
Special
Mathematics
Trigger
Input/Output
Group
The chart below shows the versions and which modules are provided with each
version.
x
x
x
x
x
x
x
x
x
x
x
x
x
x
x
x
x
x
x
1-5
ServiceLab
New in ServiceLab Version 7.0
4.
New in ServiceLab Version 7.0
Below, you will find an overview of the most important additions and changes
for the current ServiceLab Version. Please also read the README.WRI file for
additional changes made after this book was printed.
We have described the most important changes and additions to this ServiceLab
version on the following pages.
4.1. General
Replace Module
You can Replace modules by other modules of similar configuration. Use the
new command and select one of the available replacements from the list.
Start-Up dialog for Global Strings / Variables
Use the new Menu Command to configure the order in the list of strings/variables
that must be entered at the start of an experiment.
Import Global Strings / Variables
In addition to the *.VAR file format (generated by the global variables export
function) now you can import standard file formats *.CSV, *.TXT (Excel format)
with the command on the Options Menu. For the import an Excel table separated
by commas is needed.
In this way you can configure the global variables in an Excel table, where it is
easy to create similar configurations with Copy/Paste; ensure that you do not enter the same entries several times into the global variable dialog box.
Action/Layout Link Check
The renaming of modules which are referenced in Action modules or layout links
will now be handled appropriately. All action modules and layout objects with
references to the renamed module will use the new module name. You no longer
have to manually rename these links.
Also, deleting layout pages updates any links in action modules to the new Layout page numbering.
Block Move of Modules and Signal Connections
You can select a block of Modules and move them to another part of the Worksheet. All Connections are also moved.
User Defined Colors
If any user-defined colors are used in any dialog, such as for the layout background color, then these colours can be used in all other colour setting dialogs.
4.2. New Modules
See the Module Reference Guide for details of each new module.
Module
1-6
Module Group
ServiceLab
Chapter 1: Introduction
Channel Comparator
(optional)
Mathematics
Block Time (optional)
Control
Shift Register (optional)Data Reduction
Multi-Speed Analog
Input (optional)
Input/Output
ICOM Input
Input/Output
ICOM Output (optional) Input/Output
MODBUS Analog Input/Output (optional)
Input/Output
MODBUS Digital Input/Output (optional)
Input/Output
Electric Characteristics Signal Analysis
(optional)
Harmonic Distortion
(optional)
Signal Analysis
Period Check (optional)Network
4.3. Module Changes
Statistical Values
The new Peak-to-Peak function computes the difference between the maximum
and the minimum of a block.
Scaling Module: Unit Conversion:
This new option converts the input value into one of several unit systems ServiceLab allows you to convert from one measurement system to another without
the knowledge of the necessary conversion constant. Conversions are included
for temperature, volume, pressure, length, mass, velocity, and more.
1-7
New in ServiceLab Version 7.0
ServiceLab
RS232 Interface (RS232 Input- and RS232 Output Modules)
Improved debugging and setup features are included in the RS232 monitor. Up to
30.000 characters of text are stored in the internal monitor buffer. The Format
String Debugging function is a useful tool for detecting errors in Format Strings
or to help in creating a Format String. A basic function of the Format StringDebugging is to mark Parser activities with colored characters. The parser divides the series of characters received into parts corresponding to the settings in
the Format String and assigns different colors to each of these elements.
Regression
The performance of the Regression Modules was improved. The block size of an
input block does not change, and the computation time per regression calculation
was more than halved.
Integration/Differentiation Module
The Differentiation/Integration module now allows a control input to reset the
module based on the control signal.
1-8
ServiceLab
Chapter 2: Module Group Overview
Chapter 2: Module Group Overview
This chapter describes the module groups and provides instruction for how to install, manipulate, and change the parameters of the modules in the worksheet.
1.
Module Groups
Use the Module menu functions to select any of the modules provided by ServiceLab to insert into your worksheet.
Within the Module menu, select a Module Group. A Module Group is made up of
a number of modules providing similar functions. The Module menu provides the
following module groups:
Chapter 3: Input/Output Module Group
Chapter 4: Trigger Functions Module Group
Chapter 5: Mathematics Module Group
Chapter 6: Statistics Module Group
Chapter 7: Signal Analysis Module (optional)
Chapter 8: Control
Chapter 9: Display
Chapter 10: Files
Chapter 11: Data Reduction
Chapter 12: Special
Chapter 13: Network
2.
Modules
Choose a module group to display a submenu with the individual modules belonging to that group.
2.1. Module Symbols
A module represents a functional element in the ServiceLab experiment setup
(worksheet). A worksheet can contain up to 256 modules. Each Black Box module can also contain up to 256 modules, including other Black Box modules.
The functions symbolized by the modules provide all the operations required for
an experiment,
From data acquisition (by a data acquisition board) or signal generation
(simulated by a virtual generator)
2-1
ServiceLab
Modules
To data analysis, evaluation and processing (mathematics, statistics, control, trigger and other functions)
Up to their presentation on screen (display instruments) or export for
documentation purposes (printer, metafile, etc.).
Each of the available modules in ServiceLab is shown in two forms, both indicating the module’s function: Module Bar icons and worksheet symbols.
A limited number of module icons can be installed on the Module Bar. They can
be placed on the worksheet by a single mouse click on the Module Bar icon. Any
module can be installed on the Module Bar, including Black Boxes that you have
previously saved.
You can configure the Module Bar according to your specific requirements.
You can save various configurations to files for later use. For details, please
refer to Chapter 4 of this manual.
2.2. Installing Modules
A module can be installed on the worksheet either by choosing it from the Module menu or by clicking its icon on the Module Bar. Either way, the module will
be placed on the worksheet as a module symbol. For modules that provide more
than one basic operation, you must also select the function type.
Choose a Module Group from the Modules menu to display a submenu with the
individual modules that belong to that group. The submenus list all the modules
currently available. You can select any of the modules by clicking on its name. If
a module is not available in your version of the software it will be gray, and you
will be unable to select it.
A worksheet can contain up to 256 modules, including Black Box modules.
2.3. Configuring Modules
Use the left mouse button to double-click on the module’s worksheet symbol to
open the Properties dialog box to configure the module. The following parameters can generally be specified in the dialog box:
The Module Name,
A short Description,
The number of inputs/outputs (up to 16 for most modules).
Once you have activated more than one channel, you can select each of them to
display and define specific channel parameters.
Use the F7/F8 function keys to easily configure several channels for one module.
For specific module settings, please refer to the individual module descriptions.
The general parameters are described in this chapter beginning at page 2-4. The
specific module settings are described in the sections for each module.
2-2
ServiceLab
Chapter 2: Module Group Overview
2.4. Connecting Modules
A data channel is the connection between the output of a module and the input of
another module. Data is transferred between modules via these connections.
In the ServiceLab work area, lines like the ones shown below show connections,
which always connect the output and input symbols of the module symbols. By
creating junction points and branches, you can connect each module output to up
to 16 inputs of other modules.
Data channel
junction points and branches
no connections
For details on how to create, delete and rearrange data channels and branches,
refer to Chapter 3 of the User’s Guide.
To get further Information about the connected modules while the experiment
is runnig:
hold the CTRL key while you left click on the data channel
hold the STRG key while you left click on the date channel or
you left click on the data channel.
2.5. Moving Modules
A module can be moved to any position on the worksheet by dragging and dropping its worksheet symbol. Click on the worksheet symbol with the left mouse
button and, while holding the mouse button down, drag it to any position. When
the mouse button is released, the module symbol will automatically be aligned
based on the spacing value entered in the Window Setup box of the Options
menu.
You can move a group of modules together if the data lines do not have any data
branches. Click and drag the mouse to draw a selection frame around the modules. All modules within this range will be marked and can be moved together.
Use Ctrl-Click to deselect modules that you do not want to move.
2.6. Select Modules
Click on the worksheet symbol with the left mouse button or draw a box around
the module (or modules) while holding the mouse button down. All modules
within the frame will be selected.
2.7. Copy Modules
Selected modules can be copied using the Main Menu command Edit: Copy .
2-3
General Module Parameters
ServiceLab
2.8. Paste Modules
Selected modules can be pasted into the worksheet using the Main Menu command Edit: Paste .
2.9. Deleting Modules
Modules can be deleted by double-clicking the worksheet symbol with the right
mouse button. This opens a dialog box allowing you to remove the module or to
delete its input or output connections. Modules also can be deleted using the Edit
command of the Main Menu.
2.10. Replace Module
You can replace a module in your worksheet by another module of the same type
of functionality. Right mouse click on the module symbol to open the module context menu. Use the Replace Module command to open a list box with all available replacements. If you replace the old module with the selected new module,
all input and output lines are preserved. You can copy over both the channel
names and the units defined in the original module.
2.11. Search for Modules
You can search for installed modules with the Search for Modules command.
You can select the command from the Edit menu or from the dialog box that appears when you double-click on the worksheet symbol with the right mouse button. The Search for Modules command opens a list box with all installed modules and black boxes. When you double click with the left mouse button on the
desired module, ServiceLab jumps to the module icon in the worksheet.
Some of the operations described here can also be performed using the keyboard. See page 2-11 for more information on keyboard operations.
3.
General Module Parameters
3.1. Module Name
To clearly identify a module on the worksheet, enter an identifying name for each
module. The name may consist of up to 12 alphanumeric characters. ServiceLab
provides a default name, which you can change to clearly document the function
of the module in your experiment.
The module name will be shown in the Title Bar of the module symbol. With
modules that provide an additional display or control window, such as the display modules, the identifier will also be displayed in the Title Bar of the corresponding window and below the icon that represents the minimized window.
2-4
ServiceLab
Chapter 2: Module Group Overview
Modules that influence the functions of other modules (such as the Action module)
identify their target module through its module name (not through data channels as
it might appear). For that reason, module names must always be unique.
Whenever you install a new module, ServiceLab suggests a default name. This
name is always unique. It indicates the module function followed by the consecutive number of this module type (for example, Generator00 for the first Generator
module, Generator01 for the second Generator module, Generator02 for the third
and so forth). The description of the module function may be abbreviated because of the limited number of characters.
3.2. Module Description
Describe the function of each module in the worksheet with up to 40 alphanumeric characters. It will be stored with the worksheet. By default, this field is
empty.
3.3. Selecting the Number of Channels
Use the Channel Selection Bar to specify the number of signal inputs and outputs
for a module in your worksheet.
This is an essential part of the module configuration. The module symbol in the
work area will display the defined number of input ( I) and output (O) symbols.
These are the starting and termination points for the data channels through which
data will be transferred between the modules.
Once you have activated more than one channel, you can select each of them to
display and define channel-specific parameters.
Each activated channel can be selected to define and display specific channel parameters.
The buttons described below allow you to easily configure a module.
Types
There are three types of Channel Selection Bars:
The Channel Number Selection Bar is found in almost every Module Configuration dialog box.
The Input Channel Selection Bar and the Output Channel Selection Bar
activate and deactivate the channels on your data acquisition hardware.
They are only required in the Module Configuration dialog boxes of those
modules from the Input/Output module group which establish the connection between ServiceLab and your hardware.
2-5
General Module Parameters
ServiceLab
Channel Number Selection Bar
Use this bar to specify the number of signal inputs and outputs of a module in
your worksheet. The corresponding module symbol in the work area will then
display that number of input (I) and output ( O) symbols.
Channel Number Selection Bar (Example)
Once you have activated more than one channel, you can select each one to display and define specific channel parameters.
Use the “+” and “−” buttons on the left and right of this bar to increase or decrease the total number of input/output channels of a module. (This can be done
only using these buttons.)
Add One Channel
Click this button to activate one more channel and thus add another input/output to the module. If the maximum number of channels has been
activated, the Add Channel button remains gray.
If the newly activated channel had been used before in the same worksheet, its settings will still be valid as last selected, as long as the experiment setup has not been saved to a file in the meantime. Otherwise
the default values of that module will be used.
Remove One Channel
Click this button to reduce the number of channels by one. If only one
channel has been activated, the Remove Channel button remains gray.
If the channel that is to be removed is presently selected, the next channel on the left will be automatically selected. The settings of the removed channel are retained until the worksheet is saved to a file.
The state of each channel is indicated by one of the following symbols:
Channel inactive
This channel is inactive and cannot be selected. To activate it, click the
Add Channel button as described above.
Channel active
This channel is active. The corresponding module symbol on the worksheet supplies an output symbol for this channel. Click the icon with the
left mouse button to select the channel to define specific parameters.
The channel can only be removed by clicking the Remove Channel
button as described above.
2-6
ServiceLab
Chapter 2: Module Group Overview
Channel active and selected
This active channel is currently selected. The settings displayed in the
Module Configuration boxes (such as the channel name) all apply to
this channel, and it is the only channel that can have parameters defined.
You can only deselect this channel by selecting (clicking) another activated channel, or by removing it as described above.
Other channels that are activated though not selected and displayed may be
configured differently. To display the settings of any channel, you must select
it first.
Configuring several channels for one module is easy when you use the F7/F8
function keys (see page 2-11).
Input and Output Channel Selection Bars
Activate or deactivate the individual input or output channels of the Analog Input,
Digital Input, Counter Input, Frequency Output, and Analog Output or Digital
Output module using the Selection Bar. The corresponding module symbol in the
work area will then display that number of output (O) (for input modules) or input (I) (for output modules) symbols.
You can activate or deactivate more than one channel simultaneously. Press the
CTRL key and select the channel up to that you want to activate the channels by
double clicking the left mouse button. All channels between the active and the
selected one will be activated. To deactivate more than one channel at one time,
select the first channel and with the CTRL key pressed, select the last channel to
be deactivated. All channels between the channels will be deactivated.
The numbered connector symbols displayed in the horizontal bar represent the
physical input or output channels on your data acquisition hardware.
If you have activated more than one channel, you can select each of them to display and define specific channel parameters.
Input or Output Channel Selection Bar (Example)
The state of each channel is indicated by one of the following:
Channel not available
These channels are not available on the data acquisition board installed
in your system and cannot be activated or selected.
Channel inactive
This channel is available on the data acquisition board, but it is inactive and will not acquire or output data. Double-click the icon with the
left mouse button to activate and select it.
2-7
General Module Parameters
ServiceLab
Channel active
This channel is active and data will be acquired or output by the hardware when the measurement begins. The module symbol on the worksheet has an output symbol for this channel. Click the icon with the left
mouse button to select the channel to define specific parameters. Double-click the icon with the right mouse button to deactivate the channel.
Channel active and selected
The settings displayed in the Module Configuration boxes (such as the
channel name) all refer to the active, selected channel, and it is the only
channel that can have parameters defined. You can only deselect this
channel by selecting (clicking) another activated channel, or by removing it as described above.
3.4. Channel Name
Type a name for the currently selected channel using up to 20 alphanumeric
characters and/or spaces.
Whenever a new channel is activated or existing channels are combined with
others, the program provides a default Channel Name. This default name expresses the module function, followed by consecutive numbers (for example:
Generator 1, Generator 2, Arithmetic11, Arithmetic12 and so forth).
If the checkbox before the name is activated, the user can change the default
name. If the checkbox is not selected (default setting), the name of the connected
input (parent) module is copied as the name for each channel when measurement
starts. (You can disable this default setting in the Options: Window Setup menu.)
ServiceLab can only number the Channel Names within one module.
Hence, these default suggestions are not always unambiguous, but can occur repeatedly, especially within more complex worksheets.
The Channel Name displayed (or modified) in the module configuration
dialog box refers to the currently selected channel.
If you press the F7/F8 function keys to copy parameters, the channel name of the selected channel will be copied to all of the other activated channels. It will thus lose its identifying quality.
Modules that influence the functions of other modules (such as the Action
module) do not identify their target channel through its channel name but
through its number. For that reason, channel names need not always be
unique.
3.5. Channel Units
All data generating Modules have a list box in which you can edit or select the
unit used in the selected channel.
Modules that transfer data without performing a mathematical operation that affects the unit are able to copy the units used in the connected input module. To
2-8
ServiceLab
Chapter 2: Module Group Overview
copy the units, use the placeholder #0 in the unit field. You also can use another
unit in the edit field, which is then used in this channel and any connected channel
in subsequent modules.
Modules (i.e. Arithmetic), which perform mathematical operations, convert the
unit as described in the mathematics rules. Obviously, addition and subtraction
operations will not change the unit.
If you want to add or subtract two channels with different units, the unit of the
first channel is used. A coefficient of one of the units (i.e. 1000 between Millivolts and Volts) is not automatically considered. So summation of the first
channel with a 1-Volt signal and a second channel with 1 mV results in 2 Volts.
Use the Scaling Module to adapt the second channel to the first.
For example, in an Arithmetic Module, the output is the product of the input channels:
With Integration, the unit result is #0*s, with Differentiation the result is #0/s.
Some data processing modules, such as the Formula Interpreter module, have a
list box where you can select or edit the unit.
Display modules or data sink modules (i.e. the Write Data modules) also have an
edit field where you can select or edit the channel unit.
Additionally these modules are able to simplify the units if the placeholder (#0)
is used. You can define up to 30 unit relationships in the SERVICELAB.INI
file. The entry has to be as follows:
The first entry is the simplified unit followed by a line and the greaterthan (->) symbol. Then the base units with their mathematical relation follow (i.e. W->V*A). You are not allowed to use already simplified units
in the base unit term. Incorrect: J->W*s, correct J->V*A*s. Also only one
dividend and one divisor are allowed. If there are several factors you
must use brackets around them. (I.e.: N->kg*m/(s*s) but not->kg*m/s*s or
kg*m/s/s).
2-9
Special Module Functions and Options
ServiceLab
Units used in these modules are divided into the base units and, if possible,
abridged as described in the relationships. Then the resulting unit is summarized
depending on the defined relationship. (I.e.: W/C => (V*A)/(A*s) => V/s = Wb).
If you don’t define any relationships in the SERVICELAB.INI, the default
settings are used.
Hz->1/s
(Frequency: Hertz)
Ohm->V/A
(Resistance: Ohms)
S->A/V
(Electrical Conductivity: Siemens)
W->V*A
(Power: Watts)
C->A*s
(Charge: Coulombs)
Wb->V*s
(Flux magnitude: Webers)
F->A*s/V
(Capacity: Farads)
T->V*s/(m*m) (Flux Density magnitude: Tesla)
H->V*s/A
(Inductivity: Henry)
N->kg*m/(s*s) (Force: Newton)
J->V*A*s
(Work: Joule)
You can define up to 30 additional relationships of units in the
SERVICELAB.INI file. Please pay attention to the correct syntax.
4.
Special Module Functions and Options
4.1. Modules with Multiple Function Types
Several modules can be operated using different functions.
In the Module menu, these modules are listed showing only their basic
function and the Module Bar symbol only presents this function, for example, Arithmetic.
Once installed on the Worksheet, one type of this module is shown and it
can only execute one of the various functions.
When you insert this type of module into a worksheet you are asked to select the
function type. Since the function types often differ with regard to the required
number of the inputs and outputs and their assignments, the selection will also
determine the basic channel configuration of the module. In addition, the function
types may feature various setting options.
Once the module has been inserted into the worksheet, double-click on the Module symbol to show the appropriate Module Configuration dialog box.
You cannot change the function type of a module once it has been inserted onto
the worksheet. To change the present configuration you must first delete all data
channel connections to this module. Then delete the module itself. Then re-insert
the module with another specified function type.
4.2. Module Option: Copy to Outputs
The modules of the Display group, as well as the Write File and DDE Output
modules, feature the option Copy Inputs To Outputs. This option provides an
2-10
ServiceLab
Chapter 2: Module Group Overview
output for each input of the module, and the input data is passed unchanged to
the output for further processing on the worksheet.
If the output signals of one module are to be used by several other modules, without this function all downstream modules must be connected individually to the source outputs. For this, data channel branches must be
created, complicating the worksheet significantly.
With this function, the data can be used in one module (e.g. displayed),
and then the data can also be passed through to downstream modules
without any alterations. The worksheet remains legible because a linear
worksheet layout can be maintained without a minimum of data channel
branches.
This option is useful for connecting several modules with multiple inputs and
outputs. On the other hand, the option should not be used too frequently, since
it will affect performance.
4.3. Module Manipulation by Keyboard
Select the module to be manipulated. It can be identified by the inverse coloring
of its title bar.
To select a module, either click it once with the left mouse button, or
press the TAB key on your keyboard until the desired module is selected
(highlighted).
Press the ALT+ENTER keys and the Module Configuration dialog box appears. Then, press the TAB or the SHIFT+TAB keys to move from one
field or button to another; select items by pressing the ARROW keys, the
SPACE and the ENTER key. You can only use the mouse to select a channel.
To copy one parameter, or all the parameters, from the selected channel to
all the other activated channels, you can use the F7 or F8 function keys
(see page 2-11).
To delete the selected module from the worksheet, or to delete all the input and/or output channels of that module, press the DEL key. In the dialog
box, select the desired option, or choose Cancel, and press ENTER.
4.4. F7/F8 Function Keys
With most modules, up to 16 input/output channels can be activated. Since it can
be tedious to set their parameters individually, simplify that task by pressing the
F7 or F8 function keys to copy parameters from the selected channel to all the
other activated channels:
F7 to copy only the selected parameter (the currently highlighted one).
F8 to copy all the parameters of the selected channel – including the
channel name.
While an experiment is running, you cannot use these function keys.
2-11
Special Module Functions and Options
ServiceLab
4.5. Module Info
When you hold down the CTRL key and click the left mouse button on an output channel of a module, an information window will appear with online information about the connected module. The box contains information including the
block size, sampling rate, actual data value, connected modules, channels etc.
This box is useful when testing new flowcharts.
If you click with the left mouse button (without any other key pressed) on the data
channel, the Info window will be reduced and displays just the Block size, Sampling
rate and actual value.
If you click with the Shift key pressed, a ''graphical'' Info window is shown that displays the data block as a chart. The chart is automatically scaled to the maximum and
minimum value of the block.
2-12
ServiceLab
Chapter 3: Input/Output Module Group
Chapter 3: Input/Output Module Group
SIMATIC S7 reading
optional
Module
Basic
version
This group consists of the modules that input or output data via supported hardware devices, the serial port, an IEEE488 (GPIB) port, or to other programs using DDE.
x
Analog Input
x
Analog Output
x
Multi-Speed Analog Input
x
Digital Input
x
Digital Output
x
Counter Input
x
Frequency Output
x
DDE Input
x
DDE Output
x
RS232 Input
x
3-1
ServiceLab
SIMATIC S7 Input
RS232 Output
x
ICOM Input
x
ICOM Output
x
IEEE488 Input
x
INES
IOtech
National Instruments
1.
IEEE488 Output
x
IVI Scope
x
IVI Function Generator
x
IVI DMM
x
MODBUS Analog Input/Output
x
MODBUS Digital Input/Output
x
SIMATIC S7 Input
This module is used for reading process variables from a SIMENS
SIMATIC S7 (SIMATIC S7-300 or –400) via MPI or PROFIBUS.
Input and Output Characteristics
Number of Inputs:
Input Block Size:
Number of Outputs:
Output Block Size:
Max. Number of Modules:
3-2
----up to 16
1
32
ServiceLab
Chapter 3: Input/Output Module Group
In the worksheet this module con read up to 16 different process variables of a
SIMATIC S7 and pass on these values to other modules via data channels. It is
also possible to install up to 16 module and work with it at the same time.
The PROFIBUS functionality is only applicable for CPUs that
are shipped after 1/1/99.
The PROFIBUS connection can be established with both, the internal DP-interface or the communication processor. Please note
that the access via the DP-Interface is the faster one.
The CPUs do not support multi processor operation via
PROFIBUS at the moment.
The SIMATIC S7-Module is allowing parallel executing and working of
STEP7 and different SIMATIC S7.
The definition of the number of channels and the selection of a channel takes
place via the cannel setting strip.
The module can be given a description for documentation purposes. ServiceLab
assigns the module a module name and each channel its own channel name. These
settings can be altered freely.
1.1.1
Parameters
• Memory area in PLC
The memory area in the RAM memory of a SIMATIC from which the process
variable is read is defined here. The SIMATIC S7 module can read values from the
following data areas of the automation device:
- Input
- Output
- Data block (DB)
- Bit-Memory
- Counter
- Timer
• Variable type
The variable type defines the size of the memory rang and the interpretation of the
process variable which is to be read.
The following alternatives are available for selection:
Variable type
Explanation
3-3
ServiceLab
SIMATIC S7 Input
Binary
One bit of a process variable (digital value).
Binary values are standardised to TTL level at the output of the SIMATIC S7 module, i.e. if the corresponding
bit is set in the SIMATIC S7, the value 5 is present at
the output of the SIMATIC S7 module, otherwise the
value 0.
Byte
8-bit value with range of values between 0 and 255
Unsigned word
16-bit value with range of values between 0 and
65.535
Signed Word
16-bit value with range of values between –32.768 and
32.767
Word in BCD
16-bit value with range of values between –999 and
999
Unsigned double
word
32-bit value with range of values between 0 and
4.294.967.295
Signed double
word
32-bit value with rang of values between
2.147.483.648 and 2.147.483.647
Double word in
BCD
32-bit value with range of values between –9.999.999
and 9.999.999
Floating-point
value
32-bit floating-point variable in IEEE 754 format
Counter value
16-bit value; the counter reading is coded in BCD in
bits 11 ... 0. A counter reading can have the values 0 ...
999.
Timer value
16-bit value; the time value is coded in BCD in bits 11
... 0. A time value can have the values 0 ... 999.
–
• Data block
This selection box is only available if the memory area in the PLC of the process
variable which is to be read is a data block (DB).
Select the number to the data block in which the process variable lies here. But it is
only possible to select numbers if data blocks are be read.
• Address
3-4
ServiceLab
Chapter 3: Input/Output Module Group
This entry defines the address within a memory area in the PLC of the process
variable which is to be read. If the data area is a data block (DB), the number of
the data word which is to be read is to be entered here.
• Bit
This selection box is only available if the variable type of the process variable
is a binary value. Select the desired bit here. Depending on the addressing of the
selected memory area in the PLC (8-bit limits) a selection can be made here
from bit 0 ...bit 7.
Selection made
• Process variable
This text field is not editable. It provides information on the selected process
variable in STEP 7 notation.
Value range or scaling
Minimum and Maximum determine the range of the process variables. Maximum and Minimum are not editable for the variable type floating-point value. In
all other cases, a linear scaling is carried out if the default values in Minimum or
Maximum are changed.
Setting up the interface
The link between Programming Device (PG) or PC and the SIMATIC S7, is defined in
the three selection windows (Combo-Box) MPI Address, Slot Number and Rack
Number. These interface parameters are valid for only one SIMATIC S7 module in the
ServiceLab.
• MPI/PROFIBUS Address
Select here the MPI- or PROFIBUS-Address of the PLC, which you want to access. The MPI-address 0 is used or the Programming Device.
• Slot Number
Select here the number of the slot, where the CPU is plugged in the rack. Usually
it is not necessary to change the default number. If you use a S7-400 for example,
you have the change the default settings from: Slot Number: 2 to Slot Number:
3.
• Rack Number
3-5
ServiceLab
Analog Input Module (optional)
Select here the number of the rack you want to access. In this moment the settings
will be ignored. You may not change the default
settings. This selection window will be used in
future developments in the area for SIMATIC.
2.
Analog Input Module (optional)
Use this module to connect ServiceLab and the analog input
channels of the installed data acquisition hardware.
Input and Output Characteristics
Number of Inputs:
Input Block Size:
Number of Outputs:
Output Block Size:
Max. Number of Modules:
----up to 16 (depending on the data acquisition
hardware)
same as global block size
32
ServiceLab supports up to 512 analog input channels in the full version and up to
32 in the limited version.
The module uses the data acquisition driver to access the hardware. Data will be
acquired by the data acquisition device and sent to the module. If the selected
driver supports more than one hardware component, a Hardware Selection window displays the available hardware. Select the hardware from the list to assign
it to the new module.
Each module can acquire up to 16 analog signals that are provided to the worksheet through separate signal channels. The number of channels that can be activated is limited by the hardware specifications.
Use the channel bar to activate as many channels as are available. However, you
can only select one of them at a time to define the input range and to enter a channel information string. To configure the number of channels, see page 2-2.
Each activated analog input channel provides one output, through which the
measured values are sent to the other modules in the worksheet.
3-6
Kommentar: Full, Sampler, Limited editions?
Kommentar: Full, Sampler, Limited editions?
ServiceLab
Chapter 3: Input/Output Module Group
2.1. Module Configuration
Click this icon (or choose the Experiment Setup command from the
Experiment menu) to open the Experiment Setup dialog box, to define
global sampling rate, block size, and other important data acquisition
parameters that are explained in Chapter 4 of the User Guide.
Click this icon to open the Hardware Setup dialog box. The settings
are specific to the data acquisition device you specified when installing your ServiceLab version. The settings are explained in Chapter 4
of the User Guide. Please see the Hardware Manual or Online Hardware Help for specific information on your hardware.
2.2. Channel Setup
If your hardware provides additional channel dependent features, these can be
specified in a separate dialog box that opens when you click on the Channel
Setup button. You will find help on these settings when you choose Hardware
from the Help menu. The Channel Setup button remains gray and cannot be activated if the hardware driver does not provide such settings.
Use the Input Channel Selection Bar (see page 2-7) to specify which of the input
channels on your hardware are to be active during an experiment. You can activate as many channels as are available.
Each activated input channel increases the number of module outputs so that each
channel can send its data to another module through a separate line. You can individually select each channel to define a channel information string, and its input range.
2.3. Scaling
Use the scaling function ( Use scaling ) to specify channel-specific linear scaling
with two points of the input signal. The Scaling button opens a dialog box to activate scaling and specify the settings.
The data acquisition hardware input is converted to the sensor range using these
settings. You can define a unit for the Sensor, which is then transferred to subsequent modules in the worksheet.
To define the scaling function:
Select Use Scaling.
Select the desired Hardware and Sensor Units.
Insert the known points of comparison in the Assignment area.
Close the dialog box by clicking the OK button.
For example, you want to convert the received values to the input values of a
pre-amplifier connected before the acquisition board. You know that the 0 V
value on data acquisition board corresponds to 0 mV at the pre-amplifier. Also,
3-7
Analog Input Module (optional)
ServiceLab
you know that 10 V corresponds to 1 mV. Choose the dialog box settings as follows:
Activate Use scaling.
Units: Hardware : V
Sensor: mV
Assignment: First line Hardware value: 0 , Sensor value: 0
Second line Hardware value: 10, Sensor value : 10
2.4. Channel Information
For each channel, enter additional information of up to 100 alphanumeric characters into the channel information field. For example, you might wish to describe
the function of each channel.
The Channel Information will be saved with the worksheet configuration. There
is no default setting for this field.
2.5. Input Range
Many data acquisition devices provide selectable input ranges and an integrated
programmable gain.
The selectable Input Range usually defines the input range of all the activated channels of the device. If the hardware supports this option, the
range can be selected in the Hardware Setup dialog box.
If the data acquisition hardware installed in your system is equipped with
a programmable gain, you can select the input range for each channel in
the Analog Input module.
The Input Range entered in the ServiceLab dialog box must correspond exactly to the hardware configuration to ensure correct data processing by ServiceLab. For information on jumper and DIP switch settings on your hardware please choose Hardware from the Help menu.
If your data acquisition hardware does not provide amplification, this box displays the range selected in the Hardware Setup dialog box. This value cannot be
changed.
For further information on your hardware, choose Hardware from the Help
menu, or refer to your Hardware Manual.
3-8
ServiceLab
3.
Chapter 3: Input/Output Module Group
Multispeed Analog Input Module Some drivers (Measurement Computing, ADLink etc.) can access the Analog Input channels using the Analog Input Multi-Speed module. If the installed driver
allows this function, the Hardware selection dialog shows the available hardware. Otherwise, you will receive an error message that this module is not supported by the installed driver. If you installed one of these drivers with your ServiceLab version you can access the hardware help file by clicking on the Help
button in the Multi-Speed Analog Input module properties dialog box.
This new set of drivers allows you to specify an individual sampling rate and
block size for each of the installed DAQ boards. The DAQ Analog Inputs will
work independently in one experiment worksheet.
If you are not using one of the Multispeed drivers, you cannot create the Analog
Input Multi-Speed module.
4.
Analog Output Module (optional)
Use this module to define analog output channels that are available on the installed data acquisition hardware.
This module can take up to 16 signal lines and connect them to the analog output
channels of the installed hardware. The number of channels that can be activated
is limited by the hardware specifications. If the selected driver supports more
than one hardware component, a Hardware Selection window opens with a list
of available hardware. Select the hardware from the list to assign it to the new
module.
This module is useful if your application requires experiment control or the output of analog data for stimulation.
Input and Output Characteristics
Number of Inputs:
Input Block Size:
Number of Outputs:
Output Block Size:
Max. Number of Modules:
up to 16 (depending on the data acquisition
hardware)
same as global block size
----2
This module represents analog output channels if they are available on the installed data acquisition hardware. ServiceLab supports up to 32 analog output
channels in the full version and up to 16 in the basic version.
Use the Output Channel Selection Bar (see page 2-7) to specify which of the
output channels on your hardware are to be active during an experiment. You can
activate as many channels as are available on the hardware.
3-9
ServiceLab
Digital Input Module (optional)
Each activated output channel increases the number of module inputs, so that
each channel can receive data from other modules through a separate line.
It is possible to reset each output channel to a defined value when the measurement stops. The value is defined in the input field at the bottom of the box.
Click on this icon (or choose the Experiment Setup command from
the Experiment menu) to define the Output Mode and other output
parameters. For details, see Chapter 4 of the User Guide.
5.
Digital Input Module (optional)
Use this module to acquire digital input signals with the corresponding digital I/O of the installed data acquisition hardware.
Up to 16 digital signals can be acquired and provided to the worksheet through
separate signal channels. The number of channels that can be activated is limited
by the hardware specifications.
If the selected driver supports more than one hardware component, a Hardware
Selection window opens, displaying the available hardware. Select the hardware
from the list to assign it to the new module.
Input and Output Characteristics
Number of Inputs:
Input Block Size:
Number of Outputs:
Output Block Size:
Max. Number of Modules:
----up to 16 (depending on the data acquisition
hardware)
any
32
ServiceLab supports up to 512 digital input channels in its full version and up to
16 in the basic version. This module uses the data acquisition driver to access
the hardware. Data is acquired by the data acquisition device and sent to the
module.
The digital signals are usually acquired at the global sampling rate. Its values in
ServiceLab are set according to the TTL definition (0 for low and 5 for high).
Some drivers allow digital and counter input only in asynchronous mode. This is
due to the transfer method used. With those drivers typically one digital or
counter value is read for one complete block of analog data. The digital and
counter input rate thus differs by a factor equal to the global block size. The timing of digital and counter input is not exactly equidistant, which may cause jitter
errors.
The Separate Handling of Digital Bits Option switches between single processing
of the digital bits and group processing.
3-10
ServiceLab
Chapter 3: Input/Output Module Group
If the option is active, each active bit is processed as a separate channel
using TTL levels where 5.0 represents the set bit and 0.0 represents bit
reset. The module has one channel for each activated bit.
If the option is disabled, all activated bits are simultaneously processed
as a digital word. In this mode, the module has only one channel for all
bits, independent of the number of activated bits.
For each activated digital input channel the module provides one output, through
which the measured values will be sent to other modules in the worksheet.
Module Configuration
Double-click on the module symbol in the worksheet to open the Module Configuration dialog box.
Use the Input Channel Selection Bar (see page 2-7) to specify which of the input
channels on your hardware are to be active during an experiment. You can activate as many channels as are available on the hardware.
Each activated input channel increases the number of module outputs so that each
channel can send its data to another module through a separate line, if you have
chosen the Separate Handling of Digital Bits option. Otherwise the module has
one output.
Use the Bit Operations module (see page 5-13) to operate on the digital word,
to separate out one or more bits as individual channels, or to combine individual channels together as a digital word. You can also use the Status Lamp
module (see page 9-36) to display the Digital word as individual bits.
You can select each channel to define specific channel settings.
Click this symbol (or choose the Experiment Setup command from
the Experiment menu) to open the Experiment Setup dialog box,
where you can define the global sampling rate, the block size, and
other important data acquisition parameters. For details, see
Chapter 4 of the User Guide.
6.
Digital Output Module (optional)
Use this module to set up Digital I/O on the installed data acquisition hardware.
This module can take up to 16 signal lines and connect them to the digital output
channels of the installed hardware. The number of channels that can be activated
is limited by the hardware specifications.
If the selected driver supports more than one hardware component, a Hardware
Selection window opens, displaying the available hardware. Select the hardware
from the list to assign it to the new module.
3-11
Counter Input Module (optional)
ServiceLab
This module is useful if your application requires experiment control or the output of analog data for stimulation.
Input and Output Characteristics
Number of Inputs:
up to 16 (depending on the data acquisition
hardware)
Input Block Size:
same as global block size
Number of Outputs:
--Output Block Size:
--Max. Number of Modules:
32
Use the Output Channel Selection Bar (see page 2-7) to specify which of the
output channels on your hardware are to be active during an experiment. You can
activate as many channels as are available on the hardware.
The Separate Handling of Digital Bits Option switches between single processing
of the digital bits and group processing.
If the option is active, each active bit is processed as a separate channel
using TTL levels where 5.0 represents the set bit and 0.0 represents bit
reset. The module has one channel for each activated bit.
If the option is disabled, all activated bits are simultaneously processed
as a digital word. In this mode, the module has only one channel for all
bits, independent of the number of activated bits.
Each activated output channel increases the number of module inputs so that each
channel can receive data from other modules through a separate line.
Use the Bit Operations module (see page 5-13) to operate on the digital word,
to separate out one or more bits as individual channels, or to combine individual channels together as a digital word. You can also use the Status Lamp
module (see page 9-36) to display the Digital word as individual bits.
It is possible to reset each output channel to a defined level (high or low) when
the measurement stops. The value is declared in the input field at the bottom of
the box.
Click this Function Bar icon (or choose the Experiment Setup
command from the Ex periment menu) to define the Output Mode ,
and other important output parameters. For details, see Chapter 4
of the User Guide.
7.
Counter Input Module (optional)
Use this module to acquire and count impulses or frequencies. It
is available if your data acquisition hardware supports counter
measurement.
3-12
ServiceLab
Chapter 3: Input/Output Module Group
Up to 16 counter signals can be acquired and provided to the worksheet through
separate signal channels. The number of channels that can be activated is limited
by the hardware specifications.
If the selected driver supports more than one hardware component, a Hardware
Selection window opens, displaying the available hardware. Select the hardware
from the list to assign it to the new module.
This module is not included in the basic version.
Input and Output Characteristics
Number of Inputs:
Input Block Size:
Number of Outputs:
Output Block Size:
Max. Number of Modules:
----up to 16 (depending on the data acquisition
hardware)
same as global block size
2 (depending on the data acquisition hardware)
ServiceLab supports up to 32 counter input channels.
The module uses the data acquisition driver to access the hardware. Data will be
acquired by the data acquisition device and sent to the module.
Each counter channel will acquire data at the global sampling rate.
The resolution of the timer is 16 bit, with an upper limit of 65535. In ServiceLab
these values are treated as float values (range up to 10^38).
Each activated counter channel will usually acquire data at the Global Sampling
Rate.
Some drivers allow Digital and Counter Input only in asynchronous mode. This is
due to the transfer method used. With those drivers typically one digital or
counter value is read for one complete block of analog data. The digital and
counter input rate thus differs by a factor equal to the global block size. Also, the
timing of digital and counter input is not exactly equidistant, which may cause jitter errors.
For each activated counter input channel, the module provides one output,
through which the measured values will then be sent to the other modules in the
worksheet.
Module Configuration
Double-click the module symbol on the worksheet to open the Module Configuration dialog box.
Use the Input Channel Selection Bar (see page 2-7) to specify which of the
counter channels on your hardware are to be active during an experiment. You
can activate as many channels as are available on the hardware.
Each activated counter channel increases the number of module outputs, so that
each channel can send its data to another module through a separate line.
3-13
Counter Input Module (optional)
ServiceLab
ServiceLab supports up to 32 counter input channels. You can select each of
these channels to define further specific channel settings.
ServiceLab provides three different counter modes:
Single : Each acquired sample represents the counter difference from the
preceding value, the number of pulses since the last reading. If a counter
is read once per second, the values will directly represent the pulse frequency in Hertz.
Running: The values are read as in the Single mode, but the driver directly calculates the sum of all the acquired samples. Since ServiceLab
uses float values for the result of summation, the accuracy will be about 6
to 7 digits and the range will be up to 1038.
Frequency: The values are read as in the Single mode, and the driver then
directly converts them into frequency values.
You can switch between modes while the measurement is running. Since the
driver calculates the values, the active Running Mode always represents the
number of pulses since the beginning of the measurement, even if the mode has
been changed.
7.1. Hints for frequency measurement
In frequency measurement, the first calculated value may be too small, nearly
half the real frequency
The reason for this behavior is that some data acquisition cards get the measured
data in the middle of the sampling intervals not at the end (i.e. a sampling rate
with 0.1 Hz starts receiving the data at 5, 15, 25, ... seconds after the start of the
measurement. Thus, the counter will get only half as many pulses at the first
measured value in comparison with the following measured values. The result is
an incorrect first measured value.
Doubling the first value in the driver algorithm is not recommended because the
running pulse count would be distorted. Doubling only in frequency mode in the
ServiceLab module is also not possible, because this effect does not happen with
all data acquisition hardware. Also doubling would cause an inconsistency between the frequency and single measurement mode.
To fix this problem, you can use the Separate Module in the ServiceLab flowchart to skip the first sample in the data stream.
3-14
ServiceLab
8.
Chapter 3: Input/Output Module Group
Frequency Output Module (optional)
Use this module to send frequency data to the Output channels of
a connected data acquisition hardware device (plug-in board or
other external device).
It can take up to 16 digital signals from the worksheet and connect them to the
corresponding hardware output. If the selected driver supports more than one
hardware component, a Hardware Selection window opens, displaying the available hardware. Select the hardware from the list to assign it to the new module.
The counters of the board can be activated using the Channel Selection Bar.
Input and Output Characteristics
Number of Inputs:
Input Block Size:
Number of Outputs:
Output Block Size:
Max. Number of Modules:
up to 16
same as global block size
----2 (depending on the data acquisition hardware)
This module can be useful when you want to generate frequencies based on values at an input channel. You can use these frequency values for stimulation or
control of external processes.
The parameters necessary to define the Output Mode can be set in the Experiment Setup dialog box of the Experiment menu.
Depending on the data acquisition hardware used, one or more of the following
options are available for Operation Mode :
Frequency Modulated Square Wave: A square signal is output with a
pulse/pause ratio of about 1:1. The module input signal is interpreted as a
frequency value in Hertz. The rectangle output is adapted to that frequency. If the installed hardware is not able to create this frequency exactly, the module will automatically choose the next possible frequency.
Frequency Modulated Impulse : This function is similar to the frequency
modulated square wave, but without the pulse/pause ratio of 1:1. The
module generates an impulse of a minimum width that depends on the
hardware clock.
Pulse Modulation Duration: A fixed frequency is output with a variable
pulse/pause ratio. Set the frequency in the Support Frequency field. If the
installed hardware is not able to exactly create the requested frequency,
the module will automatically choose the next possible frequency. The
module input signal is interpreted as a pulse width in the range of 0 to 100
percent. If the installed hardware cannot exactly output the needed pulse
width, the module automatically will choose the next possible pulse
width.
3-15
ServiceLab
DDE Input Module
This module works asynchronously. Synchronous mode will be implemented
in a future version.
It is possible to reset each output channel to a defined value when the measurement stops. The value is declared in the field at the bottom of the dialog
box.
9.
DDE Input Module
Use this module to receive data from other Windows applications,
such as Microsoft Excel. It uses the standard Windows DDE interface (Dynamic Data Exchange).
Input and Output Characteristics
Number of Inputs:
Input Block Size:
Number of Outputs:
Output Block Size:
Max. Number of Modules:
----up to 16
1 or same as global block size
up to 16 DDE Input and DDE Output modules
How it works
The DDE Input module can receive data from other Windows applications for up
to 16 different channels.
ServiceLab supports the DDE System Topic. Other programs that are able
to browse DDE Servers to show Service/Topic Combinations will recognize topics that are enabled by ServiceLab. ServiceLab works as a
DDE Server or as a DDE Client with a Hot Link to the DDE Server.
If ServiceLab acts as the Server, the DDE Connection has to be defined by the Sender. First start ServiceLab, and then start the client
program.
If ServiceLab acts as a DDE client, the receiving program has to be
started first and then the ServiceLab worksheet can be started. ServiceLab maintains the DDE link, initiates all data transfers and finishes the communication at the end.
Data is expected in ASCII format.
Please note that standard DDE operations are always comparatively slow (at
a rate of less than 100 Hertz), because all the data is transferred as ASCII
strings and must be formatted before use.
Establishing DDE communication
The DDE connection topic specifies whether ServiceLab acts as server or client.
ServiceLab accepts each appropriate DDE connection.
3-16
ServiceLab
Chapter 3: Input/Output Module Group
If ServiceLab acts as server, the DDE connection is defined by the
sender. The following DDE parameters must be defined in the sending
task:
Application: ServiceLab
Topic:
DdeData
Item:
the Module Name of the DDE Input module.
When switching to the Server mode all actual entries that are used to communicate with the DDE Client program (the Application, Topic and Item) are displayed. The Browse button opens a dialog box for browsing all DDE Servers
that support the System Topic. The chosen entries are imported into the corresponding entry fields when you click the OK button. If the program that you use to
communicate with ServiceLab is able to list all existing DDE Servers, you may
then choose ServiceLab from this list.
If ServiceLab acts as a client, the communication must be set up in ServiceLab in the same way as in the DDE Output module. DDE Connection
specifies the receiver of the transferred data. Up to 80 characters can be
entered in the Application, T opic and Item boxes.
In the One item for... area you can select whether the chosen item is valid
for all channels or only for the selected channel. If the setting is Each
Channel you can use one opened DDE connection to send up to 16 different Items for the chosen Topic. This will save system resources.
Use Type of items to select fixed or ServiceLab generated items (e.g. to
fill a row, column or matrices in EXCEL, step by step). Because the item
generation always depends on the number of the read or written data
block, this option is only available with a Cold Link.
If the Generated option is selected, use the Item... button to define the
parts of the item that should be generated for DDE transfer (during the
measurement) depending on the received number of data block.
The Item is composed of up to 5 single add-on components (3 fixed text
parts and two counters) that are used by the received number of data
block. For each counter you can preset a starting value, used at the beginning of measurement, to define after what number of received blocks of
data ( Increment after) the counter increases with a specified value (Increment by). You can also reset a counter when reaching a specified
value ( Restart at...). Restart will automatically happen on reaching the
value defined as the starting value, but it will also be initialized at each
value defined in Restart at....
There is also a testing mode available: With each parameter change, the
calculated item of the set number of block is displayed. The number of
blocks may be changed at any time. Use the “+” button to increase the
block number by 1. This allows you to check the generated item series in
a very simple way. You can also use global variables for all numerical
parameters in this dialog box.
3-17
DDE Input Module
ServiceLab
Data transfer
The DDE input module receives one sample in each DDE block for each defined
channel. The DDE format used is CF_TEXT; space characters must separate the
channels and the block should end with a CR/LF character.
If a DDE block contains less than the expected number of channels, the values for
all remaining channels are set to 0.
The synchronization specifies the mode for the DDE input module:
One sample per DDE transfer specifies that the DDE input module will
generate one ServiceLab block of size 1 for each DDE block received.
Use global settings specifies that the DDE input module will generate a
stream of data corresponding to the globally defined sampling rate and
block size. The last DDE block received determines the value of the signal. ServiceLab continuously polls the DDE buffer. If data is sent faster
than ServiceLab polls, intermediate values are ignored. If data is sent
slower, some values will be repeated.
Master DDE sync tells ServiceLab to try to synchronize the DDE communication by sending an ACKNOWLEDGE message to the sending program
after the received block has been processed. Otherwise, a BUSY message
is sent. Not all programs react to these messages.
Data format
Decimal format specifies whether a dot or a comma is used as a decimal delim-
iter.
Net DDE
Programs that are able to use DDE to exchange data running on one machine are
also able to exchange data with programs on other machines using an available
network.
Structure of data exchange
The DDE Input module receives one value per channel for each incoming
DDE Block of ASCII data (format CF_TEXT). A white space character (blank,
semicolon, or tab) must separate channel values. The end of the block must be
a CR/LF character.
When the received number of channels is less than defined in DDE Input module,
the values of missing channels will be set to zero. If more channels are received,
that data will be ignored.
Synchronization defines how the DDE Input module works:
The One Block per DDE Transfer mode creates one ServiceLab data
block of size 1 per received data block. You can’t process this data with
other values.
In Use Global Settings mode, ServiceLab will create values with the defined global Sample Rate and Block Size. The last received DDE block
3-18
ServiceLab
Chapter 3: Input/Output Module Group
defines the contents of all data channels that are connected directly to
other modules.
With Master of Synchronization, ServiceLab sends an ACKNOWLEDGE
signal when the incoming block is finished. Otherwise it sends a BUSY
signal. (Note: Most other programs do not support the synchronization
protocol.)
When using Global Settings, there will be no different values in single channels in data blocks created by ServiceLab. If incoming DDE data is “too
fast,” some data will be lost, because the ServiceLab Dispatcher distributes
processor time equally to running modules. If more than one DDE Data block
comes in (its contents will be processed directly by the call back function)
between two instances of the DDE Input module, all data blocks except the
last received block will be lost. That will happen if the relationship between
Block size and sample rate is unfavorable (i.e., the distance between two
data transfers is smaller than the ratio Block s ize/s ample rate).
The DDE module always generates constant blocks of data. The sampling
rate and block length in ServiceLab should be set according to the expected
rate of DDE data.
10.
DDE Output Module
This module can be used to transfer acquired or calculated data
to any other Windows application supporting the DDE protocol
(Dynamic Data Exchange).
This module can take data from up to 16 signal channels and transfer them to any
other Windows application.
Input and Output Characteristics
Number of Inputs:
Input Block Size:
Number of Outputs:
Output Block Size:
Max. Number of Modules:
up to 16
any, but the same for all the activated channels
same as number of inputs (if option is activated)
same as input block size (if option is activated)
up to 16 DDE Input and DDE Output modules total
How it works
The incoming samples are transferred to the other Windows application using the
DDE protocol.
If ServiceLab acts as the Server, the DDE Connection has to be defined
by the Sender. First, start ServiceLab, and then start the client program.
ServiceLab supports the DDE System Topic. Other programs that are able
to browse DDE Servers to show Service/Topic Combinations will rec-
3-19
DDE Output Module
ServiceLab
ognize topics that are enabled by ServiceLab. ServiceLab works as a
DDE Server or as a DDE Client with a Hot Link to the DDE Server.
If ServiceLab acts as the Server, the DDE Connection has to be defined by the Sender. First start ServiceLab, and then start the client
program.
If ServiceLab acts as a DDE client, the receiving program has to be
started first and then the ServiceLab worksheet can be started. ServiceLab maintains the DDE link, initiates all data transfers and finishes the communication at the end.
In the area One item for... you can select whether the chosen item is valid
for all channels or only for the selected channel. If the setting is Each
Channel you can, with only one opened DDE connection, send up to 16
different Items for the chosen Topic. This will save system resources.
In T ype of items you can select between Fixed and ServiceLab Generated Items (e.g. to fill a row, column or matrices in EXCEL step by step).
Because the generating always depends on the number of the read or written data block, this option is only available with a Cold Link.
If the Generated option is selected, you can call up a further dialog box,
using the button Item.... In this dialog you can define the parts of the Item,
which should be generated for DDE transfer (during the measurement)
depending on the received number of data block.
The Item is composed of up to 5 single add-on components (3 fixed parts
of text and two counters), which are deduced by the received number of
data block. For each counter you can define a starting value, used at the beginning of measurement, to define after what number of received blocks of
data ( Increment after) the counter increases with a specified value (Increment by ). You can also reset the counter when it reaches the Restart
at... value. A Restart will automatically happen when reaching the value
defined as starting value, but it will also be initialized at each value defined in Restart at....
There is also a testing mode available: With each change of a parameter
the calculated item of the set block number is displayed. The number of
block may be changed at any time. Use the “+” button to increase the
block number to check the generated series of item in a very simple way.
You can also use Global Variables for all numerical parameters of this
dialog box.
All input channels of the DDE Output module must be of the same type,
the same sampling rate and the same block size. If this condition is not fulfilled, ServiceLab displays an error message and the experiment is stopped. The same conditions apply as for the Write Data module in ASCII
format.
ServiceLab will not start to send data until a complete block of data is
available at the module input.
3-20
ServiceLab
Chapter 3: Input/Output Module Group
Data is sent in ASCII format. Details are described below.
The Copy Inputs to Outputs option provides the module with one output
for each activated input. Incoming data is sent unchanged to the output.
Please note that standard DDE operations are always comparatively slow (at
a rate of less than 100 Hertz), because all the data is transferred as ASCII
strings and must be formatted first.
Net DDE
Programs that are able to use DDE to exchange data running on one machine are
also able to exchange data with programs on other machines using an available
network (see general hints: DDE).
Definition of the Communication Channel
The DDE Connection entries specify where to send the data. You must specify
the Application name, the Topic and the Item. For details of which topics are provided by an application, please check the corresponding documentation.
Data Transfer
Decimal Format defines the format of the data sent by the DDE Output module.
The Decimal Delimiter and Number of Decimals can be defined.
ServiceLab sends data in the DDE format CF_ TEXT, which means all samples
are converted into a block of strings. The maximum size of this string is 65,500
characters. This string contains all data of all input channels for one block of
data (on each channel) called the data matrix.
If the module has more than one input channel, data can be ordered by
Row or by Column.
If Column is chosen, data is ordered in a way that the samples of one
channel form a column in the data matrix.
The corresponding samples of the connected channels form one row
in the data matrix. For a DDE Output module with 2 channels and a
block size of 3, ServiceLab will generate a data matrix of 2 columns
by 3 rows.
An example worksheet for a column-ordered DDE connection with
EXCEL is contained in the ServiceLab directory.
If Row is chosen, data is ordered in a way that the samples of one
channel form one row in the data matrix.
Defining the order by Row or Column does not necessarily mean that data
is arranged in Rows or Columns in Excel. Excel needs specific delimiters
in order to arrange data in the desired way.
Example:
Two channels of data with a block size of 3 are sent by DDE. The Samples of the first channel are named A1, A2, A3 and those of the second
3-21
ServiceLab
DDE Output Module
channel are B1, B2, and B3. Ordering by Row means that the DDE block
contains the values in the sequence A1, A2, A3, B1, B2, B3. Ordering by
Column results in a sequence A1, B1, A2, B2, A3, and B3. All samples
are separated by the specified separator. The optional Final Character is
inserted after A3 and B3 in the first case and after B1, B2, and B3 in the
second case.
Each row or column can be ended with a CR/LF character.
In addition to the data, a Time Channel in Microsoft standard format can
be sent. Depending on the order, the Time Channel forms the first row or
first column of the complete block. You can choose between Time of Day
and elapsed Time since Start of the experiment.
Data Format
Separators
Delimiters separate the samples in one string. You can choose between
Blank, Tab, Semicolon or CR/LF. These separators are only used within
one string and are not appended to the end of the string.
There is an additional option for appending a CR/LF character at the end
of each string.
Decimal Format
Decimal Format defines the Decimal Delimiter and the Number of Decimals . The actual number of characters depends on the value of the sam-
ples and may be different each time. The default decimal delimiter is a
comma.
ASCII Format for DDE Output modules
Data samples are sent in the same format as an ASCII file.
Several options allow you to modify the standard ASCII format:
Sort: Sorts data as columns or in line.
Delimiter: Select a blank, TAB, CR/LF or a semicolon as the delimiter
between the channels in each line. You can select that each line will end
with a CR/LF (CHR13/CHR10) character.
Decimal Character: Select a dot or a comma as the decimal character.
Time Column: This option adds a column with time information for each
sample.
Time Format: If Time Channel is activated, select the time channel format
here. The following formats are available:
Example
Elapsed T ime
[hh:mm:ss]
Time
3-22
Elapsed time from start of
experiment
Actual time
00:45:34.20
07:30:30.4
ServiceLab
Chapter 3: Input/Output Module Group
[hh:mm:ss]
Decimals: This parameter determines the number of decimals for the numerical ASCII format.
11.
RS232 Input Module
Use this module to scan data coming from devices connected to
the PC’s serial ports. The module filters the needed values of the
arriving data strings based on the module settings and sends them
to the module outputs.
This module can read data from up to 16 different channels and transfer them to
other modules using its signal channels.
It also can read ASCII strings and write them into a Global String. You can mix
value channels and text string channels. Double-click on this module symbol in
the worksheet to open the module configuration dialog box, where you can enter
the number of input channels available on your hardware using the Channel Number Selection Bar. Each activated Analog Input channel increases the
number of module outputs, so that each channel can send its data to another module through a separate line.
Input and Output Characteristics
Number of Inputs:
Input Block Size:
Number of Outputs:
Output Block Size:
Max. Number of Modules:
----up to 16, and, with Slave modules, up to 256
1 or global block size
up to 8, if the serial ports are available
One RS232 Input module is able to acquire data in up to 16 channels from any
serial interface of the PC that is recognized by Windows. (Up to 32 interfaces
with the 32-bit version of ServiceLab; up to 10 interfaces with the 16-bit version
using Windows 95. All blocks of data are provided with block size and timing
information that is necessary to process data in ServiceLab.
When inserting a serial module into the flowchart you can select whether a module is created as a default module (with the usual default settings for all parameters) or as a predefined module with parameters configured for a specific RS232
device. Predefined modules can be selected from the list box. They are created
using the menu command Experiment:-> Serial Devices (see Book 1: User Guide:
Chapter 4, Section 1.4.11 Serial Devices).
If there is already one serial module in the worksheet, you can add additional
Slave modules to the Master module. Each Slave module expands the Master
module by up to 16 channels. If you add a new serial module to the worksheet,
you must define whether the module will be a new Master module (linked to an3-23
RS232 Input Module
ServiceLab
other serial interface) or will be a Slave module of an existing Master module. If
there are several Master modules you can choose between them. The Slave module settings are limited to Get Data and Data Format.
If a Master module is deleted, all assigned Slave modules lose connection.
You can no longer use these modules in the worksheet.
The RS232l Input module filters data values from the arriving data strings based
on the module settings and sends them to the module outputs. The resulting signal
sent to ServiceLab consists of a number of blocks with different time intervals,
with only one data point in each block, and with different starting times. As an
alternative, the data can be stored in a separate buffer and can be sent to ServiceLab with the global acquisition rate and block size. This approach allows an
easy synchronization of serial and other data.
ServiceLab holds the COM port open during the time a worksheet with a RS232
module is loaded. When the experiment is started, the serial interface will be
closed and re-opened to reset the port parameters and to use the actual module
settings. Additionally, this clears the Windows serial buffer, so any data from a
previous experiment is lost.
This approach allows the user to prepare worksheets on one computer that may
have different serial port settings than the target computer that runs the application.
To check the settings without starting the measurement, use the Send Reset button. This causes the serial port to be closed and re-opened. The defined reset
string is also sent.
If the RS232 Input and Output modules use the same serial interface and the input module uses a data request string, receiving and sending are completely
synchronized, so reading and writing of data via RS232 happens alternately.
11.1. Data Request Command
If the external device needs a data request command, the command string can be
defined in this control box. Each channel can be defined separately.
The string is sent to the external device each time ServiceLab requests data.
When you use a device that needs only one string to request a channel list, only
define a string for the first channel and leave the others empty.
When there is no request needed (Options Setting ) the area is grayed out.
You can use any character in the string except zero (value of byte 0). Use control
codes to insert special characters that aren’t directly available via the keyboard.
You don’t need Space characters to separate characters. If a space is used in the
string, it will be interpreted and sent as a character.
3-24
ServiceLab
Chapter 3: Input/Output Module Group
String format for Reset, Start, Stop commands and Data Request
The strings defined in the Options menu are necessary to initialize (reset) the
connected external device.
The string can apply to more than one line. This makes the dialog box easier to
read, although the Return in the dialog box doesn’t mean to send a control
character. The string can be up to 300 characters long.
A string may contain control characters:
Hexadecimal: You can use hexadecimal values using x followed by two
characters to describe a character using a hexadecimal value (Example:
\x0d = 13 decimal = Return).
Octal: Octal values are marked with 0 (zero) followed by three numerical
characters between 0 and 7 (Example: \0015 = 13 decimal = Return).
Predefined: You can use defined control characters preceded by a backslash (\):
r
Return
t
Tab (HT)
a
Signal (BEL)
n
Line Feed (LF)
b
Backspace (BS)
f
Formfeed (FF)
v
Vertical Tab (VT)
You can use one or more pauses between strings. Insert ´\p´ at the desired place
followed by a time in milliseconds. Because the system time interval is 55 ms,
the inserted time will be rounded to the next multiple of this value. If no time is
defined, the default time is one second.
The section before first pause will be sent right away. After the defined pause,
the next section is sent (up to the next pause or to the end of the string). While
sending a string or waiting for the next section of the string, ServiceLab won’t
start further actions. The measurement itself won’t be influenced because these
strings are only sent before starting or ending the measurement.
Example of a correct Reset string:
\x1b@\r
\p2000
RS\r
Sends the ESCAPE Character followed by the
ASCII character @ followed by RETURN.
Pause for about 2 seconds followed by the text
string ‘RS’ followed by RETURN
Data Format
The serial interface can only receive data in ASCII format. See page 3-33 for details.
3-25
RS232 Input Module
ServiceLab
11.2. Options
Configuration commands
Reset Command: This string is sent to the external device each time the
worksheet is loaded. It can also be sent by pressing the Send Reset button in the main dialog box. This string is not sent automatically when the
dialog box is closed.
Start Command: This string is sent to the external device each time the
experiment is started. It may be used to configure the external device for
each individual experiment.
Stop Command: This string is sent each time the measurement stops.
Data Request necessary
If Yes , ServiceLab will send the data request string to the external device
in intervals defined by the Sample Interval.
If No, the external device has to send its data without any request and the
user cannot define the sampling interval.
Sample Interval: This option defines the sampling rate independently of
the global sampling rate in ServiceLab. Since it uses the PC clock, its
resolution is limited to multiples of 55 ms.
The sampling interval is defined as an interval per channel. If the defined
sampling interval is too small for ServiceLab to process the complete
worksheet, the sampling rate is automatically decreased. Useful values
for the sampling interval are 0.5 seconds or larger.
Resend Request if Time-out
When this option is enabled, the last data request is repeated if the required samples are not received after twice the sampling interval. The timing of the received data is corrected according to the real acquisition time.
Data Synchronization
In most cases, data sent via RS232 isn’t very fast or absolutely equidistant. ServiceLab can synchronize the acquisition process. Several methods of synchronization have been implemented. These settings are defined in the Options dialog
box.
The following settings are available:
One Sample per
For the Data Point and Line Of Data modes, a ServiceLab block of size 1
is generated for each received data block. In the first case, this block is
released for each channel individually. In the second case, all samples of
the different channels are collected and released together, and the timing
3-26
ServiceLab
Chapter 3: Input/Output Module Group
information of all channels is the same, whereas in the first case each
channel may have its independent time stamp.
For the Global Sample mode, data is generated according to the global
settings for block size and acquisition rate. The value received from the
serial interface is used to generate the signal for ServiceLab for each
channel. This mode allows to you synchronize slow serial inputs directly
with faster inputs from data acquisition boards
Header Size
This option allows you to skip a defined amount of data at the beginning of each
measurement.
It is better if the external device first sends an identification or ready string that
without data after a Reset or start command.
11.3. Additional Data
You can define format strings for additional data to be sent to the Serial Interface. This data must be unambiguously recognizable, i.e., marked with special
signs or strings. The data stream is always checked for these marks.
These options are available:
Start time: Time information will be added to the real elapsed time and
appended as new time information for each sample.
Measurement time: Time information will be appended as time information with each sample.
Sampling rate: Based on sampling rate, new time information is calculated and will be appended as time information.
Block size: This option calculates the block size at the defined interface.
Samples are released to the next ServiceLab modules once the defined
number of samples is reached.
To mark the values, the same characters are available as used in Data
format. Brackets [ ] are necessary to identify the chosen value.
11.4. COM Port
This dialog box defines the parameters for the COM port used by ServiceLab.
The default settings are COM2, 9600 baud, 8 data bits, 2 stop bits and a buffer
size of 4 K.
Hardware Settings
Port: Specify the communications port to be used. Valid choices are
COM1 to COM32.
Baud rate: Define the speed of the communications device from 300 Baud
to 57600 Baud.
Data bits: Define the number of data bits (5 to 8).
3-27
RS232 Input Module
ServiceLab
Stop bits: Define the number of stop bits (1, 1.5 or 2)
Parity: Defines whether an additional parity bit per character is used.
Choices are even, odd or no parity.
Handshake: This entry defines whether data exchange is controlled by
protocol and which type it is.
None means there is no control. The hardware control lines DTR (Data
Terminal Ready) and RTS (Request To Send) are disabled.
RTS/CTS (Clear to Send) uses the corresponding control lines of the Serial Interface for hardware handshake.
XON/XOFF uses control characters (17 and 19) to control the data
stream. DTR and RTS hardware control is disabled.
You can use one of the following options if there is an external device
(i.e., interface converter) that needs a power supply using the control
lines. In this mode, the RS232 interface will not use hardware control or
software protocols to control the data stream.
Without (R0/D1), at initialization of interface control line DTR is
active and RTS is passive.
Without (R1/D0), at initialization of interface control line DTR is
passive and RTS is active.
Without (R1/D1), at initialization of interface control line DTR and
RTS are active.
Buffer Settings
The Receive Buffer is the buffer used by Windows to buffer characters received
by the serial port. Its size can be defined using this control. This buffer allows
ServiceLab to receive data in the background even if a foreground task is active
or the user is dealing with windows. The size may vary between 4 KB and 32
KB.
The Send Buffer for sending request strings is limited to 512 characters.
External Hardware Settings
Please refer to the hardware manual of your external device in order to choose
the right settings for the serial port.
The defined parameters are displayed in the main dialog box as a string.
11.5. Monitor
This function allows you to easily communicate directly with the external device:
You can send any string.
All received data, including control characters, is displayed.
This simple tool allows you to configure the interface communication. Although
you cannot read measured values directly into ServiceLab, you will see how
3-28
ServiceLab
Chapter 3: Input/Output Module Group
your data actually appears, and how ServiceLab will interpret it with the current
module settings. You will be able to quickly determine the correct settings for the
RS232 / ICom input module using this information.
Input window
You can define any string in the input window at the top of the monitor window.
The string can include control characters:
For example, \x1bai0\r will produce the string: <Esc>ai0<CR> (Hex: 1b
61 69 30 0d).
Buttons
Send String: When you press the Send button, the contents of the input window
are sent to the serial interface.
Save / Load String: Press the Save String No. 1 to No. 4 buttons to save the displayed string into an internal buffer. The buffer will be overwritten with the new
string.
Press the Load String No. 1 to No. 4 buttons to restore one of the saved strings.
Any existing text in the entry field is replaced by the stored string but is not sent
to the serial interface. Only the buttons for used buffers are activated. Saved
strings are stored with the worksheet if you close both dialog boxes with the OK
button.
Send Data Request Command (Channel 0 -15): Use the Send Data Request
Command buttons to send the stored requests (OptionsOPTIONRS232) to the serial device. The button is grayed out if the string does not exist. The sent string is
not displayed.
Send Reset / Start / Stop: The Send Reset, Send Start and Send Stop buttons
send the string(s) defined in the Options menu. The string sent is not displayed.
Output window
Received data is displayed in the lower window.
2 different display formats are available:
ASCII: All characters are displayed in ASCII format. Characters with
ASCII values > 31 (no control characters) are directly displayed as windows ANSI characters.
Control characters (values ≤ 31) are displayed with the abbreviation of
their control function (for example, <CR> for character 0d hex = 13
decimal or <ESC> for character 1b hex = 27 decimal).
You can choose from 2 modes when displaying the characters as ASCII.
In Automatic Word Wrap mode, each <CR>, <LF> or <CR><LF> causes
a line break. This mode offers the clearest display type. If the selected
mode is Off, all characters are written consecutively until the end off line
is reached (ca. 48 - 56 characters). Then the next line will be used.
The Off mode is recommended if many characters have to be displayed.
3-29
RS232 Input Module
ServiceLab
The second format is the hexadecimal display. Each character is
displayed as a two-digit hex character. Additionally, the accompanying
ASCII character is shown at the right.
If the character is a control character (ASCII code smaller than 32) the
ASCII character displayed is a dash. Each line always contains 16 hex
values + the accompanying ASCII character.
Up to 30.000 characters of text are buffered internally. Each time if you reach the
limit, the first text line is deleted. You can display all lines using the scroll bar.
New characters are added to the end of the text. If necessary, an automatic line
break generates a new line and scrolls the text up. If you switch the display mode
(automatic formatting on/off), any existing characters are unchanged. New characters are handled according to the selected mode. The ASCII mode and the
HEX mode have their own text buffer. Switching between ASCII and HEX mode
doesn’t change the contents of the buffers and the display of the different modes
doesn’t change. Enabling or disabling the Format String Debugging mode also
does not change the text buffers. New characters are displayed according to the
selected mode.
HEX:
Check Parsing
Format String Debugging is a useful tool to assist you in detect errors in your
Format Strings or to help in creating a Format String. A basic function of the
Format String-Debugging is to mark Parser activities with colored characters.
The parser divides the received series of characters into parts corresponding to
the settings in the Format String:
skipped characters (e.g. "6x" in the Format String) are displayed in black
values (e.g. "a" for an ASCII value or "i" for an Integer in the Format
String)
search strings
values, stored in global Variables
channel arithmetic
Different colors are assigned to each of these elements. You can change the colors with the color setting dialog. If the corresponding element is recognized the
concerning characters are colored.
If Check Parsing is active, the behavior of a running serial module is simulated
without the need to start the worksheet. In this case, the channels and the format
strings are processed in the same order as in a real experiment. The “Tracing
Channel” area shows the last received value in the Output column. If the value is
assigned to a global string, the value area shows the number of the string. For example:
$25=1.345
The global String 25 is assigned to a value of 17,345 in this example.
3-30
ServiceLab
Chapter 3: Input/Output Module Group
The "Ready to receive" column shows that channel waiting for the next value;
therefore the format string the next data received will be interpreted. The channel
is shown as follows:
Module skipping channel number (Module number/channel number in
module)
The module skipping channel number is the channel number that is shown above
the modules channel bar if slave modules are used (counted from 0 to max. 255).
The channel number in the module is the nth channel in the module, counted from
0 to a maximum of 15.
Example:
45 (2/13)
In the example the Module skipping channel number is 45, which corresponds
to the 13th (start at 0) channel of the 2nd (start at 0) module. Move the mouse
over the channel area and wait about 2 seconds to show a tip with detailed channel information.
Format-String Debugging (Examples)
Example 1:
The Format String is set to:
9x a\r
The following characters are received via serial interface: (<CR> is assigned to
a Byte with value 13 (Hex: 0x0D):
Voltage: 17.3 V<CR>
The Monitor shows the following:
Voltage: 17.3 V<CR>
The string "Voltage: " is skipped because the format command is "9x". The following characters are interpreted as value until the next <CR> is received. The
parser recognizes "17.3 V" as string, to be converted into a value. Because the
converter uses only numerical characters only the characters "17.3" are used and
the "V" will be ignored. Although the parser recognizes the "17.3 V" as a value
element. The meaning is shown in the next example.
Example 2:
The same format string is used as in example 1:
9x a\r
but some additional characters are received:
Current: 1.5 A; Voltage: 17.3 V<CR>
The Monitor shows the following:
3-31
RS232 Input Module
ServiceLab
Current: 1.5 A; Voltage: 17.3 V<CR>
Also in that case a voltage of 17.3 V should be recognized, but because to less
characters are skipped the parser takes "1.5 A; Voltage: 17.3 V" as the string to
convert. Because the next character after the “5“ is a space, the rest of string is
ignored. The result is thus 1.5.
Example 3:
The format string is similar to the examples 1 and 2, but some more characters
are skipped:
20x a\r
The same text as in example 2 is received:
Current: 1.5 A; Voltage: 17.3 V<CR>
The Monitor shows the following:
Current: 1.5 A; Voltage: 17.3 V<CR>
Again the voltage of 17.3 V should be recognized and the parser takes the colormarked characters: "age: 17.3 V". The converter ignores all characters until the
first numerical character is detected! So in that case the correct value 17.3 is calculated!
Hint:
It is important to understand the two steps to calculate the values in a characters
stream:
1. Parsing: getting the string (or Byte sequence) representing the value
2. Converting: calculates the numerical value out from the string (or Byte sequence) resulting from step 1.
3. Converting an ASCII strings (only valid with the format sign "a") is performed wit the following steps:
4. Search for the first numerical character (+ - e E.,0123456789) in the string.
5. Interpretation of the next part of string as a numerical value until the first nonnumerical character.
The Buffer Display (not available with ICom module)
The Buffer display shows status of the internal buffer of the Serial Module. You
can define the buffer size in the Interface Comm. Port settings of the Serial Module:
Example:
530/4096 (13%)
3-32
ServiceLab
Chapter 3: Input/Output Module Group
In the example the buffer contains 530 characters = 13%. A maximum of 4096
characters is available. The bar visually displays the percentage load of the
buffer.
11.6. Additional Controls
Save: This option stores the complete setup of the module in a separate
file for later use. The file extension is SIN.
Load: This option loads a previously saved setup. It reads files with the
extension SIN.
Send Reset: Click on this button to close and reopen the serial port and to
send the defined reset command.
The default directory for the configuration files can be defined in the
Options menu.
The Experiment: Serial Devices menu command allows you to link any
serial device by name with the corresponding configuration files. The
devices then are displayed in the list of predefined devices and can be
inserted directly into the flowchart, without the need to reload a configuration file.
Please note the settings made after saving a configuration file are not
stored automatically with the flowchart. To save these changing you
must use the Save button in the module dialog box. Please pay attention to select the correct configuration file name linked to the selected
device name.
11.7. RS232/ICOM Input Data Format
Define how ServiceLab interprets the values coming in at the serial interface in
the Data format box of the RS232 Output module. These settings are valid for the
selected channel. It is possible to define different strings for each channel.
The following format types are available:
Data T ype
Number of
Bytes
Format Range
code
ASCII Text
Optional
a
up to 16 characters
ASCII Hexadecimal
Optional
ah
Byte without sign
1
b
up to 16 characters
Integer only
0 … 255
Integer with sign
2
i
-32768 … 32767
Unsigned Integer
2
w
0 … 65535
Long Integer with sign
4
l
-2.14 e9 … 2.14 e9
3-33
ServiceLab
RS232 Input Module
Data T ype
Number of
Bytes
Format Range
code
Long Unsigned Integer
4
u
0 … 4.29 e9
IEEE Floating point
4
f
3.4 e+/- 38 (7 digits)
IEEE Double Floating
point
8
d
1.7 e+/- 308 (15 digits)
Others
Read text string into Global
String
Wait for a special String
Channel number
Arithmetic channel number
Format code
Max 256 char.
“String”
Max 16 char.
x= String No .
c
+ or -
Interpret as Hexadecimal
h
Skip character
x
Mask
Interpret as
Hausmann-Code
Interpret as 32 bit value
End
Restrictions
$x
+/- 999
only ASCII
max 3 times
max 999 signs
Hexadecimal Binary only
defined length
ahh
ASCII Only
l
ASCII Only
free, use \x… only if length is unknown
The format string must contain one of the format characters to identify the type of
data. Different types have different preconditions:
ASCII:
This data type is always interpreted as an alphanumeric text string. If the
external device sends data with fixed block length, you may place a numeric value directly before the format sign. This value defines the length
of the received data string. If the value lengths are different, omit this
value. The sample will be identified by leading and following spaces or
non-ordinal numbers. The following characters are valid characters to
mark measured values:
0… 9+- . ,Ee
All other characters mark the end of the measured value. For a fixed
length value, the part with the defined length will be cut out and all marks
except the previous characters will be deleted. After that the measurement
value will be converted into ServiceLab format and transferred to the
next module.
3-34
ServiceLab
Chapter 3: Input/Output Module Group
ASCII hexadecimal:
When a value is sent as a hexadecimal text string (one character uses 4 bit
hexadecimal) it is marked by an a followed by h. The ASCII characters 0
… 9, A … F, a … f will be recognized. The measurement value will be interpreted using this character.
Data type Motorola code:
As default, all data with the formats w (Integer without sign), i (Integer
with sign), l (Long Integer with sign) and u (Long Integer without sign) are
interpreted as Intel format data, so the lowest byte (LSB) will be read
first and the highest byte (MSB) last.
If data is stored in Motorola format, with the highest Bit first (MSB) and
the lowest byte last (LSB). To prevent incorrect interpretation of the
data, you must add the y character to the data type code to force the program to recognize data as Motorola data (e.g. ly if Long Integer data with
sign in Motorola format has to be interpreted).
Other types of data:
The length of the data string is based on the type. Defined bits (for example: information about status) could be blanked (except Float and Double). You must use a mask byte (hexadecimal with conform length) after
format sign.
Read Text String:
The RS232 Input module can read ASCII text and assign it to a Global
String. You can mix value channels and text string channels. When you define strings to be read, the RS232 Output module still shows an output, but
no values are transmitted to it. The corresponding Global String will be
defined by the settings in data format.
The syntax is:
$[string]
[string] is the number of the Global String to be written. This variable is a
number from 1 up to 100.
Example:
5x $32\n
The first 5 characters are ignored. All following characters are read until
a linefeed mark (Character 10) is recognized. The received text is assigned to Global String number 32.
Hint: All characters with an ASCII value from 32 to 255 (32 = blank)
are accepted. Smaller values are ignored. Maximum number of
characters is 256.
Skip Characters:
To get the exact Start position of the measurement value in data string, it
is possible to skip characters. Use the x parameter preceded by the number of characters to skip.
3-35
ServiceLab
RS232 Input Module
The following example of a format string shows you how to skip characters in string (nx):
2x
6a
5x
---
both first characters are ignored
the next 5 received bytes are deleted
This control code has to be separated by a Space from the other parts of
the format string. The maximum number is 999.
You can use this parameter up to three times per format string.
Waiting for a string:
The following example of a format string shows you how to wait for a defined string within the data string:
"Abc\r123"
2x a \r
--------- Characters Abc, Control code \r (Return) and the nu-
merical characters 123 have to be found in exactly this
order. Then two characters are ignored and the next
characters are interpreted as ASCII values. All preceding characters are lost.
You may divide the control code from the rest of string with blanks, although it’s not necessary. The blanks must be placed before the control
code of the data format.
Maximum length of the string is 16 characters.
This parameter can be used in each format string but only once per string.
Channel in data string:
An additional option is available which correctly arranges the samples
received when several channels come in with irregular distances. First,
the external device must send an identification signal. Use the c parameter
to define this channel information. It is also necessary to define the data
type after the c parameter. The same conditions as the measurement values are valid. Mixed data where the measurement value is a type other
than the channel value will be recognized. If the length of the channel info
is known, the length value has to be placed before the parameter c.
The channel info requires a numerical value from 0 to 15. If the channel
number doesn’t agree with the definition, it can be computed using simple
arithmetic. Insert a numerical value, starting with + or −, behind the format character. This value will be added to or subtracted from the calculated channel number. It is important that the arithmetic values of all
channels are equal because it is not known which channel is sending at
this time.
When a channel is calculated that doesn’t exist or isn’t activated, the received value won’t be transmitted.
3-36
ServiceLab
Chapter 3: Input/Output Module Group
The following example of a format string shows how to process additional channel information within the data string:
1x 3ca-32
-----
2x a \r
c marks the channel information; a marks the ASCII
data. The leading 3 defines three characters to contain
the information. When other types of data are used,
you may not use numeric values. The string -32 is
used as an arithmetic value; 32 is subtracted from the
determined numeric value of the channel. The new
value defines the number of the channel in the module.
1x ci
1x i
In this example, channel information is a 2 byte Integer (i).
The value determined is used directly as the channel number.
The complete string of parameters must be separated by a blank from the
other parts of the format string. It can be placed before or after the data
format control code.
Hexadecimal / Hausmann Code:
The switch h forces ServiceLab to take the data as hexadecimal values.
The format code ahh generates an input / output in Hausmann code.
The Hausmann Code is an ASCII Hex format that reads the characters in
reversed order.
Example:
--
Decimal
Hex
Hausmann Code
50
32
2300
100
64
4600
1000
3E8
8E30
1550
60E
E060
2000
7D0
0D70
With an appended l in the format string (e.g. xxahl) the value will be
interpreted as 32 bit value. Without that character, all numbers inbetween the interval Hex 8000 and Hex FFFF are interpreted as negative
values.
End:
Basically, ServiceLab tries to recognize the start and end position of data
strings using the length. Without a known length (ASCII without length information), we need an unambiguous code to recognize the end of the data
string. This code may start with a Backslash \. Some special codes are
predefined (see Data request). No predefined code will be defined by a
preset x (hexadecimal). Only one code can be predefined.
3-37
ServiceLab
RS232 Input Module
11.8. RS232 Input Examples
11.8.1
Example 1: The external device sends data continuously without
any request.
The following simple example shows the continuous data acquisition of two
channels. Data values are sent by the external device without request:
Request strings:
Format string 1st Channel:
Format string 2nd Channel:
both empty.
2x a \r
2x a \n
In this example data acquisition is shown step by step. Characters from the earlier step are wiped out. (ServiceLab works in the same way).
ServiceLab always starts on channel 1:
For example, the external device sends following characters (<CR> = Control
code 0Dh, <LF> = Control code 0Ah, ¤ is used here to mark a Space):
A3¤23.768<CR>A9¤345<CR><LF>A3¤23.950<CR>A9¤340<CR><LF>…
--both these characters are ignored (2x a \r).
¤23.768<CR>A9¤345<CR><LF>A3¤23.950<CR>A9¤340<CR><LF>…
------these characters are interpreted as ASCII (23.768), (2x a \r).
<CR>A9¤345<CR><LF>A3¤23.950<CR>A9¤340<CR><LF>…
---this character marks the end of the channel (2x a \r CR 0Dh 13).
The numerical value 23.768 is sent to the first output of the module.
Now the second channel is in process and the format string of the 2nd channel is
used.
A9¤345<CR><LF>A3¤23.950<CR>A9¤340<CR><LF>…
-both these characters are ignored, (2x a \n).
¤345<CR><LF>A3¤23.950<CR>A9¤340<CR><LF>…
---these characters are interpreted as ASCII (345), (2x a \n).
<CR><LF>A3¤23.950<CR>A9¤340<CR><LF>…
---this character is ignored (no ASCII character, no End mark).
<LF>A3¤23.950<CR>A9¤340<CR><LF>…
---end of channel mark is recognized (2x a \n => LF => 0Ah => 10).
345 is sent to the second Output of the module.
Now the format string of the 1 st channel is used again:
A3¤23.950<CR>A9¤340<CR><LF>…
-both these characters are ignored (2x a \r).
¤23.950<CR>A9¤340<CR><LF>…
------these characters are interpreted as ASCII (23.95), (2x a \r).
3-38
ServiceLab
Chapter 3: Input/Output Module Group
<CR>A9¤340<CR><LF>…
---end mark of channel is recognized (2x a \r => CR => 0Dh => 13)
23.95 is sent to the first Output channel.
Now the format string of the 2 nd channel is used again:
A9¤340<CR><LF>…
-both these characters are ignored (2x a \n).
and so on…
11.8.2
Example 2: The external device sends all available values
caused by one request.
The following simple example shows continuous data acquisition on two channels. Data values are sent by the external device by request:
Request string 1st channel :
GET AI 1,2\r\n
Format string 1 st channel: 3x 6a
Request string 2nd channel:
read
nd
channel
:
1x
a \n
Format string 2
Sample Interval:
1 Second
Data acquisition is shown step by step in this example. Characters of the earlier
step are wiped out. (ServiceLab works in the same way).
ServiceLab always starts on channel 1:
ServiceLab sends the request string GET AI 1,2<CR><LF> via serial port
to the external device. Send time is stored.
The external device will answer by sending two samples:
K01123.45,234.56<CR><LF>
--these three characters are ignored (3x 6a).
123.45,234.56<CR><LF>
-----these six characters (decimal as character) are interpreted as ASCII
(3x 6a).
123.45 is sent to the first output channel of the module.
The first channel and the first format string are now completely processed.
Now the Format string of the 2nd channel is used:
,234.56<CR><LF>
this character is ignored (1x a \n).
234.56<CR><LF>
-----these characters are interpreted as ASCII (1x a \n).
<CR><LF>
---this character is ignored (no ASCII, no End mark).
<LF>
3-39
RS232 Input Module
ServiceLab
----
channel end mark is recognized (1x a \n
LF
0Ah
10).
234.65 is sent to the second Output channel of the module.
The second channel and the second format string are processed completely.
Now ServiceLab waits until the last send time added to the Sample Interval (in
this case 1 sec) is reached. The request string: GET AI 1,2<CR><LF> is
sent to the external device again, so the external device will send the next two
samples and so on.
11.8.3
Example 3: The external device sends only one value on each
request.
The following simple example shows the data acquisition with two channels.
Each request causes the external device to send one data string:
Request string 1st channel:
\x1bT01
Format string 1 st channel: a 5x \x3b
\x1bT02
Request string 2nd channel:
a 5x \x3b
Format string 2 nd channel:
Sample Interval:
5 seconds.
In this example data acquisition is shown step by step. Characters of the previous
step are wiped out. (ServiceLab works in the same way).
ServiceLab always starts on channel 1.
ServiceLab sends the request string <Esc>T01 via serial port to the external
device. Send time is stored ( \x1b = hexadecimal 1b => 27decimal => Esc).
The external device will answer by sending one sample, for example:
6543.2ABCDE;
-----these characters are interpreted as ASCII (a 5x \x3b).
ABCDE;
----these 5 characters are sent by the external device but are unimportant so
they are ignored (a 5x \x3b).
;
end mark of channel (Semicolon, Hexadecimal 3b) is recognized (a 5x
\x3b).
6543.2 is sent to the first Output channel of the module.
The first channel is completed.
Now the request string of 2nd channel (<Esc>T02) is sent to the external device
(\x1b = hexadecimal 1b => 27decimal => Esc).
The device answers by sending the next string, i.e., :
1.234stuvw;
----these characters are interpreted as ASCII (a 5x \x3b).
3-40
ServiceLab
Chapter 3: Input/Output Module Group
stuvw;
----these 5 characters are sent by the external device but are unimportant. so
they are ignored (a 5x \x3b).
;
channel end mark (Semicolon, Hexadecimal 3b) is recognized (a 5x
\x3b).
Value 6543.2 is sent to second output channel of the module.
Second channel is completed.
Now ServiceLab waits until the last send time plus the Sample Interval (in this
case 1 sec) is reached. Then the request string <Esc>T01 is sent to the external
device again, so the external device will send the next two samples and so on.
12.
RS232 Output Module
Use this module to send data devices connected to the PC’s serial
ports.
This module sends data to measurement equipment or strings to external devices
via any serial interface of the PC recognized by Windows.
Input and Output Characteristics
Number of Inputs:
Input Block Size:
Number of Outputs:
Output Block Size:
Max. Number of Modules:
up to 16
same as global block size
----number of available serial ports
In a worksheet, this module can take data from up to 16 different channels and
transfer it to the RS232 Interface or it can send predetermined strings to the
RS232 Interface initiated by status messages or Event Driven Actions.
Double-click on this module symbol in the worksheet to open the module configuration dialog box, where you can enter the number of channels available on
your hardware using the channel bar.
ServiceLab keeps the COM port open while a worksheet with a RS232 module
is loaded. When the experiment is started, the serial interface will be closed and
re-opened to reset the port parameters and to use the actual parameter settings.
Additionally, this clears the Windows serial buffer, so any data from a previous
experiment is lost.
This approach has been chosen to enable the user to prepare worksheets on one
computer that may have different serial port settings than the target computer that
will run the application.
3-41
RS232 Output Module
ServiceLab
To check the settings without starting the measurement, use the Send Reset button. This causes the serial port to be closed and re-opened. The defined reset
string is also sent.
12.1. RS232 and ICOM Modes
Send data
All incoming data samples are sent to the serial interface. The data format is defined in the Output (Format) window.
The Output of item continuous Data has to be selected. In this case, with control
is grayed out and not available. You can enter the format characters and additional data in the Output (Format) field.
Send strings ruled by control signal
In this mode, the module uses one channel for control. Incoming values at the input of that channel will be interpreted as 0 (numerical value < 2.5) or 1 (numerical value > 2.5). The Output (Format) string will be sent to the RS232 interface
when the edge of the control signal is rising (Transition 0 to 1).
Single command and with control input options must be activated.
Sending strings ruled by Event Driven Actions
In this mode, the module doesn’t receive an input for the activated channel. Only
the Output (Format) string is sent to the interface when an event driven action is
performed. The single command option has to be activated and with control input
must be deactivated.
12.2. Com Port
See page 3-27 in the RS232 Input module.
12.3. Additional Controls
Save: This option stores the complete setup of the module in a separate
file for later use. The file extension is SOU.
Load: This option loads a previously saved setup. It reads files with the
extension SOU
Send string: Click on this button to send a string to control settings of interface and check the function of control strings.
The default directory for the configuration files can be defined in the Options
menu.
3-42
ServiceLab
Chapter 3: Input/Output Module Group
12.4. RS232 and IEEE488 Output Data Format
The Output (Format) field of the RS232 Output module tells ServiceLab how and
what data has to be sent. This entry only applies to the selected channel.
You are allowed to freely mix the following characters and bytes:
Data
If incoming ServiceLab data is sent to the RS232 interface, you have to use a
format character. The format character has to be placed between brackets. The
following types are possible:
Data Type
ASCII Text
Byte without sign
Signed Integer
Unsigned Integer
Signed Long Integer
Unsigned Long Integer
Floating point IEEE Float
Floating point IEEE Double
Numbe r of Bytes Format code
Optional
1
2
2
4
4
4
8
a
b
i
w
l
u
f
d
If the ASCII switch is active, the data is sent as a text string. Optionally, you can
define the length using a numerical value after a [xx] (enclosed in brackets). It
defines the overall length and, if necessary, the number of fractional digits. You
don't need to define fractional digits if no fractional digits will be sent. If no
length is defined, as many digits as needed are sent, including one digit for the
sign and 3 fractional digits. The decimal divider, comma or decimal point counts
as one digit. The default separator is the point. Positive values are preceded by a
blank, negative values a “−”. If values are received which are outside the valid
range, the smallest or largest possible value is sent. The number of characters to
be sent will not increase. Leading zeros will be replaced by blanks.
It is also possible to send data using the ASCII hexadecimal format. Use the format code a followed by h. Data values will be converted to the hexadecimal
value. 4 bits build one hex code. Fractional digits are not allowed in this mode.
Use the other format codes to send the data values will be send in the corresponding format. If values are received which are outside the valid range, the
smallest or largest possible value is sent. The number of characters or bytes to
be sent will not increase. Leading zeros will be replaced by blanks.
Control characters
A string may contain control characters which start with '\' (Backslash), followed
by a hexadecimal code which is marked with '\x' (\x0d = Return), or an octal
3-43
RS232 Output Module
ServiceLab
value triggered by a '\0' (Backslash Null) (\0015 = Return), or a control character starting with '\' (Backslash).
The following control characters are available:
'r'
Return
't'
Tab (HT)
'a'
Signal (BEL)
'n'
Line Feed (LF)
'b'
Backspace (BS)
'f'
Formfeed (FF)
'v'
Vertical Tab (VT)
Checksum
The string to be sent may also contain one or more check bits. Use \c followed
by the type to build the checksum. The position in the string also defines the position of the check bit. Two different checksum types are implemented:
horizontal sum: \cq
All bytes of the string before \cg are added (starting at the beginning of the
string or after the last checksum sign, including data values). Carries are
not considered. The resulting byte will be placed at the defined place in
the data string.
CRC-check: \cc
All bytes of the string are calculated using the CRC algorithm (cyclic redundancy check). The resulting byte will be placed at the defined place in
the data string.
12.5. Global Strings/Variables
In addition to sending pre-determined strings, you can also send the contents of
global strings and global variables via RS232 Output module to the corresponding serial interface.
To use the global variables you have to use placeholders similar to the sending
of regular data (e.g. [a] in square brackets: Output as ASCII or [i] output as Integer).
With global strings you must also use a placeholder, but format is not important.
Simply use the placeholder [a].
Text and control codes before and behind the placeholder are also sent.
E.g. if you use the following string: ABC123[a]\r\n
with the contents of the string: XyZ
you get the following output: ABC123XyZ<CR><LF>.
If only [a] is used, only the contents of the global string is sent.
Sending global Strings/Variables is only possible when using an event driven Action .
3-44
ServiceLab
13.
Chapter 3: Input/Output Module Group
ICOM (TCP/IP) Input Module
Use this module to scan data coming from devices connected to
the PC’s serial, or TCP/IP ports. The module filters the needed
values of the arriving data strings based on the module settings and
sends them to the module outputs.
This module can read data from up to 16 different channels and transfer them to
other modules using its signal channels.
It also can read ASCII strings and write them into a Global String. You can mix
value channels and text string channels. Double-click on this module symbol in
the worksheet to open the module configuration dialog box, where you can enter
the number of input channels available on your hardware using the Channel Number Selection Bar. Each activated Analog Input channel increases the
number of module outputs, so that each channel can send its data to another module through a separate line.
Input and Output Characteristics
Number of Inputs:
Input Block Size:
Number of Outputs:
Output Block Size:
Max. Number of Modules:
----up to 16, and, with Slave modules, up to 256
1 or global block size
up to 8, if the serial ports are available
One ICOM Input module is able to acquire data in up to 16 channels from any serial, TPC/IP or NI GPIB interface of the PC that is recognized by Windows (up
to 32 interfaces with the 32-bit version of ServiceLab.) All blocks of data are
provided with block size and timing information that is necessary to process data
in ServiceLab.
When inserting the ICOM Input module into the flowchart you can select whether
a module is created as a default module (with the usual default settings for all parameters) or as a predefined module with parameters configured for a specific
device. Predefined modules can be selected from the list box. They are created
using the menu command Experiment:-> Serial Devices (see Book 1: User Guide:
Chapter 4, Section 1.4.11 Serial Devices).
If there is already one ICOM Input module in the worksheet, you can add additional Slave modules to the Master module. Each Slave module expands the
Master module by up to 16 channels. If you add a new ICOM Input module to the
worksheet, you must define whether the module will be a new Master module
(linked to another ICOM interface) or will be a Slave module of an existing
Master module. If there are several Master modules you can choose between
them. The Slave module settings are limited to Data Request, Data Format and
Data Acknowledge parameters.
3-45
ICOM (TCP/IP) Input Module
ServiceLab
If a Master module is deleted, all assigned Slave modules lose connection.
You can no longer use these modules in the worksheet.
The ICOM Input module filters data values from the arriving data strings based
on the module settings and sends them to the module outputs. The resulting signal
sent to ServiceLab consists of a number of blocks with different time intervals,
with only one data point in each block, and with different starting times. As an
alternative, the data can be stored in a separate buffer and can be sent to ServiceLab with the global acquisition rate and block size. This approach allows an
easy synchronization of serial and other data.
ServiceLab holds the selected COM port open during the time a worksheet with
a ICOM module is loaded. When the experiment is started, the serial interface
will be closed and re-opened to reset the port parameters and to use the actual
module settings. Additionally, this clears the Windows serial buffer, so any data
from a previous experiment is lost.
This approach allows the user to prepare worksheets on one computer that may
have different serial port settings than the target computer that runs the application.
To check the settings without starting the measurement, use the Send Reset button. This causes the serial port to be closed and re-opened. The defined reset
string is also sent.
If the ICOM Input and Output modules use the same serial interface and the input
module uses a data request string, receiving and sending are completely synchronized, so reading and writing of data via RS232 happens alternately.
13.1. Module Settings
The ICOM Input module is substantially the same as the RS232 Input module,
with the exception of the Interface setup. Please see the previous sections for a
description of the module properties.
Data Re quest Command
The strings defined in this box are necessary to initialize a data request to the
connected external device. If there is no request necessary this area is grayed out
(Options button, see page 3-26).
See page 3-24 to get additional information about the data format of the request
string.
Data Format
The serial interface can only receive data in ASCII format. See page 3-33,
RS232/ICOM Input Data Format for more information on the data format of the
interface modules.
3-46
ServiceLab
Chapter 3: Input/Output Module Group
Data Acknowledge String
If a measurement value is received, the series of characters defined in this entry
field will be sent to the serial device. This option is needed if the external device has to receive an acknowledgement of the receipt of output values.
Options
See page 3-26 for information about the Options dialog. It contains the configuration setup for an external device including reset (optional), start and stop commands, synchronization and time-out conditions.
Additional Data
See page 3-27 for information about the Additional Data you can define to be sent
to the ICOM interface.
13.2. Interface Configuration
After selecting the interface Driver (COM, TCP/IP), you can define the parameters for the selected interface. The available communications interfaces are
COM: RS232 (serial)
TCP/IP
COM Hardware Se ttings (Serial Port)
The default settings are COM1, 9600 Baud, 8 Data bits and 1 Stop bit.
The buffer size (4 Kbytes) cannot be changed.
If Input and Output modules use the same interface port, these settings are
used by both.
Port: Specify the communications port to be used. Valid choices are
COM1 to COM32.
Baud rate: Define the speed of the communications device from 300 Baud
to 115200 Baud. If you lose data with high baud rates you should disable
the Release CPU time if idle Option in the Options menu, Global Settings.
Data bits: Define the number of data bits (5 to 8).
Stop bits: Defines the number of stop bits (1, 1.5 or 2)
Parity: Defines whether an additional parity bit per character is used.
Choices are Even, Odd or None (no parity).
Handshake : This entry defines whether data exchange is controlled by
protocol and which type it is.
None means there is no hardware control of data flow or using of a
o
software protocol. Control lines DTR (Data Terminal Ready) and
RTS (Request to Send) are disabled.
RTS/CTS uses the control lines of the serial interface for hardware
o
handshake.
3-47
ICOM (TCP/IP) Input Module
o
13.2.1
ServiceLab
Xon/Xoff uses the control characters (17 and 19) to control the data
stream. The hardware control DTR and RTS are disabled.
TCP/IP Hardware Settings
Host IP-Address: This number defines the communication partner via its
unique IP-Address. You can use the numeric address (xxx.xxx.xxx.xxx) or
its corresponding name such as the name of the PC, or its Web address.
T ransport Protocol: specify the port address where the communication
happens. For example, WWW is port 80. This number is automatically
added to the address defined in the edit field above separated by a colon
(:). You can also enter this number directly into the edit field
(xxx.xxx.xxx.xxx:80). If in the IP Address a port number is used, that is
not included in the selection list the entry other Port is shown.
Please note that the Port numbers are only one part of the address. The module offers only a generic TCP/IP client, but no higher level protocols such as
e.g. FTP or HTTP are implemented.
[Also at this time the module is not able to communicate with HTTP Servers,
because the HTTP Server cuts the connection each time a transmission is
completed. The ICom module expects to keep the connection.]
13.3. Monitor
Click on the Monitor button to communicate directly with the external device.
You can send any string.
All received data, including control characters, is displayed.
This simple tool allows you to configure the interface communication. Although
you cannot read measured values directly into ServiceLab, you will see how
your data actually appears, and how ServiceLab will interpret it with the current
module settings. You will be able to quickly determine the correct settings for the
RS232 / ICom input module using this information.
See page 3-28 for a full description and example of the Monitor function.
13.4. Additional Controls
Save: This option stores the complete setup of the module in a separate
file for later use. The file extension is IIM for ICOM Master Modules and
.IIS for ICOM Slave Modules.
Load: This option loads a previously saved setup. It reads files with the
extension .IIM or IIS.
The Experiment: Serial Devices menu command allows you to link any serial device by name with the corresponding configuration files. The devices then are
displayed in the list of predefined devices and can be inserted directly into the
flowchart, without the need to reload a configuration file.
3-48
ServiceLab
Chapter 3: Input/Output Module Group
The default directory for the configuration files can be defined in the Options
menu.
The Experiment: Serial Devices menu command allows you to link any serial
device by name with the corresponding configuration files. The devices then
are displayed in the list of predefined devices and can be inserted directly
into the flowchart, without the need to reload a configuration file.
Please note the settings made after saving a configuration file are not stored
automatically with the flowchart. To save these changing you must use the
Save button in the module dialog box. Please pay attention to select the correct configuration file name linked to the selected device name.
14.
ICOM Output Module
Use this module to send data to devices connected to the PC’s serial, or TCP/IP port.
Input and Output Characteristics
Number of Inputs:
Input Block Size:
Number of Outputs:
Output Block Size:
Max. Number of Modules:
Up to 16
Same as global block size
----number of available serial ports
The ICOM Output module is able to send data to any (RS232, TCP/IP) interface
of the PC that is recognized by Windows.
Inserting a serial module into the flowchart you can select, whether a module is
created as default module (with the usual default settings in all parameters) or a
predefined module with parameters configured for a special RS232 device is
placed on the worksheet. Configured modules can be selected from the list box.
They are created using the menu command Experiment-> Serial Devices
The COM (in RS232 mode) port is held open by ServiceLab for the whole
time a worksheet with a serial module is loaded. When the experiment is
started, the serial interface will be closed and reopened in order to reset the
port parameters and to use the actual parameter settings. In addition, this
flushes the serial buffer provided by Windows, so that data from a previous
experiment is deleted
This approach has been chosen to enable the user to prepare worksheets on
one computer that has different serial port settings than the target computer
that will run the application.
3-49
ICOM Output Module
ServiceLab
If you want to check the settings without starting the measurement you can
use the Send Reset button. This causes the serial port to be closed and
opened again. In addition, the defined reset string is sent.
Each channel of this module is able to operate in one of three modes:
Send Data
Send strings controlled by control signal
Send strings or global strings/variables controlled by event driven actions
See Section 12.1 RS232 Output Module RS232 and ICOM Modes on page 3-42
for more details.
Interface
See Section 0 Data Request Command
The strings defined in this box are necessary to initialize a data request to the
connected external device. If there is no request necessary this area is grayed out
(Options button, see page 3-26).
See page 3-24 to get additional information about the data format of the request
string.
Data Format
The serial interface can only receive data in ASCII format. See page 3-33,
RS232/ICOM Input Data Format for more information on the data format of the
interface modules.
Data Acknowledge String
If a measurement value is received, the series of characters defined in this entry
field will be sent to the serial device. This option is needed if the external device has to receive an acknowledgement of the receipt of output values.
Options
See page 3-26 for information about the Options dialog. It contains the configuration setup for an external device including reset (optional), start and stop commands, synchronization and time-out conditions.
Additional Data
See page 3-27 for information about the Additional Data you can define to be
sent to the ICOM interface.
Interface Configuration on page 3-46 for details.
Additional Controls
Save: This option stores the complete setup of the module in a separate
file for later use. The file extension is SOU.
Load: This option loads a previously saved setup. It reads files with the
extension SOU
3-50
ServiceLab
Chapter 3: Input/Output Module Group
Send string: Click on this button to send a string to control settings of interface and check the function of control strings. While mode continuous
is chosen value is set to 0.0 (zero) and sent as data.
The Default Path for configuration files (*.IOU) can be defined in the Options Menu.
The Experiment: Serial Devices menu command links a serial device by name
with the corresponding configuration file. The devices are then are displayed
in the list of predefined devices and can be inserted directly into the flowchart
without reloading a configuration file.
Please note that the settings made after saving a configuration file are not
automatically stored with the flowchart. To save these changes you must use
the Save button in the module dialog box. Please pay attention that you select
the correct configuration file name linked to the selected device name.
15.
IEEE488 Input and Output Modules (optional)
ServiceLab optional supports boards from several vendors. During the installation procedure you can choose between the different boards.
The following hints are valid for all board types. For specific help, click on one
of the card types.
INES
IOtech
National Instruments
The IEEE Output Module is not available for INES boards.
The default directory for the configuration file of the IEEE device can be
defined in the Options menu.
General Hints
Communication Errors
If a communication error occurs, ServiceLab displays a message and stops the
experiment.
Data Acquisition with more than one Device
If data is to be acquired from or sent to several IEEE devices, a separate
IEEE Input module must be placed into the worksheet for each device. Each device must have a unique IEEE address.
3-51
IEEE488 Input and Output Modules (optional)
ServiceLab
You can specify a default directory for the configuration file (*.GPO) of
the IEEE device (Options menu command).
See the following sections for more information.
IEEE488 Input
INES IEEE488 Input
IOtech IEEE488 Input
National InstrumentsIEEE488 Input
IEEE Input data format
IEEE488 Output
National Instruments IEEE488 Output
IOtech IEEE488 Output
IEEE Output data format
IEEE Interface Options
IEEE Interface Hardware settings
IOtech Commands
National Instruments Commands
15.1. IEEE488 Input Module (optional)
Use this module to acquire data coming into the PC via an IEEE
interface.
15.1.1
General Hints
In a worksheet, this module can read data of up to 16 different channels and
transfer them to other modules using its signal channels.
Input and Output Characteristics
Number of Inputs:
Input Block Size:
Number of Outputs:
Output Block Size:
Max. Number of Modules:
----up to 16
1
up to 15
Communication Errors
If a communication error occurs, ServiceLab displays a message and stops the
experiment.
3-52
ServiceLab
Chapter 3: Input/Output Module Group
Data Acquisition with more than one Device
If data is to be acquired from several IEEE devices, a separate IEEE Input module must be placed into the worksheet for each device. Each device must have a
unique IEEE address.
You can specify a default directory for the configuration file (*.GPI) of
the IEEE device (Options menu command).
15.1.2
IEEE488 Input: INES Module
This module is used for the measurement acquisition of units with IEEE488 interface (IEC bus).
Prerequisites for this function are:
an IEEE488 interface card from the INES company installed in your computer,
the correct Windows drivers (∗.DLL in the WINDOWS\SYSTEM directory; see the INES manual),
and the ServiceLab INES driver (which must be selected during ServiceLab installation).
Most of the commands used to communicate with the IEEE card need a Device
handle (a synonym for the address specified in Hardware Options) to talk to the
device. Default handles are user for the measurement instrument and IEEE for the
card. One of these handles is specified as command parameter (in parenthesis)
defining the target of the command.
General Module Configuration
Start Commands: Enter the commands necessary for the initialization of
the IEEE board and the connected devices. They will be executed once
when the measurement is started. For example:
ABORTIO 7
stop previous communication processes
CLEAR 709
reset interface
SET 709, 1000,9013, 9013 set terminators and delays
OUTPUT 709, 'xyz'
initialize devices
Stop Commands: These commands will be executed once when the measurement is stopped.
Sampling Rate: The acquisition rate is taken from the Windows system
clock. The maximum rate is 10 Hz or 0.1 seconds delay. If the connected
device does not send data at the desired rate, no warning or error message will occur, but the next value will be accepted after the next delay.
Every sample is provided with the current system time. The bus delays
for the IEEE board must be adjusted using the INIT command in accordance with the acquisition rate.
3-53
IEEE488 Input and Output Modules (optional)
ServiceLab
Data Format: Please see page 3-57 for more information on the data for-
mat of the different interface modules.
Data Request: This command will be sent out whenever a value is re-
quested by a device. The last line always must be ENTER 7xx, %5,
which is necessary for the communication between ServiceLab and the
IEEE board. For example:
OUTPUT 709, ´xxyyzz´ device-dependent request command
ENTER 709, %5
read value
A delay command WAIT n may be entered in these input fields, where n denotes
the delay time in milliseconds. Any value may be entered, but these values are
always rounded to multiples of 55 ms according to the cycle time of the system
clock.
If a communication error occurs during measurement, an error message will be
displayed, and the acquisition of data will be stopped.
To acquire from several devices, one IEEE module must be inserted into the
worksheet for each device. The maximum number of external IEEE devices is
15, with each of them requiring a different device address.
You can specify the default directory for the configuration file of the IEEE
device in the Options menu.
15.1.3
IEEE488 Input: IOtech Module
This module is used for the measurement acquisition of units with IEEE488 interface (IEC bus).
Prerequisites for this function are:
an IEEE488 interface card from IOtech installed in your computer,
the correct Windows drivers (∗.DLL in the WINDOWS\SYSTEM directory; see the IOtech manual),
and the ServiceLab IOtech driver (which must be selected during ServiceLab installation).
The commands used with this module must conform to the syntax definitions of
the IOtech card. For details concerning the syntax, please refer to the IOtech
manual.
Most of the commands used to communicate with the IEEE card need a Device
handle (a synonym for the address specified in Hardware Options) to talk to the
device. Default handles are user for the measurement instrument and IEEE for the
card. One of these handles is specified as command parameter (in parenthesis)
defining the target of the command.
General Module Configuration
Start Commands: Enter the commands to initialize the IEEE card and the
measurement acquisition device. The commands entered here are out-
3-54
ServiceLab
Chapter 3: Input/Output Module Group
put/executed once at Measurement Start. A maximum of 50 command
lines can be entered.
The Start commands also can be executed using an asynchronous action.
Use the Send Start Command action in the Action module.
Stop Commands: The commands entered here are executed once at
Measurement stop. This sequence can be used, for example, to deactivate
the remote control (data acquisition via a computer) of a connected device. A maximum of 50 command lines can be entered.
Data Format: Please see page 3-57 for more information on the data for-
mat of the different interface modules.
Data Request: The commands specified here are executed one time for
each channel before data acquisition takes place. Use this sequence to
trigger the data acquisition and transfer of data.
If data request is not cyclic but starts at a special event, use the Send Request asynchronous action. Use the Send On Action setting in the
IEEE488 Options dialogue box.
Additional switches
Click on the Hardware button to open the dialog box. Use this window to
enter the various settings for the actual measurement device.
The Options button allows other settings to be entered for the Acquisition
rate and the Transfer mode.
If a communication error occurs during communication with a device or with
an IEEE card, a fault message will be shown in a separate window. The entire
measurement will be stopped.
You must insert an individual IEEE module into the worksheet for each device
to acquire data from several devices. Prerequisite for this is that all devices
are operated via one IEEE card and set to different device addresses. A maximum of 15 devices can be connected to one IEEE card.
You can specify the Default directory for the configuration file of the IEEE
interface in the Options menu.
15.1.4
IEEE488 Input: National Instruments
This module is used for the measurement acquisition of units with IEEE488 interface (IEC bus).
Prerequisites for this function are:
an IEEE488 interface card from the National Instruments company installed in your computer,
the correct Windows drivers (∗.DLL in the WINDOWS\SYSTEM directory; see the National Instruments manual),
3-55
IEEE488 Input and Output Modules (optional)
ServiceLab
and the ServiceLab NI driver (which must be selected during ServiceLab
installation).
The commands used with this module must conform to the syntax definitions of
the NI card. For details concerning the syntax, please refer to the National Instruments manual.
Most of the Commands used to communicate with the IEEE card need a Device
handle (synonym for the address specified at Measurement card parameter) to
talk to the device. Default handles are user for the measurement instrument and
IEEE for the card. One of these handles is specified as command parameter (in
parenthesis) defining the target of the command.
Functions in the setting window
Start commands: This entry field is used to specify commands to initialize
the IEEE card and the measurement acquisition device. The commands
entered here are output/executed once at Measurement start. A maximum
of 50 command lines can be entered.
Stop commands: The commands entered here are executed once at Measurement stop. This sequence can be used for example to deactivate the
remote control (data acquisition via a computer) of a connected device. A
maximum of 50 command lines can be entered.
Data format: Please see page 3-57 for more information on the data format of the different interface modules.
Data request: The commands specified here are executed one time for
each channel before data acquisition takes place. Use this sequence to
trigger the data acquisition and transfer of data.
Additional switches
By clicking onto the Hardware button a separate settings window is
opened. In this window to enter the various settings for the actual measurement device.
The Options button allows other settings to be entered for the Acquisition
rate and the Transfer mode.
If a communication fault occurs during communication with a device or with
an IEEE card, a fault message will be shown in a separate window. The entire
measurement will be stopped.
You must insert an individual IEEE module for each device into the worksheet
to acquire data from several devices. Prerequisite for this is that all devices
are operated via one IEEE card and set to different device addresses. A maximum of 15 devices can be connected to one IEEE card.
You can specify the Default directory for the configuration file of the IEEE
interface in the Options menu.
3-56
ServiceLab
15.1.5
Chapter 3: Input/Output Module Group
Data format for IEEE488 Input
ServiceLab uses the Data format input field of the interface modules to determine
how the value supplied by the measurement instrument should be interpreted. The
settings always refer to the currently selected channel of the module. It is possible to define different strings for each channel.
The following format types are available:
Data type
ASCII text
Integer with sign
Integer without sign
Long Integer with sign
Long Integer without sign
Floating point IEEE Float
Floating point IEEE Double
Number of Bytes Format designator
optional
2
2
4
4
4
8
a
i
w
l
u
f
d
If the ASCII switch is active, the string is interpreted as text. If binary is chosen,
the string must contain one of the above format codes to identify the data type.
Parameter nx masks n characters in the string.
Defined bits (for example: status information) can be blanked (except
Float and Double). You must use a mask byte (hexadecimal with conform
length) behind the format sign.
Other data types:
The type identifies the length of the data string. Defined bits (for example:
information about status) can be blanked (except Float and Double). You
must use a mask byte (hexadecimal with conform length) behind the format byte.
There must be spaces between each parameter of the format string.
Examples of format strings:
2x a 5x \r
Incoming values are interpreted as ASCII. The first two and last 5 received bytes are chopped. CR (0Dh) will be recognized as the end code.
u
Incoming value is interpreted as Long Integer. No bytes will be eliminated. Length is fixed to 4 bytes.
i fff0 2x
Value will be interpreted as Integer. The following two bytes are
skipped. Only the first 12 Bits are masked out and are interpreted as numerical Integer value.
3-57
IEEE488 Input and Output Modules (optional)
ServiceLab
15.2. IEEE488 Output Module
Use this module to send data to an IEEE488 device.
In a worksheet, this module can send data on up to 16 different channels to an external IEEE device.
Input and Output Characteristics
Number of Inputs:
Input Block Size:
Number of Outputs:
Output Block Size:
Max. Number of Modules:
16 (depending on hardware and working mode)
same as global block size
----up to 15
Working modes:
Each channel of this module is able to operate in one of three modes:
Send Data
Send strings ruled by control signal
Send strings ruled by event driven actions
You can specify a default directory for the configuration file (*.GPO) of
the IEEE device (Options menu command).
15.2.1
General Module Configuration
Start commands: This entry field is used to specify commands for the initializa-
tion of the IEEE board and the connected acquisition devices. The commands entered here are executed once when the measurement is started. A maximum of 50
command lines can be entered.
The Start commands also can be executed using an asynchronous action. Use the
action Send Start command in the Action module.
Stop commands: The commands entered here are executed when the measurement is stopped. This sequence can be used, for example, to deactivate the remote control (data acquisition via a computer) of a connected device. A maximum of 50 command lines can be entered.
Output Data: The commands inserted in that field are executed each time before
a sample of a channel is acquired. So you can initialize sending and define kind
data to be transferred to the external device.
15.2.2
Working modes:
Each channel of this module is able to operate in one of three modes:
3-58
ServiceLab
Chapter 3: Input/Output Module Group
Send Data
Send strings ruled by control signal
Send strings ruled by event driven actions
In this mode only the block size 1 is supported. If other sizes are used, only the
first value of the block will be transferred.
15.2.3
Additional Switches
Click on the Hardware button to open the dialog box. Use this window to enter
the various settings for the actual measurement device.
15.2.4
Notes
If a communication error occurs during communication with a device or with an
IEEE card, an error message will be shown in a separate window, and the entire
measurement will be stopped.
To acquire data from several devices you must insert an individual IEEE Output
module into the worksheet for each device. The prerequisite for this is that all
devices are operated via one IEEE board and set to different device addresses.
A maximum of 15 devices can be connected to one IEEE board.
15.2.5
IEEE488 Output: IOtech
This module is used for the measurement acquisition of with IEEE488 interface
(IEC bus).
Prerequisites for this function are:
an IEEE488 interface card from the IOtech company installed in your
computer,
the correct Windows drivers (*.DLL in the WINDOWS\SYSTEM directory; see the IOtech manual)
and the ServiceLab IOtech driver (which must be selected during ServiceLab installation).
To use the IOtech IEEE card you must provide the hardware handles for the interface and the device to ServiceLab.
If needed, you can adapt the settings of the IEEE0 hardware handles used for the
interface and Wave used for the device in the Hardware dialog box.
In ServiceLab, the interface handle is defined as IEEE (instead of IEEE0) and the
device handle is defined as user (instead of Wave). One of these handles is
specified in brackets after the command parameter and defines the target of the
command.
The commands used with this module must conform to the syntax definitions of
the IOtech card. For details concerning the syntax, please refer to the IOtech
manual.
3-59
IEEE488 Input and Output Modules (optional)
15.2.6
ServiceLab
IEEE488 Output: National Instruments Module
This module is used for the measurement acquisition of with IEEE488 interface
(IEC bus).
Prerequisites for this function are:
an IEEE488 interface card from the National Instruments company installed in your computer,
the correct Windows drivers (*.DLL in the WINDOWS\SYSTEM directory; see the National Instruments manual)
and the ServiceLab NI driver (which must be selected during ServiceLab
installation).
The commands used with this module must conform to the syntax definitions of
the NI card. For details concerning the syntax, please refer to the National Instruments manual.
Most of the commands used to communicate with the IEEE card need a device
handle (synonym for the address specified at Hardware Setup) to talk to the device. Default handles are user for the measurement instrument and IEEE for the
card. One of these handles is specified as command parameter (in parenthesis)
defining the target of the command.
15.2.7
IEEE488 Output Module Data Format
See page 3-43 for more information on the data format.
15.3. IEEE488 Hardware Settings
In this dialog box for the IOtech or National Instruments IEEE488 interfaces,
various settings can be made for the actual measurement:
The Device address specifies the IEEE bus address set at the measurement instrument.
The Secondary address is used to specify the second address of the
measurement instrument.
The Timeout parameter specifies the time in milliseconds ServiceLab
waits for this data from the measurement instrument. If this time is exceeded, ServiceLab aborts the measurement. Look for the relevant time
value in software reference manual of the interface (for National Instruments the IBTMO command; for IOtech the TimeOut command). If this time is exceeded, ServiceLab stops the measurement.
15.4. IEEE488 Options
Click on the Options button to define the settings for the Acquisition Rate, the
Transfer Type and the Scan Mode for IOtech or National Instruments IEEE488
interfaces.
3-60
ServiceLab
Chapter 3: Input/Output Module Group
All these settings relate to the interpretation of the data received by ServiceLab
but not to the programming of the connected measurement instrument.
Storage settings
The settings made here are relevant if the connected IEEE-measurement
instrument acquires the data independently and sends them to ServiceLab.
Storage rate: the desired acquisition rate for the device can be set in seconds.
Storage mode:
Single values : one measurement value is requested for every active
channel. Set the Transfer block length and the Output block length to
1.
Block mode:
AAA: One measurement block is requested for every active channel.
The value set for Transfer block length specifies the block length.
AAABBBCCC: All measurement values are stored block-by-block in
channel 0. The data of all other channels of the measurement instrument are available at channel 0 of the IEEE-module. The Transfer
block length represents the number of values of a channel. With a
Transfer block length of n the data is present n times in channel 0,
n times in channel 1, …etc. in the output data block.
ABCABCABC:All measurement values are only requested with the
command for channel 0, read in by a read operation and assigned to
the activated output channels. The number of output channels are
specified with Transfer settings
T ransfer settings
The settings made here are in direct relationship with the Storage mode
selected in Storage settings. The Transfer block length per channel
specifies the block length the IEEE device uses to transfer data.
The Transfer buffer specifies the size ServiceLab reserves for receiving
the data block. The buffer size must be sufficiently large to allow for the
storage of an entire data block. If the size is below the required amount,
the remaining data is read in with the next measurement value read-in
command and thus falsely interpreted.
Module settings
These settings refer to the ServiceLab module itself.
If Dispatcher mode is active, the measurement request commands are sent
in intervals specified by the Acquisition rate. The incoming data is then
processed. The highest acquisition rate is 0.1 seconds.
The Output block length specifies the block length ServiceLab uses to
transmit the data to other modules. The value specified must be the same
or smaller than the Transfer block length set for the IEEE device.
Data value acquisition
3-61
IEEE488 Input and Output Modules (optional)
ServiceLab
The operating module of the module is set here.
When the Dispatcher is selected and the measurement is started, ServiceLab automatically sends the measurement value request command in
the time intervals set for the Acquisition rate.
When the Status request mode is active the IEEE device is responsible
for the time base (Acquisition rate). In this mode the status of the device
must be determined with the measurement request command (SPOLL
command).
Example:
IF (spoll (user) & 16 == 1)
ENTER (user)
The data is read in if it is ready for transfer.
15.5. Command overview - IOtech IEEE card
The following commands are supported for this card:
ABORT
Output of an Interface Clear message
CLEAR
Reset of one or all devices
ENTER
Reading in of data of one device
LISTEN
Interface in Listener mode, data can be read from the
bus
LOCAL
Sending of a 'Go To Local' message to all devices
OUTPUT
Sending of data to one device
REMOTE
Setting of the 'Remote Enable' line
SPOLL
Serial Poll scanning
TALK
Interface is in Talker mode, data can be outputted onto
the bus
TRIGGER
Output of a trigger to one device
UNLISTEN
Reset the Listener mode
UNTALK
Reset the Talker mode
The following commands are interface card independent:
IF
Conditional execution, at this time only possible with
SPOLL.
ELSE
The following condition is executed if the IF condition
is not satisfied.
WHILE
Loop until the status is satisfied, otherwise the same as
IF but without BEGIN…END.
BEGIN…END
All commands enclosed by these statements are conditionally executed.
WAIT
Following this command the waiting time can be
specified in milliseconds. Execution of commands is
3-62
ServiceLab
Chapter 3: Input/Output Module Group
delayed by the specified time.
Examples:
Command sequences
IF (spoll (user) & 16 == 0)
BEGIN
…
END
ELSE
BEGIN
…
END
WHILE (SPOLL (user) & 16)
… instruction
Explanation
The IF command must be followed by
a SPOLL command (operator &, comparison with ==, > , < , >= , <= possible).
You cannot nest IF statements.
The WHILE loop is executed until the
condition is satisfied.
15.6. Command overview - National Instruments IEEE card
The following commands are supported for this card:
IBCLR
Output of an Interface Clear message
IBCMD
Sending of interface commands
IBCONFIG
Changing of the interface parameters
IBDMA
Setting or resetting of the DMA mode
IBEOS
Changing or resetting of the End-of-String transfer mode
IBEOT
Setting or resetting of the End-of-Transition transfer mode
IBLOC
Switching of the device to Local mode
IBPAD
Changing the primary address
IBRD
Reading in of data into string
IBRPP
Parallel Poll scan
IBRSC
Setting or resetting of the interface features to output the Interface Clear and Remote Enable message
IBRSP
Serial Poll
IBSAD
Changing the secondary address
IBSIC
Sending of the Interface Clear message for 100µs
IBSRE
Setting or resetting of the Remote Enable line
IBSTOP
Terminating of the asynchronous operation
IBTMO
Changing of the Time Out value
IBTRG
Triggering of a device
IBWRT
Sending of a string to a device
The following commands are interface card independent:
3-63
ServiceLab
IVI Scope (optional)
IF
ELSE
WHILE
BEGIN… END
WAIT
Conditional execution, at this time only possible with
IBRSP.
The following condition is executed if the IF condition is not
satisfied.
Loop until the status is satisfied, otherwise the same as IF
but without BEGIN… END.
All commands enclosed by these statements are conditionally
executed.
The wait time can be specified in milliseconds following this
command. Execution of commands is delayed by the specified
time.
Examples:
Command sequences
Explanation
IF (ibrsp (user) & 16 == 0) The IF command must be followed by a
BEGIN
IBRSP command (operator &, comparison
…
with == , > , < , >= , <= possible).
END
ELSE
You cannot nest IF statements.
BEGIN
…
END
WHILE (ibrsp (user) & 16)
… command
16.
The WHILE loop is executed until the condition is satisfied.
IVI Scope (optional)
The module controls a Scope device via the IVI interface. The
module only offers the basic function as described the
IVI Class Specifications.
Additional software to enable the module’s functions is required: You must install the IVI engine software shipped by the hardware manufacturer.
Input and Output Characteristics
Number of Inputs:
--Input Block Size:
--Number of Outputs:
1
Output Block Size:
as defined in module
Max. Number of Modules:
any
3-64
ServiceLab
Chapter 3: Input/Output Module Group
IVI Scope Specifications
The IVIScope specification defines the IVI class for oscilloscopes. The IVIScope class, defined by the IVI foundation (http://www.ivifoundation.org/) is divided into a base capability group (available in ServiceLab) and extensions. The
base capability group is used to configure an oscilloscope for typical waveform
acquisition (including setting the channel, the acquisition, and the triggering subsystems), initiating the waveform acquisition, and returning a waveform. The
base capability group supports only edge triggering and normal waveform acquisition.
In addition to the base capabilities, the IVIScope class defines extended capabilities for oscilloscopes that can:
Have advanced triggering options such as TV, runt, glitch, width, and AC
line
Use alternative acquisition modes such as average, envelope, and peak
detect
Use different sample modes such as real-time and equivalent
Perform waveform measurements such as rise-time, fall-time, and voltage
peak-to-peak
Sense the probe attenuation
Perform an auto-setup
Interpolate the points in the waveform record
Acquire data continuously
General
When creating the module you must select the logical name of the oscilloscope
device. ServiceLab checks all IVI devices installed in the system and shows
them in the pull down list.
Parameter
Time to wait (in seconds) since measurement starts,
before data recording has to start.
Horizontal Range:
Shown (or sampled) range in seconds.
Block Size:
Number of samples to be recorded in the „horizontal range“.
These samples also build the block at the modules output.
Vertical Range: Define the maximum y value to be displayed.
Vertical Offset: Define the vertical shift of the displayed X-axis.
Trigger Source: This source is used to initiate trigger events.
none:
no trigger event will be expected. Trigger level and edge are not
valid in that case.
external: the scope is triggered by an external source.
Trigger Level: If the defined level is crossed a trigger event is generated.
Horizontal Offset:
3-65
ServiceLab
IVI Function Generator (optional)
Edge:
rising:
falling:
Coupling:
AC:
DC:
17.
defines the direction of level crossing
level has to be exceeded.
level has to be underrun.
Define the kind of data source linked to the scope hardware.
Alternating current voltage
Direct current voltage
IVI Function Generator (optional)
The module controls a Function Generator device via the IVI interface. The module only offers the basic function as described the
IVI Class Specifications.
Additional software to enable the module’s functions is required: You must install the IVI engine software shipped by the hardware manufacturer.
Input and Output Characteristics
Number of Inputs:
Input Block Size:
Number of Outputs:
Output Block Size:
Max. Number of Modules:
1
---------
IVI Function Generator Specifications
The IVIFgen class defined by the IVI foundation conceptualizes a function generator as an instrument capable of generating an analog voltage waveform, and
can be applied to a wide range of instruments. The output signal is typically functional in nature (for instance sinusoidal or square). Some instruments support the
generation of arbitrary waveforms, which consist of user-specified data. If the
function generator also supports the generation of arbitrary waveform sequences,
the output signal can consist of a sequence of repeated arbitrary waveforms.
(http://www.ivifoundation.org/)
General
The IVIFgen class also supports more advanced features such as burst mode, AM
modulation, and FM modulation. When creating the module you must select the
logical name of the function generator device.
ServiceLab checks all IVI devices installed in the system and shows them in the
pull down list.
Parameters
Clock Source : you can select an internal or external clock source.
3-66
ServiceLab
Chapter 3: Input/Output Module Group
Generator:
you must select the logical name of the used function generator
hardware.
The following parameters can be defined directly using the module dialog box or
alternately via the module’s inputs. When using the inputs, the module provides
additional control inputs for each selected parameter.
Frequency: (F) The signal is generated with the defined frequency.
Amplitude:(A) The amplitude of signals reaches that value.
Offset: (O)
To amplitude that offset is added.
Phase: (P)
The phase of signal is shifted by that value (RAD)
Impedance: (I) You must define the impedance of the used device. Reasonable
values are almost often 50 or 75 Ohms. If the defined value is
not supported by the device an error message will be shown..
Duty Cycle: (D) This setting is available only if the Rectangle waveform is selected. The duty cycle is defined as ratio of length of pulse and
length of period.
Wave Form: (W)
Define a waveform the hardware has to generate. You
can select between:
Sine
Value at the control input W: 0
Rectangle
Value at the control input W: 1
Triangle
Value at the control input W: 2
Ramp rising
Value at the control input W: 3
Ramp falling
Value at the control input W: 4
Constant Level Value at the control input W: 5
To select a waveform via control input use the corresponding
values.
18.
IVI Digital Multimeter (DMM) (optional)
This module is used to acquire data of a triggered time interval
from an IVI compatible DMM device via the IVI interface driver
The module only offers the basic function as described the
IVI Class Specifications.
Additional software to enable the module’s functions is required: You must install the IVI engine software shipped by the hardware manufacturer.
This module imports signals from the Multimeter hardware device.
Input and Output Characteristics
Number of Inputs:
Input Block Size:
Number of Outputs:
----1
3-67
IVI Digital Multimeter (DMM) (optional)
Output Block Size:
Max. Number of Modules:
ServiceLab
as defined in module
any
IVI DMM Specifications
The IVIDMM class, defined by the IVI foundation defines the functions the IVI
digital multimeters class has to offer. It is divided into a group of basic functions
(available in ServiceLab) and expansions. The base functions are used to configure the multimeter to acquire common values (including selection of range, setup
of resolution and selection of trigger source), to start acquisition and to display
the measured value. The basic functions only support edge triggering and simple
data acquisition (http://www.ivifoundation.org/).
In addition to these basic functions some IVI compatible DMM offer extended
functions such as setup of the Max and Min input frequencies.
General:
When creating the module you must select the logical name of the digital multimeter device. ServiceLab checks all IVI devices installed in the system and
shows them in the pull down list.
Basic Settings
Function:
Voltage:
Current:
Resistant:
Frequency
Period
AC, DC, AC+DC
AC, DC, AC+DC
2 wire, 4 wire
Auto range: This option tells the device to select the measurement range automatically.
Range: If you don’t use the Auto Range function, you must declare a range.
Resolution: Number of digits used in the virtual display of the connected device.
This setting ha no effect on the display of the Digital Meter module in ServiceLab.
Trigger Delay: The time delay after the trigger event to start the measurement.
Timeout:
Checkbox selected: Time after which the single measurement has to be
finished. After that time an error message is displayed.
Checkbox not selected: Uses a very short time for time out (“instant“ Set-
ting)
AC Setting
Specifies the maximum/minimum frequency component of the input signal for AC
measurements. The value of this attribute affects instrument behavior only when
3-68
ServiceLab
Chapter 3: Input/Output Module Group
the IVIDMM_ATTR_FUNCTION attribute is set to an AC voltage or AC current
measurement.
Frequency Setting
Specifies the expected maximum value of the input signal for frequency and period measurements. Positive values represent the manual range. Negative values
represent the Auto Range mode.
The value of this attribute affects instrument behavior only when the
IVIDMM_ATTR_FUNCTION attribute is set to a frequency or period measurement.
The units are specified in Volts RMS.
Measurement Options:
Sample Rate: You can define a module specific sample rate for the DMM hardware that is not affected by the ServiceLab time bases.
Block size: You can define a module specific block size for the DMM hardware
that is not affected by the ServiceLab global block size.
19.
MODBUS Analog Input and Output Modules (optional)
Use this module to acquire data from industry-standard MODBUS
devices .
What is Modbus?
MODBUS® Protocol is a messaging structure developed by Modicon in 1979,
used to establish master-slave/client-server communication between intelligent
devices. It is a de facto standard, truly open and the most widely used network
protocol in the industrial manufacturing environment... For more information
about Modbus please see http://www.modbus.org or check either the Modbus
Library or the FAQs
Supported MODBUS Functions
MODBUS Analog Functions 0x1, 0x3, 0x4, and Digital Functions 0x10, and 0xF
are supported.
MODBUS Analog Input
Input and Output Characteristics
Number of Inputs:
Input Block Size:
Number of Outputs:
Output Block Size:
Max. Number of Modules:
----up to 16
1
any
3-69
MODBUS Analog Input and Output Modules (optional)
ServiceLab
MODBUS Analog Output
Input and Output Characteristics
Number of Inputs:
Input Block Size:
Number of Outputs:
Output Block Size:
Max. Number of Modules:
up to 16
any, but only 1 st sample of block is output
----any
Data type
Specify the type of data returned by the device: The data will need to be scaled
by setting the data range.
Unsigned Int: Data is returned by the device in the range 0 to 65535
Signed Int: Data is returned by the device in the range -32767 to +32768
Data Range
Set the minimum and maximum value (engineering units) returned by the device.
Unsigned Int will return an integer value between 0 … 65535, Signed Int will return an integer value between -32767 … +32768. The integer value is then
scaled based on the Minimum - Maximum range. Select Raw Data to output the
actual integer value.
Device
Address: Specify the address of the attached MODBUS device in hexadecimal
(1… FF).
Register: Specify the Register within the device. Choose 30 or 40 to select the
range 30000 – 300FF or 40000 – 400FF and then select from 1 to FF to specify
the sub range.
Test:
Click on the Test Button to attempt communication and show the data in a pop-up
dialog box.
MODBUS Setup
This dialog box allows you to define the parameters for the COM port used by
ServiceLab. The default settings are COM1, 300 baud, 7 data bits, 1 stop bits, 0
sec. Transmit Delay and 1 sec. Receive Delay.
If MODBUS Input and Output modules use the same COM Port, these settings are
used by all.
Com Port Settings
Com. Port: Specify the communications port to be used. Valid choices are
COM 1 to COM 32. The com port must exist on your computer.
3-70
ServiceLab
Chapter 3: Input/Output Module Group
Baud rate: Define the speed of the communications device from 300 Baud
to 115200 Baud.
Data bits: Define the number of data bits (7 or 8).
Stop bits: Define the number of stop bits (1 or 2)
Parity: Define whether an additional parity bit per character is used.
Choices are even, odd or none.
Enable CTS: Uses the control lines of the serial interface for hardware
handshake.
T ransmit Delay: Specify, in seconds, the delay before the data is transmit-
ted to the MODBUS device.
Receive Delay: Specify, in seconds, the delay after timeout. If a device
does not respond within the specified, ServiceLab will display an error.
Timing
Define the sampling rate for this module in seconds. Timing will be rounded
down to the next appropriate value if the sample rate is too fast.
Error Handling
If a device does not respond within the defined Receive Delay, you can choose
whether to Ignore the Module or Stop Program.
20.
MODBUS Digital Input and Output Modules (optional)
Use this module to acquire digital data from industry-standard
MODBUS device.
What is Modbus?
MODBUS® Protocol is a messaging structure developed by Modicon in 1979,
used to establish master-slave/client-server communication between intelligent
devices. It is a de facto standard, truly open and the most widely used network
protocol in the industrial manufacturing environment... For more information
about Modbus please see http://www.modbus.org or check either the Modbus
Library or the FAQs
Supported MODBUS Functions
MODBUS Analog Functions 0x1, 0x3, 0x4, and Digital Functions 0x10, and 0xF
are supported.
MODBUS Digital Input
Input and Output Characteristics
Number of Inputs:
Input Block Size:
----3-71
MODBUS Digital Input and Output Modules (optional)
Number of Outputs:
Output Block Size:
Max. Number of Modules:
ServiceLab
up to 16
1
any
MODBUS Digital Output
Input and Output Characteristics
Number of Inputs:
Input Block Size:
Number of Outputs:
Output Block Size:
Max. Number of Modules:
up to 16
any, but only 1 st sample of block is output
----any
Device
Specify the Address in hexadecimal (1… FF) of the attached MODBUS device.
Specify the Starting Byte within the device.
Test
Click on the Test Button to attempt communication and show the data in a pop-up
dialog box.
MODBUS Setup
This dialog box allows you to define the parameters for the COM port used by
ServiceLab. The default settings are COM1, 300 baud, 7 data bits, 1 stop bits, 0
sec. Transmit Delay and 1 sec. Receive Delay.
If MODBUS Input and Output modules use the same COM Port, these settings are
used by all.
See page 3-69 for details of each setting.
3-72
ServiceLab
Chapter 4: Trigger Functions Module Group
Chapter 4: Trigger Functions Module Group
Combi Trigger
Pre/Post Trigger
Start/Stop Trigger
x
x
x
Trigger on Demand
Sample Trigger
Relay
optional
Module
Basic
version
This group consists of the modules for software triggers.
x
x
x
4-1
ServiceLab
Combi Trigger Module
1.
Combi Trigger Module
Use this Trigger module for continuous signal supervision It generates a trigger signal at its output based on the input signal
conditions.
The module can keep up to 16 signal inputs and creates a unique TTL compatible
output signal to input to other modules. You can define the number of channels
with the channel bar. All other parameters describe the behavior of the output
signal, under those conditions the output switches to high (5V) or low (0V). The
output may be routed as a control signal to a Relay module, which can be used
cut off the data of all inputs when the control signal is low.
Input and Output Characteristics
Number of Inputs:
Input Block Size:
Number of Outputs:
Output Block Size:
Max. Number of Modules:
up to 8 pairs (data signals)
any, but the same for each pair
number of inputs divided by 2 (TTL signals)
same as input block size
any
Define a start and a stop condition to cut off all uninteresting segments of a signal. When the start condition occurs, the trigger is active and the output signal
switches to high and stays high until the stop condition occurs. You can expand
the time interval of the trigger activity using pre-trigger and post-trigger for samples acquired before the start condition event and after the stop condition event
has occurred. Start and stop conditions can be defined with a minimum time in
which the condition does not switch the trigger activity. This allows application
of time hysteresis and the separation of signal fragments of interest.
Start/Stop Conditions:
Direct
Sample greater than specified level
Sample less than the specified level
Signal rises above the specified level
Signal falls below the specified level
Rising TTL edge
Falling TTL edge
Never (Stop Condition only)
These conditions are completed by real level values.
The Pre-trigger parameter allows you to route the defined number of samples that precede the Start Condition through a Relay. The maximum number of Pre-trigger samples is 8192 and the minimum is zero. Post-trigger
defines the number of samples after the Stop Condition event. You can
choose a Post-trigger count between 0 and 4 million samples.
4-2
ServiceLab
Chapter 4: Trigger Functions Module Group
Minimum duration defines the count of samples the trigger remains active
regardless of the stop condition. The stop condition is ignored until after
the defined minimum duration time.
The Minimum Delay at Low Time defines the time the Start Condition is
ignored after the trigger output switches to low. You can choose both
counts between 0 and 4 million samples.
1.1. Trigger Applications
This trigger module allows you to separate interesting signal segments. You define the signal regions of interest by defining a Start and a Stop Condition. The
trigger may be used in conjunction with a relay and a display module for triggered display as used in oscilloscopes.
Example: Use the Start Condition Signal Grows Above Level 0 and the Stop
Condition Signal Falls Below Level 0, to cut off all negative samples.
You can expand the segment of interest by using pre-trigger and post-trigger values to get information about the input signal transition when passing the Start and
Stop Condition . When you know that nothing can happen for a defined time after
trigger completion, you may lock the Start Condition using the Minimum Delay At
Low State parameter. The same mechanisms may be used when you visualize
fast-acquired periodic signals and need not process every trigger condition. The
Minimum Duration At High State works the same at high state, providing larger
segments of interest.
The Combi Trigger module only operates well when the acquisition rate is
greater than three times the highest signal frequency. Otherwise, checking the
start and stop conditions will create aliasing effects. Usually, applications
must acquire the signal faster than this, so this restriction should not be an
issue.
2.
Pre/Post Trigger Module
Use this module to generate a trigger signal at its output depending on the input signal conditions .
Module Configuration
For each signal input, different range conditions regarding the amplitude or the
slope may be defined. To avoid multiple triggering, define a hysteresis.
4-3
ServiceLab
Pre/Post Trigger Module
Input and Output Characteristics
Number of Inputs:
Input Block Size:
Number of Outputs:
Output Block Size:
Max. Number of Modules:
up to 16 (data signals)
any
same as number of inputs (TTL signals)
same as input block size
any
This module generates a TTL compatible signal at each module output. The output signal is dependent on the trigger conditions defined for the corresponding
module entry. Its value is set too high (amplitude 5) if the trigger condition is fulfilled, and it is set to low (amplitude 0) if the trigger condition fails.
The output signals can be used to control a Relay module that controls the signal
flow.
The Trigger Range defines the range of amplitude values that will cause
the trigger to be set.
The Trigger Hysteresis defines the condition that has to be fulfilled before
a second trigger event will be accepted.
Both conditions consist of two parts: the definition of an amplitude or
slope range, and whether a trigger should be set when the signal is inside
or outside the defined range.
The Pre and Post Trigger Values define how many high values will be set
at the corresponding module output and in which way these values are related to the actual position of the trigger event itself.
The Pre Trigger Value defines how many samples of the output will
be set to high directly before the trigger event.
The Post Trigger Value defines the number of high samples after the
trigger event. The duration of the trigger high phase is simply the
sum of the Pre and Post Trigger Values.
Allowed values are between 0 and 8192 for the pre trigger and between 1
and 65535 for the post trigger.
Unlike the Start/Stop T rigger module, this module allows you to control the signal flow continuously. Also see the Combi Trigger description. It allows you to
control the signal flow continuously based on Start and Stop Conditions.
Trigger Range
The trigger range defines the trigger mode and the upper and lower limits.
If an amplitude trigger is used, the incoming data samples will be checked against
the specified upper and lower trigger value levels.
Inside will generate a high level output if the signal amplitude enters or is
within the specified upper and lower limits, or is equal to these limit values themselves.
4-4
ServiceLab
Chapter 4: Trigger Functions Module Group
Outside will generate a high level output if the signal amplitude leaves or
is outside the specified value range.
If a slope trigger is used, the slope of the incoming data samples is used instead
of the amplitude itself. The slope is calculated as the difference between two
successive samples divided by their time difference. For example: value 1: 3.5,
value 2: 3.6, sampling rate: 100 Hz = 0.01 sec.
Slope:
After the measurement has been started, a trigger event will only be detected and
evaluated if the following conditions are fulfilled:
The defined number of pre trigger values must be available,
For the second and all subsequent trigger events the Hysteresis conditions
must be fulfilled.
2.1. Hysteresis
This option defines the trigger module’s reaction after a trigger event has occurred. Use this function to prevent unwanted multiple triggers.
If Hysteresis is switched off, the trigger will be activated immediately after the defined number of post trigger values has passed the module.
If Hysteresis is switched on, the hysteresis condition must be fulfilled before the trigger will be activated again. The options for Hysteresis definition are the same as for Trigger Range.
4-5
ServiceLab
Start/Stop Trigger Module
3.
Start/Stop Trigger Module
This module controls the entire measurement by generating a
continuous high or low signal at its output that is dependent on
the input signal conditions (amplitude or slope).
This module switches the output signal only once (from high to low, or from low
to high), making it suitable for starting or stopping further analysis of the signal.
Module Configuration
Different trigger conditions and Trigger Ranges may be specified for each signal
input.
Input and Output Characteristics
Number of Inputs:
Input Block Size:
Number of Outputs:
Output Block Size:
Max. Number of Modules:
up to 16 (data signals)
any
same as number of inputs (TTL signals)
same as input block size
any
After the measurement has been started, the signals at the module entries are
checked against the specified T rigger Conditions. If the condition is fulfilled, the
output signal will be switched. Every input sample will then cause a TTL compatible output sample.
The input signal has to be a continuous data stream; triggered data is not valid
In case of a Start Trigger, this value will be low (amplitude 0) before the
condition is fulfilled, and high (amplitude 5) afterwards.
In case of a Stop Trigger, the output signal will be high (amplitude 5) before the condition is fulfilled, and low (amplitude 0) afterwards.
You cannot reset this module during measurement.
The output signals can be used to control a Relay module, which may gate the
signal flow, or as the input of a Stop module, which may stop or pause the measurement.
Trigger Range
The trigger range defines the trigger mode and the upper and lower limits.
If an Amplitude Trigger is used, the incoming data samples will be checked
against the specified upper and lower trigger value levels.
Inside will generate a high level output if the signal amplitude enters or is
within the specified upper and lower limits, or is equal to these limit values themselves.
Outside will generate a high level output if the signal amplitude leaves or
is outside the specified value range.
4-6
ServiceLab
Chapter 4: Trigger Functions Module Group
If a slope trigger is used, the slope of the incoming data samples is used
instead of the amplitude itself. The slope is calculated as the difference
between two successive samples divided by their time difference. For
example: value 1: 3.5, value 2: 3.6, sampling rate: 100 Hz = 0.01 sec.
3. 6 − 3. 5
Slope:
= 10
0 . 01
4.
Trigger on Demand
This module generates TTL Level triggering on the course of the
signal curve, evaluating the dynamics of the signal. By using the
relay module with this trigger, you can rebuild an approximation
of the signal with only few samples .
The parameters define the moment the module gives a TTL High (5V) pulse to
the Output channel.
Input and Output Characteristics
Number of Inputs:
Input Block Size:
Number of Outputs:
Output Block Size:
Max. Number of Modules:
up to 16 (Data signals)
any
same as Input (TTL signals)
same as Input
any
The Trigger function checks the variation of the input data. The defined deviation
interval marks the area in which consecutive values may differ without triggering. The value to compare is the last value that violates the limits of this interval.
At the start of experiment, the first trigger is set and the first received value is
used as reference. If the deviation of the values crosses the limits, two TTL high
values are sent to the output: the first at the previous value, the second at the actual value.
4.1. Trigger Condition
Deviation +/-: XX: This setting defines the allowed deviation of consecutive
values. If the absolute value of the difference of the samples is out of the allowed
limits, the module generates the trigger. Use a small deviation to rebuild the
curve more exactly, but the number of trigger (samples) will increase.
4.2. Option
Check Sign Inversion
This option allows you to check whether the sign of the difference of values (y1 –
y0) changes. If the sign changes, the module generates an additional trigger. So
you can amend the reproduction of curve at the inflection point.
4-7
ServiceLab
Sample Trigger
Do not use this option if the signal is noisy, because each sign inversion would
cause a new trigger.
4.3. Function of the Trigger on Demand
4.4. Function w ithout Check Sign Inversion
4.5. Function w ith Check Sign Inversion
5.
Sample Trigger
This module is used to generate a trigger signal at its output depending on the input signal conditions .
In the worksheet, this module can have up to 16 signal inputs.
4-8
ServiceLab
Chapter 4: Trigger Functions Module Group
The parameters define the moment the module gives a TTL-High (5V) pulse to
the Output channel. The output may is used to control an Action Module to activate a special operation.
Input and Output Characteristics
Number of Inputs:
Input Block Size:
Number of Outputs:
Output Block Size:
Max. Number of Modules:
up to 16 (Data signals)
any
same as Input (TTL signals)
same as Input
any
This Trigger function takes a defined number of samples. Two different modes of
the Trigger allow you to initiate a Trigger at three different moments.
Trigger conditions
Input is:
Greater than threshold value
Less than threshold value
TTL-High
TTL-Low
Is between a defined bound
Is out of a defined bound
You have to define limit values or range of values
5.1. Trigger modes
5.2. Trigger condition is fulfilled by more than XXX values
T rigger moment at start of the Trigger event
Start of the Trigger operation is the moment that the defined Trigger condition is fulfilled. The module will then wait for the defined number of
values. If the Trigger condition is still fulfilled, one TTL-High value is
output out at the moment the condition is fulfilled for the first time. Unless
the condition is fulfilled a new trigger event can start again.
Trigger moment at stop of the Trigger event
Start of T rigger operation is that moment that the Trigger condition is fulfilled. Then the module will wait for the defined number of values. If the
Trigger condition is still fulfilled, one TTL-High value is output at the
moment the condition is no longer fulfilled.
T rigger moment XXX values after start of the Trigger event
Start of the Trigger operation is that moment that the defined Trigger
condition is fulfilled. Then the module will wait for the defined number of
values. If the Trigger condition is still fulfilled, one TTL-High value is
4-9
ServiceLab
Relay Module
output out at the moment the defined number of values is reached. Unless
the condition is fulfilled, a new trigger event can start again.
5.3. Trigger condition is fulfilled less than XXX values
T rigger moment at start of the Trigger event
Start of the Trigger operation is that moment that the defined Trigger condition is fulfilled. Then the module waits for the defined number of values. If the Trigger condition stays unfulfilled during this period, one TTLHigh value is output out at the moment the condition is fulfilled for the
first time.
T rigger moment at stop of the Trigger event
Start of the Trigger operation is that moment that the defined Trigger condition is fulfilled. Then the module will wait for the defined number of
values. If the Trigger condition stays unfulfilled during this period, one
TTL High value is output out at the moment the condition is no longer fulfilled.
T rigger moment xxx samples after start of the Trigger event
Start of the Trigger operation is that moment that the defined Trigger condition is fulfilled. Then the module will wait for the defined number of
values. If the Trigger condition stays unfulfilled during this period, one
TTL High value is output out at the moment the defined number of values
is reached.
6.
Relay Module
This module can control several data streams using one control
input.
This module can have up to 15 signal inputs and one control input.
Input and Output Characteristics
Number of Inputs :
Input Block Size :
Number of Outputs:
Output Block Size :
Max. Number of Modules:
1 control input, up to 15 signal inputs
any
up to 15 (same as signal inputs)
same as input block size
any
Before you insert the Relay module into a worksheet you have to select one of the
allowed function modes.
Choose the first mode where the Relay module controls the data stream from its
signal inputs using its control input. The control signal must be TTL compatible.
4-10
ServiceLab
Chapter 4: Trigger Functions Module Group
If the control signal is TTL high, data at the signal inputs can pass to the
module outputs.
If the control signal is TTL low, the behavior of the module depends on
the settings in Blocked Data. If Remove is chosen, the flow of data will
be stopped; if Replace with Zeroes is chosen, the data not belonging to a
trigger event are replaced with zeroes.
Choose Invert Control Signal to switch the operation of the Relay. TTL
low allows data to pass to the module outputs, while TTL high will stop or
replace the data with zeros, as specified in the dialog box.
With Remove, the Relay module rearranges data blocks in such a way that
it will always try to send out complete blocks of the global block size. If
the control signal switches very quickly, the number of blocks at the output side of the module may be greater than at the input side. The data is
tagged as triggered data blocks, and the number of samples in the blocks
may be smaller than the specified Experiment Setup Block Size.
With Replace with Zeroes set, the Relay module does not rearrange any
data blocks. This setting is very useful to combine triggered data channels
with "normal" data channels. On the other hand there is no data reduction
as with Remove.
The control input is tagged x.
Or, choose the second mode where the Relay module is controlled by
Event Driven Actions. In this mode the module has up to 16 input and output
channels. The behavior (Pass signal or stop data flow) is triggered by an event.
Use the Action module to define the events and action.
The Relay module is useful when combined with the Start/Stop Trigger, the
Pre/Post Trigger, the Time Slice, and the Digital Input modules. It can also be
used in conjunction with the Switch, Logical Operations, and Formula modules to
control the data flow within a worksheet.
4-11
ServiceLab
Chapter 5: Mathematics Module Group
Chapter 5: Mathematics Module Group
Module
Formula Interpreter
x
Arithmetic
x
optional
Basic
version
This group consists of modules that perform mathematical functions.
x
Trigonometry
Scaling
x
Differentiation Integration
x
Logical Operations
x
Bit Logic
x
Channel Coparioson
x
Flip-Flop
x
x
Gray Code
Slope Limitation
x
Reference Curve
x
5-1
Arithmetic Module
1.
ServiceLab
Arithmetic Module
The arithmetic module performs basic calculations with one or
more input signals.
Since this module provides different basic operations, you must first select the
function type when you install the module. This module provides four function
types:
Operation with One Operand: Inverse, square, square root and other calculations.
Operation with One Operand and a Constant Value : Multiplication with a constant value, offset definition and other calculations.
Operation with Two Operands : Basic signal arithmetic including addition and
multiplication of signal values from two channels.
Operation with Two or More Operands: Functions that apply to two or more operands, including addition, AND, OR, minimum, maximum, and mean.
Overview
Once this module is placed onto the worksheet, its module configuration dialog
box will provide only the settings and options for the selected type. If you wish
to specify another type, delete the module and install it again choosing the new
type.
Since this module performs several basic operations, the selection of the module
type also determines the number and function of the module entries. The number
of module entries can be specified using the Channel Bar.
For Operation with One Operand, Operation with One Operand and a Constant
Value and Operation with Two or More Operands, a maximum of 16 module entries is available. Operation with Two Operands allows up to 8 pairs of module
entries.
If illegal calculations occur, such as division by zero, or in case of an overflow,
this will be indicated in all display functions by strings like E_NUM, E_MAX or
E_MIN. However, the running measurement and analysis will not be stopped.
1.1. Arithmetic Operation w ith One Operand
This type performs inverse, square, square root and other calculations on one
channel’s values.
Input and Output Characteristics
Number of Inputs:
up to 16
Input Block Size:
any
Number of Outputs:
same as number of inputs
Output Block Size:
same as input block size
5-2
ServiceLab
Chapter 5: Mathematics Module Group
Max. Number of Modules:
any
This module performs the following (Channel = input signal value):
Function
Output Value
Inverse
Square
Square Root
Absolute Value
exp (x)
ln (x)
lg (x)
log (x)
Sum (x)
Differe nce (x)
NOP
one divided by Channel (reciprocal)
Channel multiplied by itself
square root of the absolute value of Channel
absolute value of Channel
e to the power of Channel
natural (base e) logarithm of the absolute value of Channel
decimal (base 10) logarithm of the absolute value of Channel
binary (base 2) logarithm of the absolute value of Channel
sum of input values (sum of all samples since last reset)
difference from the proceeding input value
Channel (no operation)
Running values can be reset during an experiment using the Event
Driven Actions .
1.2. Arithmetic Operation w ith One Operand and Constant
This arithmetic module performs calculations with one signal and one constant
value, such as multiplication by a constant value.
Input and Output Characteristics
Number of Inputs:
Input Block Size:
Number of Outputs:
Output Block Size:
Max. Number of Modules:
up to 16
any
same as number of inputs
same as input block size
any
The constant value must be entered in the field in the right half of the dialog box.
This module performs the following calculations (Channel = input signal value):
Function
Output Value
Channel = Constant Channel equal to constant
Constant + Channel constant plus Channel
(Subtraction: Add a negative constant)
Constant * Channe l constant multiplied by Channel
Constant ^ Channel constant to the power of Channel
Channel ^ Constant channel to the power of constant
Channel / Constant channel divided by constant
Channel mod (c)
remainder when dividing Channel by constant
Extract bit
TTL compatible high, if the corresponding bit is set for the
represented integer, TTL compatible low otherwise
NOP
output equal to Channel (no operation)
5-3
ServiceLab
Arithmetic Module
1.3. Arithmetic Operation w ith Tw o Operands
This arithmetic module performs calculations with two signals, such as addition
and multiplication of signal values from two channels.
Input and Output Characteristics
Number of Inputs:
up to 8 pairs
Input Block Size:
any
Number of Outputs:
up to 8 (same as input pairs)
Output Block Size:
same as input block size
Max. Number of Modules: any
This module performs the following basic calculations:
Function
Output Value
Channel + Channel Channel 0 plus Channel 1
Channel * Channel
Channel 0 multiplied by Channel 1
Channel – Channel Channel 0 minus Channel 1
Channel / Channel
Channel 0 divided by Channel 1
Channel ^ Channe l Channel 0 to the power of Channel 1
1.4. Arithmetic Operation w ith Tw o or More Operands
This arithmetic module performs calculations with two or more signals, such as
addition and multiplication of signal values from six channels.
Input and Output Characteristics
Number of Inputs:
Input Block Size:
Number of Outputs:
Output Block Size:
Max. Number of Modules:
up to 16
any, but the same for all entries
1
same as input block size
any
This module applies the chosen function to all of the input channels. The result of
the operation is contained in the output signal. All operations are performed
sample by sample.
5-4
ServiceLab
Chapter 5: Mathematics Module Group
This module performs the following basic calculations:
Function
Output Value
Add
sum of all input channels
Multiply
product of all input channels
OR
if any input is high, output is high
AND
if all inputs are high, output is high
Max/Min
maximum or Minimum of all input channels
Mean
the mean value of all input channels
Abs. Value
the square root of the sum of the squares of all input channels
2.
Trigonometry Module (optional)
This module performs trigonometric calculations on the input
signals.
Input and Output Characteristics
up to 16
Number of Inputs:
Input Block Size:
any
Number of Outputs:
same as number of inputs
Output Block Size:
same as input block size
Max. Number of Modules: any
For each module entry one of the following functions can be selected:
Sine / Cosine
The output values are calculated as sine or cosine functions of the input signal
values. The output range is from −1 to 1. Input values greater than 10E7 cannot
be calculated due to rounding errors of the underlying processor functions.
Tangent
The output values are calculated as tangent functions of the input signal values.
The output signal is not bounded.
The tangent function will be defined for all input values except
3π
5π
π
± , ± , ± ,…
2
2
2
ServiceLab will replace these values with values slightly larger or smaller. Input
values greater than 107 cannot be calculated due to rounding errors of the underlying processor functions.
ArcSine / ArcCosine
The output values are calculated as arcsine or arccosine functions of the input
signal values, for example, the inverse functions of sine and cosine. Both func-
5-5
ServiceLab
Scaling Module
tions will only be defined for input values between −1 and 1. For all other values
ServiceLab will set the output value to 0.
ArcTangent
The output values are calculated as arc tangent functions of the input signal values, i.e., the inverse function of tangent.
The arctangent function will be defined for all input values.
Output values will range from −
π
to
π
.
2
2
Hyperbolic Sine / Hyperbolic Cosine / Hyperbolic Tangent
The output values are calculated as hyperbolic functions (sinh, cosh, or tanh) of
the input signal values. They will be defined for all possible input values, but
since they are based on the exponential function the results may cause overflows
or rounding errors.
The definitions of the hyperbolic functions are:
ex − e−x
ex + e−x
sinh( x )
sinh( x ) =
, cosh( x ) =
, tanh( x ) =
.
2
2
cosh( x )
The input signals can either be interpreted as degree or radian values. The appropriate unit must be selected in the dialog box.
3.
Scaling Module
Use this module to apply different scaling methods to the signals
from the module entries .
Since this module provides different basic operations, you must first select the
function type when you install the module.
This module provides three function types:
Linear Scaling with Two Points: Use this type to perform linear scaling.
Interpolation using a Table: Use this type to linearize input data by performing an
interpolation between different values entered in list form.
Thermocouple Linearization : Use this type to perform predefined linearization
for different types of thermocouples.
PT 100 / Ni 100 – Linearization
Offset Adjustment
Overview
Once this module is integrated into the worksheet, its module configuration dialog box will provide only the settings and options for the selected type. If you
wish to specify another type, delete the module first, and install it again choosing
the new type.
5-6
ServiceLab
Chapter 5: Mathematics Module Group
Since this module performs several basic operations, the selection of the module
type determines the number and function of the module entries. The number of
module entries can be specified using the Channel Bar. For all types a maximum
of 16 module entries is available. These can perform different functions of the
same type on the input signals.
If illegal calculations occur, such as division by zero, or in the case of an overflow, this will be indicated in all display functions by strings like E_NUM,
E_MAX or E_MIN. However, the running measurement and analysis will not be
stopped.
Input and Output Characteristics
Number of Inputs :
Input Block Size :
Number of Outputs:
Output Block Size :
Max. Number of Modules:
up to 16
any
same as number of inputs
same as input block size
any
These characteristics are the same for all the three module types.
3.1. Linear Scaling
You can select one of the following types of linear scaling:
Slope and Offset
Values are calculated according to the formula Y = ax + b.
Definition of Two Points
A linear scaling with two reference points (X1, Y1) and (X2, Y2) is performed.
In this case offset and slope are calculated automatically:
a=
Y1 − Y 2
a = (Y1 − Y2) / (X1 − X2)
X1 − X 2
b=
Y 1 − (Y 1 − Y 2 )
∗ X1b = Y1 − (Y1 − Y2) / (X1 − X2) ∗ X1
X1 − X 2
Off
This function does not calculate on the input values except that they may be cut to
the defined upper and lower limits (no operation).
In addition, upper and lower limit values can be defined. If the output signal exceeds these levels, it will be cut to the respective values.
Unit Conversion
Use this option to convert your data value from one unit system to another. You
can convert in the following areas using standard conversion factors.
Temperature
Volume
Pressure
5-7
ServiceLab
Scaling Module
Length
Mass
Velocity
Acceleration
Area
Time
Power
Energy
Force
Density
Flow Rate Volume
Flow Rate Mass
Viscosity
Angle
Bits/Bytes,
Illuminance
Luminance
The unit assigned to the input signal is selected in From:, the target units in To:.
3.2. Interpolation
This module type requires a reference file with pairs of corresponding input and
output values. The file format is explained in detail in Chapter 5 of the User
Guide.
The input values will be interpolated according to the pairs of reference values.
Between these values a piecewise linear interpolation is performed.
If an input value is outside the range defined by the input value table (i.e., by the
maximum and minimum values of the first column), the value corresponding to
the maximum or minimum value of the first column will be output.
The reference file can be entered in the dialog box that appears after pressing the
Open button. The file extension must be .DPF.
You can choose between a one-channel and a multi-channel type of reference
file. If multi-channel is selected, all channels use only one reference file, if onechannel is activated, separate reference files are assigned to each channel. If
there are more channels in the module than are defined in the assigned multichannel reference file, you can use the partitional linearization option to interpolate the channels 0 to number of channels defined in reference file. Extra channels are not linearized (NOP function is activated).
Use the close/open Action to switch between several reference files while measurement is running.
You can specify a standard directory for reference files (Options menu command).
3.3. Thermocouple Linearization
This module type allows the linearization of temperature signals generated by
different types of thermocouples. For proper operation, the data acquisition
hardware must be capable of measuring low voltages, and the correct type of
thermocouple must be used.
ServiceLab uses its own linearization tables, which are slightly different for
each type. The input voltage is converted to a value that represents the temperature in degrees centigrade.
Cold junction compensation can be integrated in different ways:
5-8
ServiceLab
Chapter 5: Mathematics Module Group
Some data acquisition devices allow direct cold junction temperature
measurement. In that case, the cold junction mode should be set to Auto.
ServiceLab will automatically take the cold junction temperature provided by the device.
Manual: The manual setting provides a constant environmental temperature by
heating or cooling the junction point. In this case the temperature can be
passed on to ServiceLab for correction of the temperature value.
Off:
Cold junction compensation can also be switched off completely (the
default setting).
Auto:
3.4. Pt 100/Ni100 Linearization
This module converts the resistance variation of a thermosensitive resistance into
temperature. ServiceLab supports the Pt10 0 and Ni1 00 types. You need data acquisition hardware that enables measurement with thermosensitive resistance and
a constant current source.
The thermosensitive resistance modifies conductivity with temperature. This
conductivity is independent of the type. Depending on the value of the co nstant
current source there is a voltage drop at the resistance. ServiceLab uses
arithmetic rules based on DIN IEC 751 (Pt100) or DIN 43760 (Ni100) to convert a
voltage drop into a value that represents the temperature in degrees centigrade.
You can select one of the following types of linearization:
Pt100 (DIN IEC 751): Choose this function for Pt100 resistance.
Ni100 (DIN 43760): Choose this function for Ni100 resistance.
NOP: This function does not perform calculations on the input (no operation).
To use linearization you must define the current source, Constant Current
Source. Define the current value of your source (0.1 - 10 mA). Default is 0,1
mA.
3.5. Offset Adjustment
The Offset Adjust Scaling Module function is used to zero the data. The incoming
data is corrected by a specified amount. The zero is computed from the data itself, either via action, or computed from the first data block. Using this method,
the block average is used to zero further measurements. Use event driven actions
to reset the zero point.
You can define an .INI file to save the zero-adjustment value. It either can be the
ServiceLab (preset) or an individual INI file that must be entered in the dialog
box.
Different Options settings determine how the zero adjustment value is saved:
Read offset at Start of measurement from INI file: Reads the zero-value
from the defined INI file.
5-9
ServiceLab
Differentiation/Integration Module
Save offset at Stop of measurement in INI file: Stores the current zero set-
ting in the .INI file defined above for later retrieval at the start of a new
measurement.
Store offset in global variable: Save the zero-value with each change, via
an event driven action or optionally after the first data block, into the
specified global variable.
Use first block of data for zero point alignment: Forces an automatic zeroalignment computed from the data of the first data block. This option can
always be used if no signal is available at the start of the measurement.
4.
Differentiation/Integration Module
Use this module to differentiate or integrate a signal value.
Since this module provides different basic operations, you must first select the
function type when you install the module. This module provides two function
types:
Differentiation/Integration, controlled by Action
Differentiation/Integration, controlled by Input
The first mode allows up to 16 data inputs, the second allows up to 15 data inputs and one control input.
4.1. Action Controlled Differentiation/Integration
Input and Output Characteristics
Number of Inputs :
Input Block Size :
Number of Outputs:
Output Block Size :
Max. Number of Modules:
up to 16
any
same as number of inputs
same as input block size
any
This module provides two functions:
Differentiation: For each sample, the slope of the input signal values is calculated
according to the formula
Fehler! Es ist nicht möglich, durch die Bearbeitung von Feldfunktione n
Obje kte zu erstellen.,
where dist is the time delay (∆t) between two samples of the input signal. The
first sample of the output signal will have the same value as the input signal.
Integral: For each sample, the integral of all the input signal values since the beginning of the experiment is calculated according to the formula Fehler! Es ist
5-10
ServiceLab
Chapter 5: Mathematics Module Group
nicht möglich, durch die Be arbe itung v on Feldfunktionen Objekte zu
erstellen.,
where dist is the time delay (∆t) between two samples of the input signal.
Restart after xxx Blocks
In addition to resetting the module (= restart of the calculation) via event-driven
actions, you can trigger a restart depending on the number of processed blocks.
Each function is the inverse of the other.
Running values can be reset during an experiment using the Event
Driven Actions . Note that the reset starts at the beginning of the block, and
the next value output will not be zero, but will be the integral of the next
block received.
4.2. Input Controlled Differentiation/Integration
Input and Output Characteristics
Number of Inputs :
Input Block Size :
Number of Outputs:
Output Block Size :
Max. Number of Modules:
up to 15, with one control input
any
same as number of inputs
same as input block size
any
This module provides two functions:
Differentiation: For each sample, the slope of the input signal values is calculated
according to the formula Yn = X n − X 0 , where dist is the time delay between two
is the number of samples in the calculation insamples of the input signal andn *ndist
terval limited by the start/stop conditions. Xn are the amplitudes of the values
used for calculation.
Integral: For each sample, the integral of all the input signal values since the beginning of the experiment is calculated according to the formula
Yn = ( X 0 + ... + X n ) ∗ dist ,
where dist is the time delay between two samples of the input signal.
Options
Start condition y1 / Stop condition y2
The module becomes reset depending on the selected conditions. If you
use the level crossing conditions you must define a value in the edit field.
At start the output values are Zeros if the mode Difference Quotient is selected. If the condition y1 (=X0) is fulfilled, the calculation starts, if the
condition y2 (=Xn) is fulfilled, calculation is halted and again Zeros are
send to the output channel.
If the condition y1 is reached again during a running calculation, the module
resets to 0 and the 'new' y1 value is used in calculation for the Differ5-11
ServiceLab
Logical Operations Module
ence Quotient.
Restart after xxx Blocks
In addition to resetting the module (= restart of the calculation) based on
the Start/Stop conditions you can trigger a restart depending on the number of processed blocks.
Both functions the Differentiation and the Integration are the inverse of the other.
5.
Logical Operations Module
This module can perform logical operations with TTL compatible
signals .
Input and Output Characteristics
Number of Inputs :
Input Block Size :
Number of Outputs:
Output Block Size :
Max. Number of Modules:
up to 8 pairs or up to 16
any
unary operations: same as number of inputs
binary operations: half the number of inputs
same as input block size
any
This module performs logical operations on the input signals according to the defined function. The output signal is a TTL compatible signal.
When this module is to be inserted into the worksheet for the first time, one of the
following module function types may be selected:
Binary (Two Channel) Functions: FALSE, Channel a, Channel b, a and b, a or b,
a xor b, a => b, b => a, a <=> b, Invert Output
Unary (One Channel) Functions: FALSE, Channel and Invert Output
Once this module is placed onto the worksheet, its module configuration dialog
box will provide only the settings and options for the selected type. If you wish
to specify another type, delete the module first, and install it again choosing the
new type.
Since this module performs several basic operations, the selection of the module
type also determines the number and function of the module entries. The number
of module entries can be specified using the Channel Bar.
The input signal values may differ from the exact TTL high or TTL low levels.
Signals will be interpreted as high if their value is higher than 1.5 and as
low if their value is equal to or less than 1.5.
5-12
ServiceLab
Chapter 5: Mathematics Module Group
The table below indicates the values of the outputs based on the input values and
the selected function.
0 indicates TTL Low (0V), 1 indicates TTL High (5V).
If FALSE is selected, the output is always 0, TTL Low.
Channel:
a:
b:
Option:
6.
Input Value:
0
0
0
1
1
1
0
1
Output Value:
FALSE
0
0
0
0
Channel a
0
0
1
1
Channel b
0
1
0
1
a and b
0
0
0
1
a or b
0
1
1
1
a xor b
0
1
1
0
a implies b
1
1
0
1
b implies a
1
0
1
1
a equivale nt b
1
0
0
1
Bit Logic Module
This module interprets the input values as binary values that are
represented by an input channel with 16 input bits.
The input value has to be in the range from 0 to 65535, which will be converted
to the corresponding binary digits. Incoming values are rounded to integer values. If the range limits are crossed, the value is set to the appropriate limit (0 or
65535).
Since this module provides different basic operations, you must first select the
function type when you install the module.
This module provides three function types:
Mask Bits,
Extract/Combine Bit mask,
Link Channels bit by bit.
The module offers different numbers of input and output channels based on the
selected mode.
Compared to other modules which process digital input values as TTL levels,
this module also uses other values (0 up to 65535).
5-13
Bit Logic Module
ServiceLab
6.1. Bit Operation: Mask Bits
The module allows you to mask the input value as a binary word bit by bit for up
to 16 signal inputs. .
Input and Output Characteristics
Number of Inputs:
up to 16
Input Block Size:
any
same as number of inputs
Number of Outputs:
same as input block size
Output Block Size:
Max. Number of Modules: any
All received data are interpreted as binary digits, defined as 16 bits.
Each input value is processed with three operations. The last two steps may be
disabled.
Mask Bits
Eliminate fixed Zero bits
Shift.
To set the first operation, you can choose bit-by-bit whether the bit is not set (0),
set (1) or stays as received at input. The order of bits in dialog is from the highest (MSB, usually DI-15) on the left up to the lowest bit (LSB, usually DI-0) on
the right.
The second operation allows you to automatically shift the masked binary word
to the left or right, until the LSB or MSB becomes 1. The default setting is no operation.
The third operation offers a defined right or left shift of the word, which was
generated by the previous operations. The default shift value is 0 (no shift).
6.2. Bit Operation: Extract/Combine bit masks
This mode allows you to output a binary word bit by bit as order of TTL Low
(Bit 0) and TTL High (Bit 1) levels or to interpret received TTL levels as single
bits and combine them to a binary value
Depending on the chosen mode, the module offers 1 input channel with up to
16 output channels or up to 16 inputs with only 1 output channel.
Input and Output Characteristics
Number of Inputs:
1 or up to 16, depending on mode
Input Block Size:
any
1 or up to 16, depending on mode
Number of Outputs:
same as input block size
Output Block Size:
Max. Number of Modules: any
In the first mode, Extract Bits , the module interprets incoming values as 16 bits
binary words. You can use 1 input with a maximum of 16 outputs. All bits are
5-14
ServiceLab
Chapter 5: Mathematics Module Group
sent as TTL Low (bit 0, not set) or TTL High (bit 1, set) levels to the output
channels in order of their weight. The order of the bits starts with the lowest bit
(LSB, usually DI-0) sent to output 0 up to the highest bit (MSB, usually DI-15) to
output X. (X=number of channels-1).
In the second mode, Combine Bits, the module needs a TTL level at the input
channels. You can use a maximum of 16 input channels with 1 output. The module forms a binary word using the TTL levels received at the input channels. This
word is sent to the output channel. The level at input 0 is used as the lowest bit
(LSB, usually DI-0), the level at channel X (X=number of channels-1) as the
highest bit (MSB, usually DI-15).
The input signal values may differ from the exact TTL high or TTL low levels.
Signals will be interpreted as high if their value is higher than 1.5 and as
low if their value is equal to or less than 1.5.
6.3.
Bit Operation: Link channels bit by bit
This mode performs logical operations with each bit of the received values on up
to 16 input channels.
Input and Output Characteristics
up to 16
Number of Inputs:
any
Input Block Size:
half the number of inputs
Number of Outputs:
same as input block size
Output Block Size:
Max. Number of Modules: any
This module interprets incoming values as binary words defined by 16 bits. The
data of the two input channels are converted into series of bits and become
linked bit by bit with the chosen operator.
The following operators are available:
6.3.1
for input 0
AND
NAND
for input 1
OR
NOR
XOR
Example: as Input 0 or 1
If this operator is chosen, the bits at output are the same as the bits of the selected
input.
Example:
Value Input 0:
48352
Value Input 1:
14879
Operation:
as Input 1
Output:
14879
Bit No.
(MSB) 15
14
Input 0
1
0
Input 1
0
0
Output
0
0
5-15
ServiceLab
Bit Logic Module
13
12
11
10
9
8
7
6
5
4
3
2
1
(LSB) 0
6.3.2
Value Input 0:
Value Input 1:
Operation:
Output:
Bit No.
(MSB) 15
14
13
12
11
10
9
8
7
6
5
4
3
2
1
(LSB) 0
1
1
1
0
1
0
0
0
0
1
1
1
1
1
48352
14879
AND
14879
Input 0
1
0
1
1
1
1
0
0
1
1
1
0
0
0
0
0
Input 1
0
0
1
1
1
0
1
0
0
0
0
1
1
1
1
1
Output
0
0
1
1
1
0
1
0
0
0
0
1
1
1
1
1
Example: NAND
Example:
Value Input 0:
Value Input 1:
Operation:
Output:
Bit No.
(MSB) 15
14
13
5-16
1
1
1
0
1
0
0
0
0
1
1
1
1
1
Example: AND
Example:
6.3.3
1
1
1
1
0
0
1
1
1
0
0
0
0
0
48352
14879
NAND
49632
Input 0
1
0
1
Input 1
0
0
1
Output
1
1
0
ServiceLab
Chapter 5: Mathematics Module Group
12
11
10
9
8
7
6
5
4
3
2
1
(LSB) 0
6.3.4
1
1
0
1
0
0
0
0
1
1
1
1
1
0
0
0
0
1
1
1
1
0
0
0
0
0
Example Link: XOR
Example:
Value Input 0:
Value Input 1:
Operation:
Output:
Bit No.
(MSB) 15
14
13
12
11
10
9
8
7
6
5
4
3
2
1
(LSB) 0
6.3.5
1
1
1
0
0
1
1
1
0
0
0
0
0
48352
14879
XOR
34559
Input 0
1
0
1
1
1
1
0
0
1
1
1
0
0
0
0
0
Input 1
0
0
1
1
1
0
1
0
0
0
0
1
1
1
1
1
Output
1
0
0
0
0
1
1
0
1
1
1
1
1
1
1
1
Example Link: OR
Example:
Value Input 0:
Value Input 1:
Operation:
Output: 48895
Bit No.
(MSB) 15
14
13
12
48352
14879
OR
Input 0
1
0
1
1
Input 1
0
0
1
1
Output
1
0
1
1
5-17
ServiceLab
Channel Comparator Module
11
10
9
8
7
6
5
4
3
2
1
(LSB) 0
6.3.6
1
1
0
0
1
1
1
0
0
0
0
0
1
1
1
0
1
1
1
1
1
1
1
1
Example Link: NOR
Example:
Value Input 0:
Value Input 1:
Operation:
Output:
Bit No.
48352
14879
NOR
16640
Input 0
(MSB) 15
14
13
12
11
10
9
8
7
6
5
4
3
2
1
(LSB) 0
7.
1
0
1
0
0
0
0
1
1
1
1
1
1
0
1
1
1
1
0
0
1
1
1
0
0
0
0
0
Input 1
0
0
1
1
1
0
1
0
0
0
0
1
1
1
1
1
Output
0
1
0
0
0
0
0
1
0
0
0
0
0
0
0
0
Channel Comparator Module
Use this module to compare a signal input with a constant or another channel
Since this module provides different basic operations, you must first select the
function type when you install the module.
This module provides two function types:
Compare a Channel with a Constant
Compare Two Channels
5-18
ServiceLab
Chapter 5: Mathematics Module Group
7.1. Compare Channel w ith a Constant
The Module compares the input signals with a predefined constant
Input and Output Characteristics
Number of Inputs:
Input Block Size:
Number of Outputs:
Output Block Size:
Max. Number of Modules:
up to 16
any
same as number of inputs
same as input block size
any
Module Settings
The following settings are needed:
Constant: This value is used for comparison.
Condition : This logical condition must be fulfilled to result true (otherwise false):
o
X>Y
o
X=Y
o
X<Y
with X = first channels and Y = second channel of a pair.
Output Values : Here you define the value, that is send to the corresponding output, if the condition is fulfilled (True ) or not ( False ).
Hysteresis: Use the setting in hysteresis to define a range (+/-) the input
may deviate from the constant to meet the condition even so.
7.2. Compare Channel w ith another Channel
The Module compares the input signals of two channels.
Input and Output Characteristics
Number of Inputs:
Input Block Size:
Number of Outputs:
Output Block Size:
Max. Number of Modules:
up to 8 pairs of inputs
any
up to 8
same as input block size
any
Module Settings
The following settings are needed:
Condition : This logical condition must be fulfilled to result true (otherwise false):
o
X>Y
o
X=Y
o
X<Y
5-19
ServiceLab
Flip-Flop Module (optional)
with X = first channels and Y = second channel of a pair.
Output Values: Here you define the value, that is send to the corresponding output, if the condition is fulfilled (True) or not ( False).
Hy ste resis: Use the setting in hysteresis to define a range (+/-) the inputs
may deviate to meet the condition even so.
8.
Flip-Flop Module (optional)
The Flip-Flop Module provides several different flip-flop types.
The number of the inputs depends on the chosen type and is not
separately adjustable. The Flip-Flop Module always has 2 outputs.
Input and Output Characteristics
Number of Inputs:
Input Block Size:
Number of Outputs:
Output Block Size:
Max. Number of Modules:
up to 16
any
same as number of inputs
same as input block size
any
Flip-flops (also referred to as bi-stable trigger elements) are used for the intermediate storage of logical values. The function consists generally, that a flip-flop
changes if a signal is received in the other condition. This condition is held until
another signal changes it.
You must specify whether the incoming data is interpreted as a TTL signal or as
a binary number (16 bit value).
Function
The module provides different types of flip-flops. The number of channels is dependent on the chosen type.
The switch description of a flip-flop is described by a truth table with the following key:
L
:
TTL Low or clear bit
H
:
TTL High or set bit
X
:
insignificant for the behavior
:
last value at this output
Q0
D-Flip-Flop
Inputs: 0
Inputs
5-20
Clock
1
Reset
2
Preset
Outputs
3
Data
ServiceLab
Chapter 5: Mathematics Module Group
Preset
Reset
Clock
Data
Q
Q-bar
L
H
X
X
H
L
H
L
X
X
L
H
L
L
X
X
H
H
H
H
H
H
H
L
H
H
H
L
L
H
H
H
L
X
Q0
Q0
JK-Flip-Flop
Inputs: 0
Clock
1
Reset 2
Inputs
J
3
K
Outputs
Reset
Clock
J
K
Q
Q-bar
L
X
X
X
L
H
H
H
L
L
Q0
Q0
H
H
H
L
H
L
H
H
L
H
L
H
H
H
H
H
switch last condition
RS-Flip-Flop
Inputs: 0
Clear
1
Inputs
Reset
2
Set
Outputs
Clear
Reset
Set
Q
Q-bar
L
X
X
L
H
H
L
L
Q0
Q0
H
H
L
L
H
H
L
H
H
L
H
H
H
Q0
Q0
Mono-flop
A mono-flop is a mono-stable trigger element. When receiving a signal, the
mono-flop switches into an unstable state. This condition holds for the number of
5-21
ServiceLab
Gray Code Module (optional)
the defined samples. After it the mono-flop switches back the initial (stable) state
again.
Inputs: 0 Clear 1 D
Inputs
9.
Outputs
Clear
D
Q
Q-bar
L
X
L
H
H
L
L
L
H
H
H for x Samples, then
back to L
L for x Samples, then back
to H
Gray Code Module (optional)
This module makes possible the direct utilization of Route-/AnglePosition encoder, that uses the Gray code for the positioning information.
Input and Output Characteristics
Number of Inputs:
up to 16
Input Block Size:
any
Number of Outputs:
same as number of inputs
Output Block Size:
same as input block size
Max. Number of Modules: any
The Route-/Angle-Position encoder with Gray code produces a bit pattern that
contains the information about the position
Module Settings
Gray Code Encoder Bit Width
You must specify the resolution of the encoder used (in bits). The number of encoded positions determines the resolution of the encoder; e.g.: 10 Bit = 2ˆ10=
1024 Positions; 14 Bit = 2ˆ14 = 16384 Positions.
Internal Optimization
Speed: ServiceLab calculates the bit pattern of each position and writes it
into a table. The program only has to read the position information from
the table, rather than recalculating it for each new value.
Memory: Use the memory option to force each position to be calculated
for the incoming value. No memory is used to hold the list.
5-22
ServiceLab
Chapter 5: Mathematics Module Group
Scaling: With the Integer Scaling Option you can define Start and End positio n
using the coordinates x1, y1 and x2, y2 . This option can be used if only a part of
the maximum available mechanical encoder moving area is used in the measurement.
Options
These options affect the position calculation:
Absolute Value
The position is calculated as absolute position with the zero point of the
encoder as reference.
Re lative Value
The position is calculated as relative position with the zero point reference set to the encoder position when measurement starts.
Inv ert: Use this option to exchange the start position for the end position.
10.
Slope Limitation Module
This module limits the slope of the input signals.
Input and Output Characteristics
Number of Inputs:
up to 16
Input Block Size:
any
Number of Outputs:
same as number of inputs
Output Block Size:
same as input block size
Max. Number of Modules: any
This module is used to limit the slope of a section of a curve. For example, you
can fade out peaks using this function. If the slope or the difference of the values
is greater than the defined next value is that which is the greatest valid value. To
process the first sample received, you must define a starting value to be used as a
reference.
The following can be used to define the slope:
Difference between two samples: Use this setting to determine whether the difference (distance) of two consecutive values is lower than the Limit setting.
Slope per second: Use the Slope per second setting to Limit the output value. The
slope is computed as the difference of two consecutive values divided by the
time interval (∆t) between them.
Example: 1st value: 3.5, 2nd value: 3.6, Sampling rate: 100Hz = 0.01 sec. ∆t
Slope: 3. 6 − 3.5
= 10
0.01
5-23
ServiceLab
Reference Curve Module
10.1. Additional Amplitude Limitation
Use this setting to limit the maximum or the minimum of the allowed values. All
samples with amplitudes larger or smaller than the defined values are reset to the
maximum/minimum of the tolerable values.
10.2. Global Variables
You can use global variables in all modes to perform the settings. The variable
used as starting value is read once, when measurement starts. All other variables
are re-read at the start of each new block. (3.6 3.5) / 0.01 = 10
Use NOP/OFF to deactivate this module; arriving samples are transmitted to
the output without processing.
11.
Reference Curve Module
This module calculates a Reference (Set Point) curve during a
test run of your application.
These curves are useful to check set points using a tolerance band in the display
modules ( Y/t Chart and Chart Recorder) or in the Check Reference Curve statistics module.
In the worksheet, this module can have up to 16 signal inputs, which are used to
calculate up to 16 different set-point curves.
Input and Output Characteristics
Number of Inputs:
Input Block Size:
Number of Outputs:
Output Block Size:
Max. Number of Modules:
up to 16
any
same as number of inputs
same as input block size
any
11.1. Function
If the NOP function is chosen, the reference curve for that channel will not be
created or used. If the Generate/Update Reference Curve function is chosen, a
new reference curve file is created, or, if there is an existing file with the same
name, the old file will be updated.
Each channel must have an unambiguous file name, which will contain the
data of the reference curve.
This field shows the selected reference curve file and its path for the active
channel (Default setting is defname.dsk). The File... button opens the file
menu.
5-24
ServiceLab
Chapter 5: Mathematics Module Group
If you use an existing reference curve file, the new file is calculated by using
the values of the old file and the newly received values. This way of processing enables the reference curve to be optimized by running several test runs.
If the newly created reference curve is shorter than the old file that is to be
optimized, a warning is displayed.
The Reset Action also controls optimization of a reference curve: The active
reference curve file will be closed and the subsequent data is used to optimize the reference curve.
To create a new reference curve with the same name as an existing file you must
first manually delete the old file (name.DSK).
Record Time: This field defines the recording time of the reference
curves. You can select Seconds , Minutes, Hours or Days for the time
unit. The default setting is until Stop of Experiment: The reference curve
will be recorded until the measurement stops.
Options: If the Read/Write status --> global Variable option is active, the
status is written into the specified global variable. Progress is calculated
in % value.
11.2. Structure of the Reference Curve File
The Reference Curve file is an ASCII type file.
11.2.1 Structure
The first four lines contain general information of the reference curve and data
(Comments in the following example are marked with quotes and are not a part
of the file):
Type = 1000 ”Y/t Data”
Number of Experiments = 19
”Number of test runs used to create/optimize that file”
Sample Distance
= 0.001000
”Sampling rate”
Channel Type = 0
”Channel type (0=Normal)
The following lines contain the concrete data in the following order:
”Time”; ”last value”; ”Sum”; ” Sum of Squares”; ”Max value”;
”Min value”
0,000000;2315789;44.000000;304.000000;4.000000;-4.000000
0,001000;2315789;44.000000;304.000000;4.000000;-4.000000
0,002000;2315789;44.000000;304.000000;4.000000;-4.000000
....
These values are updated for each new test run.
5-25
ServiceLab
Formula Interpreter Module
12.
Formula Interpreter Module
Use this module to perform custom mathematical operations .
This module can read up to 16 inputs channels and process them using the specified mathematical algorithm.
The number of inputs is chosen by the input switch, the number of output channels
by the channel number Selection Bar.
Input and Output Characteristics
Number of Inputs:
up to 16
Input Block Size:
any
Number of Outputs:
up to 16
Output Block Size:
same as input block size
Max. Number of Modules: any
The Formula Interpreter allows you to easily process input data with userdefined formulas. The result of the operation is sent to the specified output channel.
The module allows up to 16 output channels where you can define a different operation for each channel using any of the activated input channels. The operators
can be freely combined according to the specified syntax. You can also choose
standard mathematical functions using the buttons ( general, trigonometry, operators, constants, input) in the module properties box.
12.1. Overview: Mathematical Operands and Functions
Implemented Mathematical Operands;
+
Addition
-
Subtraction
*
Multiplication
/
Division
<
Less than
>
Greater than
>=
Greater than or equal
^
OR
AND
5-26
<=
Less than or equal
Raise to a power
MOD
Modulo remainder
of Division
Logical OR
XOR
Logical XOR
Logical AND
NOT
Logical NOT
ServiceLab
Chapter 5: Mathematics Module Group
Implemented Mathematical Functions:
sin
Sine
log
arcsin ArcSine
sqr
cosh
Hyperbolic Cosine
sqrt
tan
Tangent
abs
arctan ArcTangent
exp
sinh
Hyperbolic Sine
frac
cos
Cosine
trunc
arccos ArcCosine
tanh
Hyperbolic Tangent
round
rand
ln
Logarithm, base e
sign
Logarithm, base ten
Square
Square root
Absolute value
Exponential function
Fractional component
Truncate (integer
component)
Round
Pseudo
random
function
Sign
12.2. Order of Operations
The order of operations defines the sequence of calculation for mathematical operations. User-defined formulas will be processed according to these rules.
The rules are:
Operators
Priority
( )
Functions
NOT
^
*, /, MOD
+, <, <=, >,
<>, =
AND
OR, XOR
1
2
3
4
5
6
>=,7
8
9
(first priority)
(last priority)
5-27
ServiceLab
Formula Interpreter Module
12.3. General Operation
The Formula Interpreter module (FPM) allows you to define a formula, a series
of mathematical operations, to process data received at the input.
The FPM offers a number of strings in which the user defines the desired
operations. The number of strings and the combined number of operations
depend on the number of Output channels activated in Channel Selection
Bar.
The corresponding module symbol in the work area will display the defined number of input (I) and output (O) symbols.
The operations in the string are mathematical and must follow the defined
syntactical rules.
Errors in the formula will cause an error warning to be displayed.
The formula is defined while the FPM is off-line.
As soon as the user presses the OK button or changes focus all defined
formulas are checked for syntactical and logical mistakes.
The FPM will not switch to the on-line phase unless all formulas are defined
correctly.
12.4. Syntax
The Formula Interpreter module works correctly when the defined formulas follow the defined syntactical rules.
Valid inputs are numbers, constants, input channels and the implemented mathematical functions of the FPM.
Available Constants:
PI
π
(3.1415926535)
E
Euler Constant
(2.718281828)
Input channels:
IN(0) … IN(15)
Mathematical functions:
The arguments of the mathematical functions must be enclosed by parentheses.
Functions without arguments (e.g. rand()) require empty parentheses.
Results of comparisons are 0 or 1. To use logical results in subsequent modules, such as the Relay module, you need to multiply by 5 to obtain a TTL
High (>1.5) value.
Example: Module with 4 Output channels
string1
string2
5-28
IN(1)*IN(2)+4*sin(IN(1)*PI)
round(sqr(IN(4))/sqrt(IN(1)))
ServiceLab
Chapter 5: Mathematics Module Group
string3
string4
abs(IN(1)+cosh(IN(3)))
log(IN(1))+ln(IN(3))*arctan(IN(1))
The order of operations defines the sequence of calculation for mathematical operations.
12.5. Mathematical Operands
Blanks between the function and the operators are important.
12.5.1 Addition
Operator:
+
Explanation:
Basic mathematical function of the Formula Interpreter module. Two values, m and n, are added. m and n are floating point values. The result of the Addition function is the sum.
12.5.2 Subtraction
Operator:
-
Explanation:
the reduction of the value by another.
12.5.3 Multiplication
Operator:
*
Explanation:
Multiple addition with the same number.
12.5.4 Division
Operator:
/
Explanation:
Division means multiple reduction of the same
Subtrahend. The divided number is called the Divisor. The number that is divided is called the Dividend. The result is called the
Quotient. The Quotient is undefined if the Divisor is zero.
0
=0
m
for each natural number m.
12.5.5 Greater Than
Operator:
>
Explanation:
(0).
Compare two values: the result is true (1) or false
Example:
6 > 17 - 12
Hint:
:true
Result 1
To use the result in another module, such as the Relay module,
multiply the result by 5.
5-29
ServiceLab
Formula Interpreter Module
12.5.6 Less Than
Operator:
<
Explanation:
(0).
Compare two values. The result is true (1) or false
Example:
5 < 17 + 3
Hint:
:true
Result 1
To use the result in another module, such as the Relay module,
multiply the result by 5.
12.5.7 Greater Than or Equal
Operator:
>=
Explanation:
(0).
Compare two values. The result is true (1) or false
Example:
50 >= 27+ 9 :true
Hint:
Result 1
To use the result in another module, such as the Relay module,
multiply the result by 5.
12.5.8 Less Than or Equal
Operator:
<=
Explanation:
(0).
Compare two values. The result is true (1) or false
Example:
50 <= 27+ 30
Hint:
:true
Result 1
To use the result in another module, such as the Relay module,
multiply the result by 5.
12.5.9 Raise to a Power
Operator:
^
Explanation:
A product built using n times the same multiplicand: mn. m is the Base, n the Exponent.
Example:
2 * 2 * 2 = 23 = 8
12.5.10 Modulo Remainder of Division
Operator:
MOD
Explanation:
When two rational numbers are divided, the MOD
function will give the remainder of the division. When a is not a
multiple of b, the remainder will be non-zero.
Example:
5-30
17 MOD 4 = 1
ServiceLab
Chapter 5: Mathematics Module Group
12.5.11 Logical OR
Operator:
OR
Explanation:
T he OR function compares two statements. The
statement A OR B is true if either statement A or B is true.
Example:
A= 0
B=1
(true)
C=1
(true)
A OR B OR C = 1 (true)
Hint:
(false)
Result 1
To use the result in another module, such as the Relay module,
multiply the result by 5.
12.5.12 Logical AND
Operator:
AND
Explanation:
T he AND function compares two statements. The
statement A AND B is true while statements A and B are both true.
Example:
A= 0
B=1
(true)
C=1
(true)
A AND B AND C = 0
Hint:
(false)
(false)
Result 0
To use the result in another module, such as the Relay module,
multiply the result by 5.
12.5.13 Logical EXCLUSIVE OR
Operator:
XOR
Explanation:
T he XOR function compares two statements. The
statement A XOR B is only true when one of both statements A
and B is true and the other is false.
Example:
C=0
A XOR B = 1
C XOR D = 0
Hint:
12.5.14
A= 0
(false)
(true)
(false)
(false) B = 1
D=0
(false)
Result 1
Result 0
(true)
To use the result in another module, such as the Relay module,
multiply the result by 5.
Logical Negation
Operator:
NOT
Explanation:
T he NOT function negates a statement.
Example:
B=1
NOT A = 1
NOT B = 0
A= 0
(true)
(true)
(false)
(false)
Result 1
Result 0
5-31
ServiceLab
Formula Interpreter Module
Hint:
To use the result in another module, such as the Relay module,
multiply the result by 5.
12.6. Mathematical Functions
12.6.1
Angular Function Sine
Operator:
sin(Argument)
Explanation:
T he Sine of an acute angle α is a trigonometric
function. The sine function is the ratio of the length of the opposite
side to the length of the hypotenuse in a right triangle.
Opposite side
sinα =
Hypotenuse
The argument of the sine function in the Formula Interpreter module is defined in radians. It has no unit. Transform degrees to radians as follows:
α' =
α
180 o
π
sin(0) = 0
sin(3 ∗ π ) = 0
⎛ π⎞
⎛ 3 ∗ π⎞
sin ⎜ ⎟ = 1 sin ⎜
⎟ = -1
⎝ 2⎠
⎝ 2 ⎠
Example:
sin( π) = 0
12.6.2
Angular Function Cosine
Operator:
cos(Argument)
Explanation:
T he Cosine of an acute angle α is a trigonometric
function. The cosine function is the ratio between the length of the
adjacent side and the length of the hypotenuse in a right triangle.
The argument of the cosine function in the Formula Interpreter
module is defined in radians. It has no unit. Transform degrees to
radians as follows:
α' =
α
180 o
Example:
π
cos(0) = 1
cos(π ) = -1 cos(3 ∗ π ) = - 1
⎛ 3 ∗ π⎞
⎛ π⎞
cos ⎜ ⎟ = 0
cos ⎜
⎟ = 0
⎝ 2 ⎠
⎝ 2⎠
5-32
ServiceLab
12.6.3
Chapter 5: Mathematics Module Group
Angular Function Tangent
Operator:
tan(Argument)
Explanation:
T he tangent of an acute angle α is a trigonometric
function. The tangent function is the ratio of the length of the side
opposite the angle to the length of the side adjacent to the angle
in right triangle.
The argument of the tangent function in the Formula Interpreter
module is defined in radians. It has no unit. Transform degrees to
radians as follows:
α' =
α
180 o
π
Example:
⎛ π⎞
tan ⎜ ⎟ = 1
⎝ 4⎠
12.6.4
tan(0) = 0
⎛ π⎞
tan ⎜ ⎟ = 0.57735
⎝ 6⎠
Inverse of Sine Function
Operator:
arcsin(Argument)
Explanation:
T he arcsine is the inverse function of a restricted
trigonometric function. This type of function is also called a cyclical function. The transformation x → f(x) is not unambiguous.
To convert trigonometric functions to inverse functions they must
be restricted to parts of the rational numbers.
f − 1: x a arcsin x
Definition Range:
Range of Nu
mbers:
⎧
π
W=⎨y − ≤
2
⎩
{
D= x
Example:
arcsin(1) =
π
2
arcsin(0) = 0
5-33
ServiceLab
Formula Interpreter Module
12.6.5
Inverse of Cosine Function
Operator:
arccos(Argument)
Explanation:
T he arccosine is the inverse function of a restricted trigonometric function. This type of functions is also called
a cyclical function. The transformation x → f(x) is not unambiguous.
To convert trigonometric functions to inverse functions they must
be restricted to parts of the rational numbers.
f − 1: x a arccos x
Definition Range:
{
Range of Nu
mbers:
{
D= x
arccos(1) = 0 arccos(0) =
Example:
12.6.6
W= y 0 ≤
π
2
Inverse of Tangent Function
Operator:
arctan(Argument)
Explanation:
T he arctangent is the inverse function of a restricted trigonometric function. This type of function is also called
a cyclical function. The transformation x → f(x) is not unambiguous.
To convert trigonometric functions to inverse functions they must
be restricted to parts of the rational numbers.
f − 1: x a arctan x
Definition Range:
Ran
ge of Numbers:
{
D= x −
arctan(0) = 0
π
arctan(1) =
4
arctan(1000) = 0.49968 π
Example:
5-34
⎧
W=⎨
⎩
ServiceLab
12.6.7
Chapter 5: Mathematics Module Group
Hyperbolic Sine
y = sinh(x) =
1
2
(e
x
− e −x
Operator:
)
sinh(Argument)
Explanation:
In contrast to the normal sine function, the hyperbolic sine function is not periodic. The function is symmetric centrally to the coordinate source that is also a changing point. The
inclination of the tangent at zero point is π/4. The function decreases monotonically.
12.6.8
Hyperbolic Cosine
y = cosh(x) =
1
2
(e
x
+ e− x
Operator:
)
cosh(Argument)
Explanation:
In contrast to the normal cosine function the hyperbolic cosine function is not periodic. The function is centrally
symmetric to the source coordinate. In the interval (- ¥,0] the function increases monotonically and in [0,¥) decreases monotonically.
At x = 0, the function reaches the minimum value (y = 1).
12.6.9
Hyperbolic Tangent
Operator:
tanh(Argument)
Explanation:
In contrast to the normal Tangent function, the hyperbolic tangent function is not periodic. T he function decreases
monotonically; all values are between -1 and +1. The function is
centrally symmetric to the source coordinate that is also changing
point. The inclination of the tangent at point zero is π /4. The function decreases monotonically. Straight lines with equations y-1=0
and y+1=0 are asymptotes.
12.6.10 Square Root
Operator:
sqrt(Argument)
Explanation:
T he Square Root of number b is the number a
where a2 = b. The number a is called the Square Root of b.
Definition Range: b ∈ R +
Example:
sqrt(16) = 4
sqrt(9) = 3
5-35
ServiceLab
Formula Interpreter Module
12.6.11 Square
Operator:
sqr(Argument)
Explanation:
T he square of a real number is the number multiplied by itself. The squares of real numbers are never negative.
Example:
sqr(-2) = 4
sqr(3) = 9
12.6.12 Fraction Part
Operator:
frac(Argument)
Explanation:
T he fraction function returns the number with the
digits before the decimal set to zero.
Example:
frac(9.25) = 0.25
12.6.13 Truncate Fraction Part
Operator:
trunc(Argument)
Explanation:
T he truncate fraction function will return the argument as an integer value by truncating the fractional part.
Example:
trunc(9.25) = 9, trunc(-9.25) = -9
12.6.14 Rounding
Operator:
round(Argument)
Explanation:
T he round function will return the argument as an
integer value. Numbers with the fractional component greater than
or equal to 0.5 are rounded to the next greater integer number.
Example:
round(9.51) = 10
round(9.47) = 9
round(-0.5) = 0
round(-0.6) = -1
5-36
ServiceLab
Chapter 5: Mathematics Module Group
12.6.15 Absolute Value
Operator:
abs(Argument)
Explanation:
T he absolute value function returns the absolute
value of the argument. The absolute value of a rational number is
defined as:
Example:
abs(4.3)
abs(-9.25)
= 4.3
= 9.25
12.6.16 Random
Operator:
rand()
Explanation:
T he rand function returns a pseudo random number a (where 0 ≤ a ≤ 1).
Hint:
You need no argument to call this function, however, you must include empty parentheses.
12.6.17 Exponential Function (Euler)
Operator:
exp(Argument)
Explanation:
T he base of the exponential function is the transcendental irrational Number, the Euler constant, e=2.71828…
The argument of the function is the power of the exponential function.
Example:
exp(1)
exp(3)
=e
= e*e*e
= 2.71828…
= 20.0855…
12.6.18 Natural Logarithm
Operator:
ln(Argument)
Explanation:
T he logarithm of x base e is that exponent y with
which you must raise to the power e to get x, where e is the Euler
constant (2.71828…)
For number a
R+, the logarithm function is the inverse function
x
of the exponential function. The result of z = e using the function
ln(z) is the value x.
12.6.19 Decimal Logarithm
Operator:
log(Argument)
5-37
ServiceLab
Formula Interpreter Module
Explanation:
T he Logarithm of x base 10 is that exponent y with
which you must raise to power a to get x.
For the number a
∈
+
R \{1}, the logarithm function is the inverse
x
function of exponential function. T he result of z = 10 using the
function ln(z) is the value x. Base a is the value 10.
12.6.20 Sign Function
Operator:
sign(Argument)
Explanation:
ment.
T he Sign function returns the sign of the argu-
Example:
sign(-5)=-1
sign(5) =+1
12.7. Error messages
Error 1
Type of error:
Explanation:
Example:
Correction:
Error 2
Type of error:
Explanation:
Example:
Error:
Hint:
Correction:
Error 3
Type of error:
Explanation:
Example:
Correction:
5-38
unexpected end
The input string is not complete. The parser detects an unexpected end of input. Is an operand is
missing?
1+…
Insert the missing operand or string: a constant,
an implemented function, a number or an Input
channel.
too many numbers
This error occurs when too many numbers are
defined as operands in the formula.
1+2+3+4+… +n
n > 256
n is the number of operands not the value of
them.
Reduce number of operands (< 256).
no variables permitted
This error occurs when symbols are used as
variables in formula. Place markers for variables
are not allowed in FPM.
3+x*4+y
Delete place markers x and y.
ServiceLab
Error 4
Chapter 5: Mathematics Module Group
Type of error:
Explanation:
Example:
Correction:
Error 5
Type of error:
Explanation:
Correction:
Error 6
Type of error:
Explanation:
Correction:
Error
11
Type of error:
Explanation:
Correction:
Error
18
Type of error:
Correction:
Type of error:
Parameter error
Explanation:
Type of error:
Formula contains a mathematical function without the needed argument.
sin()
Insert the missing argument between the parentheses.
unknown function
Explanation:
An unimplemented mathematical function was
Example:
Correction:
Error
20
This error occurs when illegal combinations of
types are found as operators in the formula: Syntax error!
Check formula for input errors and syntactical
rules.
')' expected
Parentheses are not complete. All opened parentheses must be closed.
Check formula for parentheses mismatches.
Explanation:
Error
19
unknown character
This error occurs when characters used in the
formula are not supported.
ö,ä,ü, etc.
Delete the unsupported characters.
memory error
Free memory is running Low. The Formula Interpreter Module is not able to create the needed
structures to process the formula.
First try to reduce complex formulas. A better
solution is to increase the size of available memory by closing other applications, etc. If this continues to be a problem, contact your distributor.
too many characters
The numbers or function names have more decimal points than allowed.
Review the syntactical rules of FPM and delete
all signs that do not agree with rules.
wrong operator
5-39
Formula Interpreter Module
Example:
Correction:
Error
21
Type of error:
Explanation:
Example:
Correction:
Error
22
Type of error:
Explanation:
Example:
Correction:
Error
26
Type of error:
Explanation:
Example:
Correction:
Error
27
Type of error:
Explanation:
Example:
Correction:
5-40
ServiceLab
found. This error occurs when there is a mistake
in the function name.
sib(IN(1)) instead of sin(IN(1))
Check function names for mistakes.
'(' expected
When using implemented mathematical functions,
you need to use parentheses correctly. The argument of this function must be within parentheses.
The ( may be missing.
sin 0)
Insert missing parentheses.
')' expected
When using implemented mathematical functions
you need to use parentheses correctly. The argument of this function must be within parentheses.
The ) may be missing.
sin (0
Insert missing parentheses.
Input Channel wrong
A maximum of 16 input channels is available in
Formula Interpreter Module. The formula has
used an input channel number greater than 15.
(Range of channels: IN(0) … IN(15)).
IN(18)
Use only available channels (IN(0) … IN(15)).
')' expected
You cannot use another function to calculate the
number of the input.
IN(2+5) instead of IN(7)
The argument of the input operator is only one
number. Replace the string with a single number
(0-15).
ServiceLab
Error
28
Chapter 5: Mathematics Module Group
Type of error:
Input Channel not available
Explanation:
Only activated input channels are allowed in the
formula.
IN(2) is used in formula, but only IN(0) and
IN(1) are activated.
Activate used channels in channel input switch or
delete the operator inside formula.
Internal error
An error has occurred that prevents parsing of
the formula.
Example:
Correction:
Error
7, 8,
9,10,
12, 13,
25,
Type of error:
Explanation:
Error
Type of error:
14,
15,16,
17, 23,
24,
Explanation:
Correction:
Please call your distributor!
Reserved
You tried to use functions that will be implemented in a later version of the Formula Interpreter Module.
Correction:
Please call your distributor!
5-41
Formula Interpreter Module
5-42
ServiceLab
ServiceLab
Chapter 6: Statistics Module Group
Chapter 6: Statistics Module Group
Minimum/Maximum
x
Statistical Values
x
Position in Signal
x
Histogram
x
Regression
x
Counter
x
optional
Module
Basic
version
This group consists of modules performing statistical functions.
Pulse Width Analysis
(PWM)
x
Sort Channels
x
Check Reference Curve
x
6-1
ServiceLab
Min/Max Module
1.
Min/Max Module
Use this module to find minima and/or maxima in the data
stream.
Input and Output Characteristics
Number of Inputs:
Input Block Size:
Number of Outputs:
Output Block Size:
Max. Number of Modules:
up to 16
any
same as number of inputs
1
any
This module checks the incoming data for minima and/or maxima and transfers
the data to the activated output channel. In contrast to the Statistical Values module, which only provides one data point per block, this module recognizes more
than one extreme in a single block.
The Operation switch selects the mode of the activated channel.
Minima: Only minimums are recognized and transferred.
Maxima: Only maximums are recognized and transferred.
Minima and Maxima: The Minimum and Maximum are recognized alternately and transferred.
When the Minima and Maxima mode is chosen, use Start to define which value
(Maximum or Minimum) is the beginning value. When another mode is activated
these fields are grayed out and not available.
1.1. Output mode
Function Value: Only recognized Minima and/or Maxima are transferred
to the module outputs. Between these values are no values put out, so the
data stream will be interrupted by gaps.
T TL Peak: In TTL Peak mode the module outputs are set to a TTL High
level (+5.0) for each recognized Maximum and (or) Minimum of the input
data. 0.0 replaces any other values. In contrast to the Function Value
mode, this mode produces a continuous stream of data without gaps and
shortened blocks. Trigger data or spectral data is not allowed as inputs
for this mode.
The generated block is transferred to the output of the module only if the complete
input function is checked for extremes. Depending on the form of input signal, this
may happen some blocks later.
6-2
ServiceLab
Chapter 6: Statistics Module Group
1.2. Hysteresis
The Hysteresis Range defines a condition that the value must pass through for the
next value to become valid as the next extreme. If the module recognizes a
smaller (mode minima) or a larger (mode maxima) value as the actual hysteresis
limit, this value sets the new hysteresis range.
For example:
Hysteresis =
5
series of values:
2, 9, 5, 6, 1, 8, 7, 10, 3
the following values are sent to the output channel:
Minima:
2,1
9,10
Maxima:
Minima and Maxima: 2, 9, 1, 10
The following values are sent to the output channel in the TTL Peak mode:
Minima Function mode: 5, 0, 0, 0, 5, 0, 0, 0, 0
Maxima Function mode: 0, 5, 0, 0, 0, 5, 0, 0, 0
5, 5, 0, 0, 5, 5, 0, 0, 0
Minima and Maxima:
Value 9 is recognized as maximum but the value 5 is not seen as a minimum because the hysteresis condition isn’t fulfilled. Instead, 1 is recognized as the next
minimum and 8 as the next maximum.
When the Minima or the Maxima mode is chosen, the data value must fall below
(the Maximum minus the Hysteresis value) then rise over (the Minimum plus the
Hysteresis value ) the hysteresis range before the next extreme can be recognized.
1.3. Start Hysteresis
When using the hysteresis range, only values after the first extreme are recognized. That may cause the identification of some irrelevant extremes.
There are two cases:
1. You are looking for a Minimum; the signal starts with a rising edge.
2. You are looking for a Maximum; the signal starts with a falling edge.
6-3
ServiceLab
Statistical Values Module
The picture shows the first case. The first output has to be a Minimum. Depending on the Hysteresis condition, we expect the value 3 as the first value output
from the Min/Max Module. Measuring errors create a relative Minimum at
marker 1, because there is a fulfilled Hysteresis rising edge condition. So the
value at the first marker is sent to the output as an incorrect (not relevant) Minimum.
Use a Start Hysteresis to suppress these effects. The value, used as the Start hysteresis, defines a range through which the measured value has to decrease
(Minimum) or increase (Maximum) after measurement starts, before the value
can be recognized as valid extreme.
The Start Hysteresis is only active until the first extreme is recognized. The value
of the Start Hysteresis must be a positive number, and is independent of the direction the signal changes.
1.4. Start Hysteresis and Reset Asynchronous Action
The analysis of the signal restarts when the Min/Max Module is reset, causing the first
value to be sent to the module output. The Start Hysteresis is again active until the first
extreme is recognized.
2.
Statistical Values Module
Use this module to calculate various statistical parameters of the
input signal.
Input and Output Characteristics
Number of Inputs :
Input Block Size :
Number of Outputs:
Output Block Size :
Max. Number of Modules:
up to 16
any
same as number of inputs
1
any
Operation
Select one of the following statistical parameters to be calculated:
Function
Output Value
Maximum
Minimum
Max Position
Min Position
Mean
6-4
maximum value of the signal
minimum value of the signal
position (time in seconds, or frequency in Hz.) of
the maximum value of the signal
position (time in seconds, or frequency in Hz.) of
the minimum value of the signal
arithmetic mean
ServiceLab
Chapter 6: Statistics Module Group
RMS Value
Variance
Standard Deviation
Median Weight
square mean (Root Mean Square)
1 n
Var = ∑ ( x − x i ) 2 ,
n i=1
where x is the mean value and n is the block size
square root of the variance
Position Xmg in a data block, where the sum of the
amplitude values on the left is equal to the sum of
amplitude values on the right of Xmg.
Mode
Two modes are available:
Running: The specified statistical value will be calculated on the basis of
all the data acquired by that channel from the beginning of the measurement or the last reset event. With every block of data, the statistical
parameter will be updated so that the output always represents the most
recent evaluation of all the data that have been sampled.
Block Based : The output value represents the parameter of the defined
number of blocks only. The specified statistical value will be calculated
separately for each set of blocks. No earlier data samples or calculated
values are taken into account. The output always represents the evaluation
of the most recent set of blocks.
Number of Blocks
Define how many sample blocks will be collected before the specified statistical
parameter is calculated. If the number of blocks, n, is greater than one, the specified statistical operations will be performed on the basis of groups of n input
signal blocks. That number of blocks may range from 1 to 8192. A new output
value will be generated every n blocks.
If the Save number of processed data option is used, the number used to calculate the Maximum, Minimum, or Mean values is stored in a global variable. That
function allows you to check the accuracy of the operation in Running mode.
Running values can be reset during an experiment using the Event
Driven Actions .
3.
Position in Signal Module
Use this block to extract up to 15 single values from the
data block according to their position.
Input and Output Characteristics
Number of Inputs :
1, plus up to 15
6-5
ServiceLab
Position in Signal Module
Input Block Size :
Number of Outputs:
Output Block Size :
Max. Number of Modules:
same as global block size
up to 15
1
any
This module can evaluate one signal channel via one data channel. It can evaluate
position information at up to 15 additional inputs.
Use the Channel Bar to determine the number of position values to be extracted
from the signal and thus the number of outputs of this module.
With this module up to 15 single values can be extracted at various positions
from the incoming data block. Each extracted value can be output via a separate
channel.
The module input to which the incoming data block must be applied is marked
with an X.
Position source specifies the origin of the position information.
Initially, the module has only the input channel. The positions to be evaluated for are specified for each channel at Value / Sample no.
By selecting Inputs, the module is assigned additional inputs. The number
of additional inputs depends on the number of positions to be evaluated.
The positions are then defined by the applied position inputs.
If values beyond the specified limits are applied to the position inputs these values are decreased/increased to the maximum/minimum limit values.
With the item Interpret value as… you determine how the position specification
(i.e., the entry in the value / Sample no. or the value received via the corresponding position input) is interpreted:
With the Sample no. setting, the nth value in the block is isolated and output.
With the context sensitive setting the position specification is interpreted
for time data as time offset and/or for frequency data as frequency line.
For time data, the value in the block will be isolated which corresponds to the elapsed scan time (in seconds) from the start of the
data block.
For frequency data, the value in the block will be isolated at the incoming frequency line (Hz).
6-6
ServiceLab
4.
Chapter 6: Statistics Module Group
Histogram Module
Use this block to calculate the histogram of an input signal .
Input and Output Characteristics
Number of Inputs :
Input Block Size :
Number of Outputs:
Output Block Size :
Max. Number of Modules:
up to 16
any
same as number of inputs
the defined number of classes as specified (plus
fringe classes, if necessary)
any
This module divides the amplitude range up into n equal classes, and the number
of samples with their amplitude values within each class will be counted.
To define a histogram, you must specify an Interval and the Number of Classes.
In addition, you can provide two Fringe Classes for values below and above the
range of values to be classified.
The histogram will be calculated for a group of blocks if the number of blocks
entered in the dialog box is greater than one.
In addition, the output values can be normalized to a reference value.
To display your histogram, use the Y/t Chart with the Bar line style. To
change the line style to Bar, choose the Display menu in the Chart Display
window and select Colors and Lines . The Y/t Chart will process histogram
data automatically.
The output signals of a histogram module cannot be combined with the output of
most other modules, since they are neither time nor frequency related.
Range
Define the range and the classes for the division. Enter the amplitude range here,
which will be divided up into classes, and the number of classes. For example:
The interval from − 5 .0 to 5.0 is to be divided up into 10 classes.
The resulting 10 class boundaries will be:
[− 5, − 4), [− 4, − 3), … [3, 4), [4, 5) .
The left (lower) boundary value is always assumed to belong to the class; the
right (upper) boundary value is already outside that class. In the example above,
the first class will contain the values from − 5 (inclusive) to lower than − 4; the
second class will contain the values from − 4 (inclusive) to lower than − 3, and so
forth.
If two additional fringe classes are generated, they will cover all the values below and above the range. In the example above, the lower fringe class will con-
6-7
ServiceLab
Regression Module
tain all the values between −∞ and lower than − 5; the upper fringe class will
contain all the values between 5 (inclusive) and ∞.
Block Count
To calculate a histogram over a long period, use this option to specify the number of blocks to be grouped in one histogram. The number of blocks may range
from 1 to 8192 .
Normalization
The Normalization option allows the scaling of the histogram module’s results, so
that the results of different measurements can be compared.
If Normalization is enabled, the result can be scaled with respect to the
maximum of the histogram or with respect to the total number of counted
samples. The histogram will be weighted with a factor so that the maximum or the total sum will be equal to the defined reference value.
For example: If you want to have the result in a percent scale, set the sum
value to 100. The resulting histogram will contain the percentage of samples in the specified classes.
If Normalization is turned off , the result will simply be the number of
samples in each class.
5.
Regression Module
This module will create an output signal that contains a signal
with the linear regression line or with the mean value of the input
signal for each block.
Input and Output Characteristics
Number of Inputs :
Input Block Size :
Number of Outputs:
Output Block Size :
Max. Number of Modules:
up to 16
any
same as number of inputs
same as input block size
any
The Constant Regression option calculates the mean of an input block and supplies a block of the same length with this constant at the corresponding output.
The Linear Regression option calculates the linear regression line of a block and
supplies a signal that represents this line at the corresponding output.
Regression: Order of Regression Polynomial
You can select the order of the polynomial. The maximum is 20.
A polynomial of Order 0, Constant Regression , calculates the average of the
values of one block. The result is sent to the output (all values of the output block
are the same). The result of the function is always a constant.
6-8
ServiceLab
Chapter 6: Statistics Module Group
The polynomial of Order 1, Linear Regression, calculates the straight line that
has the smallest distance to all measured points (Least Squares Method).
All polynomials of Order 2 and more adapt the calculated course of the signal to
the measured points. The higher the order, the better the curve will fit to the real
signal. But as the order increases, so does the computation time to make the calculation of the final approximation function and the time to process a block
through the module will increase.
A useful application of the module is only possible if the selected size of block
is at least 1 larger than the order of the selected polynomial.
Example:
The following curves are created using the listed values of x/y:
xvalues
1 2 3 4 5 6 7 8 9
10 11 12 13 14 15 16
yvalues
1 3 2 4 5 3 6 7 10
9
1st Order Polynomial
(linear Regression).
11 13 11 10 13 10
2nd Order Polynomial
6-9
ServiceLab
Counter Module
5th Order Polynomial
6.
9th Order Polynomial
Counter Module
This module supplies different counting algorithms.
Input and Output Characteristics
up to 16
Number of Inputs :
Input Block Size :
any
Number of Outputs:
same as number of inputs
Output Block Size :
1 or same as input block size
Max. Number of Modules: any
This module provides different options for counting events like falling or rising
edges, samples, blocks and duration. You can specify whether the result is to be
provided at the output as a single value for each block or as a block of the same
length as the input signal, representing the current count for each sample.
These events can be counted:
Function
Output Value : the current number of…
6-10
Blocks
…
Samples
…
Rising Edges
…
Falling Edges
…
Time for Input High
…
Time for Input Low
…
blocks
samples
edges from TTL Low to TTL High, i.e., signal
changes from < 0.8 to > 2.0
edges from TTL High to TTL Low
seconds since start with level > 1.5
seconds since start with level ≤ 1.5
ServiceLab
Chapter 6: Statistics Module Group
peaks in the signal
Minima
…
negative peaks in the signal
Extrema
…
extremes (minima and maxima) in the signal
Zero Crossing
…
sign changes in the signal
Level Events
…
see below
When this function is chosen, samples will be compared with a defined Level.
The type of comparison is shown in window beside this item.
Available Events are:
Level Crossings:
number of samples that crossed the defined
level
Signal increase Level:
number of samples that rose above the defined level
Signal decrease Level:
number of samples that fell below the defined level
Signal reaches maximum Level: number of samples that reached or fell below
the defined level
Signal reaches minimum Level: number of samples that reached or rose
above the defined level
Count
Mode
can
be
set to Running or Block Related in the dialog
In addition, the
box.
In Running mode, the count results will be calculated on the basis of all
the data that have been acquired by the channel since the beginning of the
measurement or since the last Reset Action .
In Block Related mode, only the events in the current block will be
counted.
Use Output Mode to specify how the result is to be provided at the output,
As a Single Value for each block, or
As a Block of the same length as the input signal, representing the current
count for each sample.
Maxima
…
Running values can be reset during an experiment using the Event
Driven Actions .
6-11
Pulse Width Analysis Module (optional)
7.
ServiceLab
Pulse Width Analysis Module (optional)
This module statistically evaluates pulse-width-modulated
(PWM) signals. The value to be computed can be chosen for
each channel: frequency (hertz), pulse duration (s), S, pause
duration (S) or pulse/pause relationship (%).
Input and Output Characteristics
up to 16
Number of Inputs:
Input Block Size:
any
same as number of inputs
Number of Outputs:
same as input block size
Output Block Size:
Max. Number of Modules: any
The module can examine the input signal for four different values. All samples
initially will output zero until the first measurement is computed. The initial
value is held until a new measurement is completed for the defined size.
You can choose from:
Measurement
Frequency: Frequency measurement takes place between two rising edges of the
input signal, i.e. the output is updated after each rising TTL-edge.
Pulse Duration : The Pulse duration is computed after each falling edge.
Pause Duration: The Pause duration is computed after each rising edge.
Pulse-Pause Relationship: The Pulse-Pause relationship is computed after each
edge.
Calculation Borders
A restriction can be defined n which time period an edge must appear. If no edge
appears at the input in the time specified, the signal is assumed to be constant.
In this case, the Frequency and the Pulse-Pause relationship are zero.
For pulse-duration and pause-duration:
If the input has a TTL-High signal, then the value is continuously increased for the
pulse-duration (and is not held), the pause duration value is zero.
If the input has a TTL-Low signal, the value is increased continuously for the
pause-duration (and is not held); the pulse duration value is zero.
The time interval can amount also to several days, you can choose from seconds,
minutes, hours or days.
Set the sampling rate so that the smallest pulse (as well as the smallest pause)
to be measured contains as many samples as needed for the required resolution. The sample rate has to be at least twice as big is as the largest frequency
6-12
ServiceLab
Chapter 6: Statistics Module Group
that you expect to measure.
8.
Sort Channels (optional)
This Module sorts the values of several channels in increasing or
decreasing order. .
Input and Output Characteristics
Number of Inputs:
Input Block Size:
Number of Outputs:
Output Block Size:
Max. Number of Modules:
2, up to 16
any
same as number of inputs
same as input block size
any
The Module analyses the values at the inputs and sorts them to the output channels.
Sort mode:
Ascending:
Descending:
9.
value at output 0 is the lowest value
value at output 0 is the highest value.
Check Reference Curve Module
This Module is able to compare an incoming data stream with a
previously stored Reference curve. The module processes up to 16
separate channels with assigned Reference curves. Each input
channel gets an output channel, which outputs the result of comparison.
Input and Output Characteristics
up to 16
Number of Inputs:
Input Block Size:
any
Number of Outputs:
same as number of inputs
same as input block size
Output Block Size:
Max. Number of Modules: any
9.1. Settings
In the Reference curve file, the active reference curve for the active channel is
shown. If there is no file selected (Entry: DEFAULT.DSK), use the File... button
to open the file menu to select the desired file (*.DSK).
6-13
Check Reference Curve Module
ServiceLab
If there is no existing Reference curve file, you first have to create it using the
Reference Curve module in a test run of your experiment.
The Tolerance band option modifies the way the tolerance bands is created,
based
on
the
data
stored
in
the
set
point
file.
The following options are available:
Use upper tolerance band
Use lower Tolerance band
You can select the way that the data is compared with the Reference curve:
Min/Max: If the actual value exceeds the maximum curve or under runs the
minimum curve the preset Output values are sent to the output channel.
Reference curve ± x %: If the actual value deviates by the defined percentage, the preset Output values are sent to the output channel.
Reference curve ± (constant + x %): If the actual value deviates by the defined percentage ± a constant, the preset Output values are sent to the output channel.
Reference curve ± constant: If the actual value deviates by the defined constant value, the preset Output values are sent to the output channel.
Reference curve ± (n * Standard Deviation): if the deviation of the actual
value is greater than n * Standard Deviation, calculated with the values of
the Reference curve, the preset Output values are sent to the output channel.
The constant used in some of the options above has to be defined in the entry
field Constant.
The output settings define the values that are sent to the output channels if the defined limits are obeyed, exceeded or under run.
9.2. Tolerance Band
The following Chart explains the tolerance band item.
All values between the limits of the tolerance bands are accepted. Other values
modify the values at the output channels, depending on the output settings.
6-14
ServiceLab
Chapter 6: Statistics Module Group
9.3. Min/Max Curve
The following Chart shows how the Min and Max curves calculated by the Ref-
erence Curve module are used as upper and lower tolerance limits.
9.4. Reference curve ± %
This kind of evaluation adds or subtracts xx Percent of the Reference value to
the Reference value to get the upper and lower limit.
9.5. Reference curve ± (Constant + %)
This kind of evaluation adds or subtracts xx Percent of the Reference value and a
predefined Constant to the Reference value to get the upper and lower limit.
9.6. Explanation Reference Curve ± Constant
This kind of evaluation adds or subtracts a predefined Constant to the Reference
value to get the upper and lower limit.
6-15
Check Reference Curve Module
ServiceLab
9.7. Reference Curve ± n * Standard Deviation
This kind of evaluation adds or subtracts a multiple of the Standard Deviation,
calculated with all test runs of the experiment, to the Reference value to get the
upper and lower limit.
Standard Deviation is calculated as follows:
σ=
6-16
1 n
(x − x i ) 2
∑
n i =n
ServiceLab
Chapter 7: Signal Analysis Module
Chapter 7: Signal Analysis Module
optional
Module
Basic
version
This group consists of modules performing frequency analysis.
Filter
x
Correlation
x
Data Window
x
FFT
x
Polar/Cartesian Coordinates
x
Electric Characteristics
x
Harmonic Distortion
x
Period Check
x
7-1
ServiceLab
Filter Module (optional)
1.
Filter Module (optional)
This module provides digital signal filtering with infinite impulse
response filters.
Input and Output Characteristics
Number of Inputs :
Input Block Size :
Number of Outputs:
Output Block Size :
Max. Number of Modules:
up to 16
any
same as number of inputs
same as input block size
any
The filters in ServiceLab are stable IIR filters with very steep slopes. These filters are used to cut off certain frequency components from the time signal. They
are easy to implement and to use, but their disadvantage, compared to analog filters, is that they cannot be used as anti-aliasing filters. Any anti-aliasing filters
must be applied before A/D conversion.
ServiceLab provides several digital filters of different type, characteristics, order and quality with adjustable cut-off frequency.
The Filter Type determines the transfer function of the filter. You can
choose between Lowpass and Highpass filters. Using a combination of
lowpass and highpass filters, you can create Bandpass and Bandstop filters. Additionally, you can switch off filtering without removing the module (no operation).
The Filter Characteristics that can be selected are Bessel, Butterworth and
Chebyshev with different ripples.
Filter Characteristics
Bessel filters are characterized by a small overshooting in their step response, and very low steepness.
Butterworth filters are maximally flat, with an extremely small passband
ripple and medium steepness. They show a strong overshooting in their
step response, and their transfer function in the passband is nearly constant.
Chebyshev filters have a defined passband ripple. Compared to the other
types they have the greatest steepness. The ripple in the passband can be
set to either 0.5 dB or 2 dB.
Filter Types
Lowpass filters are important in many signal analysis applications. They
cut off or damp high frequencies, while lower frequencies can pass the
filter nearly unchanged.
7-2
ServiceLab
Chapter 7: Signal Analysis Module
Digital lowpass filters cannot be substituted for analog anti-aliasing
filters because aliasing is an effect of the digitalization and not of the
subsequent analysis.
Highpass filters are the inverse of lowpass filters. They damp low frequencies and allow frequencies above the defined cut-off frequency to
pass through unchanged.
Off: This switch turns digital filtering off without removing the filter module from the worksheet (no operation).
Cut-off Frequency
For all the filter types, the Cut-off Frequency defines the frequency at which the
damping of the filter is exactly 3 dB. Damping beyond this frequency is dependent on the filter type and the defined order of the filter. The frequencies that can
be used depend on the global sampling rate. Only frequency values within the
following range can be set:
0.001 FN < f g < 0.9 FN.
FN is the Nyquist frequency (the sampling rate divided by two) and f g is the defined cut-off frequency. To avoid stability problems during calculation and application of the filters, ServiceLab allows a frequency range that is smaller than
theoretically possible. If values outside this range are entered, ServiceLab will
prompt with a message and turn off the filters completely. The measurement will
not be interrupted.
Filter Order
The filter order defines the number of poles of the filter. Increasing the number of
poles increases the steepness, but at the same time increases the phase shift.
The maximum order for lowpass and highpass filters is 10 .
2.
Correlation Module (optional)
This module performs the calculation of correlation functions
and coefficients and the application of the power cepstrum .
Since this module provides different basic operations, you must first select the
function type when you install the module.
This module provides two function types:
Correlation Coefficient and Cross Correlation
Auto correlation and Cepstrum
Once this module is integrated into the worksheet, its module configuration dialog box will provide only the settings and options for the selected type. If you
wish to use another type, delete the module first, and install it again, choosing the
new type.
7-3
ServiceLab
Correlation Module (optional)
Because this module performs several basic operations, the selection of the
module type determines the number and function of the module entries.
2.1. Correlation Coefficient and Cross correlation
Input and Output Characteristics
Number of Inputs :
up to 8 pairs
Input Block Size :
any; the block sizes of pair members must be
identical
Number of Outputs:
same as number of inputs
Output Block Size :
1, or same as input block size
Max. Number of Modules: any
In the module configuration dialog box you can choose which of the two functions to apply to the signal of the selected channel.
The Correlation Coefficient of the input signal pair is a single value for
each block, between −1 and 1.
Values near 1 represent a good correlation; the input signals are of
similar shape.
Values near 0 mean that there is no correlation.
Values near −1 represent a good anti-correlation.
The result of Cross Correlation is a full block for each signal input block.
Each one represents the correlation function. The first value is equal to
the correlation coefficient; the other values are the correlation coefficients for the periodically shifted signals. The time shift is used as the abscissa of the correlation function.
2.1.1
Definition: Correlation
The (discrete) correlation coefficient over (a block of) two signals X and Y is
defined as:
Corr (X , Y ) =
∑ (X
(i )
− X x ) ∗ ( Y(i ) − Yy )
i
∑ (X
i
(i )
− X x ) 2 ∗ ∑ ( Y(i) − X y ) 2
i
with
the sum over index i from 0 to block size -1
X[i] = value of first signal at position i
Xx = sum(X[i])/block size = mean value of first signal
Y[i] = value of second signal at position i
Xy = sum(Y[i])/block size = mean value of second signal
7-4
ServiceLab
Chapter 7: Signal Analysis Module
The correlation coefficient measures "how similar two signals are", i.e.
Corr(X,X) = 1, Corr(X,-X) = -1, and Corr(X,Y) = 0 if the signals are "completely different". It is always in the range of -1 .. 1.
2.1.2
Definition: Crosscorrelation
The cross correlation of two signals is a series of correlation coefficients and is
defined as:
Cross[0] := Corr(X,Y)
Cross[1] := Corr(X,YR1)
...
Cross[j] := Corr(X,YRj)
where
YRj is the signal Y rotated in the block by j positions i.e. YRj[i] = Y[(i+j)
modulo block size]
The Autocorrelation of a signal is defined as the cross correlation with itself.
This implies AutoCorr[0] = 1 for any signal.
2.2. Auto Correlation and Cepstrum
Input and Output Characteristics
Number of Inputs :
Input Block Size :
Number of Outputs:
Output Block Size :
Max. Number of Modules:
up to 16
any; the block sizes of pair members must be
identical
same as the number of inputs
same as input block size
any
This module performs the calculation of correlation functions and coefficients as
well as the application of the power cepstrum.
Since this module provides different basic operations, you must first select the
function type when you install the module.
This module provides two function types:
Autocorrelation is the cross correlation of an input signal with itself; the
same signal is used for both inputs.
With the Autocorrelation function it is possible to detect an inherent periodicity in the signal itself. High values represent a similarity of the signal with its shifted copy. The Autocorrelation function is scaled so that its
first value is 1.
It is calculated as the inverse Fourier transform of the signal's power
spectrum.
7-5
ServiceLab
Data Window Module (optional)
The Cepstrum function is used to detect echoes or multiplicative superpositions in the signal, especially in speech analysis. The Cepstrum function
is scaled so that its first value is 1. It is calculated as the inverse Fourier
transform of the signal's logarithmic power spectrum.
3.
Data Window Module (optional)
This module prepares data for further analysis, especially by an
FFT module .
Input and Output Characteristics
Number of Inputs :
Input Block Size :
Number of Outputs:
Output Block Size :
Max. Number of Modules:
up to 16
any
same as number of inputs
same as the defined vector size
any
This module prepares data for further analysis:
It changes the block size so that an FFT module can be provided with appropriate block sizes (powers of two).
The Windowing module represents a buffer that can store blocks or parts
of blocks. The output block size is independent of the input block size and
equal to the defined vector size .
It can weight the incoming blocks with different window functions. The
effect of discontinuities at the edges of the analysis interval on the FFT
result will be diminished by this weighting (leakage effect).
ServiceLab provides a number of different window vectors. Each of them
is characterized by certain advantages and disadvantage. There is no
ideal general-purpose window, and we can only give some rough hints
concerning their characteristics and suitability in the list of Window
Types (see page 7-7).
Generally speaking, a window vector damps the side lobes of singular
spectral lines, which is a desired effect, but it also widens the main lobe,
which is an unwelcome effect, since it reduces the spectral resolution and
the dynamics of the spectrum.
Some of the window types need an additional parameter for definition.
This value is dependent on the window type itself. You will find further
details in the comprehensive table of Window Specifications (see page 79).
You can also activate Amplitude Correction.
In the Overlap Adjustment box you can specify the overlap for a FFT. If
the overlap is greater than 0, the defined number of samples will be in7-6
ServiceLab
Chapter 7: Signal Analysis Module
cluded in the next block. This causes the module to release more data at
its output channels than it receives at its input channels. Overlap is entered in samples.
The windowing is performed after overlapping. A reasonable value for
the overlap is the block size divided by two. However, the decision as to
which is the best value depends on the window function that is used.
3.1. Window Types
The following Window Types are provided by ServiceLab:
Rectangle
Tukey
Poisson
Bartlet (Triangle)
HanningHamming
Poisson
Hanning
Cauchy
Power of Cosine
Gauss
Blackman
Blackman-Harris Flat top
Rectangle Window
This window type does not change the signal at all. Use it if you are only using
this module to change the block size of your signal.
Bartlet Window
This window type weights the signal block with a triangle function, which is a
piecewise linear function that is 0 at both ends of the block and 1 in the middle.
Hamming Window
This window type weights the signal block with a Hamming function. It may be
regarded as a modified Hanning window. It is implemented as a cosine function
with an offset of 0.08. It does not remove the discontinuities completely.
Hanning Window
This window type weights the signal block with a Hanning function, which is a
cosine square wave. This window corresponds to the Power of Cosine window
with the parameter 2. It is one of the more frequently used windows with a wellbalanced effect on the damping of the side lobes and the widening of the main
lobe.
Power of Cosine Window
This is a generalization of the Hanning window. To define it completely, the exponent must be specified. Frequently used values for the exponent are 1, 2, 3, and
4. Increasing the exponent results in a weighting vector that decreases faster at
7-7
Data Window Module (optional)
ServiceLab
the boundaries. The damping of the side lobes will be better, but the main lobe
will be wider; so the frequency resolution of the spectrum may be lower.
Blackman Window
The Blackman window is a corrected Hamming window with an additional cosine term. It damps the side lobes better than the Hamming window.
Blackman-Harris Window
This is a refined modification of the Blackman window with cosine terms up to
the fourth order. In general, its effects are more balanced than those of the
Blackman window, but it is more complex to calculate.
Tukey Window
The Tukey window is a combination of the Rectangle and the Power of Cosine
windows. It does not influence the amplitude of the time signal in the middle of
the transfer block, so the main part of the signal energy and of the information in
the signal is preserved.
The necessary parameter may vary between 0 and 1. It defines the size of the
constant part of the window vector. A parameter equal to 0 yields the cosine
window, while a parameter equal to 1 results in a rectangle window.
Poisson Window
The defining function of the Poisson window is a two-sided exponential:
−α n
w( n ) = e
N
2
⏐ n⏐ ≤ N/2 .
The parameter (α) determines the damping at the boundaries of the analysis interval. Reasonable values for α are between 1 and 10.
Hanning-Poisson Window
The defining function of the Hanning-Poisson window is the product of the two
functions of Hanning and Poisson. Reasonable values for the parameter (α) are
between 1 and 10.
Cauchy Window
The Cauchy window, which is not used very often, is calculated according to the
formula:
1
w( n ) =
⏐ n⏐ ≤ N/2.
1 + α( 2Nn )2
Gauss Window
The basis of the Gauss window is the Gauss normal distribution function:
−2 (α n )2
N
w( n ) = e
⏐ n⏐ ≤ N/2.
7-8
ServiceLab
Chapter 7: Signal Analysis Module
Reasonable values for the parameter (the deviation value α) are between 0 and
10.
Flattop Window
This kind of window is useful for calibrating data because it causes only small
divergences in amplitudes.
In most cases the user will prefer the Hanning Window, because its bandwidth is
smaller (factor 2.5).
The Flattop Window is calculated as follows:
ω(t) = 0.2395 – 0.4581*cos( 2*π*t/T ) + 0.2585*cos(4*π*t/T) –
0.0439*cos(6*π*t/T) if 0≤t<T
otherwise ω(t) = 0
3.2. Window Specifications
The following table lists some of the values characterizing the different window
types.
Some of these window types need an additional parameter for definition. Its
value depends on the window type itself.
Window
Function
Parameter
Rectangle
−−
−13
−6
0.89
1.00
Bartlett (Triangle)
−−
−27
− 12
1.28
0.50
Hamming
−−
−43
−6
1.30
0.54
Hanning
−−
−32
− 18
1.44
0.50
1.00
2.00
3.00
4.00
−23
−32
−39
−47
− 12
− 18
− 24
− 30
1.20
1.44
1.66
1.86
0.64
0.50
0.42
0.38
Blackman
−−
−58
− 18
1.68
0.42
Blackman−Harris
−−
−92
−6
1.90
0.36
0.25
0.50
0.75
−14
−15
−19
− 18
− 18
− 18
1.01
1.15
1.31
0.88
0.75
0.63
Power of Cosine
Tuke y
Side Side 3 dB Width
Lobe Lobe of Main Lobe
Level Slope (multiples of
(dB) (dB/Oct resolution)
)
Amplitude
Damping
7-9
ServiceLab
Data Window Module (optional)
Window
Function
Parameter
Side Side 3 dB Width
Lobe Lobe of Main Lobe
Level Slope (multiples of
(dB) (dB/Oct resolution)
)
Amplitude
Damping
Poisson
2.00
3.00
4.00
−19
−24
−31
−6
−6
−6
1.21
1.45
1.75
0.44
0.32
0.25
Hanning−
Poisson
0.50
1.00
2.00
−35
−39
−−−
− 18
− 18
− 18
1.54
1.64
1.87
0.43
0.38
0.29
Cauchy
3.00
4.00
5.00
−31
−35
−30
−6
−6
−6
1.34
1.50
1.68
0.42
0.33
0.28
Gauss
2.50
3.00
3.50
−42
−55
−69
−6
−6
−6
1.33
1.55
1.65
0.51
0.43
0.37
Flattop
--
-70
−2
3.38
0.24
3.3. Vector Size
The Windowing module can process signals of any input block size. The output
block size will always be the defined vector size. Since this module is generally
used in combination with the FFT module, which needs a power of two block
size, these values are predefined. The vector size may vary between 16 and
32,768.
Any other vector size can be used when the power of two value is not
needed, but you cannot perform a FFT with these blocks.
3.4. Amplitude Correction
Since every weighting function except the rectangle has an integral less than one,
its application causes lowering of the signal’s energy by a factor that equals its
integral. If Amplitude Correction is switched on, this effect will be compensated
for by a multiplication of the spectrum with the same factor.
7-10
ServiceLab
4.
Chapter 7: Signal Analysis Module
Fast Fourier Transform Module (optional)
This module provides different algorithms for spectral analysis.
Since this module provides different basic operations, you must first select the
function type when you install the module.
This module provides four function types:
Real FFT of a Real Signal
Complex FFT of a Real Signal
Complex FFT of a Complex Signal
Cross Spectrum of Two Real Signals
Once the module is integrated into the worksheet, the module configuration dialog box will provide only the settings and options for the selected type. If you
wish to use another type, delete the module first, and install it again then choosing the new type.
Since this module provides several basic operations, the selection of the function
type also determines the number and function of the module entries. For the Real
FFT of a Real Signal type, a maximum of 16 module entries is available; a
maximum of 8 entries is available for type Complex FFT of a Real Signal. Types
Complex FFT of a Complex Signal and Cross Spectrum of Two Real Signals allow up to 8 pairs of module entries.
Filter
You can integrate, double integrate, differentiate or double differentiate the input
data of the FFT module, before the FFT is performed. This allows you to investigate the acceleration or speed data of the signal. The built-in integration function avoids the problems of the integration constant, which you must consider if
you use the Integration/Differentiation module.
The Fourier transform, as well as the algorithms based on it, are very powerful but complex tools used for signal analysis. The easy-to-use implementation in ServiceLab does not completely eliminate erroneous results. Please
read the following general remarks regarding the FFT for further information.
4.1. FFT: General Remarks
The Fourier Analysis is based on Fourier’s theorem that every periodic signal
can be decomposed in a series of harmonic functions. The methods implemented
in this module allow the calculation and analysis of these frequency components.
The following essential conditions should be taken into account when FFT operations are to be performed:
Frequency Components in the signal and Sampling Rate
7-11
Fast Fourier Transform Module (optional)
ServiceLab
This is a condition for every digitalization. The sampling rate must be at
least twice as high as the highest frequency component in the analog signal (Shannon’s theorem). Since this is a theoretical limitation for most
applications, it is better to have a larger over sampling. In general, an
over sampling of 5 to 10 is sufficient; otherwise amplitude errors may occur due to the digitalization, though the frequency detection may be correct.
Limited Analysis Intervals
Every digital signal analysis method can only deal with a limited section
of the time signal. The signal outside this section is always assumed to be
a periodic continuation of that section. The length T of the analysis interval determines the basic frequency:
1
fb = .
T
If, as is generally the case, the time signal contains frequencies which are
not an integer multiple of that frequency, these frequencies will not be
identified as sharp spectral lines but be smeared to several lines. This is
called the leakage effect. A well-suited window vector can reduce this
effect. One undesirable side effect may be the widening of the main lobe.
4.2. Real FFT of a Real Signal
This function calculates and analyzes the discrete spectrum of a signal.
Input and Output Characteristics
Number of Inputs :
Input Block Size :
Number of Outputs:
Output Block Size :
Max. Number of Modules:
up to 16
must be a power of two
same as number of inputs
same as input block size, or half of the input block
size
any
This FFT function type provides several FFT based Operations. If necessary, the
spectrum may be transformed into a dB Scale.
Choose the Suppress DC Component option to inhibit all DC components in signal.
The following FFT operations are available:
Fourier Spectrum: The result is the two-sided amplitude spectrum of the
signal. The output block size is the same as the input block size.
Amplitude Spectrum: The result is the one-sided amplitude spectrum. In
contrast to the Fourier Spectrum, each frequency component except the
DC part is twice as large due to the summation of the symmetric frequencies. The output block size is half of the input block size.
7-12
ServiceLab
Chapter 7: Signal Analysis Module
Power Spectrum: The power spectrum is the square of the Fourier Spectrum, but only one-sided. The output block length is half the input block
length.
Power Density Spectrum: The Power Density Spectrum differs from the
Power Spectrum by a factor b which represents the frequency resolution:
b=
1
.
fb
Phase Spectrum: The result is the phase spectrum of the input signal.
The output block size is the same as the input block size. The output signal
is normalized to 0 to 360º.
dB Transform: If dB Transform is switched on, the resulting spectrum will
be logarithmically transformed: y = 20 ∗ log( xb ) , where x is the input
signal and b is one of the following reference values:
Definable Reference Value
Maximum of the First Block
Maximum of All Recent Blocks
Maximum of the Current Block .
Choose the Suppress DC Component option to inhibit all DC components in signal.
dB scales can only be compared if the reference value is the same for all the
spectra. This is generally the case for a defined reference value and for the
maximum of the first block, but not for the others.
4.3. Complex FFT of a Real Signal
This function calculates and analyzes the discrete spectrum of a signal.
Input and Output Characteristics
Number of Inputs :
up to 8
Input Block Size :
must be a power of two
Number of Outputs:
up to 16
Output Block Size :
same as input block size
Max. Number of Modules: any
This FFT provides two outputs for each input. The output signal contains the real
component and the imaginary part of the FFT of the real signal.
You can choose the complex conjugate of the output signal, which means that for
each input the imaginary part of the result will be multiplied by − 1.
Choose the Suppress DC Component option to inhibit all DC components in signal.
7-13
Fast Fourier Transform Module (optional)
ServiceLab
Up to 8 module entries and 16 outputs can be activated. The input block size must
be a power of two; the output block size is the same as the input block size.
4.4. Complex FFT of a Complex Signal
This function calculates and analyzes the discrete spectrum of a signal.
Input and Output Characteristics
Number of Inputs :
up to 8 pairs
Input Block Size :
must be a power of two
Number of Outputs:
same as number of inputs
Output Block Size :
same as input block size
Max. Number of Modules: any
This FFT type provides two inputs and two outputs for each function. You can
choose between Fourier Analysis and Fourier Synthesis.
You can also choose the complex conjugate of the output signal, which means
that for each input the imaginary part of the result will be multiplied by − 1.
Up to 8 functions can be performed simultaneously in each module. The input
block size must be a power of two at both entries; the output block size at the
outputs is the same as the input block size.
The real component has to be connected to input 1 of each signal pair, the
imaginary component to input 2. Output 1 contains the real component of the
processed signal pair, output 2, the imaginary component.
4.5. Cross Spectrum of Tw o Real Signals
This function calculates and analyzes the discrete spectrum of a signal.
Input and Output Characteristics
Number of Inputs :
Input Block Size :
Number of Outputs:
Output Block Size :
Max. Number of Modules:
up to 8 pairs
must be a power of two
same as number of inputs
same as input block size
any
This FFT type provides two inputs and two outputs for each function. It calculates the cross spectrum of the two input signals. This means that the complex
spectra are calculated for both input signals, and the first spectrum is multiplied
with the complex conjugate of the second.
Choose the Suppress DC Component option to inhibit all DC components in the
signal.
Up to 8 functions can be performed simultaneously in each module. The input
block size must be a power of two at both entries; the output block size at the
outputs is the same as the input block size.
7-14
ServiceLab
Chapter 7: Signal Analysis Module
Output 1 contains the real component of the processed signal pair, output 2,
the imaginary component .
5.
Polar/Cartesian Coordinates Module (optional)
This module converts a pair of input signal values defining a
curve in Cartesian coordinates into polar coordinates and vice
versa.
Input and Output Characteristics
Number of Inputs :
up to 8 pairs
Input Block Size :
any
Number of Outputs:
same as number of inputs
Output Block Size :
same as input block size
Max. Number of Modules: any
Either of the following operations can be selected for each pair of module entries:
Cartesian
Polar - conversion from Cartesian to polar coordinates.
Polar
Cartesian - conversion from polar to Cartesian coordinates.
The first member of each input or output pair defines the real part or the amplitude respectively; the second member defines the imaginary part or the angle.
Angles can be entered in degree (from − 180 to +180) or radian values (from −π
to +π ).
6.
Electric Characteristics Module (optional)
The Electric Characteristics Module computes the well-known
electrical engineering quantities based on voltage U and current I,
including power, phase angle , as well as the input frequencies.
Input and Output Characteristics
Number of Inputs :
Input Block Size :
Number of Outputs:
Output Block Size :
Max. Number of Modules:
2, 3, or 4 based on chosen function
any, but U and I with the same block size
16
1
any
The 16 outputs of the module correspond to the 2 ... 4 inputs with the listed conditions.
7-15
Electric Characteristics Module (optional)
ServiceLab
6.1. Inputs
U
I
C
R
Data input voltage: Sampling value index, i(k) sample value on index k
Current: Sampling value index, i(k) sample value on index k
Control input for calculation: This input is only available if the Trigger on
Rising Edge At Control Input condition is selected as the Calculation option
Control input for Delete: This input is only available if the T rigger on Rising
Edge At Control Input condition is selected as the Delete option
6.2. Outputs
Channel 0 Sampling value index
Channel 1 Effective Voltage -> Effective value = sqrt( 1/N * Sum {k=1..N}
(x2(k)) ), x=U
Channel 2 Effective Current -> Effective value = sqrt( 1/N * Sum {k=1..N}
(x2(k)) ), x=I
Channel 3 Active Power = 1/N * Sum {k=1..N} ( u(k) *i(k) )
Channel 4 Apparent Power = Ueff * Ieff
Channel 5 Reactive Power = Ueff * Ieff * sin(Phi)
Channel 6 Phase Angle Phi = arccos(Pw/Ueff/Ieff)
The Angle in Degrees setting interprets the incoming values in degrees
(0-360); the Angle in Radians setting interprets them in radian measure (rad) (0-2 PI). You can also show the sign to detect whether the
current
is
trailing
(- sign)
or
leading
(+ sign).
Attention: To detect the sign only the first two zero crossings of current
and voltage are used (each time the measurement starts).
You can perform additional sign detection during the running measurement. Use an event driven action or delete the calculated characteristics to initiate the new sign detection (see also dialog delete). In the
working mode Calculate For Each Single Block (Reset after each
block) on each new data block the sign is calculated again.
Channel 7 cos Phi
Channel 8 sin Phi
Channel 9 Input frequency in the data input Voltage
The input frequency is calculated as follows:
F = ( n-1 ) / ( t2-t1 )
n : Number of positive zero crossings
t1 : time from start to the first positive zero crossing
t2 : time from start to the last positive zero crossing
If there is a zero crossing between two measured values
(p = predecessor, s = successor) the assignment of the time stamp t to
7-16
ServiceLab
Chapter 7: Signal Analysis Module
the zero crossing happens as described in the following 4 cases (--shows the zero line).
a) ---p---s--- t = tp
b) -------s--- t = ts
p
s
c) ---p------- t = tp
s
d) ----------- t = (ts +tp) / 2
p
Channel 10
Number of positive Zero Crossings in the data input Voltage
At the horizon of the defined zero line (you can use a global variable
but it is only read once at measurement start and is not updated while
the measurement is running) all zero crossings (predecessors beneath
or on the zero line, successors over or on the zero line) following the
defined hysteresis (also definable as global variable read once at the
measurement start) are calculated. Hysteresis is used to reduce statistical errors but also to filter small amplitudes that often result from noise
and random interferences of the measurement equipment The hysteresis
effects that the next detection of a zero crossing event is only started if
the oscillation left a defined band around the zero line (value < zero
line – Hysteresis/2 or value > zero line + Hysteresis/2).
Channel 11
rejected positive Zero Crossings of Voltage
Depending on the information of the channels 10 and 11 or 13 and 14
you can select a useful hysteresis for the input signal, if frequencies are
known.
Channel 12
Input frequency in the data input Current
Channel 13
Number of positive Zero Crossings in the data input Current E
Channel 14
rejected positive Zero Crossings of
Channel 15
Error messages
0 = no error detected
1 = the signs of the results in channel 6 and 8 are not unambiguously
defined (The sign is only unambiguous if the phase angle Phi is in
the interval –180° > Phi < +180° )
2 = the input frequencies of voltage and current vary more than +/- 0.1
Hz
3 = the interval that the data block covers is smaller than a complete
periodic oscillation of voltage and current.
4 = No values to calculate (previous Reset).
7-17
Electric Characteristics Module (optional)
ServiceLab
6.3. Options
Calculation
For Each Single Block (Reset after each block:
The calculation is performed for each block. Each result is sent to the
output. After each output the characteristic values are deleted for new
calculation.
Calculate In Running Mode With All Received Blocks : The calculation is
performed in running mode and the result is sent to the outputs as each
block is processed. The index k is counted over all received blocks. You
can reset the characteristic values depending on the setting in the Delete
list box (also reset the Index k).
Calculate If Rising Edge At The “C” Control Input: The calculation of the
characteristic values is performed in running mode. The index k is
counted over all received blocks. If the input C detects a rising edge
crossing the value 2.5, the actual calculated characteristic values are sent
once to the output. You can reset the characteristic values depending on
the setting in the Delete list box (also reset the Index k).
Calculate On Asynchronous Event Driven Action: The calculation of the
characteristic values is performed in running mode. The index k is
counted over all received blocks. If a user defined condition is detected
using the Action module, the actual calculated characteristic values are
sent once to the output. You can reset the characteristic values depending
on the setting in the Delete list box (also reset the Index k).
Calculate
Delete
Disabled: Deletion of the calculated values is disabled.
Delete If Rising Edge At The “R” Control Input : If the input R detects a
rising edge crossing the value 2.5 the calculated characteristic values are
deleted once . The actual values at the U and I inputs are used for the next
calculation step but not are used in the running calculation.
Delete On Asynchronous Event Driven Action : If a user defined condition
is detected the calculated characteristic values are deleted once . The actual values at the U and I inputs are used for the next calculation step but
not are used in the running calculation.
6.4. Error Messages
The following messages can be shown if the data at the inputs U and I are not
correct:
Time information or block length of the data streams are different. You cannot link these channels. STOP!
Illegal block size. STOP!
7-18
ServiceLab
7.
Chapter 7: Signal Analysis Module
Harmonic Distortion Module (optional)
The module calculates the Amplitude and Phase of the fundamental wave in the defined frequency interval and calculates up to 48
harmonic waves (they can be out of the defined interval) with the
corresponding Amplitudes and Phases. Please read the hints below
for correct usage of the Harmonic Distortion Module.
Input and Output Characteristics
Number of Inputs :
Input Block Size :
Number of Outputs:
Output Block Size :
Max. Number of Modules:
2, 3, or 4 based on chosen function
any, but F and P with the same block size
9
1
channel 1, 2, 3, 4: depends on the configuration
(24, 25, 49) of channel 0, 5, 6, 7, 8: 1
Each of 9 outputs of module corresponding to a calculation based on the inputs.
7.1. Inputs
F
Data input: Amplitude Spectrum: Use the Real FFT of a Real Signal module to
prepare the input signal
P
Data input Phase Spectrum: Use the Real FFT of a Real Signal module to
prepare the input signal
C
Control Input for calculation: The input is only available if the Calculate If Rising Edge at the Control Input mode is selected in Calculation list box.
R
Control input to delete: The input is only available if the Calculate If Rising
Edge at the Control Input mode is selected in Delete list box.
7.2. Outputs
Channel 0 Number of Fourier spectra, as basis for calculation
The All, Even or Odd setting changes the output:
o
For channel 1-> 49 (fundamental wave + 48 harmonic waves),
24 (fundamental wave + 23 harmonic waves) or
25 (fundamental wave + 24 harmonic waves) counted identifier,
o
At channel 2, the corresponding frequencies, at channel 3 the corresponding amplitudes
And
o
At channel 4, the corresponding phases.
Fundamental wave and harmonic waves are calculated as follows:
7-19
Harmonic Distortion Module (optional)
Channel 1
Channel 2
Channel 3
Channel 4
Channel 5
Channel 6
ServiceLab
The maximum amplitude is selected in the defined Frequency Interval
(Frequency from ... to). The corresponding frequency is defined as fundamental wave.
The algorithm search for the xth harmonic wave using integer multiples
of the frequency in a small frequency interval around the named position. The maximum found in the interval is used as xthharmonic wave
(with the corresponding position in frequency band). The found frequency does not have to be an exact integer multiple of the fundamental
wave.
xth Harmonic Wave
Frequency of the v Harmonic Wave
Effective value of xth Harmonic Wave
Phase Shift of the xth Harmonic Wave
Relative Harmonic Content
The Relative Harmonic Content is calculated as:
1
Total Harmonic
Contentl
A2fundamenta
1+ N
Total Harmonic
Content
is calculated as shown:
2
aharmonic
∑
( i)
Type 1: Fehler!
Es
ist
nicht möglich, durch die Bearbeitung von
i =1
Feldfunktionen Objekte zu erstellen.
Type 2: Fehler! Es istN nicht
U2n möglich, durch die Bearbeitung von
n= 2 Objekte
Feldfunktionen
zu erstellen.
U,ITHD =
U1
Type 3:
∑
Channel 7 Harmonic Distortion Factor
The Harmonic Distortion Factor is calculated as shown:
Type 1: Fehler! Es ist nicht möglich, durch die Bearbeitung von
Feldfunktionen Objekte zu erstellen.
Type 2: Fehler! Es ist nicht möglich, durch die Bearbeitung von
Feldfunktionen Objekte zu erstellen.
Type 3: Fehler! Es ist nicht möglich, durch die Bearbeitung von
Feldfunktionen Objekte zu erstellen.
Channel 8 Error Messages
0 = no error detected
4 = no data at the input received (earlier Reset).
7-20
ServiceLab
Chapter 7: Signal Analysis Module
7.3. Options
Calculation:
Calculate Each Single Spectrum: The characteristic values are calculated
and output separately for each spectrum. After each calculation the values
are deleted.
Calculate with All Spectra in Average Mode: The specified number of
spectra is collected and averaged, and then the characteristic values of the
averaged spectrum are calculated and output. The values are then deleted
depending on the setting in the Delete List box.
Calculate On Edge Low to High at The Control Input: All spectra are collected. If a rising edge (crossing 2.5) is detected at the input C, the collected spectra are averaged, the characteristics calculated and sent to the
output. The values then will be deleted depending on the setting in the Delete List box.
Calculate On Asynchronous Event Driven Action: All spectra are collected. If the Action module detects the defined condition, the collected
spectra are averaged and the characteristic values are calculated and sent
once to the output. The values then will be deleted depending on the setting in the Delete List box.
Delete:
Disabled
Deletion of the calculated values is disabled.
Delete If Rising Edge Is at the Control Input : If a rising edge (crossing
2.5) is detected at the input R, the calculated characteristic values are deleted once . The actual values at the inputs F and P are used for the next
calculation step but are not are used in the running calculation.
Delete on Asynchronous Event Driven Action: If the Action module detects the defined condition, the calculated characteristics are deleted
once . The actual values at the inputs F and P are used for the next calculation step but not are used in the running calculation.
7.4. Error Messages
The following messages can be shown if the data at the inputs F and P are not
correct:
Time information or block length of the data streams are different. You cannot link these channels. STOP!
Illegal block size. STOP!
7-21
ServiceLab
Period Check Module (optional)
8.
Period Check Module (optional)
The Period Check module checks the data for the first positive
zero crossing at a specified zero line (you can use global Variables).
After the positive zero crossing is detected, data samples are collected until the
preset number of output blocks is reached. At that time, the data is sent to the
outputs of the module for further processing. The cycle then starts again for the
next positive zero crossing.
Thus, the signal of each output block starts with a positive zero crossing that is
needed to process a continuous calculation of phase spectra. There will be a
small loss of data between input and output.
Input and Output Characteristics
Number of Inputs :
Input Block Size :
Number of Outputs:
Output Block Size :
Max. Number of Modules:
Up to 16
any
Up to 16
1
any
8.1. Inputs
0 (I)...15*
Data Input with Time signal
8.2. Outputs
0(O)...15
7-22
Data Output with Time signal
ServiceLab
Chapter 8: Control Module Group
Chapter 8: Control Module Group
Signal Generator
x
Switch
x
Slider
x
optional
Module
Basic
version
This group consists of modules performing control functions.
Coded Switch
x
PID Control
x
Two Point Control
x
Time Delay
x
Latch
x
Signal Router
x
TTL Pulse Generator
(Timer)
x
Stop
x
Global Variable Read
x
8-1
ServiceLab
Period Check Module (optional)
Global Variable Write
Block Time
x
x
Common Control Group Options:
Real Time Output
This switch, available in most Control Group modules, determines the time base
at which data will be transferred to other modules.
Use Synchronization (in the Experiment Setup dialog box) to specify whether the
internal PC clock or the sampling rate generated by the underlying Hardware is
used as time base for all data generating modules ( Generator, Slider, Switch,
etc.)
If Real Time Output is switched on, data will be output in real time. A data block
will not be released before the time necessary to release the number of values in
the block has elapsed. This period of time is calculated from the block size and
the sampling rate as they have been specified in the Experiment Setup dialog
box.
Real time output only applies to slow data generation. It does not check whether
data can be generated fast enough. In cases of pure simulation applications this
check is left to the user in order to provide him with the ability to change parameters online. In cases of data acquisition applications, i.e., if any hardware
related module is used, timing problems are noticed by the driver interface and
result in an appropriate error message and stop of measurement.
Example:
block size = 500; sampling rate =1000 Hz: a signal block will
be output every 0.5 seconds.
If Real Time Output is switched off, data will be provided at the output as fast as
possible, as soon as the next modules provide the necessary capacity. The subsequent processing modules will then synchronize the signals.
Real Time Output is useful, for example, when data signals from a Generator
module are to be delivered at Analog Output. Time synchronization is then done
in the Analog Output module. The Generator module generates data signals
quickly enough to provide them in sufficient numbers at the Analog Output module, and no time delay will occur at the output.
The speed of generating data depends on the hardware and on the complexity of
the experiment setup.
Options: Synchronization
Data generating modules (such as Generator without Modulation, Switch, Slider,
Coded Switch, TTL Generator, Time Base without control input, and Sequence
Generator without control input) provide a setting to select one of the available
8-2
ServiceLab
Chapter 8: Control Module Group
time bases allowing you to synchronize the module to a specific data flow. In
most cases you don’t need to use a control input or synchronization.
Generally, you can choose between available time bases or choose the option to
synchronize the data flow with the Input Signals of a control input.
Time Base Setup : Choose one of the available time bases to synchronize the
output of the Control Group module. Use the Experiment Menu command Time
Base Setup to configure available time bases.
With Input: Synchronize the data flow with a control input.
1.
Signal Generator Module
Use this module to generate up to 8 or 16 different standard signals simultaneously. In the worksheet it provides these signals to
the other modules using its module outputs .
Since this module provides different basic operations, you must first select the
function type when you install the module.
This module provides four function types:
Generator without Modulation,
Generator with Frequency Modulation,
Generator with Amplitude Modulation,
Generator with Frequency and Amplitude Modulation,
Read Global Variable.
You can insert several Generator modules in one worksheet.
The Generator module provides several wave forms for standard signals:
Function
The generated signal is a …
Sine
…
sine wave of defined frequency, amplitude, offset,
and phase shift.
square wave of defined frequency, amplitude, offset,
and phase shift.
Triangle
… triangle wave of defined frequency, amplitude , offset,
and phase shift.
Saw Tooth … saw tooth wave of defined frequency, amplitude, offset, and phase shift.
Pulse
… periodic one-sample impulse of defined frequency,
amplitude , offset, and phase shift.
Noise
… noise signal of defined maximum amplitude and offset.
Constant
… constant signal of defined offset.
Frequency: This parameter determines the frequency of the generated signal. The input must be entered in Hertz. This setting is grayed out if you
Square
…
8-3
Signal Generator Module
ServiceLab
selected Generator with Frequency Modulation or Generator with Frequency and Amplitude Modulation.
The time resolution and the number of samples per period is determined
by the ratio between the global sampling rate, which can be specified in
the Experiment Setup dialog box, and the frequency entered here.
Example: global sampling rate:
1000 Hz
signal frequency:
10 Hz
number of samples per period:
1000/10 = 100 samples
Since signal generation in this module is the digitalization of a mathematical function, the Shannon theorem applies just as it does in a data acquisition process. If the signal frequency is too high for proper digitalization, a warning message will appear.
Amplitude and Offset: These parameters determine the amplitude range of
the generated signal, specified in volts. This setting is grayed out if you
selected Generator with Amplitude Modulation or Generator with Frequency and Amplitude Modulation. Depending on the defined wave form,
the amplitude of the signal will be within either of the following ranges:
Offset minus Amplitude to Offset plus Amplitude
Offset to Offset plus Amplitude
A negative amplitude will cause the waveform to be inverted; a pulse
with a negative amplitude may be generated.
There are no restrictions on either of these values, but they should be set
with care regarding further calculations.
Phase Shift Generator
This parameter determines the phase shift for periodic signals in degrees.
Allowed values are between 0º and 359º .
A sine with a phase shift of 90º is a cosine.
Real Time Output
This switch determines the time base at which data will be transferred to
other modules.
Use Synchronization (in the Experiment Setup dialog box) to specify
whether the internal PC clock or the sampling rate generated by the underlying Hardware is used as time base for all data generating modules
( Generator, Slider, Switch , etc.)
If Real Time Output is switched on, data will be output in real time.
A data block will not be released before the time necessary to release the number of values in the block has elapsed. This period of
time is calculated from the block size and the sampling rate as they
have been specified in the Experiment Setup dialog box.
Real time output only applies to slow data generation. It does not
check whether data can be generated fast enough. In cases of pure
simulation applications this check is left to the user in order to pro8-4
ServiceLab
Chapter 8: Control Module Group
vide him with the ability to change parameters online. In cases of
data acquisition applications, i.e., if any hardware related module is
used, timing problems are noticed by the driver interface and result
in an appropriate error message and stop of measurement.
Example: block size = 500; sampling rate =1000 Hz
A signal block will be output every 0.5 seconds.
If Real Time Output is switched off, data will be provided at the
output as fast as possible, as soon as the next modules provide the
necessary capacity. The subsequent processing modules will then
synchronize the signals.
Real Time Output is useful, for example, when data signals from a Generator module are to be delivered at Analog Output. Time synchronization is then done in the Analog Output module. The Generator module
generates data signals quickly enough to provide them in sufficient numbers at the Analog Output module, and no time delay will occur at the
output.
The speed of generating data depends on the hardware and on the complexity of the experiment setup.
1.1. Generator w ithout Modulation
Input and Output Characteristics
Number of Inputs :
Input Block Size :
Number of Outputs:
Output Block Size :
Max. Number of Modules:
----up to 16
same as the global block size
any
You can enter the following parameters separately for each channel:
The channel name
The wave form
The signal frequency
The amplitude of the signal in Volt
The phase shift
The offset
Output in Real Time mode
8-5
ServiceLab
Signal Generator Module
1.2. Generator w ith Frequency Modulation
Input and Output Characteristics
Number of Inputs:
Input Block Size:
Number of Outputs:
Output Block Size:
Max. Number of Modules:
same as number of outputs
same as the global block size
up to 16
same as the global block size
any
Each output channel is connected to one input channel, which delivers the Frequency for each sample to be generated by that channel.
The setup for Frequency and the Real T ime Output option are disabled, since the
output rate is generated from the incoming channel.
The input channel must contain normal time data. If the input channel contains
gaps, the generated data stream will contain gaps too. The value of the input signal is used to determine the frequency of the generated waveform.
You can enter the following parameters separately for each channel:
The channel name
The wave form
The amplitude and offset of the signal in Volts
Since the module computes a phase correction every time the frequency
changes, it takes some computation time to modulate the generator with a rapidly changing signal.
1.3. Generator w ith Amplitude Modulation
Input and Output Characteristics
Number of Inputs:
Input Block Size:
Number of Outputs:
Output Block Size:
Max. Number of Modules:
same as number of outputs
same as the global block size
up to 16
same as the global block size
any
Each output channel is connected to one input channel, which delivers the Ampli-
tude for each sample to be generated.
The setup for Amplitude and the Real Time Output option are disabled, since the
output rate is generated from the incoming channel.
The input channel must contain normal time data. If the input channel contains
gaps, the generated data stream will contain gaps too. The value of the input signal is used to determine the frequency of the generated waveform.
8-6
ServiceLab
Chapter 8: Control Module Group
You can enter the following parameters separately for each channel:
The channel name
The wave form
The signal frequency
The offset of the signal in Volts
The phase shift
1.4. Generator w ith Frequency and Amplitude Modulation
Input and Output Characteristics
Number of Inputs:
Input Block Size:
Number of Outputs:
Output Block Size:
Max. Number of Modules:
twice the number of outputs
same as the global block size
up to 8
same as the global block size
any
Each output channel is connected to two input channels, which deliver the Frequency (first input channel) and the Amplitude (second input channel) for each
sample to be generated.
The setup for Frequency and Amplitude and the Real Time Output option are disabled, since the output rate is generated from the incoming channel.
The input channels must contain normal time data and with the same sample rate
on the two channels. If the input channel contains gaps, the generated data stream
will contain gaps too. The value of the input signal is used to determine the frequency of the generated waveform.
You can enter the following parameters separately for each channel:
The channel name,
The offset of the signal in Volts
The wave form,
Since the module computes a phase correction every time the frequency
changes, it takes some computation time to modulate the generator with a rapidly changing signal.
1.5. Generator w ith Get Global Variable
Input and Output Characteristics
Number of Inputs:
Input Block Size:
Number of Outputs:
Output Block Size:
Max. Number of Modules:
----up to 16
1 or same as the global block size
any
Each channel can get a different global variable that is sent to the Output as a
constant value.
8-7
ServiceLab
Switch Module
You can use the Read Global Variable Module to accomplish the
same task.
You can enter the following parameters separately for each channel:
The channel name,
The Number of the global Variable,
Output Block Size: choose one of two settings. When Global Block Size is
chosen, samples are issued with that block size. When Block Size 1 is
chosen, the sampling rate will be adapted to the data flow.
Real time output option
2.
Switch Module
Use this module to generate TTL compatible signals. The output
can be switched manually between low and high.
Input and Output Characteristics
Number of Inputs :
Input Block Size :
Number of Outputs:
Output Block Size :
Max. Number of Modules:
----up to 16
global block size
any
This module generates a TTL compatible signal at each of its outputs. In a separate operation window, the output can be switched manually between low and
high, or it can be set to high for the duration of one block.
Use the Switch module in combination with a Relay module or a Digital Output
module for control applications and for manual operations in the course of the
measurement.
Each module of this type provides an additional operation window for manipulation. That window is initially provided as an icon at the bottom of the desktop
when the module is inserted into the worksheet. Double-click this icon to open
the operation window; then the switches can be used.
To use the switch as an active element in VITool, you must go to the Layout
window menu item Options Menu/Lay out window to select Mous e to interac t
with Layout window. If this function isn’t active, a mouse click on the switch
buttons only affect a marking of the Positioning Switch object.
8-8
ServiceLab
Chapter 8: Control Module Group
Module Configuration
In the module configuration dialog box you can enter the following parameters
separately for each channel:
General Settings
Real Time Output (see Page 8-4 for function description)
The Color button opens a dialog box for color settings:
The Background button opens the Color Menu to set the color for the
Text area of the channel name.
The Text button opens the Color Menu to set the Text color for the
channel name.
The Fonts button opens the Text dialog box to set the Font Type, Size and
Color of the Status Text.
The Options button opens the Options dialog Box to make other global
settings.
Channel settings
Switch Type: Each channel can be operated as an On/Off Switch or as a
One Shot Switch. The third option, Measurement Start/Stop, creates a
module that does not affect other modules but starts and stops the measurement.
Operation Window
The operation window contains (depending on the Switch Type) one or two buttons for each activated channel. Beneath the button(s) you’ll find a display of the
actual status of the channel: ON or OFF.
The signal can be set TTL High or TTL Low for On/Off Switch mode with the
two corresponding buttons, or set for one block of data to TTL High and then
automatically back to TTL Low again in One Shot Switch mode.
You can also switch using an Event Driven Action. If the event occurs, the switch
toggles to the other status.
To initialize the state of the channel you can click on the buttons in the operation
window. However, output will only be generated while the experiment is running. The switches can be operated by mouse clicks, but not by keyboard.
Options
You can select the following options to customize the appearance of the Status
display window:
Display
If more than one instrument is activated in the module, you can change the
Number of Columns. The arrangement of the individual instruments within
the display window is determined using this setting.
8-9
ServiceLab
Slider Module
The with Channel Name and with Status Text option shows or hides the
channel name at the top of the instrument and the status text beside the
status symbol.
Bitmapped Graphics
To show the Status as Symbol you can use the Default Symbol (Lamp:
ON.BMP or OFF.BMP) or any Bitmapped Graphics. Activate this option
using the Show Bitmap switch.
Stretch Bitmap and Draw bitmap shows Bitmapped Graphics adapted to
the window frame based on original size.
The buttons Bitmap On and Bitmap Off open a File Select Box to select
the Bitmapped Graphics Files which will be used as the On or Off Symbol.
Synchronization:
With Synchronization you can choose whether the Global Settings or an input signal is used to synchronize data flow.
Block Size:
You can choose two settings in Block Size. When Global Block Size is
chosen, samples are released with that block size. If Block Size 1 is chosen, the sampling rate will be adapted to the data flow.
All settings in the Option dialog box apply to all activated channels of this module.
3.
Slider Module
This module generates a signal with an amplitude that can be
modified manually.
Input and Output Characteristics
Number of Inputs:
Input Block Size:
Number of Outputs:
Output Block Size:
Max. Number of Modules:
----up to 16
global block size
any
This module generates a signal of adjustable amplitude at its output. The output
amplitude can be adjusted manually in a separate operation window; the overall
range of the amplitude is defined by the limiting values entered in the module configuration dialog box.
Each module of this type provides an additional operation window for manipulation. That window is initially provided as an icon at the bottom of the desktop
8-10
ServiceLab
Chapter 8: Control Module Group
when the module is inserted into the worksheet. Double-click this icon to open
the operation window; then the slide controls can be used.
The slide controls can be operated using the scroll bar.
Module Configuration
In the module configuration dialog box you can enter the following parameters
separately for each channel:
Min. Value / Max. Value: These two entries determine the output range the
slider can generate on the selected channel.
Resolution: Define the resolution of the slider; the number of steps between the minimum and the maximum value. With a resolution of 100,
each click on the upper or lower button in the slider changes the output
signal about 1%. You can define a resolution from 2 to 9999 steps.
Real Time Output (see page 8-4 for function description)
Switches
Options: If there is more than one active channel in the slider module you
can setup the display of the operation window. You can determine the
Number of Rows in the table of the sliders in the operation window and
you can choose to display With Channel Name.
With slider switch turns the slider bar on or off in the display window.
With numerical Input fades in/out the numerical Input area.
With Synchronization you can choose whether the Global Settings or the
input signal is used to synchronize data flow.
Colors: Click this button to setup the colors for all the parts of the operation window.
Font: Click this button to select the type and the style of the font for the
channel name. You can choose how the font is scaled. Click on the Font
button to choose the font family, style and size.
Choose from:
Single font, fixed to specify the exact font and font size that will be displayed. One font will be used for all elements.
Single font, automatic to allow the program to automatically resize the
font when the display window is resized. One font will be used for all
elements.
Separate Fonts, fixed to specify the exact font and font size that will be
displayed. You can specify different font sizes for each element: name,
value and scaling.
Separate Fonts, automatic to allow the program to automatically resize
the font when the display window is resized. You can specify different
font sizes for each element: name, value and scaling.
8-11
ServiceLab
Coded Switch Module (optional)
Scaling: select a String format for the scale such as engineering or exponential format, the number of labeled ticks and the number of decimals.
Operation Window
The operation window contains one slider and one edit control for each activated channel. The slider output changes to your selection (if experiment is running) and displays the value in the edit control.
Use the mouse and keyboard to control the slider (first the slider must get
the input focus by clicking on it with the mouse).
Or you can type the output value in the edit box under the slider.
4.
Coded Switch Module (optional)
This module can generate up to 4 TTL compatible signals . These
signals can be switched between the predefined 16 levels and on
and off .
In the worksheet, this module can have up to 4 signal outputs.
Input and Output Characteristics
Number of Inputs:
Input Block Size:
Number of Outputs:
Output Block Size:
Max. Number of Modules:
----up to 4
same as global block size
any
This module generates a TTL compatible signal at each of its outputs. In a separate operation window , the output can be switched manually between preset levels or switched on and off. It is useful in control functions.
Each module of this type provides an additional operation window for manipulation. That window is initially provided as an icon at the bottom of the desktop
when the module is inserted into the worksheet. Double-click this icon to open
the operation window; then the switches can be used.
To use the switch as an active element in the VITool you must select Mouse
to interact with Layout Window in the Options Menu of the Layout Window
menu. If this function isn’t active, a mouse click on the switch buttons only
marks the object Positioning Switch.
Module Configuration
Open the module configuration dialog box by double-clicking on the module
symbol or on the switch window.
8-12
ServiceLab
Chapter 8: Control Module Group
General settings
Real Time Output (see Page 8-4 for function description)
Color button opens a Box for color settings:
The Background button opens the Color Menu to set the color for
the Text area of the channel name.
The Text button opens the Color Menu to set the Text color of the
channel name.
The Switch button opens the Color Menu to set the switch name
color.
The Fonts button opens the Text Dialog Box to set the Font Type, Size and
Color of the Status text.
The Options button opens the Options Dialog Box to make other global
settings.
Channel settings
These settings affect only the selected channel.
Switch positions: values and display mode
Each channel has up to 16 positions . Select the number of the switch position to
define the level of output. Use Display Mode to choose whether the switch position, the number of the position, a self-defined text string or the preset value with
unit is displayed. If the for all positions switch is checked, the inserted unit will
be displayed for all positions.
Operation Window
The operation window contains (depending on the Switch Type ) one rotary
switch or one button bar for each activated channel. At the perimeter of the rotary
switch or in the buttons you will find the status displayed for each preset position.
In the Button Switch mode, the signal can be set to preset values simply
with a left mouse click on the corresponding button. The activated button
is colored.
In the List Box mode, the signal can be set to a preset value by selecting
the recommended value in combo box that appears when you click the
mouse on the channel.
In the Rotary Switch mode, you must first activate a channel with a mouse
click on the channel. The active channel is marked with a colored border.
Now you can select the level by dragging the pointer to the displayed
value with the left mouse button held down. You can also click on the
value.
Switching only takes effect while the measurement is running. You can preset the
switch to a defined start position before starting the measurement.
8-13
ServiceLab
PID Control Module (optional)
You can integrate several Coded Switch modules in one worksheet. Each of them
has a unique module name, which is shown…
below the icon representing the minimized operation window, and
in the Title Bar of that window when it is activated.
The Function Bar icons and menu commands to open, minimize and arrange the
display windows of the Display modules also affect Switch operation windows.
Options
You can select the following options in this window to modify the general switch
display window.
Switch mode: Use these radio buttons to select the mode switch to be displayed.
Display: Define the number of rows and columns to arrange the switch
display if more than one channel is activated. An additional status window can be activated to show the actual status of the switch.
Channel display: If the Button switch mode is selected, this setting defines
the number of rows for switch positions in between each channel.
Mouse operation: This option selects whether the switch operation is
available only by mouse or also by keyboard.
Synchronization: You can choose whether the Global Settings or the Input
Signals are used to synchronize data flow.
Block Size: When Global Block Size is chosen, samples are released with
that block size. If Block Size 1 is chosen, the sampling rate will be
adapted to the data flow.
All Option Box settings apply to all activated channels of this module.
5.
PID Control Module (optional)
This module implements a PID control algorithm .
Input and Output Characteristics
Number of Inputs:
Input Block Size :
Number of Outputs:
Output Block Size :
Max. Number of Modules:
up to 8 pairs
any, but the same for each pair
number of inputs divided by 2
same as input block size
any
The PID module can calculate up to 8 control signals based on the corresponding
Setpoint and the current value. For each pair of module entries, the first (upper)
8-14
ServiceLab
Chapter 8: Control Module Group
entry denotes the Setpoint, and the lower entry denotes the actual measured value
from the controlled system. The output signal of the PID module depends on the
parameter values specified for the Proportional, Integral and Derivative ( P / I / D
) components or Kr, Tv, Tn parameters.
To get the values of the parameters Kr, Tv, T n several Parameter Identification
algorithms are available. To control the settings of these parameters, use the optimization hints.
The output signal can be limited to avoid instabilities. If Control Limitation is enabled, the output signal will be bounded by the values defined as Maximum and
Minimum.
You can switch between the control-characteristics manually or via action while
the measurement is running, but the changed type is active after the processing of
a new block starts.
The PID control block should be used with small block sizes because the control only affects subsequent blocks.
5.1. PID Control Circuit
A PID Control is only used when high requirements of speed and accuracy are
needed. To get the optimum of settings this type of control is more demanding
and complex than using simple types. There are three parameters, which have to
be exactly tuned to each other, to get an optimized control behavior.
The step response of the control shows clearly its transmission characteristic. It
shows the influence of the respective fundamental parameter. If at the Input of the
PID control the discontinuity of the signal happens, it takes effect to the P and D
part at the output immediately. Throughout the influence of the D part immediately falls to 0, the influence of I part grows slowly but continuously in time.
The P and D part effects a very fast reaction of the PID control, the I part provides the reset of a deviation.
To calculate the parameters use the following formula:
∆x
1
x aPID = x aP + x aI + x aD ⇒ x aPID = K P * x e + * x e * t + K D * e
∆t
TI
e = w-x (deviation), T=Sample Frequency (Time between two measurements of
the controlled magnitude)
5.2. P / I / D Components
The output of the PID module consists of these three components:
P proportional control constant
I integral mode gain constant
D derivative mode gain constant.
To set the parameters the following algorithm is used (P_Dialog = P, I_Dialog =
I and D_Dialog = D):
8-15
PID Control Module (optional)
ServiceLab
REPEAT until BREAK
e=w-x
P_Part = P_Dialog * e
I_Part = Last_I + I_Dialog * e * T
D_Part = D_Dialog / T * ( e - LastDeviation )
LastDeviation = e
SetPoint = ( P_Part + I_Part + D_Part )
Last_I = I_Part;
END REPEAT
5.2.1
Control Limitation
The output signal can be limited in order to avoid instabilities. If Control Limitation is enabled, the values specified as Minimum and Maximum will be used as
the lower and upper limits for the output of the PID module. Values outside these
boundaries will be cut to the corresponding boundary values.
The algorithm only checks the magnitude of the calculated values but not the calculated I part, so it won’t be limited
The algorithm with limited Integral part not the complete set value is limited but
only the Integral part is limited to a maximum or minimum. Another difference is
the use f the last value of the I-part to calculate the next set value if the I-part
value reaches the limit.
5.3. Kr, Tv, Tn Parameters
To set the parameters Kr, Tv (in seconds), Tn (in seconds) and yo , click on the
options button.
The variables are defined as follows
Tn = KP / KI (Reset time)
Tv = KD / KP (Derivative time)
As described by this formula:
⎡
K dxd (t ) ⎤
K
y R (t ) = K p ⎢ x d ( t ) + I ∫ xd ( t )dt + D
⎥.
K P dt ⎦
KP
⎣
To avoid instabilities during the control process you can limit the calculated values using the Control Limitation option. If it is enabled, the values specified as
Minimum and Maximum will be used as the lower and upper limits for the output
of the PID module. Values outside these boundaries will be limited to the corresponding boundary values.
8-16
ServiceLab
5.3.1
Chapter 8: Control Module Group
Description of the control algorithm:
If the process deviation lasts for a longer time (i.e. starting up the process,) the Ipart and the leading value y may experience a very large increase and a strong
overshoot will occur. It is recommended that you limit the I part to the permissible range of the control value - for example the maximum of the bipolar Analog
Output range of the data acquisition board. You also can switch off the I-part at
experiment start via software.
The first way to prevent the overshoot is shown in the following description of
the control program. The second can be realized while setting sum s to zero if a
predefined deviation is reached. Also you can use the actual value of s as constant if the permissible deviation is reached (Value s is frozen!):
IF |e| > MaxValue
Then S := 0
or:
If |e| <= MaxValue
Then S := S + e
Parameter yo defines the needed control value - without any interference to the
control circuit. I.e. if you want to control the rotation of a DC motor you can use
the voltage as the regulation value. To reach special rotation you must supply the
corresponding voltage. This voltage represents the y o ! If there is interference in
the circuit, the control will create a new y (motor voltage will change).
In PI or PID control you can set y o to zero, because the Integral part of the formula decreases the regulation value y until the desired value is reached. In other
control types, you should define yo as exactly as possible. You can get them
while running the control circuit without any control, thus drawing the calculated
control values corresponding to the regulation into a diagram.
The picture shows such a diagram of a DC motor. This case shows the context
with a simple relation:
n = m*y + b
(m is the inclination of the straight line and b is the value the line
would cross the n axis).
With conversion you get: y = (n-b)/m
8-17
ServiceLab
PID Control Module (optional)
If a computer controls the Circuit, the controlled magnitude is no longer checked
continuously but in fixed time intervals, called the scanning period T. The smallest period to reach depends on the speed of the PC. The maximum period length
depends on the time response of the closed control circuit.
Such a time response occurs if the controlled magnitude changes jerkily (i.e. the
motor is braked rapidly) or you set a new regulation value ( Set Point ). Time T
has to be as maximum 10 % of the time constant of the step response. In that time
the controlled magnitude will reach nearly 60 % of the new value. The maximum
of scanning periods of usual control circuits with response time 100 ms (10 Hz)
up to 10 seconds (0.1 Hz) is 10 ms up to some seconds.
5.3.2
Examples
Control Circuit
Delay Time Tu
small El. Lab. Oven
0.5 ... 1 min
large El. Lab. Oven
1 ... 3 min
Distillation Column
1 ... 7 min
Autoclave
30 ... 40 s
High Press. Autoclave 10 ... 15 min
5.3.3
Rise Time Ta
5 ... 15 min
10 ... 20 min
5 ... 10 min
100 ... 20 min
200 ... 250 min
Problems of Digital Controls
Basically there is the following problem in digital control:
Contrary to analog controls, digital control has the disadvantage of the stepwise
output of the leading value. So the value isn’t able to get each magnitude. If, for
example, in rotation control, the number of rotations is changed on 100 per digit
(digital staircase) and the preset nominal value is 850 rpm the control will alternately put out a leading value corresponding to 900 rpm (if nominal value is under run) and then the corresponding value of 800 rpm (if nominal value is overrun). So you will get an oscillation in rotation number. You can decrease this oscillation by using a converter with a higher resolution. A solution in software is
to measure the changing of the controlled magnitude (i.e. voltage of motor) per
digit of the leading value (i.e. rotations per minute) and increase the I part until
the deviation is at least as big as the measured value. A program of the PID control is shown as follows:
S := 0;
ea := 0;
REPEAT UNTIL BREAK
e := w-x;
S := S + e;
I := S * T / Tn
IF I > max. LeadValue
THEN S := max. LeadValue * Tn / T
8-18
ServiceLab
Chapter 8: Control Module Group
END IF
IF I < min. LeadValue
THEN S := min. LeadValue * Tn / T
END IF
D := (e - ea) * Tv / T
ea := e
y := Kr * (e + I + D) + yo
IF y > max. LeadValue
THEN y := max. LeadValue
END IF
IF y < min. LeadValue
THEN y := min. LeadValue
END IF
END REPEAT
Constants w, T, Kr, Tn, Tv , yo must be predefined!
Ea is the deviation of the period of previous period of measurement.
5.3.4
Control of Optimization
It is improbable that the control circuit will work optimally after first adjusting
the parameters. Especially “bad controlling” circuits with values of Ta / Tu < 3
will have to be adjusted. The Step Response of a change in the leading value
properly shows incorrect settings of the parameters. The building-up transients
allow us to conclude the needed corrections. In most cases Tv and Tn are modified at the same time. In the following pictures a PID control is presupposed
(1) I part effects strong, D part is small use larger Tv and Tn.
(2) I part effects weak, D part is strong use smaller Tv and Tn.
(3) P part is weak: use larger Kr.
(4) P part is strong: choose smaller Kr.
(5) The optimal control setting!
8-19
PID Control Module (optional)
5.3.5
ServiceLab
Parameter Identification
You can select one of 6 working modes using the Kr, Tv , Tn parameters for the
PID control. You can also switch between the working modes via Action:
OFF, Control is disabled (In this mode the algorithm isn’t used, the leading value is set to zero. Use this mode to reach a nominal value controlled
by the Sequence Generator without using the PID control in the worksheet. On reaching the nominal value, you can switch to another of the following working modes to activate the PID control.
ON, Control is enabled but without any parameter identification (The
preset values are used as parameter Kr, Tv, Tn and yo to control the circuit).
CHR, Aperiodic control, good leading behavior (In this mode and in the
following three modes, this program tries to set the best parameters automatically. In the first step you must arrange a step in nominal value i.e. 0V
up to 5V in your control circuit. The program then runs to identify the parameters and stops switching to the working mode “ON, No use of identification parameters”. Use a block size of 0 and high sample rates to perform this operation.)
CHR, Aperiodic control, good disturbance response
CHR, 20% Overshoot with smallest T, good leading behavior
CHR, 20% Overshoot with smallest T, good disturbance response
5.3.6
Identification
In practice, the evaluation of the time response recorded, such as in the Chart
Recorder, is enough to identify the parameters.
8-20
ServiceLab
Chapter 8: Control Module Group
To get the time constants Tu and Ta place a tangent into the turning point of the
curve as shown in picture.
Tu is the delay time and Ta is the compensation time. The relationship of
Ta /Tu shows information about the adjustability of the circuit with T2 behavior. To clear the context of a T2 control
circuit, we look at (theoretical) circuit
with large Tu and small Ta.
If input value changes during Tu there is no effect on the output value.The input
value of the circuit as well known is the leading value y , output value is the controlled magnitude x. After expiration of Tu the controlled magnitude x will
change faster the smaller Ta is. The real value as output magnitude of the T2 term
will quickly reach the nominal value w and overruns it in a large range, because
the controller isn’t able to react based on the large value of the delay time Tu. As
result we get worse control behavior.
Control behavior of a T2 circuit depending on Ta/Tu:
Ta/Tu
Behavior
<3
hard to control
3 ... 10
even just to control
>10
easy to control
The results of the parameters are different depending whether you want to optimize the leading behavior or the disturbance response. To reduce the effect of a
disturbance as fast as possible or to follow the leading value exactly and quickly,
you have to adjust the control circuit in the right way. If you advance the last behavior you have to choose a smaller reset time. So the influence of the I-part will
increase.
The parameter settings consider whether the
control works aperiodically or with 20 %
overrun. The mode with overrun effects the
shortest rise time. The picture shows the time
responses of the different types of controller.
8-21
ServiceLab
PID Control Module (optional)
5.3.7
Settings with the CHR approximation method
The approximation method named of CHIEN, HRONES and RESWICK (CHR)
is a useful algorithm to calculate the control parameters if the properties of the
circuit are known. These parameters Ks, Tu and Ta can be investigated with the
evaluation of the time response, so it is especially useful in practice.
Aperiodic control with shortest oscillation duration
20 % overrun with shortest oscillation duration
leading
disturbance
leading
disturbance
Kr
0.6 * Ta / (Tu*Ks)
0.95 * Ta / (Tu*Ks)
0.95 * Ta / (Tu*Ks)
1.2 * Ta / (Tu*Ks)
Tn
1*Ta
2.4*Tu
1.35*Ta
2*Tu
Tv
0.5*Tu
0.42*Tu
0.47*Tu
0.42*Tu
5.3.8
Working modes of Parameter Identification:
CHR, Aperiodic control, good leading behavior
CHR, Aperiodic control, good disturbance response
CHR, 20% Overrun with smallest T, good leading behavior
CHR, 20% Overrun with smallest T, good disturbance response
5.3.9
Identification in Data Acquisition Software
Select one of the modes of parameter identification in the PID Module
(Mode Kr, Tv , Tn parameter).
Ehen the identification is performed, you cannot feedback the output of the
PID module to the input of the controlled system. The inputs of the PID
module and the controlled system geth the same step function.
8-22
ServiceLab
Chapter 8: Control Module Group
Create a step function (i.e. with Sequence generator module; 0V through
5V).
Use the highest possible sampling rate with a block size of 1.
Start measurement.
The results are inserted in the according fields in dialog of the PID module. The module automatically switches to the No parameter identification
working mode. Now you can start measurement with the investigated parameters.
If the Kr, Tv and Tn parameters are defined using global variables (source is the
slider, for example) after identification the parameters are sent back by the PID
module. These values are available for further correction.
5.3.10
Action
You can use the Action Module to switch the
Type of control: 1 =PID with P, I, D; 2 =PID with Kr, Tv, Tn
Working Mode:
1 = circuit control is off
2 = circuit control is on, but no use of parameter identification
8-23
Two Point Control (optional)
ServiceLab
3 = CHR, Aperiodic control, good leading behavior
4 = CHR, Aperiodic control, good disturbance response
5 = CHR, 20% Overrun with smallest T, good leading behavior
6 = CHR, 20% Overrun with smallest T, good disturbance response
reset control
The reset in control with P, I, D will reset the last I part with respect to the deviation reset in control with Kr, Tv, Tn sum will be reset.
The input of other values in the Action Module won’t have an effect.
6.
Two Point Control (optional)
Use this module to process data in the manner of a two-point controller
Input and Output Characteristics
Number of Inputs:
up to 8 pairs of values
Input Block Size:
any, but in pairs the same
Number of Outputs:
half the number of inputs
Output Block Size:
as input
Max. Number of Modules: any
In the worksheet this module can process up to 8 Two-position control loops.
Each control output has one input used for the desired value, marked by the s
symbol, and one input for true value, marked by the channel number. The incoming data has to be time-based data.
Use the Channel Bar to specify the number of channels and the channel to be set
(selected channel).
You can choose between the following different types to control:
Control by switch free range of tolerance
Control by premature switching
Control by delayed feedback
Control by delayed yielding feedback
To trigger subsequent switches and relays, you can define whether the switch-on
value at the module output is TTL-High (switch-off with TTL-Low) or TTL-Low
(switch off with TTL-High) signal.
6.1. Two-point control: Change type of control via action
You can switch between types of control during measurement via the Action
module. To select the different types you have to use the following entries in parameter field ”change control”:”
8-24
ServiceLab
Chapter 8: Control Module Group
1
control with switch free range of tolerance
2
control with premature switching
3
control with delayed feedback
4
control with delayed yielding feedback
Other values won’t take any effect, so no action will be performed.
Before starting measurement, define useful parameter of the individual types of
control in the accompanying channels of the module.
Hints: To select the correct type of control to be useful in your application you
should consider the following quality criterions:
Time to reach the requested desired value tstart
Maximum of overshoots appearing after reaching the desired value Amax
Minimum of undershoots appearing after reaching the desired value Amin
Switching operations of switching element (Relay)
To reduce the latency, the Two-point control should (such as each controller in
ServiceLab ) be used with a small block size (near 1).
The parameter to define the several control characteristics (settings in Options
dialog box) can also be set using Global Variables. To ascertain the parameter of
the control loop the CHR ( Chien Hrones Reswick approximation) or Ziegler and
Nichols algorithm is recommended.
You are allowed to change control characteristics during measurement.
You can switch
• manually or
• using an event driven Action
Note: the characteristic will change at that moment a new data block comes into
progress.
6.2. Control with switch free range of tolerance
In this mode you are able to increase the hysteresis, so you will create artificial
inertia in the system. Define a switch free range of tolerance (Setting as a percent
of the desired value) around the desired value between level (TTL-High or TTLLow) should not change.
8-25
Two Point Control (optional)
ServiceLab
6.3. Control with premature sw itching
Two-point controls followed by switches (relays) always have hystereses.
Switching on is always at a higher level than switching off, because magnetic
fields, friction and other influences shift the break-over point. Because of the
hysteresis, the Two-point control won’t switch off if the desired value is
reached. The break-over point is reached at x = w + xL. If control is switched
off, the controlled condition follows the turn-off curve until the value x = w - xL
is reached and switches on. This cycle repeats with the constant fluctuation range
of 2 * xL. To minimize fluctuations, it is necessary to minimize the hysteresis
xL.
To reduce the delays at the break over points, you can change the switching level
prematurely. If the true value approximates the desired upper value, you can, for
example, turn off the heat or turn on a cooling fan. If the true value approximates
the desired lower value you can turn on the heater or turn off the fan. You can define the upper and lower break-over point separately (as a percentage of desired
values).
6.4. Control with delayed feedback
Control is disturbed by the periodic fluctuation of the control value. It increases
in control loops with large delay times. Normally you can’t change the loop pa8-26
ServiceLab
Chapter 8: Control Module Group
rameters, so you can improve behavior of these loops only by modifying the controller itself.
First, let's take a look onto the reasons for large fluctuations:
We intend a simple Two-point control without a base load and with surplus
power of 100 % (w = ½ * xmax). In the time 2 * Tu, the complete 100 % power
was switched on. This causes a power push of Yh * 2 * Tu . Because of the inertia of the control loop, this push is seen as an overshot of the reference magnitude. The larger the delay of the control loop, the longer the power will stay and
the fluctuation margin d x will also increase.
If controller could switch more often than at 2 * Tu , the magnitude of power
pushes and the fluctuation would decrease. Of course, you must accept a higher
switching frequency, but this is not a problem when using electronic switching
components (Thyristors, Triacs, Transistors).
This behavior of the controller is reached by using:
The control response of a Two-point control is mainly affected by the properties
of the control loop. For example, in a control loop with delay and dead time period length and where the amplitude depends on the ratio Tt / T. Using feedback,
the constant hunting around the desired value is nearly removed. With appropriate feedback components, you can force a time response similar to a continuous
action controller. This type of control is called continuous equal-type control.
The Two-point control with the feedback presents a closed loop, so it is it’s own
control loop inside the ”external” control loop. T1, the time constant of the feedback element (Input as seconds) is defined much smaller than the loop constant
Tg. This causes a faster increase of xr than the reference magnitude x, so breakover points are reached earlier.
Output quantity xr (t) is still affected by K1 in the following formula.
t
⎛
−
x r (t ) = y R 0 ⋅ K r ⎜⎜1 − e Tr
⎝
⎞
⎟
⎟
⎠
If the time constants of the controlled system and feedback are favorably tuned,
the switching cycles at the output of the controlled system are nearly undetectable, so the result is comparable to continuous control. More exact theoretical
8-27
Two Point Control (optional)
ServiceLab
examination shows the behavior of a Two-point control with delayed feedback is
similar to the continuous PID control.
6.5. Control with delayed yielding feedback
The theoretical preliminary background for this type of control is the same as in
the description for control with delayed feedback type.
If a feedback element is selected with different transient response, you can remove the remaining deviation.
Recommended behavior is the delayed yielding feedback. If the excitation is
jerky this control device starts with a delayed output quantity, reaches a maximum and decreases to zero.
A delayed yielding element is built by two T1 elements used in parallel with different time constants. The output magnitudes are subtracted.
The xr (t) output quantity is affected by K1a, T1a, K1b and T1b in the formula.
−t
x 1(t) = y R1 * K 1a (1 − e T1a )
−t
x 1(t) = y R1 * K 1a (1 − e T1a )
A control with delayed yielding feedback shows a similar response to the continuous PID control.
8-28
ServiceLab
7.
Chapter 8: Control Module Group
Time Delay Module
Use this module to generate a time delay in the signal flow by preceding the incoming signal with a defined number of blocks of
zero values. Then, the delayed data will be transferred unchanged.
Input and Output Characteristics
Number of Inputs:
Input Block Size:
Number of Outputs:
Output Block Size:
Max. Number of Modules:
up to 16
any
same as number of inputs
same as input block size
any
This module delays the incoming signal for an adjustable number of blocks. The
delayed part of the signal is stored in this module and passed on to the output n
blocks later. The first n blocks are filled with zero values. This module is necessary if an application requires closed data loops.
The Enable Signal Loops option defines the main working mode of the module.
If the option is activated you can feedback signals. So you are able to
send signals back to the input of already processed modules (e.g. for
simulation of PID loops). In this case, the signal at the input must have exactly the same signal sampling rate and block size.
If the option is disabled each kind of data may be processed, but signal
loops are not available in that mode.
8.
Latch Module
Since this module provides four basic operations, you must first
select the function type when you install the module.
This module provides four function types:
Data throughput depending on set input,
Latch all channels on action,
Latch all channels on TTL high on set input,
Set Global Variable
Synchronize output data rate to set input.
8.1. Data throughput depending on set input
This module passes an input channel through or keeps the last data value (with
constant output) - depending on the state of the control signal.
8-29
ServiceLab
Latch Module
Input and Output Characteristics
Number of Inputs:
Input Block Size:
Number of Outputs:
Output Block Size:
Max. Number of Modules:
up to 8 pairs (1 data input and 1 control input)
same as global block size
up to 8 (same as input pairs)
same as input
any
This module provides 1 data input and 1 control input per channel for each data
output. The upper of the 2 inputs is the control input and the lower one the data
input.
If a TTL High level (5 Volt) is present at the control input the data at the
data input is simply passed through.
If a TTL Low level (0 Volt) is present at the control input, the last data
value (at which the control input was at High level) is latched as long as
the Low-level signal is present.
At the beginning of the measurement 0 is output until the control input is set to
High level the first time.
8.2. Latch all channels on action
This module passes an input channel through or keeps the last data value (with
constant output) - depending on the asynchronous action “Generate Data”
In the worksheet this module can process up to 16 data channel.
Use the Channel Bar to specify the number of channels and the channel to be set
(selected channel).
Input and Output Characteristics
Number of Inputs:
Input Block Size:
Number of Outputs:
Output Block Size:
Max. Number of Modules:
up to 16
same as global block size
up to 16 (same as inputs)
1
any
At the beginning of the measurement the output is 0 until the first value is received.
This module can work in two modes :
If Output of one value is chosen, 0 is output when the measurement starts,
until the event defined in the Action module occurs. The output value has
the start time of the Action and a block size of 1.
If Output of one complete data block is chosen, blocks filled with 0 are
output when the measurement starts, until the event defined in the Action
module occurs. T he output block has the start time of the action with an
unchanged block size.
8-30
ServiceLab
Chapter 8: Control Module Group
Sampling rate is:
global Sampling rate
Block Size at input.
Input channels are allowed to have different sampling rates and channel types.
The last received value is sent to Output.
8.3. Latch all channels on TTL high on set input
This module passes an input channel through or keeps the last data value (with
constant output) - depending on the TTL level of the control signal.
In the worksheet this module can process up to 15 data channels. Channel 16 is
always the control channel. Use the Channel Bar to specify the number of channels and the channel to be set (selected channel).
Input and Output Characteristics
Number of Inputs:
Input Block Size:
Number of Outputs:
Output Block Size:
Max. Number of Modules:
up to 15
same as global block size
up to 15 (same as inputs)
1
any
This module may be used in two different modes.
8.3.1
Mode 1: Output of one single value
At the start of the measurement the output is 0 until the first value is received. If
at least one TTL high level (5 Volts) is present at the control input, each output
channel will output one block of data with size 1 with the same starting time as
the block at set input.
Sampling rate is: global Sampling rate
Block Size at input.
If several TTL High levels are detected in one block (depending on global sampling rate and Block Size) only the first value is considered. The module ignores
all TTL high level values until next block starts. This ensures blocks with monotonically increasing start times.
8.3.2
Mode 2: Output of one complete block
At the beginning of the measurement, the output block is filled with 0 until the
first value block is received. The block length at control and data inputs has to be
the same (otherwise the measurement stops), but may be different in type (e.g.
normal sample at the control, FFT data at the data inputs). At the output, the data
type, sampling rate and block size are the same as the corresponding input. If the
block at the control inputs contains at least one TTL-high value, the actual data
block is sent as the new block to the output. Otherwise the last block is output.
8-31
ServiceLab
Latch Module
8.4. Synchronize output data rate to set-input
This module synchronizes the samples of up to 15 data channels to the data rate
of the set input.
Use the Channel Bar to specify the number of channels and the channel to be set
(selected channel).
Input and Output Characteristics
Number of Inputs:
Input Block Size:
Number of Outputs:
Output Block Size:
Max. Number of Modules:
up to 15 data inputs + 1 set input
same as global block size
up to 15 (same as data inputs)
same as set input
any
All values at the output are the same as the input values, but data rates are
adapted to the Set input (synchronized). Type of data, block size and sampling
rate of the output data are the same as the data at the set-input.
This module is able to synchronize data of different channels to same data rate,
allowing these data channels to be processed in common.
8.5. Set Global Variable
This module writes an input channel into a Global Variable.
Input and Output Characteristics
Number of Inputs:
up to 16
Input Block Size:
same as global block size
Number of Outputs:
up to 16 (same as inputs)
Output Block Size:
1
Max. Number of Modules: any
Use the Channel Bar to specify the number of channels and the channel to be set
(selected channel).
Input values are written into the defined Global Variable. You can select whether
the module passes through the signals. Channels are independent, but it is also allowed to write into the same variables.
There are two options:
Global variable will be refreshed with each received data block.
Global variable is refreshed by the Set global variable event driven Action.
8-32
ServiceLab
9.
Chapter 8: Control Module Group
Signal Router (optional)
This module uses a control input to determine which output channel will be activated
Input and Output Characteristics
Number of Inputs :
Input Block Size:
Number of Outputs:
Output Block Size:
Max. Number of Modules:
15, with one control input
as input
up to 15
as input
any
Depending on the signal at the control input or on a defined time the module can
switch the input signal to one of up to 16 output channels. Only one output receives data at a time. Use this module to control the data flow between two or
more exclusive operations.
In the worksheet, this module can have up to 16 signal outputs.
Since this module provides different basic operations, you must first select the
function type when you install the module. This module provides two function
types:
Amplitude controlled
Time controlled
9.1. Input Controlled Router
Input and Output Characteristics
Number of Inputs :
Input Block Size:
Number of Outputs:
Output Block Size:
Max. Number of Modules:
1 with one control
as input
up to 16
global block size
any
Depending on the signal at the control input the module can switch the input signal to one of up to 16 output channels. Only one output receives data at a time.
Use this module to control the data flow between two or more exclusive operations.
Module Settings
The Control Input... setting controls the operation of the module using the value at
the control input. This setting is valid for all channels.
Edge Controlled Increment: If the input signal receives a rising edge, the
module switches the output to the next active channel.
Edge Controlled Decrement: If the input signal gets a rising edge the module switches the output to the next active channel.
8-33
ServiceLab
Signal Router (optional)
Amplitude controlled: Depending on the amplitude of the signal at the con-
trol input the module (truncating the decimals) switches the output to the
corresponding channel. (e.g. Level is 5.3 V -> Channel 5 ; 0.7 V -> Channel 0).
9.2. Amplitude Controlled Router
Input and Output Characteristics
Number of Inputs :
Input Block Size:
Number of Outputs:
Output Block Size:
Max. Number of Modules:
----up to 16
global block size
any
General Settings
If the Restart at the end of cycle option is active, the module starts again with
channel 0 when the last active channel is reached. If the option is disabled, the
input is routed to the last channel when the last channel is reached. You can use
an Event Driven Action to reset to the start of the cycle, or to go back one channel, or go forward one channel.
Channel Specific Settings
The Router schedule for this channel setting defines the time interval the module
has to wait to switch from the active to the next channel. This setting is specific
for the selected channel. The value in the edit field defines the length of interval.
You can use
blocks
seconds
minutes
hours
8-34
ServiceLab
10.
Chapter 8: Control Module Group
TTL Pulse Generator Module (Timer)
This module can generate TTL compatible signals according to
the defined duty cycles .
Input and Output Characteristics
Number of Inputs :
Input Block Size:
Number of Outputs:
Output Block Size:
Max. Number of Modules:
----up to 16
global block size
any
The module generates TTL compatible signals with definable low and high
phases. TTL high equals 5, TTL low equals 0. Like the Generator module, this
signal is provided at the global block size and sampling rate .
The low and high cycles will be generated using the duration defined in
Phase 1. The phase duration can be defined in seconds, minutes, hours,
days or samples. The settings of Phase 2 are computed from the settings
in Phase 1.
Level Phase 1: define the level (TTL low or TTL high) with which
Phase 1 starts.
If a value is entered for the Stop after … Cycles option, signal generation
will be stopped after the entered number of cycles. If no value is entered
or if it is 0, the time slice will run continuously
Start defines the start time of phase 1:
at once: Phase 1 starts with starting measurement.
after delay: Phase 1 begins after expiration of time defined in field time.
at time: Phase 1 starts at the in field time defined time (base system time).
Format defines whether date also will be considered to start phase 1.
Restart cycle: You can define the time the cycle will restart with phase 1:
After measure time: Restart begins after expiration of time defined in
time field .
hour:
This button is active if as the time base day is chosen. The restart of cycle begins on x day at
hh:mm:ss hour.
If a value is entered for the Stop after ... Cycles option, signal generation
will be stopped after the entered number of cycles. If no value is entered
or if it is 0, the Time Slice will run continuously.
8-35
ServiceLab
Stop Module
Button Options
This button opens a dialog box to define the synchronization and block size used
in this module.
11.
Stop Module
This module pauses or stops the entire measurement if certain
predefined conditions are fulfilled.
Input and Output Characteristics
Number of Inputs:
Input Block Size:
Number of Outputs:
Output Block Size:
Max. Number of Modules:
up to 16
any
----any
This module can pause or stop a running measurement following conditions dependent on the data values. The effect is the same as pausing or stopping the
measurement using menu commands or the Function Bar icons.
Action determines whether the measurement is to be paused or stopped. The action will be performed when specified conditions are fulfilled:
Function
Condition: action carried out …
Parameter
Blocks
Samples
Seconds
Minutes
Hours
… after the defined time
Low Leve l
… at a TTL low level of 0.8 (= Below
Limit/Parameter set to 0.8)
… at a TTL high level of 2.0 (= Exceeding Limit/Parameter set to 2.0)
… if signal values fall below specified
level
… if signal values exceed the specified
level
… the action will not be performed at
all (no operation)
High Level
Below Limit
Exce eding
Limit
Never
8-36
… after the defined number of data
blocks
… after the defined number of samples
number of
blocks
number of
samples
time in selected unit
----limit
limit
---
ServiceLab
12.
Chapter 8: Control Module Group
Global Variable Read
Use this module to generate a data channel using the value of a
specified Global Variable
Input and Output Characteristics
Number of Inputs:
Input Block Size:
Number of Outputs:
Output Block Size:
Max. Number of Modules:
(1 control input)
global, or as control input
up to 16
global or 1
any
In the worksheet this module can read up to 16 different Global Variables and
put these values to the outputs.
Use the Channel Bar to specify the number of channels and the channel to be set
(selected channel).
The following settings are valid for all channels:
Synchronization: The module output can be synchronized with one of the
available time bases or with a control-input. If the Input option is selected, the module has an input marked with I. In this mode the output of
the module will be synchronized with the stream of data received at the
control-input. It will use the same time stamp and block information as the
input channel.
Block Size at the Output :The output of the global variable channel can
use the global block size defined in the time base or it can use a fixed
block size of 1. If a block size of 1 is selected, one value is sent to the
output with each block of data (global setting). The sampling rate in that
case is adapted as follows:
Example:
global sampling rate 1 kHz , Block Size 512
=>
(1000/512)=
adapted
sampling
rate1.95
The following settings are valid only for the active channel.
Global Variable: Specify, for each channel, the name of the global variable to be sent to the corresponding output. Right mouse click to open the
context menu where Global Variables... opens a list box to select one of
the available variables.
Use the arrow button at the right to move the selected channel to the next
channel. If there is no activated channel, the next channel will be activated with the next variable in numerical order selected.
Use defined prefix as channel name : Choose this option to use the description defined in the global variables setting as the channel name.
8-37
ServiceLab
Global Variable Write
If Real Time Output is switched on, data is output in real time. A block is
not sent to the next module until a full block of data values is ready.
13.
Global Variable Write
Use this module to save a data channel to a specified Global Variable
Input and Output Characteristics
Number of Inputs:
Input Block Size:
Number of Outputs:
Output Block Size:
Max. Number of Modules:
16
global
-----any
In the worksheet this module can save up to 16 different Global Variables.
Use the Channel Bar to specify the number of channels and the variable to be set
(selected channel).
The following settings are valid for all channels:
With Every Input Block: The Global Variables are refreshed each time a
complete block is received.
On Action: The Global Variables are refreshed by an action of an Action
module.
The following settings are valid only for the active channel.
Global Variable: Specify, for each channel, the name of the global variable
to be sent to the corresponding output. Right mouse click to open the context menu where Global Variables ... opens a list box to select one of the
available variables.
Use the arrow button at the right to move the selected channel to the next
channel. If there is no activated channel the next channel will be activated
and the next variable in numerical order is selected.
The Copy Inputs to Outputs option provides the module with one output
for each activated input channel. Incoming data is sent unchanged to the
output.
8-38
ServiceLab
14.
Chapter 8: Control Module Group
Block Time (optional)
This module extracts the time stamp information from the current
data block and writes it to the defined global strings .
Input and Output Characteristics
Number of Inputs:
Input Block Size:
Number of Outputs:
Output Block Size:
Max. Number of Modules:
16
any
----any
Module Settings
Use the parameter settings to define the global strings to store the Time and Date
information. Use the check boxes to suppress the information.
8-39
Block Time (optional)
8-40
ServiceLab
ServiceLab
Chapter 9: Display Module Group
Chapter 9: Display Module Group
Y/t Chart
x
X/Y Chart
x
Chart Recorder
x
Analog Meter
x
Digital Meter
x
Bar Graph
x
Status Lamp
x
List Display
x
optional
Module
Basic
version
This group consists of modules which display or present the data.
Overview
The modules of the Display module group differ from other modules. After selecting a Display module from the Module menu or the module bar, it creates two
elements: a worksheet symbol on the worksheet and a display window icon at the
bottom of the screen in the ServiceLab tree view and in the worksheet view .
A display module presents data blocks in a graphical or numerical way.
The worksheet symbol is integrated into the worksheet and connected to
the other modules by data channels,
The icon represents a separate window, which you must restore (or
"open") whenever you wish to use the display function during an experiment.
9-1
ServiceLab
Chapter 9: Display Module Group
Display windows of some display modules have separate menu systems
to select display options or functions.
While the experiment is running, Event Driven Actions can influence
some of these display options, if a selected event occurs.
The text and numerical value format of the display modules are specified
by the Country Specific Setup that can be set using the Windows Control
Panel.
You can integrate several display modules of the same type. Each of them has its
own name, which is shown in the icon and the window.
You can restore or minimize all the display windows contained in the worksheet simultaneously by choosing Show Dis play Windows or Hide Dis play
Windows from the View menu, or, by clicking their Function Bar icons.
You can restore each of the display windows contained in your worksheet individually by double-clicking its icon at the bottom of the screen. You can
minimize each of the display windows individually by clicking its Minimize
button in the upper right-hand corner of the display window.
Four of the modules can display a single sample from the data block (first, last,
maximum, minimum, etc.). Four of the modules display a complete block, or multiple blocks of data at one time.
Display Module
Maximum Input Channels
Display Mode
Analog Meter
16
Single Data point
Digital Meter
16
Single Data point
Bar Graph
16
Single Data point
Status Lamp
8
Single Data point
Y/t Chart
16
Data Block
X/Y Chart
2x8
Data Block
Chart Recorder
16
Data Block (continuously)
List Display
16
Data Block
The choice of display module depends on the type of data to be displayed and the
sampling rate. The charts below shows which types of data can be displayed in
each display module, and which modules are more suited to fast or slow sampling rates.
Trigge r
Data
Analog Meter
Digital Meter
Bar Graph
9-2
•
•
•
Trigger and
Normal Data
H istogram
Data
Freque ncy
Data
•
•
•
ServiceLab
Chapter 9: Display Module Group
Status Lamp
Y/t Chart
X/Y Chart
Chart
c order
Re-
Lis t Display
•
•
•
•
•
•
•
•
Block Size: Small
Small
Large
Large
Sampling Rate: Slow
Fast
Slow
Fast
Analog Meter
Digital Meter
Bar Graph
Status Lamp
•
•
•
•
Y/t Chart
X/Y Chart
Chart Recorder
Lis t Display
•
•
•
•
•
•
•
•
•
•
•
•
•
•
•
•
•
•
•
•
•
•
9-3
ServiceLab
Y/t Chart Module
1.
Y/t Chart Module
In a separate Y/t Chart Dis play Window, this module displays
blocks of data as time or frequency dependent curves .
This module is most useful for displaying fast data, since it always processes at
least one complete block of input signals to display at one time. Using it with
very slow signals may cause long acquisition pauses. For slower data inputs, the
Chart Recorder module would be more appropriate.
ServiceLab distinguishes between time-dependent, frequency-dependent, histogram, continuous, and triggered data. Signals of different data types cannot be displayed in one Y/t Chart module. At least one Y/t Chart module must
be used for each type.
Input and Output Characteristics
Number of Inputs :
Input Block Size :
Number of Outputs:
Output Block Size :
Max. Number of Modules:
up to 16
any
same as number of inputs
same as input block size
any
The data will be displayed in the Y/t Chart Display Window attached to each
module and tagged with the same module name. Double-clicking its icon at the
bottom of the desktop can open the display window.
The global parameters for the display can be entered in the module configuration
dialog box. These parameters define the scaling of the X-axis or types of X axes
as well as curve-dependent values like amplitude scaling and the selection of
units. The number of curves to be displayed can be chosen using the Channel Bar.
Global Settings (all activated channels)
Zooming: set Zooming Options to constrain how zooming expands the
display area.
If the Auto Scaling is selected, all values of the data block are tested
for maximum and minimum values before they are displayed. The
chart is scaled and displayed using these values. Use this function to
ensure that peaks will be displayed regardless of value.
Note that the scaling can change continuously and will slow down
the display speed.
X and Y Direction: The display area is expanded exactly as selected with the Zoom cursor.
9-4
ServiceLab
Chapter 9: Display Module Group
Only Y Direction: The display area zooms only in the vertical direction as selected. The scale of the X-axis remains as defined.
Only X Direction: The display area zooms only in the horizontal direction as selected. The scale of the Y-axis remains as defined.
The number of curves to be displayed can be chosen using the Channel Bar.
The Copy Inputs to Outputs option provides the module with one output
for each activated input channel. Incoming data is provided unchanged at
the output.
Specific Channel Settings
These settings apply only to the selected channel.
The Unit can be specified.
To modify the Y Scaling, click on the Y Scaling Button.
To modify the X Scaling, including the mode, the channel type, display
width, and time scale, click on the X Scaling button.
To display an additional Reference Curve in the display window, use the
Reference Curve button to open the settings dialog.
Before using this option use the Reference Curve Module to create a useful
Reference Curve.
Some of these parameters may also be modified using the display window menu
functions. These menus offer several additional display options, including the selection of colors, fonts or line styles. All the commands for interactive graphical
analysis of curves, like zooming or measuring cursors, are available.
1.1. X-Axis Settings - Time Scale
Channel Type
Automatically: This option sets the X-axis labeling to seconds, minutes
and hours from the start of the measurement. Each time the display is updated, the X-axis is also updated. Minutes or hours are only displayed
when necessary.
Time data: The X-axis is shown starting at zero up to the time corresponding to the block length. This scale is fixed.
Frequency data: This setting is only useful with FFT data. A frequency
scale is shown.
Histogram data: This setting is only useful with Histogram data.
Free : This option offers a largely free setting of axis parameter.
Additionally, the following options for X axis scaling are available:
Use Scale to define the number of labeled and blank ticks to display on the
axis.
9-5
Y/t Chart Module
ServiceLab
If the step dx switch is used, you can define an exact distance between
two ticks based on the in unit defined value.
1.1.1
Time Scale
Running Time Scale: This time scale uses the elapsed time since the start of the
measurement to label the X-axis. The time is displayed in seconds, minutes and
hours. The axis will be updated for each block.
Fixed Time Scale: This time scale uses the internal time scale of each displayed
block. The axis will be the same for each block starting at 0.
The duration of the interval to be displayed can be specified in the dialog
box. The display width can be specified as either blocks or as seconds.
The default is the display of exactly one block .
If the length is entered in blocks, the specified number of blocks will be
collected and displayed simultaneously.
If the length is entered in seconds, data will be collected and displayed
according to the defined time.
If the display interval is too short to contain more than one sample, every
sample will be displayed as a straight horizontal line.
You can switch between the scaling options while the experiment is running.
These settings should be chosen considering the following:
While a minimum limit does not exist, only one line for every sample is
drawn if the chosen display width is less than or equal to the sampling
rate of a data channel.
The maximum setting depends on the sample distance of the display channels and on the physical memory available on your computer.
The experiment stops with an error message if the number of blocks or
time specification is too large.
Display Mode
Standard: When the number of blocks, as defined in the interval to be
displayed, is reached, the window will be updated. The window contents
are completely redrawn.
Fast: Each new block is displayed after the previously displayed value.
The first value in the display window is removed.
Wiper: The new values are displayed after the previously received value
until the complete display interval is used. Then the new values are displayed at the beginning of the display window, overwriting the already
displayed values. The Window will be wiped out from the left to the
right. To get a typical display, the interval should be >10. There will be
no display of values with the standard setting of 1.
If the Show wiper option is active, a vertical line appears in the display
marking the point where new values are plotted.
9-6
ServiceLab
Chapter 9: Display Module Group
Use Zoom to define the range to be displayed if the Zoom function is activated.
1.2. Y Scale… (Amplitude Scaling)
You can also double click with left mouse button on the axis to open the dialog
box for setting the scale ranges for each curve.
Use Settings to set the display range of the channel. Choose the Auto option to
use the default settings. Choose user defined to change the Scale and String format settings.
Use Scale to define the number of labeled and blank ticks to display on the axis.
String format allows you to choose normal, exponential and Engineer format as
the displayed number on the axis.
If you deactivate Display Channel, that curve will not be drawn, and the drawing
area for that curve will remain empty (although signals are correctly received at
the module input). If you have selected that channel's scale to be displayed, it
will still be provided in the display window in the One Chart mode (although
none of the traces actually drawn refer to it).
If you choose the logarithmic scaling, the Y-axis is scaled using a logarithmic
scale. Use this option, for example, to display FFT data channels. Note that the
display range must be greater than 0.
If only one Y scale, but several channels, are displayed in one Y/t Chart module,
you can select a single channel to display its scale by clicking the left mouse button inside the corresponding color or legend area (fast switch).
1.3. Reference Curve
Display Reference Curve activates the display of the Reference Curve function.
Additionally, you can display a tolerance range with maximum and/or minimum
values. The following options define this tolerance band:
Min/Max
Reference Curve ± Percentage
Reference Curve ± (Constant + Percentage)
Reference Curve ± Constant
Reference Curve ± (n x standard deviation)
The desired settings are entered in the edit field below the options.
The Display option allows you to modify the tolerance band display. You can
choose several options, starting with a simple line up to a fully filled exclusion
area.
The Color... button opens the color selection menu to select the color used in the
tolerance band.
9-7
ServiceLab
Y/t Chart Module
The Replay Reference Curve Option re-starts the reference curve if the end of
the file is reached. This allows you to use a ''short'' Reference file to check longtime or open-ended experiments.
In the Reference Curve area the selected Reference Curve file is shown. The
File... button opens the file menu to choose a Reference Curve file.
Before using this option, use the Referenc e Curve Module to create a useful
Reference Curve.
Display Window
The data will be displayed in a display window (the Y/t Chart Display Window)
associated with each module and tagged with the same module name. Doubleclicking its icon at the bottom of the desktop can open the display window.
The display window associated with the Y/t Chart module can display up to 16
signal curves simultaneously in one diagram. The data values are always displayed in blocks. As soon as a new block is complete, the previous display is
deleted and the new values are displayed.
The display window menu system offers several additional display options, including the selection of colors, fonts or line styles. In addition, all the necessary
commands for interactive graphical analysis of curves, like zooming or measuring cursors, are available.
1.4. Display Window Menu Options
The display style and the interactive graphic commands can be chosen from the
menu or the Function Bar.
1.5. Axes Functions
X-Scale
Choose this command to define the X-axis (time, frequency, bins)
scale ranges for the Y/t Chart. All the displayed curves use one joint
X-axis that is chosen from the X-axis dialog box of the Y/t Chart
module or from the Menu or Function Bar of the Y/t Chart Display
Window. See above for details.
Y Scale… (Amplitude Scaling)
Choose this command to define Y-axis scale ranges for each curve.
The left part of the dialog box displays the channel list. Each channel
activated in the module configuration dialog box is represented as
Input X (X denoting the number of the activated channel). Select
(highlight) the channel whose settings you wish to modify. See above
for details.
9-8
ServiceLab
Chapter 9: Display Module Group
If only one Y scale, but several channels, are displayed in one Y/t Chart module,
you can select a single channel to display its scale by clicking the left mouse button inside the corresponding color or legend area (fast switch).
Scaling Options
Use this command to determine how many scales, and which ones,
are to be provided in the display window. These settings are primarily used for multi-trace display, where more than one channel has
been activated for display. Only the One Chart mode will be affected, unless you deactivate scaling.
Up to four different amplitude scales can be assigned to each display window.
These scales can be related to the inputs that are to be displayed. The scaling
boundaries of these curves are then displayed on the related scales.
In the Multiple Chart mode, an appropriate scale is derived from the display
range values in the Amplitude Scale dialog box. It will be placed next to the
curve display to which it belongs.
No more than four different scales can be activated in the One Chart mode. The
scales will be arranged next to each other on the left and on the right of the drawing area for the concentrated traces.
The left part of the dialog box displays the channel list. Each channel activated in the module configuration dialog box is represented as Input X ( X
denoting the number of the activated channel). Select (highlight) the channel you wish to assign to a scale. The channels already assigned cannot be
reused.
Then press one of the four arrow buttons on the right. Initially you must
assign the scales in ascending order. Once they have been assigned a
channel from the list, you may change any entry.
To turn a scale off, choose Off in the channel selection list and “assign” it
to that scale. You can only turn the last of the assigned scales off. If you
turn them all off one by one, no scale will be displayed.
A scale selected here will be displayed even if the associated trace will not
be displayed because you have deactivated Display Channel in the Amplitude
Sc ale dialog box.
Because of the four scales restriction in the One Chart mode, there may be
traces drawn in the drawing area for which exact scaling is not possible, as
their scales cannot be displayed. Their values may differ considerably from
the values that the displayed scales indicate.
9-9
ServiceLab
Y/t Chart Module
1.6. Display Functions
Function Bar/Menu
The Function Bar contains icons that provide easy access to frequently used functions and options from the display window menus. Just click the icon representing that function.
A check mark ( ) indicates that the Function Bar or the Menu is displayed. All
the commands represented on the Function Bar are also available from the
menus. You can click over the Display Window with the right mouse button to
display a short cut menu that contains all of the menu options.
Window
One Chart mode displays all the curves in one combined diagram.
The individual traces may cross each other. The advantage of this
mode is that maximum resolution of the amplitude is available for
each curve. Its disadvantage may be that the diagram becomes confusing and that not every scale can be displayed.
Multiple Chart mode displays each curve in its own area in the dis-
play window. This enhances the clarity of the display, but the resolution of the amplitudes may not be as good.
No Axes ( Y/t Chart) removes the axes and labeling. Only the curves will be displayed. This provides a high-resolution display.
Display Y Unit: the unit of each channel will be displayed in the diagram above
the Y-axis. For displays with several charts, Multiple Chart mode may be more
suitable.
Grid : Use this command to display, or hide, a grid in the diagram. The
Color and Line Style of the grid can be selected in the Window: Colors and Lines box.
Font Style…: Use this command to select font styles to apply to the
scales and the displayed units.
This command opens the Windows dialog box for font styles, where you can select the font, and font style (plain, bold, or italics) as well as the font size. These
settings apply to the scales and to the displayed units (if they are to be displayed).
Colors and Lines…: Use this command to modify the colors and line
styles for all the elements of the display window. To modify the settings for an object, the object must first be selected from the object
list. Depending on the object type, different options are available.
Click the Color button to open the Windows color definition box for the selected
object.
9-10
ServiceLab
Chapter 9: Display Module Group
To modify the Line Style and Thickness of the traces, select these items
from the list first, where they are represented as Input X (X denoting the
number of the activated channel).
You can choose all the colors of the display window elements directly.
Press the right mouse button inside a display element to open the
Color Selection box.
If the input curve defined for x is not a closed line, you can fade out marks
for better display. If that function is activated, all xx samples are marked
in the display window. This function is not an average operation. Samples
that are not displayed are only just skipped in the display.
Show/Hide/Setup Legend
The Legend function displays the Channel Name and the unit at the left bottom of
the window. If the legend is hidden, only the channel numbers are displayed.
The Setup Legend menu function changes the display characteristics of the legend.
The Font setting changes the font, style and size of the font. These settings
determine the height and width of the legend area.
The Color setting changes the color of the legend text.
The Unit setting shows or hides the chosen unit after the channel name.
Show/Hide/Setup Header
The Header function shows or hides an additional text area at the top of the display window. You can also use a global string or variables as text. Choose one
you have defined in Option: Define Global Strings/Variables menu or select one
of the predefined strings or variables. Click with right mouse button in the edit
field to open the context menu to select from the available strings/variables.
The Setup Header menu function changes the display characteristics of the legend text.
The Text menu function allows you to edit the text string of the header.
The Font setting changes the font, style, and size of the font. These settings
determine the height and width of the legend area.
The Color setting changes the color of the header text.
Waterfall Display (Y/t Chart)
This command switches the Waterfall mode on or off.
Instead of being completely deleted after each block, the traces will be shifted
slightly to the upper right, and the trace for the new block will be added to the
diagram. As a result, the individual blocks will create a waterfall display of the
whole signal.
9-11
Y/t Chart Module
ServiceLab
Waterfalls display one signal. If the Waterfall switch is used in a diagram with
more than one signal, only the first will be displayed.
Use the Waterfall Setup command to change the shape of the waterfall.
Curves in Memory: This number determines how many blocks or traces in
the waterfall display will remain in the buffer memory for the reconstruction of the display when the window must be redrawn. For example, redrawing is necessary whenever the window has been resized and whenever an overlapping window has been closed.
Remove Hidden Lines: If this flag is set, the waterfall will be drawn
without hidden lines. Removing hidden lines intensifies the 3D effect of
the diagram.
X Shift Offset: Previous curves will be shifted to the right by the value
specified.
Y Shift Offset: Curves will be shifted upwards by the value specified.
The settings in Time Axis change the display of the x axis:
Show Time Axis: This button shows or hides the scale at the x-axis.
Mark Time Axis: This option shows the following additional information:
Running Block Number
Time
Seconds since Start of Experiment
Date + Time
Automatic Scaling: The labeling of the axis happens automatically.
Manual Scaling: The labeling is generated by using the settings at Decimals and
Tick mark every ... Blocks.
These settings change the properties of the 3-D presentation. You can:
fade in a Grid,
change the curves to 3-D-Bars,
color the walls in additional Colors (Button Box Color),
show the Bars with Black Frames
and change the Color of the Shadow of the 3-D-Bars.
If you choose the 3-D bar display you can use the X Offset and Y Offset
settings to control the distance between the bars.
Sonogram Display (Y/t Chart)
The Sonogram mode displays values indicated by different colors. Values are
ordered into 10 classes. Each class is assigned a separate color as defined in
Sonogram settings.
You can modify the settings of the colors of the displayed values in a wide range.
Color Range: Declare the color range in which your measured values will
be presented.
9-12
ServiceLab
Chapter 9: Display Module Group
The slider for start color defines the color for all values lower than or like
the lower limit; the end color defines the color for all values larger than
or like the upper limit. The limits can be entered in the boxes under the
color range. Between these two colors ServiceLab calculates a matching
vignette. The regulators for brightness and saturation allow you more
control over the representation of the color-area.
Range: Declare the interval within which the color-separation of the
Sonograms should take place. All values with amplitudes lower than the
low border ( from:) are displayed in the start color; all values with amplitudes larger than the upper border ( until:) are displayed in the color of the
right border. To all values within this interval, a matching color value is
assigned in accordance with the definition of the color range.
Options
Stored lines: The declared number of lines is stored internally and the
lines are shown again about one line displaced, so that the complete
drawing surface can immediately be shown without the need to be re-built
for drawing.
Grey scale: This option switches the representation into the gray scale
mode. No colors are shown for the values, but only gray levels.
Export
Copy to Clipboard: Use this command to copy the contents of the window onto the Windows clipboard. The curve that is copied will include scaling information and the background.
You can paste the diagram into other Windows applications or documents, including Paintbrush or Word for Windows, by choosing the appropriate command
from the target application menu (usually Paste from the Edit menu).
Print: Use this command to print the contents of the current window
on the default Windows printer. With a black and white printer, the
background color will be ignored, and all objects will be printed in
black.
Choose Page Format from the File menu to select additional information to
include on the printout, and to specify the page layout and page frames.
Choose Printer Setup from the File menu to select paper size and paper
source, orientation, printer resolution, and other settings for your active
printer model.
To activate a different printer model connected to your system, or to install
and configure a new printer, choose the Printers option in the Windows
Control Panel. Refer to your Windows documentation for further information.
9-13
ServiceLab
Y/t Chart Module
1.7. Survey Functions
Freeze Display Window: Use this command to freeze the current dis-
play window. The measurement is continued, but the display will not
be updated until Freeze is turned off. This function is useful for detailed visual analysis with Measuring Cursors, or before zooming is
performed.
Continue : Use this command to continue the display of a frozen dis-
play window. The display will be updated with current data.
Zoom: Use this command to zoom the display. When the Zoom button
is pressed, a zoom cursor appears, and a zoom window can be defined in the diagram area by pressing the left mouse button and dragging the cursor. The coordinates of that zoom window will be used as
the new boundaries for the axes. You can use the Zoom command
multiple times to zoom in on an area in several steps.
Unzoom: Use this command to unzoom the display and to return the
display to the original scaling. The first unzoom command returns the
display to the previous zoom step, the second returns it to full display. Continuing a frozen and zoomed display will not unzoom it.
Zooming Options can be specified in the Y/t Chart configuration dialog box. You
can constrain zooming to Only X Direction, Only Y Direction , or X and Y Direction .
Move Left, Move Right: If the display window is zoomed using the
Zoom function, you can move the displayed sample area using these
buttons or menu commands.
Cursor: Use this command to insert two measuring cursors into the
diagram and to open a cursor window. The cursors can be positioned
by dragging them with the mouse or by using the cursor keys of the
keyboard. The cursor window displays the current cursor values. If
several traces are drawn in the display window, the cursor window
offers a channel selection field.
The values of the last moved cursor can be inserted into the display
window using the space button. The values will be shown inbetween small borders with an arrow that marks the cursor position. If
several traces are drawn in the display window, the cursor window
offers a channel selection field.
If Free Cursor mode is selected from the menu, you can move the cursor around the entire Display window. In the default mode, the cursor
is related to the values and moves only on the curve.
Use the Small Cursor option to display the cursor as a cross hair to
get a better view of the cursor position.
9-14
ServiceLab
Chapter 9: Display Module Group
If the Extended Cursor mode is selected from the menu, additional
calculated values will be shown.
If Horizontal Cursors is selected from the menu, two horizontal cursors will be inserted in the display window in addition to the two vertical cursors.
These values are always displayed in the cursor window.
Yn
tn
dt
f
the amplitude value for the cursor (n can be 1 or 2)
the time corresponding to the cursor position
the time difference between the two cursors
the frequency between the two cursors
The following additional values are only displayed in the Extended
Cursor mode.
dY
dY/dt
Min/Max
Integral
RMS
difference between the amplitude values
mean slope between the cursor positions
minimum/maximum of the interval between the cursors
integral of the curve between the cursors
The Root Mean Square value between the two cursors
You can Write Cursor Data that is displayed in the cursor window to a file in
DASYTEC or ASCII Format. You can select the option from the Display Menu,
the Function Bar or via an Event Driven Action .
1.8. Options
In this dialog box you can choose the information to be displayed at the actual
cursor position.
Information: Select the kind of Information and the Number of Digits to be
displayed.
Measured value,
Time value and
Unit
Display: This setting specifies how the cursor data is displayed in the Cursor window. Choose between
Integral display to calculate and display the integral of the values
between both cursors, and
Average display to display the arithmetic mean of these values.
You can also define whether the cursor data is written into Global Variables .
You can write the Time (X-Value) and the Y Value of both Cursor positions ( 1
and 2) into a variable, which can be defined in the edit field at the end of the
line.
If you select the Save selected channels... all channels option, the cursor data
of all used channels are written into global variables. The variable number is
9-15
Y/t Chart Module
ServiceLab
generated using the entered variable number in the edit line plus the corresponding channel number. Exceptions are the time data of Cursor 1 and 2 such as the dt
and f values. These data are written only once to the corresponding variable because the values are the same for all channels.
If you have written variables first in mode “actual channel“ e.g. channel 3
into variable 7 and now switch to the mode “all channels“, the number of
variable the channel 3 is written will shift from 7 to 10! (number of variable
7 + number of channel 3 = 10)
The show or hide option of single channels in the graph has no effect to store the
data in the variables until at least one channel is displayed. If all channels are
masked of the cursor measurement will stop and so the update of the selected
variables will do.
Write Cursor Options: You can select one of the following functions to store cursor data
Cursor 1:
Y value of the left Cursor
Cursor 2:
Y value of the right Cursor
Cursor 1+2:
Y value of the left and right Cursor
all Cursor Data: all data displayed in the Cursor window is written to disk. The
extended data is written only if the extended mode is selected.
all Data between Cursor 1 +2: all displayed data is written, selected by the cursor positions.
If the all Channels option is activated, the selected function is used for all displayed channels.
The all Cursor Data mode is only available for the selected channel in the cursor
window. All displayed Cursor Data is stored.
Definition of the different data channels is:
Channel 0-5: Y Cursor1, t1, dt, Y Cursor 2, t2, f.
Channel 6-11: dy, Min, Integral, dy/dt, Max, RMS (if extended cursor is activated).
The cursor data can be saved in DASYTEC or in ASCII Format. If the
all Data between Cursor 1+2 option is selected, the data blocks are highlighted
as triggered data. If the data is to be stored with the actual channel block size,
choose the Fill up the Channel Block size option. Click on the ASCII button to
change the settings for that option.
Show Cursor Text Strings: Cursor Text Strings, as defined in the Text menu option, are shown on the display. If the function is activated, this is indicated on the
menu by a checkmark.
Delete Cursor Text Strings: All previously defined cursor text strings are deleted. To delete or modify a single cursor text string, click on the string area (see
Text functions.)
9-16
ServiceLab
Chapter 9: Display Module Group
Cursor Data Format: You can choose whether time or unit is shown at the cursor
position value. You can also define the number of digits to be displayed.
Print Cursor Data: All displayed cursor data is included in the printer layout.
Show Cursor Data in Layout: If the module is connected to a linked graph object
in layout, you can display the cursor data beneath the displayed graph on the layout sheet activating that option. You can also use the usual operations in Layout
such as in the display window.
Print Cursor Data on new Page: When printing the actual display window, all
displayed cursor data is printed on a separate page.
Copy Cursor Data to Clipboard: When copying the actual display window to the
clipboard, all displayed cursor data is integrated with the clipboard layout.
Text Functions
This function allows you to place up to 20 text strings onto the display window
for documentation - such as before copying to the clipboard or before printing.
Activate the Show option in the Text Menu. You can now create a text
string. You can freeze the chart, if desired, and you can also edit while the
experiment is running.
Choose Edit New T ext String in the Text Menu. Click the left mouse button at any place in the window; a separate dialog box window appears
where you can enter the text string (up to 50 characters). Press OK and the
new text will appear inside the display window. You can change the text
position by clicking the left mouse button and dragging the text to any
place in the window. Up to 20 text strings can be created.
The appearance of the text string can be configured with the menu functions Font, Color and Frame .
Print the chart with all text strings now or copy it into the clipboard,
freeze and continue the display window or move the text strings and so
on… .
You can hide all the text strings by deactivating the menu function Show
in the Text Menu. The text strings are not deleted by hiding them.
You can delete all text strings by choosing the menu function Delete All Text Strings in the Text menu.
You can delete a specific text string, by double-click-ing the right mouse
button in the string’s rectangle.
To integrate the cursor data into the display, choose the Cursor function in
the Survey Menu. Move the left or right cursor to the position where you
want to add the cursor data. Now press the Space Key on your keyboard.
The actual cursor data is presented as value pair in the selected cursor
channel. You can move the cursor string like other text strings.
The text strings and string positions are saved with the worksheet.
9-17
ServiceLab
X/Y Chart Module
The Text menu provides functions to change the display characteristics of the text
strings in the display window.
The Font setting changes the font, style, and size of the font. These settings
determine the height and width of the edit string rectangle.
The Color setting changes the color of the edit text, except when the T ext
in Channel Color setting is activated. In this case, all text strings are displayed in the defined channel color and the Color setting is ignored.
The Frame menu function surrounds the edit text with a simple frame.
For a 3D effect, activate the menu function 3D Frame.
After you activate the Frame function, you can change the Frame Color.
2.
X/Y Chart Module
Use this command to insert an X/Y Chart Display Module to display
blocks of two dependent signals as an X/Y plot .
Input and Output Characteristics
Number of Inputs :
Input Block Size :
Number of Outputs:
Output Block Size :
Max. Number of Modules:
up to 8 pairs
any
…
…
any
Use this module to display signals from one channel plotted against those from a
second channel. The input signals will always be processed in complete blocks.
Global Settings
These settings apply to all activated channels.
Choose Standard Display to show the x/y data plotted as lines
Choose Polar Display to show the x/y data plotted as an arrow displayed
from the (0,0) coordinate point to the (X,Y) coordinate point of the pair of
values
Use the display option Delete Curves after n Blocks to display more the
one data block in a window, without deleting previous curves. The display window is reset before displaying the n+1st curve.
The X Unit can be specified.
Use logarithmic scaling to scale the Y-axis using a logarithmic scale. Note
that the Display From value must be greater than 0.
The option Copy Inputs to Outputs provides the module with one output
for each activated input channel. Incoming data is provided unchanged at
the output.
9-18
ServiceLab
Chapter 9: Display Module Group
Channel Settings
These settings apply to the selected channel only.
If you click button X scaling another dialog box opens for specific channel settings.
If you choose Y scaling another dialog box opens for specific channel settings.
Display Window
The data values from all the module entries will be displayed in a display window tagged with the same module name. The X/Y Chart display window can be opened by double-clicking its icon at the bottom of the desktop.
The display window associated with the X/Y Chart module can display up to 8
pairs of dependent signals as X/Y diagrams. The display style and interactive
graphic commands can be chosen from the menu or the Function Bar.
Some of these parameters may also be modified in the display window
menu system.
ServiceLab distinguishes between different types of data: time-dependent,
frequency dependent, histogram, continuous, or triggered data. Signals of
different types cannot be displayed simultaneously in one X/Y Chart Display
Window.
If your experiment setup yields data signals of different types that you wish
to display, use at least one X/Y Chart module for each type.
Double-clicking its icon at the bottom of the desktop can open the X/Y display
window.
Some of these parameters may also be modified in the display window menu system. These menus offer several additional display options, including the selection of colors, fonts or line styles. In addition, all the necessary commands for interactive graphical analysis of curves, like zooming or measuring cursors, are
available.
2.1. Display Window Menu Options
See Page 9-8 for details of the Display Window Menu options that are common
to the Y/t Chart, X/Y Chart and Chart Recorder.
X Axis Scale (X/Y Chart)
This function determines the scaling of the X-axis in an X/Y Chart display window.
All X channels are scaled with the chosen X scaling.
9-19
ServiceLab
X/Y Chart Module
Use Settings to set the display range of the channel. Choose the Auto option to use the default settings. Choose user defined to change the Scale
and String format settings.
Use Scale to define the number of labeled and blank ticks to display on
the axis.
String format allows you to choose normal, exponential and Engineer format as the displayed number on the axis.
If you deactivate Display Channel, the curve will not be drawn, and the
drawing area for that curve will remain empty (although signals are correctly received at the module input). If you have selected the channel's
scale to be displayed, it will still be shown in the display window in the
One Chart mode, although none of the traces actually drawn might really
refer to it.
If you choose the logarithmic scaling, the Y-axis is scaled using a logarithmic
scale. Use this option, for example, to display FFT data channels. Note that the
Display From value must be greater than 0.
Cursors
In addition to the functions described on page 9-14, the X/Y Chart Extended Cursor mode displays the following calculated values in the cursor window:
Xn
Yn
dX
dY
the X value under cursor n (n can be 1 or 2)
the X value under cursor n (n can be 1 or 2)
the X difference between the two cursors
the Y difference between the two cursors.
2.2. Write Cursor Data
If the cursor window is active, you can write selected cursor data to disk.
Choose Write Options in the Survey menu to select the data to be saved.
2.3. Options Write Cursor
You can choose from one of the following functions:
Cursor 1:
pair of X and Y values of the left Cursor;
channel 0 = X1, channel 1 = Y1
Cursor 2:
pair of X and Y values of the right Cursor;
channel 0 = X2, channel 1 = Y2
Cursor 1+2:
pair of X and Y values of left and right Cursor;
ch 0 = X1, ch 1 = Y1, ch 2 = X2, ch 3 = Y2
all Cursor Data:
all data displayed in the Cursor window is written to
disk.
9-20
ServiceLab
Chapter 9: Display Module Group
All displayed data is written, selected by the
cursor
positions;
channel 0 = all X values, channel 1 = all Y values.
If the all Channels option is activated, the selected function is used for all displayed channels.
all Data between Cursor 1 +2:
2.4. Write all Cursor Data
The mode to write all Cursor Data is only available for the selected channel in
the cursor window. All displayed Cursor Data is stored. Definition of the different data channels:
Channel ...
containing values
...
Channel ...
containing values
...
MinX
MaxX
MinY
MaxY
=
=
=
=
0
1
2
3
4
5
X Cu rsor 1
Y Cursor 1
X Cu rsor2
Y Cursor 2
dX=X2-X1
dY=Y2-Y1
6
7
8
9
10
MinX
MaxX
MinY
MaxY
dy/dx
Smallest
X
value
between
Greatest
X
value
between
Smallest
Y
value
between
Greatest Y value between both cursors.
both
both
both
cursors.
cursors.
cursors.
2.5. Data Formats
The cursor data can be saved in DASYTEC- or in ASCII-Format. If the
all Data between Cursor 1+2 option is selected, the data blocks are highlighted
as triggered data. If the data is to be stored with the actual channel block size,
choose the button Fill up the Channel Blocksize. If the ASCII Format is selected,
you can change the ASCII-Format settings by pressing the ASCII button.
9-21
ServiceLab
Chart Recorder Module
3.
Chart Recorder Module
Use this command to insert a Chart Recorder Module to display
curves of data acquired at a low speed.
Input and Output Characteristics
Number of Inputs :
Input Block Size :
Number of Outputs:
Output Block Size :
Max. Number of Modules:
up to 16
any
…
…
any
This module works with complete blocks of data, but continuously shifts the displayed curve from the right to the left. It may be used to display the current value
of a signal together with its history.
Module Configuration
Double-clicking on the worksheet module icon can activate the module configuration dialog box.
Global Settings
These settings apply to all activated channels.
Set Zooming Options to constrain how zooming expands the display area:
X and Y Direction: The display area is expanded exactly as selected with
the Zoom cursor.
Only X Direction: The display area zooms only in the horizontal direction
as selected. The scale of the Y-axis remains as defined.
Only Y Direction: The display area zooms only in the vertical direction
as selected. The scale of the X-axis remains as defined.
Choose the time-scale main unit size with the Display Options. (Display
Date or Time Unit)
Click on the X-Scaling button to modify the Time Scale
Select whether trigger events are shown as disconnected lines or by connected lines in the Display window
To modify the Print Options , click on the Print Options Button.
9-22
ServiceLab
Chapter 9: Display Module Group
The picture shows the triggered data curve with gaps, the right representation shows the curve with interconnected lines, making one continuous
line
The Copy Inputs to Outputs option provides the module with one output
for each activated input channel. Incoming data is provided unchanged at
the output.
Channel Settings
These settings apply to the selected channel.
Display Channel activates or deactivates the display of the currently selected channel.
Click on the Scaling button to modify the Y-Scaling.
Use the Reference Curve button to open the settings dialog to display an
additional Reference Curve in the display window. Use the Reference
Curve Module to create a useful Set Point Curve before using this option.
Print Options
You can add additional information onto the printed chart. Activate the function
with the Print Option switch.
These settings affect the print output. The screen display will not be affected.
The Print with Channel Color switch assigns the color of the channel to the text
(only affects color printers). Text and curves are printed in black with a black
and white printer.
Use the Channel name or Free Text radio button to print the channel number near
the plotted data curve or in the defined text area.
Other settings control the Text Position: (see the picture below)
The Left, Middle and Right switch show the text at the defined positions. All selections may be used.
The Alignment radio button defines whether the text is placed on (centered),
above or below the curve.
9-23
Chart Recorder Module
ServiceLab
3.1. Chart Display Window
The display window associated with the Chart Recorder module can display up
to 16 curves simultaneously in one chart.
Double-clicking the icon at the bottom of the desktop to open the Chart Recorder
display window. Some of these parameters may also be modified in the separate
Display Window Menu System. These menus offer additional display options.
The Chart Rec order cannot display frequency dependent data or histogram
data, but it is possible to display continuous and triggered data simultaneously in one chart.
3.2. Display Window Menu Options
See Page 9-8 for details of the Display Window Menu options that are common
to the Y/t Chart, X/Y Chart and Chart Recorder. This section describes the options that are specific to the Chart Recorder.
Time Scale
These settings modify the scaling options for the X-axis of the diagram.
All the displayed curves use one joint X-axis. It may be chosen either from the
module configuration dialog box of the Chart Recorder module, from the menu or
Function Bar of the corresponding Chart Recorder Display Window or by double
clicking with the left mouse button on the axis.
These options for scaling the X-axis are available:
Running Time Scale: This option sets the X axis labeling to seconds,
minutes and hours from the start of the measurement. The X-axis will be
updated with every shift of the curves in the display.
9-24
ServiceLab
Chapter 9: Display Module Group
Fixed Time Scale: This option fixes the starting point of the X-axis at 0.
The labeling will not change during recording.
Time of Day: Use this option to label the X-axis with the current system
time in the format of hh:mm:ss. The labeling will be updated with every
shift of the curves in the display.
If the measurement has been paused and continued, it will be ignored for the
labeling of the Time of Day axis.
Display T ime: Choose the display time size of the chart recorder. The parameter can be entered in seconds, minutes, hours or days. The maximum
display time refers to the data block size, sample rate and the available
memory size.
Time Axis: If Start at Left is selected, the curve will be displayed from the
left to the right without shifting until the right boundary is reached. Otherwise the display will start at the right boundary and shift the curve into the
window.
Display Function: Search Event
You can use this tool to check recorded curves for special events. Use the Display -> Search menu command of the Chart Recorder display window to enter
the settings.
Define the event to search by the signal amplitude and the duration of that level
(e.g. search for an event with a level of 5 volts and a maximum duration of 10
seconds).
The unit used for the level depends on the settings of the module that precedes the
chart recorder module.
The settings are made individually for each channel. You can also use the
Search in all Channels setting.
Settings:
Channel: Select one of the active channels to make your settings. Alternatively you can choose All Channels to check all channels for an event.
In that case, the next event is always shown independent of channel number.
Value is..: Define the level (amplitude) for the search. You can select less
than, greater than or equal to a defined value
Tolerance if “equal… +/-: This value defines the maximum valid deviation
of the signal from the reference value to be accepted as a valid event.
(only if equal to is chosen)
Length: The time interval the event has to last as minimum or maximum to
match the condition. You can also use the Any setting to get each event
with the defined level without time restriction.
9-25
ServiceLab
Chart Recorder Module
Pre-/Post Range: This setting limits the displayed values to the defined
area (%) before and after the event.
Search Buttons
Jump to the start of recorded data.
Search for event (direction is to start).
Search for event (direction is to end)..
Jump to the end of recorded data.
Status Area:
The status area shows 4 elements:
Channel: The channel is shown where the event has occurred.
Message/Start Time: The start time of an event is shown here. Also error
messages are shown here, e.g. “not found”.
Green Soft-LED: Bright light green signals an event.
Red Soft-LED: Bright light red signals no event was found. The reason is
shown in the message area.
Possible reasons are:
o
Data buffer full.
o
No data available.
OK Button:
Close the Dialog box. All set parameters are stored until the worksheet is closed
and are used again if the dialog is called up again.
The settings are not stored with the worksheet!!!
Cance l Button:
Close the Dialog box. All settings are lost. A new start of the Event Search tool
will open the default settings.
Minimize Button:
The dialog box is reduced to display just the channel and event information such
as the control buttons.
9-26
ServiceLab
Chapter 9: Display Module Group
To reset the box to the default size use the maximize button.
Survey Functions: Zoom between Cursor
If the Cursor function is active, you can zoom into the curve between the cursor
pair. The zooming area is limited to the actual cursor positions.
4.
Analog Meter Module
Use this module to display a single data point from a block for up
to 16 channels in an analog instrument-like window.
Input and Output Characteristics
Number of Inputs :
Input Block Size :
Number of Outputs:
Output Block Size :
Max. Number of Modules:
16
any
same as number of inputs
same as input block size
any
Module Configuration
Double-click on the worksheet module icon or anywhere on the corresponding
display window to activate the module configuration dialog box.
Global Settings
This setting refers to all activated channels.
The Copy Inputs to Outputs option provides the module with one output for each
activated input channel. Incoming data is provided unchanged at the output.
Channel Settings
The following settings refer to the selected channel.
Unit: Displays the unit at the bottom of the instrument.
Lower/Upper Mark: The color of the scale can be adjusted. If this function
is active, the area from the end to the mark value is displayed in an additional color, making a simple limit control possible.
To modify the scale, click on the Scaling button.
9-27
Analog Meter Module
ServiceLab
The Analog Meter module displays a single value from a data block. The
value to be displayed can be selected from the following:
Function
displayed value (of the current block)
the last value
the minimum value
the maximum value
the mean value
the Root Mean Square value
Activate the Trend parameter to add two arrows to the display of the selected channel. If the displayed value differs from the new value, the
color of the arrow changes. If the value is equal, no color change appears.
Peak Hold: You can add an additional pointer to show the actual Maximum and Minimum value from the start of the experiment. The additional
pointers are reset when the experiment is started.
Use the Speedometer function to display the Analog Meter as a speedometer-type display.
The Pointer Option switches between a simple line pointer or an arrow
styled pointer.
Pointer Size changes the size of all pointers in the display window.
The buttons at the bottom of the dialog box open dialog boxes to configure the
display window.
The format of the numerical values is based on the Country Specific Settings that
can be set using the Windows Control Panel.
Last
Minimum
Maximum
Mean
RMS
Scaling
Use the Channel Bar to select one of the active channels of the module.
(The number of channels can’t be changed here.)
Use Settings to set the display range of this channel. Choose the Auto option to use the default settings. Choose User Defined to change the Scale
and String format.
Use Scale to define the number of labeled and blank ticks to be displayed
on the axis.
String format allows you to choose normal, exponential and engineering
format as the displayed number on the axis.
Options
You can select from the following options to customize the appearance of the
Analog Meter.
If Show Digital Value is activated, the actual numerical value is displayed
at the bottom of the instrument. The number of Digits and Decimals can be
specified.
9-28
ServiceLab
Chapter 9: Display Module Group
If more than one channel is activated, you can change the Number of Columns. The arrangement of the display is determined by this setting.
With Channel Name shows the Channel Name at the top of the instrument.
With Unit shows or hides the selected unit at the bottom of the instrument.
Colors
You can define the colors of the Analog Meter.
Color Change: The scaling area above and below the selected limits is
shown in the chosen color. If a limit is passed during the experiment the
color of the numerical display changes.
Background: Select the color of the background for the numerical value,
the Channel Name and the Unit.
T ext: Select the color of the output of the Channel Name, the Scale and
the Value.
Drawing elements: Select the color of the Pointer and the Trend display.
Peak Hold: Select the color of the maximum and minimum peak hold.
Font
Select the font used to display the Channel Name and the numerical values in the
Analog Meter. You can choose how the font is scaled.
Click on the Font button to choose the font family, style and size.
Choose from:
Single font, fixed to specify the exact font and font size that will be displayed. One font will be used for all elements.
Single font, automatic to allow the program to automatically resize the
font when the display window is resized. One font will be used for all
elements.
Separate Fonts, fixed to specify the exact font and font size that will be
displayed. You can specify different font sizes for each element: name,
value and scaling.
Separate Fonts, automatic to allow the program to automatically resize
the font when the display window is resized. You can specify different
font sizes for each element: name, value and scaling.
Color
You can define the colors of the Analog Meter. Click on one of the elements of
the instrument to open the color selection dialog box.
Color Change: The scaling area above and below the selected limits is
shown in the selected color. If values fall below or exceed the specified
limits during the experiment, the color of the numerical output switches to
the selected color.
9-29
ServiceLab
Digital Meter Module
Background: Select the color of the background of the Numerical Value,
the channel name and the Unit display.
T ext: Select the color of the output of the channel name , the scale and the
value.
Drawing Elements: Select the color of the pointer and the trend display.
Peak Hold: Select the color of the maximum and minimum Peak Hold.
Display Window
Double-click on its icon at the bottom of the screen to open the Display Window.
Click on the right mouse button anywhere in the display window to change color
settings.
5.
Digital Meter Module
Use this module to display a single data point from a block for up
to 16 input signals in an instrument similar to a digital meter.
Input and Output Characteristics
Number of Inputs :
Input Block Size :
Number of Outputs:
Output Block Size :
Max. Number of Modules:
16
any
same as number of inputs
same as input block size
any
Module Configuration
The module configuration dialog box can be opened by double-clicking on the
worksheet module icon or on the display window.
Global Settings
This setting refers to all activated channels.
The Copy Inputs to Outputs option provides the module with one output for each
activated input channel. Incoming data is provided unchanged at the output.
Channel Settings
The following settings affect the selected channel.
Unit: Displays the unit
Lower/Upper Mark: The color of the displayed digits can be adjusted. If
this function is active, values above or below the set values are displayed
in the specified color, making a simple limit control possible.
The Digital Meter module displays a single value from a block of data.
The value to be displayed can be selected from the following:
9-30
ServiceLab
Chapter 9: Display Module Group
Function
displayed value (of the current block)
the last value
the minimum value
the maximum value
the mean value
the Root Mean Square value
Activate the Trend parameter to display an arrow in the selected channel
if the displayed value differs from the new value. If the value is equal, no
arrow is displayed.
The Display option allows you to switch between several kinds of display
usable in for digital data. The value can be displayed as
decimal
hexadecimal
octal
binary or
ASCII
Clock
Decimal is the most frequently used display. In hexadecimal, octal and binary mode, the fractional digits are truncated and the value is shown with
the defined number of digits. In ASCII mode, the ASCII character conforms to the value is shown. If the value is larger than 256, the single digits of the 32 bit number are displayed (one digit represents 8 bits of the 32
bit number; the low Byte is displayed first).
The Clock Options dosen’t display measured values. The time display
format is hh:mm:ss.mmm. Use this option to display time information that
may have been extracted from a data channel or read from a file or device
as a separate data channel.
The buttons at the bottom of the dialog box open dialog boxes to configure the
display window.
The format of the numerical values is based on the Country Specific Settings that
can be set using the Windows Control Panel.
Last
Minimum
Maximum
Mean
RMS
Options
You can select from the following options to customize the appearance of the
Digital Meter.
Numerical Value: The Number of Digits and number of Decimals can be
specified. If the Clock option is selected, the number of digits controls the
fraction of seconds.
3 Digits = milliseconds
2 Digits = centiseconds
1 Digit = tenth seconds
9-31
Digital Meter Module
ServiceLab
Display: If more than one channel is activated, you can change the Number of Columns. The arrangement of the individual instruments is deter-
mined using this setting.
With Channel Name shows the channel name at the top of the instrument.
With Unit shows or hides the selected unit at the bottom of the instrument.
You can choose whether the unit will appear after the numerical value or
at the bottom of each instrument.
Colors
Define the colors of the Digital Meter. Click on one of the elements of the instrument to open the Color Selection dialog box.
Color change: If values fall below or exceed the specified limits during
the experiment, the color of the numerical output switches to the selected
color.
Background: Select the color of the background for the numerical value,
the Channel name and the unit.
T ext: Select the color for the numerical output.
Font
Select the font used to display the Channel name and the numerical values in the
Digital Meter. You can choose how the font is scaled.
Click on the Font button to choose the font family, style and size.
Choose from:
Single font, fixed to specify the exact font and font size that will be displayed. One font will be used for all elements.
Single font, automatic to allow the program to automatically resize the
font when the display window is resized. One font will be used for all
elements.
Separate Fonts, fixed to specify the exact font and font size that will be
displayed. You can specify different font sizes for each element: name,
value and scaling.
Separate Fonts, automatic to allow the program to automatically resize
the font when the display window is resized. You can specify different
font sizes for each element: name, value and scaling.
Display Window
Double-click on its icon to open the Display Window. Click on the right Mouse
button to change color settings.
9-32
ServiceLab
6.
Chapter 9: Display Module Group
Bar Graph Module
Use this module to display a single data point from a block for up
to 16 input signals in bar graph form .
Input and Output Characteristics
Number of Inputs :
Input Block Size :
Number of Outputs:
Output Block Size :
Max. Number of Modules:
up to 16
any
same as number of inputs
same as input block size
any
Module Configuration
Double-click on the worksheet module icon or on the display window to open
the module configuration dialog box.
Global Settings
This setting refers to all activated channels.
The Copy Inputs to Outputs option provides the module with one output for each
activated input channel. Incoming data is provided unchanged at the output.
Channel Settings
The following settings refer to the selected channel.
Unit: Display the unit at the bottom of the instrument.
Lower/Upper Mark: The color of the displayed bar can be adjusted. If this
function is active, the area above or below the marks is displayed in an
additional color, making a simple limit control possible.
Four different bar graph styles can be selected:
Function
Values will be displayed by
Bar:
a vertical bar.
T riangle:
a small triangle pointing at the scale.
T hermometer:
a vertical bar in the shape of a
thermometer.
LED
a bar; divided into segments. Resolution
of display is defined by the number of
segments and scaling of the bar graph.
You can select the number of LED
segments to display and their shape
( rectangle, rectangle with rounded corners,
or as standard round LED).
9-33
Bar Graph Module
ServiceLab
If the horizontal direction option is selected, the Thermometer display mode
will be disabled.
The Bar Graph module displays a single value from a block of data. The
value to be displayed can be selected from the following options:
Function
displayed value of the current block
Last:
the last value
Minimum:
the minimum value
Maximum:
the maximum value
Mean:
the mean value
RMS:
the Root Mean Square value
Activate the Trend parameter to display an arrow in the selected channel
when the displayed value differs from the new value. If the value is equal,
no arrow is displayed.
The buttons at the bottom of the dialog box open dialog boxes to configure the
display window.
The format of the numerical values is based on the Country Specific Settings that
can be set using the Windows Control Panel.
Scaling
Use the Channel Bar to select one of the active channels of the module.
(The number of channels can’t be changed here.)
Use Settings to set the display range of this channel. Choose the Auto option to use the default settings. Choose User Defined to change the Scale
and String format.
Use Scale to define the number of labeled and blank ticks to display on
the axis.
String format allows you to choose normal, exponential and engineering
format as the displayed number on the axis.
Options
You can select the following options to customize the appearance of the Bar
Graph.
Activate the Show Digital Value function to display the numerical value at
the bottom of the instrument. The Number of Digits and number of Decimal
places can be specified.
The format of the numerical values is based on the countryspecific settings as specified in the International dialog box of the Windows Control Panel.
You can specify the scale style of the Bar Graph. You can choose from
one scale Per channel, only one scale in front of the First channel or a
display completely Without Scaling.
9-34
ServiceLab
Chapter 9: Display Module Group
Alignment: You can display the Bar Graph horizontally or vertically (the
default). If horizontal is selected, the bars are displayed horizontally. The
Thermometer display mode will be disabled.
If several instruments are activated in the module you can specify the
number of columns to define the placement of the displays beside or on
top of each other. The number of lines will be computed from this setting
and from the number of activated instruments.
With Channel Name activates/deactivates the display of the Channel name
at the top of each instrument.
With Unit shows or hides the selected unit at the bottom of the instrument.
Colors
You can define the colors of the Bar Graph.
Color change: If values fall below or exceed the specified limits during
the experiment, the colors of the bar and of the numerical output switch to
the selected color.
Background: Select the background color for the bar graph column, the
numerical value and the channel name and for the Bar Graph.
T ext output: Select the colors for the Output of the Channel name, for the
Scale, and for the numerical output.
Drawing elements: Select the colors of the Columns and of the Trend display.
Font
Select the font used to display the Channel Name and the numerical values in the
Analog Meter. You can choose how the font is scaled.
Click on the Font button to choose the font family, style and size.
Choose from:
Single font, fixed to specify the exact font and font size that will be displayed. One font will be used for all elements.
Single font, automatic to allow the program to automatically resize the
font when the display window is resized. One font will be used for all
elements.
Separate Fonts, fixed to specify the exact font and font size that will be
displayed. You can specify different font sizes for each element: name,
value and scaling.
Separate Fonts, automatic to allow the program to automatically resize
the font when the display window is resized. You can specify different
font sizes for each element: name, value and scaling.
9-35
ServiceLab
Status Lamp Module
Display Window
Double-click on its icon to open the Display Window. Click with the right
mouse button anywhere in the display window to change color settings.
7.
Status Lamp Module
Use this module to display the alternating state of an input signal
along with a state-specific alphanumeric string and status light .
Input and Output Characteristics
Number of Inputs :
Input Block Size :
Number of Outputs:
Output Block Size :
Max. Number of Modules:
up to 16
any
same as number of inputs
same as input block size
any
A separate window displays the alternating state of up to 16 input signals along
with a state-specific text string and status light. The limit that causes the state
change is the numerical value 1.5.
Module Configuration
Double-click on the worksheet module icon or on the display window to activate
the module configuration dialog box.
Global Settings
These settings refer to all activated channels.
The Display Mode Option switches between the standard TTL Input Mode
and the Single Bits mode.
7.1. Mode TTL Input
In TTL Input mode each channel gets a Status Lamp (or a selectable Bitmap),
which changes depending on the level of Input signal. The limit which causes the
state change is the numerical value 1,5.
7.2. Single BitMode s
The state of single bits is displayed. The input value is interpreted as a digital
word.
Each channel is displayed as a row of 16 Status Lamps, which are allocated to
the respective bit. A maximum matrix of 16x16 bits may be displayed depending
on the number of channels selected.
Optionally, the bit number can be shown in the center of the lamps. In this case,
you cannot display additional Status text.
9-36
ServiceLab
Chapter 9: Display Module Group
T he Options Button opens the Options Dialog Box to make other global
settings.
Click on the Color button for additional settings:
Background Buttons open the Color Menus to set the color for the
background of the display window, the symbol area and the channel
name pad.
Text Buttons open the Color Menus to set the color of the Default
Status Symbol (Lamp) or/and Status Text for the
Status On/Status Off display. Color of Channel name is also selectable.
With buttons Bit On ... and Bit Off... in Bit Number you define the
color of the bit numbers displayed in the middle of the Bit Lamps
(Only used in Single Bit mode).
Fonts Button opens the Text Dialog Box to set the Font Type and Size of
the text in Status display window.
The Copy Inputs to Outputs option provides the module with one output for each
activated input channel. Incoming data is provided unchanged at the output.
Channel Settings
This setting refers to the selected channel.
For each activated channel, the Status Text shows the state of the digital input
signal by displaying different lights and alphanumeric strings for low and high
states.
Bitmap...
To show the Status as a Symbol you can use the Default Symbol (Lamp:
ON.BMP and OFF.BMP) or any Bitmaps. Activate this option using the
Show Bitmap switch.
Bitmaps...
Display: Stretch Bitmap and Draw bitmap show the Bitmaps adapted
to the window frame based on original size. To change the displayed
Bitmaps when reaching different levels, make the following settings:
Levels: You can define 11 Levels at which to change the displayed
Bitmap. Select the Bitmap file using the File name... button. The selected Bitmap file is linked to the actual Level. The name of the
linked file is displayed in the bottom line. Define the Threshold
level at which the program switches to the next bitmap. This bitmap
is displayed until the next threshold is reached. The range at which
the bitmap is displayed is shown beside the threshold area.
Level 1 has no threshold. The linked Bitmap is shown from -∞ until threshold of level 2. The Bitmap for the last level is shown from the last threshold
until ∞ .
9-37
Status Lamp Module
ServiceLab
Options
All settings in the Options dialog apply to all activated channels of this module.
You can select the following options to customize the appearance of the Status
Lamp display window.
Display: If more than one instrument is activated in the module, you can
change the Number of Columns. The arrangement of the individual instruments within the display window is determined using this setting.
with Channel Name shows or hides the channel name at the top of the instrument.
with Status Text shows or hides the status text beside the status symbol.
Colors
You can define the colors of the Status Lamp .
Background: Select the background color for the text area with the Channel Name.
T ext: Select the color for the Channel name in the text area.
Status On, Status Off: Select the colors of the default symbol (the lamp)
for the On and Off state.
Font
Select the font used to display the channel name and the numerical values in the
Status Lamp. You can choose how the font is scaled.
Click on the Font button to choose the font family, style and size.
Choose from:
Single font, fixed to specify the exact font and font size that will be displayed. One font will be used for all elements.
Single font, automatic to allow the program to automatically resize the
font when the display window is resized. One font will be used for all
elements.
Separate Fonts, fixed to specify the exact font and font size that will be
displayed. You can specify different font sizes for each element: name,
value and scaling.
Separate Fonts, automatic to allow the program to automatically resize
the font when the display window is resized. You can specify different
font sizes for each element: name, value and scaling.
Display Window
The data values from all the module entries will be displayed in a display window tagged with the same module name. Open the display window by doubleclicking its icon at the bottom of the desktop.
For each channel, the display window contains its channel name, an area for displaying the status string, and the light symbol.
9-38
ServiceLab
8.
Chapter 9: Display Module Group
List Display Module
Use the List Display Module to display the values of its input signals in list form .
Input and Output Characteristics
Number of Inputs :
Input Block Size :
Number of Outputs:
Output Block Size :
Max. Number of Modules:
up to 16
any
…
…
any
This module displays numerical data in a table. Data values are updated in
blocks; so only a few values of large data blocks are displayed depending on the
window size and the selected module data buffer. If a small block size is selected (e.g., 1 or 2), the old list scrolls up and the new values will be added in
the list. This module can store 9999 data values/channel.
Module Configuration
Global Settings
These settings refer to all activated channels.
The Copy Inputs to Outputs option provides the module with one output
for each activated input channel. Incoming data is provided unchanged at
the output.
Digits: This display defines the number of characters to be displayed for
each data channel. In addition to Font and Font Size, you can set the width
of the display window. The text can have a length of 5 up to 20 characters.
Decimals: Specify the number of decimal places (0 to 5) to be shown for
normal measurement values.
Channel Settings
This setting refers to the selected channel. Click Display Channel to show or
hide the selected channel.
Options
You can select the following options to customize the appearance of the List display window.
With Time Channel: Select this switch to display a Time Channel in addition to the list of numerical values in the display window. The time values
to be displayed are specified with T ime Channel Type.
9-39
List Display Module
ServiceLab
If the data to be displayed in the List Display module is frequency data (from
an FFT module), the Time Channel column is replaced with a Frequency column and displays the actual frequency value, not the time.
With Unit shows or hides the selected unit below the Channel Name
Data Samples per Channel specifies the length of the list If this value ex-
ceeds the maximum number of values to be displayed, a scroll bar will be
shown at the left side of the list box. Use this scroll bar to select the section of the list to be displayed. The maximum memory depth per channel
is 9,999.
String Format: Specify if the measurement value is to be displayed in the
Normal Format, the Exponential or the Engineering Format. The Engineering Format is similar to the Exponential representation but displays an exponent of 3 or a multiple.
Display Window
The data from all the module entries will be displayed in the display window
(the List Display window) attached to each module and tagged with the same
module name. Open the display window by double-clicking its icon at the bottom
of the desktop.
Some of these parameters may also be modified in the display window
menu system.
The display window associated with the List Display module can display the data
of up to 16 channels in one list.
The display style and interactive commands can be chosen from the menu or the
Function Bar.
Edit Functions
List to Clipboard
Use this command to copy the contents of the window onto the Windows clipboard. The list that is copied will include scaling information, but not the background.
You can paste the diagram into other Windows applications or documents, including Paintbrush or Word for Windows, by choosing the appropriate command from the target application menu (usually Paste from
the Edit menu).
Print
Use this command to print the contents of the current window on the
default Windows printer. With a black and white printer, all printing
will be black on a white background.
9-40
ServiceLab
Chapter 9: Display Module Group
Choose Page Format from the File menu to select additional information to
include on the printout, and to specify the page layout and page frames.
Choose Printer Setup from the File menu to select paper size and paper
source, orientation, printer resolution, and other settings for your active
printer model.
To activate a different printer model connected to your system, or to install
and configure a new printer, choose the Printers option in the Windows Control Panel. Refer to your Windows documentation for further information.
Display Functions
Time Channel
A time channel for a data list can be defined in this submenu.
The time can be listed in three different modes:
Function
Displayed Time Value
Time of Day
the current time when the sample was acquired
Measurement Time the time since the start of the measurement
Sample Number
a continuous numbering of all the lines in the list
The time format is based on the Country Specific Settings which can be set using
the Windows Control Panel.
If the data to be displayed in the List Display module is frequency data (from
an FFT module), the Time Channel column is replaced with a Frequency column and displays the actual frequency value, not the time.
Freeze
Use this command to freeze the current display window. The measurement is continued, but the display will not be updated until Freeze
is turned off. The Continue function unfreezes the display window.
Continue
Use this command to continue the display of a frozen display window. The display will be updated with current data.
Function Bar
The Function Bar contains icons which provide easy access to several functions
and options from the display window menus. Just click the icon representing that
function. All the commands represented on the Function Bar are also available
from the menus.
9-41
List Display Module
ServiceLab
Display Y Unit
If this flag is set, the unit is displayed underneath the channel name.
Font Style…
You can select the font, font style (plain, bold, italics and underlined)
and the font size. These settings apply to the displayed characters and
the title.
Text Color… /Background Color…
This command opens the color selection dialog box. The List module
allows you to change the color of the displayed text and lines and the
color of the background.
Show Unit
If this flag is set, the unit of each channel will be displayed in the list beneath the
channel name.
9-42
ServiceLab
Chapter 10: Files Module Group
Chapter 10: Files Module Group
Read Data
optional
Module
Basic
version
This group consists of modules for reading and writing data.
x
Write Data
x
Backup Data
x
ODBC Input
x
ODBC Output
x
10-1
ServiceLab
Read Data Module
1.
Read Data Module
Use this module to read data from disk files of different formats.
Input and Output Characteristics
Number of Inputs :
Input Block Size :
Number of Outputs:
Output Block Size :
Max. Number of Modules:
none
none
up to 16 (as defined in the file)
any (as defined in the file)
any
The Read Data module can read data files in limited number of formats:
DASYTEC format (extention .DDF)
IEEE32-bit float values (extention .I32)
Delimited ASCII characters (extention .ASC)
Flex4 format (extention .RES or .INT)
The Name button opens the Windows file selection dialog box, where the file to
be opened can be selected. For more details, see the Open … command from the
File menu.
When a file has been selected, ServiceLab checks the file and displays the
File Description. If it is a DASYTEC file, this description will provide information concerning the date and time of the recording, the number of recorded channels, the sampling rate, etc.
If more than 16 channels have been recorded in the selected file, the Display
group box displays which group (of 16 channels each) is currently selected for
reading.
You can use global strings to build the file name. You can use more than one
string (e.g. ${STRING_001}${STRING_002}), allowing you to read file
names built from more than one part.
If data is read in the DASYTEC format, the following parameters are set in the
Read Data box:
Use Global Sampling Rate: If this option is selected (and the
Real Time Output option is active), data will be read according to the
global sampling rate. The sampling rate recorded in the file does not affect the reading.
Real Time Output: If this option is selected, data will be read at the same
speed at which it was stored.
10-2
ServiceLab
Chapter 10: Files Module Group
If neither of the above items is chosen, data will be read as fast as
possible.
Original Date/Time: If this option is selected, data values will be pro-
vided with their recording time and date. This is especially useful in
combination with the Chart Recorder and the List Display modules. If you
have more than one file selected, the Date/Time from the first file will be
used for all the files.
Data stored in the IEEE 32 Bit format will be read without any accompanying time or sampling rate information. In that case the current worksheet
settings will be used.
Stop at End of File: If this option is activated, the file will be read only
once . The module symbol will then display EOF (End of File), and the
experiment will automatically be stopped. If the number of samples in the
file is not a multiple of the block size, data samples are skipped at the end
of the file. If the file does contain less than one block of data, no samples
are read. To repeat the reading process, start the experiment again.
If this option is inactive , the file will be read from the beginning again as
soon as its end is reached. To stop the reading process, stop the experiment.
Action driven Block Output: Depending on an Event Driven Action, the
read data is sent to the output block by block. This option is especially
useful in files that are written with a block length of 1; in this case you
can view each single sample of the file.
Select Show Status Window to choose if a Status Window should be displayed. The window shows the actual file name from which data values
are read. During the experiment the name of the actual File and the number of bytes (in %) read from file are displayed.
The Data Format parameter shows whether data samples were stored in standard
format ( Universal1) or in disk streaming format ( Universal0). If an ASCII or
IEEE 32 Bit file is selected, the Data Format parameter changes to Number of Channels. Enter the number of channels that are saved in the file.
If the data to be read is DASYTEC format with more than 16 channels,
the Data Channels item in the File Header as Text window shows the following entry: DATA CHANNELS=MUX: x1/x2/x3/x4 ... where
the values of x1 ...x16 give the number of channels in the several channel
groups. You have to select a channel group to read the data of the channels stored in that group.
If data in the IEEE 32 Bit format is read, the number of channels has to be
the correct number of channels that the file has stored. If the number of
saved channels is less or more, data of different channels will be mixed.
If ASCII data is read, an incorrect number of channels will not cause
mixed data channels. Larger channel numbers will be ignored and missing
channels filled up with the value 0,0.
10-3
ServiceLab
Read Data Module
All lines in the ASCII files that start with a non-digit are interpreted as a
header until at least one valid line of data is found. In all following lines,
non-digits will be skipped.
ASCII Format: If the file is an ASCII file you can select ASCII Format Options to define if a time channel exists and how it is to be treated.
Options: Use Options to select a segment of the file to be read. This function is only available for DASYTEC file types.
Multi-File: ServiceLab provides the option to read data from a series of
several separate files. All these files share the same name root (between
4 and 7 characters) followed by consecutive numbers automatically assigned by the program.
Click the Multi-File button to open a dialog box where these and other parameters of this option can be specified. Activate the Read as Multi-File
option first to enable any other inputs.
Note: you can only read DASYTEC format files as a Multi- File .
Read File Section
Use this option of the Read Data module to determine if the complete file or just
a section of it should be read. The option applies to all data formats that can be
read by ServiceLab.
With the Read Section function activated, only a section of a file is read. The
section is defined by an input in a separate window.
Define the physical unit that is used to identify the section of the file. You
can select:
Milliseconds
Seconds
Minutes
Hours
Days
Date/Time
If the file is selected, the Start Time is displayed beneath the unit selection field.
Enter the actual range In the fields From: and To:. To enter the time, use
the format HH:MM:SS,uuu where HH = hours, MM = minutes, SS =
seconds, and uuu = fractions of a second.
If the DASYTEC file format is selected, you can use the Copy option to
choose that additional information should be read from the file (Author,
Company, Department and/or Title).
Action at End of File
The Action at End of File option is to effect an asynchronous Action that is checking the status of a global variable. You can choose between setting and incrementing a global variable. Additionally, you can select whether the global vari-
10-4
ServiceLab
Chapter 10: Files Module Group
able is changed at the end of each file of a multi-file series or only at the end of
the last file of a series.
Activate the Set Strings option to write several global strings with Information about the read file:
File name
Global String - writes the name of the file into the defined
string.
Date
Global String writes the original Start date of the file into the
defined string.
Time
Global String writes the original Start time of the file into the
defined string.
You must define the number of the string (1 ... 10 00 ).
1.1. Read Options
1.1.1
ASCII Format
ASCII Time Channel
If ASCII data values are to be read, the following options are selectable:
ASCII: Specify whether a time channel exists and if it contains time or date
and time data. If not selected, time values are not evaluated, the time
channel is skipped and the global time settings are used.
T ime Channel Parameter: If the time channel is not skipped, select Evaluate Time Information to specify the time format. The date format can also
be specified.
T ime Channel Mode
Continuous Time Data: When starting the measurement, some of the
data channels are tested for time information. If the data does not
have the same sampling distance (i.e., there are gaps), the experiment is stopped and an error message displayed.
Evaluate Each Time Data: This setting forces time data to be evaluated during the acquisition. The output data values are marked as
triggered data with a block size of 1. This setting makes sense for
files with a time channel that contains date and time information. If
you select Original Date/T ime, data values will be provided with
their recorded time and date. This is especially useful in combination with the Chart Recorder and the List Display modules.
1.1.2
FLEX4 Format Read Options
If the file is an FLEX4 file you can select FLEX4 Format Options to define the
output parameters.
A File Read module can only handle up to 16 channels (=sensors). The Flex4
format is no exception to this. To read more than the first 16 sensors of a file,
10-5
Read Data Module
ServiceLab
multiple File Read modules must be created, and given the same file name to
read. Each File Read module determines the sensors to read by setting the Channel Offset entry found at the bottom of the dialog box. Note that this offset starts
with 0, so to read the first 16 sensors, set the offset to 0, for the second 16 sensors, set it to 16, and so on. You can, however, set the offset to any number you
like; it does not need to be a multiple of 16.
The number of sensors to be read can be entered in the No. of Channels field.
Please note that a single File Read module can only read consecutive sensors.
Header
Save the Description string of the Flex4 file header to a ServiceLab global
string. The string can then be used in many ways, including displaying in a layout
or writing it to another file.
Output Parameter
Change the Block Size of the File Read module . By default, the ServiceLab
global block size (defined in the Experiment Setup) is used for reading the data
from the file. Since the information in the Flex4 files is not blocked, this might
lead to trouble if the last few samples do not complete a block, they will be ignored. This cannot happen, of course, when a block size of 1 is selected. It
should be checked carefully, however, that the block update rate does not get too
high to avoid to big system load. In general, there should not be more than 10 or
20 blocks per second, but the actual rate can only be determined by experiment.
If the file size is known (e.g. 10 minutes of data at 25 Hz), a block size should be
selected that allows the complete file to be read at a moderate block rate (600
blocks of size 25 at a rate of 1 sec. In our example would fit).
Change the Sample Rate. It is possible to enter a new sample rate for the data.
Note that this does not mean that the data is resampled, the data from the file are
simply output at a different rate. In general, this should not be necessary.
1.2. Multiple Files
Multi-File Setup
ServiceLab provides the option to read data from a series of several separate
files. All these files share the same name root (of between 4 and 7 characters);
the remaining characters in the file name (up to 4) are replaced by numbers that
will increase by one from file to file. A new file will be read as soon as the
specified conditions are fulfilled. Activate the Read as Multi-File option first to
enable the other inputs. If this option is not selected, the other options in the box
are grayed out and cannot be modified.
File Name Numbering
Specify the number of file name characters that will be reserved for counting the
files. Since a file name can only consist of up to 8 characters, this number is limited to 4.
10-6
ServiceLab
Chapter 10: Files Module Group
File Chain
Specify whether files of Only One Series or Different Series are read.
The Original Time switch is only available if Different Series is chosen. When it
is activated, the newly read data samples are linked to the older data separated
by a space. If the option isn’t chosen, new data samples will be linked directly to
the old data; all original time information is lost.
File Numbers
Last File No.: This entry determines the last number to be assigned in the
file list. The value allowed here depends on the number of digits specified for File Name Numbering. It will be 9, 99, 999 or 9,999 respectively.
Stop after Last File: If this switch is set, acquisition will stop completely
after the file with the Last File Number was read or if no valid file name
has been found to continue Multi-File reading.
Restart after Last File: This switch can be used to run measurements in a
cyclical fashion. If it is activated and the last possible file was read, the
list will start again with activated file name. If the switch Restart No. is
activated the current restart number is used as first file number. The value
allowed here depends on the number of digits specified for
File Name Numbering. It will be 9, 99, 999 or 9,999 respectively.
Select the Pause at end of each file option to automatically stop the reading of the files as soon as the end of file of a file of that Multi-File series
is reached.
2.
Write Data Module
Use the Write Data Module to store data on disk in files of different formats.
Input and Output Characteristics
Number of Inputs :
Input Block Size :
Number of Outputs:
Output Block Size :
Max. Number of Modules:
up to 16
any
same as inputs (if option is activated)
none
any
When the module configuration dialog box is closed, an error message will be
display if there is not at least 64 KB of free space on the target disk. ServiceLab automatically checks to ensure there is at least 64 KB free space on the
target disk. If that is not the case, an error message will be displayed.
If there is not enough space on the disk to write all the data during measurement,
the experiment will be stopped, and a message will notify you.
10-7
ServiceLab
Write Data Module
File Format
Data can be stored in one of the supported file formats. Different settings may be
necessary, depending on the selected format. Settings not relevant for the selected file format are dimmed. The default file name in the File Name box automatically has the standard extension of that file format.
The following file formats are currently supported:
DASYTEC
Signalys
IEEE 32 Bit
DAP-Vector
Famos
DIA / DAGO
Remus
DADiSP
FLEX4
ASCII
For detailed information about these formats, please refer to the list beginning
at page 10-11, or to Chapter 5 of the User Guide.
ServiceLab can only read data if it was stored in DASYTEC format, ASCII
format or in the IEEE 32 format.
Options
The following functions and parameters can also be selected in the dialog box:
Block/Header Separate: With this option (only with DASYTEC Format)
you can choose whether the header is stored in the same file as the data or
in another file with the same name but a different extension. When data is
stored in different files, the extension of the header file is .DDF. The extension of the file with the data blocks is .DDB .
ServiceLab can only re-read this type of data if both files are present in the
same directory.
The Append to existing File option allows you to append data values to an
existing file without overwriting old data (DASYTEC and IEEE 32 file
format only).
Write Protection: To prevent ServiceLab from overwriting an existing file
name, select the Write Protection option. If the file already exists when the
experiment is started, an error message will be displayed. Click the
Name button to enter a new file name, or disable Write Protection.
The Save data every XXX blocks switch increases data security. After
XXX blocks are processed, all files are closed and reopened again. This
results in more valid data if the system crashes than without this switch.
Not utilizing this switch may result in loss of data. This option is not
available in all data formats. Some formats always store the data on each
block
10-8
ServiceLab
Chapter 10: Files Module Group
File Name --> Global String: Use this switch to specify that the defined
data file name is written into a global string. The String No: Entry field
defines the string Number. You can choose between Name only or Incl.
Path for the contents of the string.
The Comments button opens a dialog box with an edit area, in which you
can insert any comments with a maximum length of 511 characters. Global
strings or variables are also allowed. The content of the area, including
the contents of the variables and strings, is written into the file header
when the file is stored. To enable this option you must activate the Write
Comments radio button.
If space on backup medium is low, the measurement doesn’t stop, but a message
is displayed. The incoming data are skipped.
File Name
The File box displays the name of the file to be written. To enter or modify it,
click the File Name button. The file selection dialog box appears, where the
name, the directory and the drive for the file to be saved can be entered. For
more details, see the Save command from the File menu. The default file name is
DEFWRITE.* . The extension will be inserted depending on the selected file
format.
If the ...with global string radio button is activated, the file name is built from the
inserted global strings. In this case the File Name button is disabled. In the input
line you also are allowed to use more than one string (e.g.
${STRING_001}${STRING_002}), allowing you to build file names from
more than one part.
The default directory for the files can be defined in the Options menu.
Copy Inputs to Outputs
The option provides the module with one output for each activated entry. Incoming data is provided unchanged at the output.
Multi-File
ServiceLab provides the option to write data to a series of separate files. Click
the Multi-File button to open a dialog box where these and other parameters of
this option can be specified.
In the Action module or in a Key action, you can select the Write Data module as
receiver. When the Next file action is selected, the next file of the Multi-file sequence is opened to store samples. If Backup is chosen, all existing Multi files
are stored to disk in the specified path.
10-9
Write Data Module
ServiceLab
2.1. Multi-File
ServiceLab provides the option to write data to a series of separate files. All
these files share the same name root of between 4 and 7 characters; the remaining
characters in the file name (up to 4) are replaced by numbers which increase by
one from file to file. A new file will be created as soon as the specified conditions are fulfilled.
Click the Multi-File button to specify the parameters for this option. Activate the
Write as Multi-File option to define the settings.
File Names and Start Conditions
File Name Numbering: Specify the number of file name characters that
will be reserved for counting the files of the series. Since a file name can
consist of up to 8 characters, this number is limited to 4.
DOS based file systems allows only a maximum of 2000 files per folder, even
though you are able to entry in this field values up to 10000. If you using such
file systems (Win3.11; Windows 95) don’t set that value greater than 2000,
because operating system will prompt an error message.
First File No.: This entry determines the first number to be assigned in the
file series. The value allowed depends on the number of digits specified
for File Name Numbering. It will be 0, 00, 000 or 0000 respectively.
Chain File Name Series: If this switch is set, the program will search the
specified directory for the file with the highest number from the file name
list. The First File No . of the new series will be the next number.
If this switch is not set, the selected file number will be the first at any
experiment start. Existing files will be overwritten.
The module checks the contents of the chosen directory at load time. A
new file is generated right after the highest numbered file with the same
file name. Older files will not be overwritten.
Use the Action module or a Key action to select the Write Data module as
receiver. While the Next file action is selected, the next file of the Multi-File
sequence is opened to store samples. If Backup is chosen, all existing MultiFiles are stored to disk in the specified path
File Switching Conditions
The following settings determine when and how a new file is started:
File Switch Condition: This value determines the number of data
blocks that are to be written into each file, and the channel number
for which this condition has to be fulfilled. A channel number of
− 1 means that the specified number of blocks has to be stored for
all the channels.
Pause before File Switch: If this switch is set, acquisition will
pause each time a new file needs to be opened. A dialog box ap10-10
ServiceLab
Chapter 10: Files Module Group
pears, you can: save the last file as it was written; or have it
overwritten; or stop the measurement. If you click Stop Experiment, acquisition will be stopped completely. This is a useful option for series of experiments where you want to confirm each run.
If you click Overwrite or Count up, you must explicitly resume the experiment (for example, by clicking the Function Bar icon).
End Conditions
The following settings determine the end of the Multi Write Data procedure:
Last File No.: This entry determines the last number to be assigned
in the file series. The value allowed depends on the number of
digits specified for File Name Numbering. It will be 9, 99, 999 or
9999 respectively.
Stop after Last File: If this switch is set, acquisition will stop
completely after the file with the Last File Number is written.
Restart after Last File: Use this switch to run measurements in a
cyclical fashion. When the last file is written, the series will start
again with file number 0. The value allowed depends on the number of digits specified for File Name Numbering. It will be 9, 99,
999 or 9999, respectively.
2.2. File Formats
ASCII
Multiple-channel data can be saved to an ASCII file. The signal values from the
channels will fill the columns of a data matrix, where values coming in simultaneously are stored in one line. Each line ends with a CR/LF (CHR13/CHR10)
character. All the channel names appear in the heading of the file.
To modify the default ASCII format:
Delimiter: Select a TAB or a semicolon as the delimiter between the channels in each line.
Decimal Character: Select a dot (period) or a comma as the decimal character.
Header: Store additional information in the file header: the worksheet file
name, the current time and date, the block size, the sampling rate and the
number of channels.
Global Strings/Variables: This option is only available if the Header option is activated in Extra Info . To always write Strings/Variables into the
Header select the Set Global Strings /. Variables option in the Option
menu (Global Strings/Variables).
You also can select specific Strings or Variables to be written into the
header of the file. To select one or more, choose one of the defined
10-11
ServiceLab
Write Data Module
strings/variables by using their number. If the selected number is already
marked to be always written into the file header, the radio button is disabled and marked with a checkmark.
Write Readable: global strings and variables are written into the header
in the following form:
...
${STR_X}=Alphanumerical String (X=1...200)
...
${VAR_X}=String (X=1...200)
...
This format can be re-read as ASCII format.
Write As Info: In this mode, global strings and variables are written into
the header simply marked as info by a leading “>“ in the following form:
...
>Name:Alphanumerical String
...
>Name:String
...
The name is the text written into the edit field description at the variable/string definition
T ime Column: Store an additional column with time information for each
sample. The following formats are implemented:
Example
Elaps ed Time
[hh:mm:s s]
Elapsed time since start of experiment
00:45:34.20
Date Elaps ed
Time
[hh:mm:s s]
Actual date and elapsed time
since start of experiment
1.1.1995; 00:45:34.20
Elaps ed Time
[sec]
Elapsed time in seconds
345.6
Date Elaps ed
Time
[sec]
Actual date and elapsed time in
seconds
1.1.1995;345.6
Time
[hh:mm:s s]
Actual time
07:30:30.4
Date Time
[hh:mm:s s]
Actual date and time
1.1.1995;07:30:30.4
Decimal Separator You can choose between the general Windows separa-
tor, dot or comma or disable the separator completely.
10-12
ServiceLab
Chapter 10: Files Module Group
Decimals: Specify the number of decimals for the numerical ASCII format
for each channel
T ype of Input Data: specify whether the input channels contain multiplexed (see Merge/Expand, page 11-9) data.
Single Samples: the data is not multiplexed and the input channel
contains samples from single channel. Samples are stored using the
input channel order, with each channel saved in each line of data
(row major order).
S1C1, S1C2, S1C3, ... S1Cn
S2C1, S2C2, S2C3, ... S2Cn
...
SmC1, SmC2, SmC3, ... SmCn
n = number of channels, m = final sample
Mixed Samples: the data is multiplexed using Sample mode. You
can specify the number of channels that are multiplexed in each input channel. Samples are stored in the following way:
P 1: S1C1, S2C1, S3C1 ... SnC1
P 2: S2C1, S2C2, S2C3 ... S2Cn
...
P i: S2C1, S2C2, S2C3 ... S2Cn
...
P 1: SmC1, SmC2, SmC3 ... SmCn
P 2: SmC1, SmC2, SmC3 ... SmCn
...
P i: SmC1, SmC2, SmC3 ... SmCn
P = position in Data block, S = sample, C = channel, i = Block Size,
n = number of channels, m = final sample
Mixed Blocks : the data is multiplexed using Block mode. Samples
are stored in the following way:
P 1: S1C1, S2C1, S3C1 ... SnC1
P 1: S2C1, S2C2, S2C3 ... S2Cn
...
P 1: SmC1, SmC2, SmC3 ... SmCn
P 2: S1C1, S2C1, S3C1 ... SnC1
P 2: S2C1, S2C2, S2C3 ... S2Cn
...
P 2: SmC1, SmC2, SmC3 ... SmCn
...
P i: S1C1, S2C1, S3C1 ... SnC1
P i: S2C1, S2C2, S2C3 ... S2Cn
...
P i: SmC1, SmC2, SmC3 ... SmCn
P= position in data block, S = sample, C = channel, i = block size,
n= number of channels, m = final sample
10-13
Write Data Module
ServiceLab
Use Number of Channels to select the input channel using the +and - buttons. Then you must define the number of channels, multiplexed to the input channel of the Write Data module. This number has to be the same as
the inputs of the merge module, which are bundled into the output channel.
The data at the different input channels of the write data module has to be
merged in the same way, as blocks or as samples.
ASCII format may only be used for data from channels of equal types and
sampling rates. Mixed data (mixed Trigger and Histogram data) must be
stored in the DASYTEC or Signalys formats.
FLEX4 Format
Header: The header is stored in the same file as the data itself. You can
also use global strings or variables , as descriptions to be stored in the
header of the file.
Options
Generate automatic file name from date.
If this option is active, the file name will not be taken from the file selection mechanism, but generated from the time of the first data sample in the
file according to the document RDTQA-011a. Note that only the pure file
name is exchanged, the drive, path, and extension information is taken
from the file selected. To check which file name has been generated, use
the File Name -> Global String option in the File Write dialog box. The
file name generated will then be written to a global string which can e.g.
be displayed in a layout.
The files are named according to the time of the measurements:
ymddhhmm.int
with y as the year (0 = 2000, 1 = 2001 etc.),
m is the month (1 – 9 = January – September, a = October, b = November,
c = December),
dd is the day (01 – 31),
hh is the hour (00 – 23) and
mm is the minute (00 – 59) at the start of the data set.
Generate INT file on close.
If selected, upon closing the *.res file written by the module will be rewound and post processed into a *.int file. The minimum and maximum
information for each channel will be collected during the writing process
of the *.res file. The file name used will be the same as for the *.res file,
but with an extension .INT. If the previous option is active, also the automatically generated file name will be used.
10-14
ServiceLab
Chapter 10: Files Module Group
Note that the post processing process will take some time during which ServiceLab is blocked. This should not cause problems if the close operation is
initiated by stopping the experiment, but in the case of writing Flex4 multi
files this lock may occur during the experiment when a multi file switch occurs.
Delete RES file after generation.
This option deletes the *.res file after performing the post processing operation described before to save disk space. The option is available only
if the previous option is active.
Type of Input Data
Single Samples: Samples will be stored in sequence of the channels.
S1K 1, S1K2 S1K3 ... S1K n
S2K 1, S2K2 S2K3 ... S2K n
...
SmK1, SmK2 SmK3 ... SmKn
n=number of channels, m=final sample
Mixed Samples: Data storage depends on the block length. Data is stored
in the following way:
P 1:
P 2:
...
Pi
P1
P 2:
...
Pi
S1K1, S2K 1, S3K1 ... SnK1
S2K1, S2K 2, S2K3 ... S2Kn
S2K1, S2K 2, S2K3 ... S2Kn
...
SmK1, SmK2, SmK3 ... SmKn
SmK1, SmK2, SmK3 ... SmKn
...
SmK1, SmK2, SmK3 ... SmKn
P=Position in Data block, S=Sample, K=channel, i=Block Size,
n=Number of channels, m=final Sample
Mixed Blocks: Data storage depends on the block length. Data is stored in
the following way:
P 1:
P 1:
P 1:
P 2:
P 2:
P 2:
...
P i:
P i:
S1K1, S2K 1, S3K1 ... SnK1
S2K1, S2K 2, S2K3 ... S2Kn
...
SmK1, SmK2, SmK3 ... SmKn
S1K1, S2K 1, S3K1 ... SnK1
S2K1, S2K 2, S2K3 ... S2Kn
...
SmK1, SmK2, SmK3 ... SmKn
S1K1, S2K 1, S3K1 ... SnK1
S2K1, S2K 2, S2K3 ... S2Kn
...
10-15
ServiceLab
Write Data Module
P i:
SmK1, SmK2, SmK3 ... SmKn
P=Position in Data block, S=Sample, K=channel, i=Block Size,
n=Number of channels, m=final Sample
Channel Multiplexing Options.
If the Type of Input Data is specified as Mixed Samples or Mixed Blocks
mode, you can save up to 256 channels in each FLEX4-Format file. For
more than 16 channels you must use a Merge module to multiplex multiple
channels into one channel.
Select the Input Channel using the +and - buttons. Then you must define the
number of channels that are multiplexed to the input channel of the Write Data
module. This number has to be the same as the inputs of the Merge Module,
which are bundled into the output channel. This information cannot be retrieved
by ServiceLab automatically. If the information entered here contains a mistake,
run time errors or writing of invalid data might occur. The data at the different
input channels of the write data module must all be merged in the same way, as
blocks or as samples.
IEEE 32 Bit
In this format, data is stored as sequences of 4 byte floating-point values without
any additional information. This format can only be used for data from one channel, as no channel information is stored. When ServiceLab reads these data values, the user has to define the number of channels.
The Append to Existing File option allows you to append data values to an existing file without overwriting old data. Please note the restriction that the appended data values must have the identical data types, block length, number of
channels, etc.
This format is useful for data exchanges with various analysis programs, since
most of these programs can read IEEE 32 bit files. The user must provide the required type and signal information manually.
IEEE 32 bit format may only be used for data from channels of equal types
and sampling rates. Mixed data (mixed Trigger and His togram data) must be
stored in the DASYTEC or Signalys formats.
10-16
ServiceLab
Chapter 10: Files Module Group
Famos
This is the format of the Windows data analysis application Famos.
Famos format may only be used for data from channels of equal types and
sampling rates. Mixed data types and rates must be stored in the DASYTEC
or Signalys formats.
Remus
This is the format of the Windows data analysis application Remus.
Remus format may only be used for data from channels of equal types and
sampling rates. Mixed data types and rates must be stored in the DASYTEC
or Signalys formats.
Signalys
This is the format of the Signalys signal analysis program. This format allows
mixed type storage and different sampling rates for different channels.
DIA/DAGO
This is the format of the DIA/DAGO signal analysis program.
DIA/ DAGO format may only be used for data from channels of equal types
and sampling rates. Mixed data types and rates must be stored in the
DASYTEC or Signalys formats.
DADiSP
If this data format is selected the data will be stored in the format of the data acquisition and analysis program DADiSP .
Only floating point numbers are saved. The file contains a header and the data. If
the data is saved with time information, this time information is stored in seconds. If FFT data is stored, Hz is automatically selected.
DADiSP format may only be used for data from channels of equal types and
sampling rates. Mixed data (mixed Trigger and Histogram data) must be
stored in the DASYTEC or Signalys formats.
DAP-Vector Format
If this data format is selected the data will be stored in the format in DAP-Vector
Format.
The data are stored as shown in the following example:
vector test = ( 0, 3000, 6000, 9000, 12000, 15000 )
The Options button opens the dialogue box to select the vector name (in example
”test”) and the type of data. You can choose between Integer and Long format.
DASYTEC
This format has been designed specifically for ServiceLab. It allows mixed type
storage and different sampling rates for different channels.
10-17
Write Data Module
ServiceLab
The header can either be stored in the same file as the data itself or in another
file with a different extension. Global strings or variables that are defined in the
program can also be stored in the header of the DDF file. To store a variable or
string you must activate the Write to ServiceLab header option in the Options/Define Global Strings (Variables) settings.... menu. Stored variables and
strings can be read with the Read Data module. When this option is activated,
older strings or variables are overwritten.
The option Append to existing File allows you to append data values to an existing file without overwriting old data. Please note the restriction that the appended data values must have the identical sampling rates, data types, block
length, number of channels, etc. If the header differs, the experiment is stopped
and an error message is displayed. At experiment start the data types of all channels are marked as triggered data. Thus it is possible to read and display the values in a Chart Recorder as they were stored.
2.2.1
Options Button
Global Strings/Variables
You also can select special Strings or Variables to be written into the header of
the data file. To select them choose one of the defined strings/variables by using
their number. If the selected number is already marked to be generally written
into the file header, the radio button is disabled and marked with a check.
T ype of Input Data: specify whether the input channels contain multiplexed (see Merge/Expand, page 11-9) data.
Single Samples: the data is not multiplexed and the input channel
contains samples from single channel. Samples are stored using the
input channel order, with each channel saved in each line of data
(row major order).
S1C1, S1C2, S1C3, ... S1Cn
S2C1, S2C2, S2C3, ... S2Cn
...
SmC1, SmC2, SmC3, ... SmCn
n = number of channels, m = final sample
Mixed Samples: the data is multiplexed using Sample mode. You
can specify the number of channels that are multiplexed in each input channel. Samples are stored in the following way:
P 1: S1C1, S2C1, S3C1 ... SnC1
P 2: S2C1, S2C2, S2C3 ... S2Cn
...
P i: S2C1, S2C2, S2C3 ... S2Cn
...
P 1: SmC1, SmC2, SmC3 ... SmCn
P 2: SmC1, SmC2, SmC3 ... SmCn
...
10-18
ServiceLab
Chapter 10: Files Module Group
P i: SmC1, SmC2, SmC3 ... SmCn
P = position in Data block, S = sample, C = channel, i = Block Size,
n = number of channels, m = final sample
Mixed Blocks : the data is multiplexed using Block mode. Samples
are stored in the following way:
P 1: S1C1, S2C1, S3C1 ... SnC1
P 1: S2C1, S2C2, S2C3 ... S2Cn
...
P 1: SmC1, SmC2, SmC3 ... SmCn
P 2: S1C1, S2C1, S3C1 ... SnC1
P 2: S2C1, S2C2, S2C3 ... S2Cn
...
P 2: SmC1, SmC2, SmC3 ... SmCn
...
P i: S1C1, S2C1, S3C1 ... SnC1
P i: S2C1, S2C2, S2C3 ... S2Cn
...
P i: SmC1, SmC2, SmC3 ... SmCn
P= position in data block, S = sample, C = channel, i = block size,
n= number of channels, m = final sample
If the Type of Input Data is specified as Mixed Samples or Mixed Blocks
mode, you can save up to 256 channels in each file. For more than 16
channels you must use a Merge module to multiplex multiple channels into
one channel.
Use Number of Channels to select the input channel using the +and - buttons. Then you must define the number of channels, multiplexed to the input channel of the Write Data module. This number has to be the same as
the inputs of the merge module, which are bundled into the output channel.
The data at the different input channels of the write data module has to be
merged in the same way, as blocks or as samples.
This format allows mixed type storage and different sampling rates for different
channels.
Refer to Chapter 5 of the User Guide for additional information about this format.
10-19
ServiceLab
Backup Data Module
3.
Backup Data Module
Use this module to copy data stored with the Write Data module to
diskettes or another hard disk if the storage capacity of the source
drive drops below a specified amount.
Input and Output Characteristics
Number of Inputs:
Input Block Size:
Number of Outputs:
Output Block Size:
Max. Number of Modules:
----1 alarm output
same as global block size
1
When the module is selected from the Module Bar or the Module menu, this
module is displayed in the worksheet as well as an Icon at the bottom of the display screen.
The module represents the function in the worksheet and the icon represents the
display window containing status information to the current state of the archiving.
This window also contains the switch to start the archive procedure.
Module Configuration
Double click the left mouse button on the module to open the dialog box.
Source drive: select the drive to be monitored. Additionally, the monitoring interval can be specified as numerical value with units in Seconds,
Minutes or Hours . The shortest possible interval is 10 seconds, the maximum setting is 99 hours and the default setting is 1 minute. The source
drive is monitored in the set intervals and the remaining storage capacity
is shown in the display window.
Warning limit: if the storage capacity of the source drive falls below the
value set as Warning limit (in Kbytes) a warning will be displayed in the
display window of the module and the output of the module is set to TT L
High . You can select a value from the list box or you can enter any value
in between.
Destination Disk: specify the target drive to receive the data.
Font: the text display parameters can be set using the Font switch. All text
is displayed with specified font and size in the archive window. The size
of the window will be automatically adapted based on these settings.
Display window
Double-click with the left mouse button to open the minimized display window.
It shows the following information about the archiving process:
The Free Storage Space on the source drive is displayed as a percentage
of the total disk space. The display value is updated in the set interval.
10-20
ServiceLab
Chapter 10: Files Module Group
The Date and Time of the Last Archiving is displayed. (Before the first archiving, no information is shown here.)
As soon as the capacity falls below the specified Warning Limit the following Warning Message is displayed in the display window: “ Backup.”
Archiving
When the capacity of the source drive falls below the specified Warning Limit,
the warning message is displayed in the display window. At the same time, the
data at the output of the module - normally TTL Low (0V) - changes to TTL High
(5V). An alarm action can be initiated by the output of the module, for example,
using the Action module to automatically initiate the backup operation or to display a message in the message window.
An archive procedure can be initiated by a mouse click on the Backup switch in
the display window. During this procedure all Save Data modules contained in
the worksheet are requested to write their measurement values files onto the
specified Destination Disk.
In Normal mode of saving data, the current file is closed and copied to the
target drive. The file is deleted from the source drive after it is copied
and a new data file is created (including current header data).
In Multi-File mode, the current file is retained. Any multi-files present are
copied to the target drive and then deleted from the source drive.
While copying, the state of the archive procedure is indicated in a status window
(the copied amount of data as a percentage of the total).
If the storage capacity of the target diskette is insufficient for the file size, the operator is instructed to insert a new diskette, and the file is split onto 2 or more
diskettes. Use the FILEKIT.EXE program (see below) to merge these files together on the hard disk.
Error Messages, Causes, And Remedies
No diskette in target drive (Windows error message): insert a diskette
into the target drive and confirm the dialog box. A new write attempt is
made. Abort will prematurely terminate the archive procedure.
The file to be copied exceeds the available storage capacity of the target
drive (ServiceLab error message): a ServiceLab message instructs you to
change the storage media. After confirmation, the archive procedure continues.
While copying to the target drive, the diskette is removed from the drive
(Windows error message): After confirming the message, a new write attempt is made. Abort will prematurely terminate the archive procedure.
System error: Read error on the designated drive (Windows error message): the diskette is not formatted or it is write-protected if this error
message is displayed despite a correctly inserted diskette. The archive
procedure must be canceled and the error must be corrected.
10-21
ODBC Input Module
ServiceLab
Before starting an archiving procedure, make sure that the archive
diskettes
are formatted,
are not write-protected,
contain no old data files.
The FILEKIT .EXE Program
As stated above, files exceeding the storage capacity of the target drive will be
split and distributed onto several diskettes. These files can be merged together to
a large data file using the FILEKIT.EXE program (in the ServiceLab directory).
The data file to be merged is selected via the File / Open file menu item.
After confirming the inquiry, the first diskette is read and its contents stored on
the target drive. Subsequently, the user is asked to insert the following diskette(s). An additional utility file with the extension ∗.INF containing information
for the copy program is stored on the second and the following diskettes.
The copy procedure is terminated if an error should occur.
4.
ODBC Input Module
The ODBC Input module is used for the exchange of information
with databases. The content of database table fields are written into
global strings and/or variables on an Action .
Input and Output Characteristics
The module is used to set the parameter values for the data exchange with ODBC
data sources. The contents of the data source tables are written into global
strings/variables.
Module Settings
Name: The name of the data source must be defined here. Use the
Search... button to show a list of the available ODBC data sources, from
which a selection can be made.
T able: The desired table can be selected from the database. To display
all available tables use the Search ... button.
If a User Name and a Password are required to the access the database,
these can be defined. Otherwise, these entries can remain empty
Record: You can select the data record with the Insert button.
To display all available data records use the Search... button.
Expressions of the type field name + relational operand + constant are
allowed. That can be connected through AND or OR. A constant can be
also a global variable or a global string (use ${STR_xx}). A stringconstant must be included in simple quotes even if it is a global string.
10-22
ServiceLab
Chapter 10: Files Module Group
Examples:
Id = ${VAR_56}
VALUE1 > 5.0 AND TEXT1 = ` ${STR_2} `
If the condition of search is fulfilled for more than one record, all records
with which the condition is met are modified.
Field relationship:
In the Field Relationship list, the connections of the data fields are listed
with the corresponding global strings and variables.
The Get Field button lists all available data fields in the table. Existing
field-assignments stay with it. If no field-list is available a message is
shown.
To select an entry to modify, click on the list. Name and Variable is
shown in the input-fields.
In the Variable field, a global string or a global variable can be selected
with a right click. Also an entry can be entered manually. The input of
Str_x or Var_x is sufficient.
With Add , the current entry is adopted from Name and Variable into the
list. If Name already exists as an entry for the field, it is used; otherwise a
new entry is generated.
Note: the entry is also used if the Variable field loses the input-focus.
Separately clicking the Add button is usually not necessary.
Use Delete to remove the current entry from the list.
5.
ODBC Output Module
The ODBC Output module is used to exchange of information with
databases. The content of global strings and/or variables is written
on an action into the fields of a table in a database
Input and Output Characteristics
The module is used to set the parameter values for the data exchange with ODBC
data sources. The contents of global strings/variables are written to the database.
Module Settings
Name: The name of the data source must be defined here. Use the
Search... button to show a list of the available ODBC data sources, from
which a selection can be made.
T able : The desired table can be selected from the database. To display
all available tables use the Search ... button.
If a User Name and a Password are required to the access the database,
these can be defined. Otherwise, these entries can remain empty.
10-23
ODBC Output Module
ServiceLab
Record
You can select the data record with the Insert button.
To display all available data records use the Search... button.
Expressions of the type field name + relational operand + constant are
allowed. That can be connected through AND or OR. A constant can be
also a global variable or a global string (use ${STR_xx} ). A stringconstant must be included in simple quotes even if it is a global string.
Examples:
Id = ${VAR_56}
VALUE1 > 5.0 AND TEXT1 = ` ${STR_2} `
If the condition of search is fulfilled for more than one record, all records
with which the condition is met are modified.
Field relationship
In the Field Relationship list, the connections of the data fields are listed
with the corresponding global strings and variables.
The Get Field button lists all available data fields in the table. Existing
field-assignments stay with it. If no field-list is available a message is
shown.
To select an entry to modify, click on the list. Name and Variable is
shown in the input fields.
In the Variable field, a global string or a global variable can be selected
with a right click. Also an entry can be entered manually. The input of
Str_x or Var_x is sufficient.
With Add , the current entry is adopted from Name and Variable into the
list. If Name already exists as an entry for the field, it is used; otherwise a
new entry is generated.
The entry is also used if the Variab le field loses the input-focus. Separately clicking the Add button is usually not necessary.
Use Delete to remove the current entry from the list.
10-24
ServiceLab
Chapter 11: Data Reduction Module Group
Chapter 11: Data Reduction Module Group
Average
x
Block Average
x
Separate
x
Merge/Expand
x
Cut Out
x
Time Slice
Circular Buffer
Shift Register
optional
Module
Basic
version
This group consists of modules for data reduction.
x
x
x
11-1
ServiceLab
Average Module
1.
Average Module
Use this module to calculate different average values of input
signals.
Input and Output Characteristics
Number of Inputs :
Input Block Size :
Number of Outputs:
Output Block Size :
Max. Number of Modules:
up to 16
any
same as number of inputs
same as input block size
any
The type of average and the number of samples to average can be specified in the
module configuration dialog box:
Running values can be reset during an experiment using Event
Driven Actions .
1.1. Options
If the Restart after ... values option is chosen the calculated value will be
reset when the defined number of samples is reached. Calculation of the
average starts over.
The Restart after Data Hole option causes the module to reset if there is a
gap between two samples that is larger than the sampling distance. The
calculation of the average will start again. The values received until this
time will not have an effect on the new average.
1.2. Arithmetic Mean
Block: The result of this function is one value for each block of n samples, where n is the defined number of samples to average. This value
equals the arithmetic mean of the block. This function performs a data reduction with a factor n. Example: Average with 3 samples
Using the data (a1, b1, c1, a2, b2, c2....) the average (m) is calculated as
follows:
m1 = (a1 + b1 + c1) / 3
m2 = (a2 + b2 + c2) / 3
m3 = (a3 + b3 + c3) / 3
m4 = (a4 + b4 + c4) / 3
...
Running: This function calculates the running average over n samples. The
start segment contains the mean of the first data sample. The number of
11-2
ServiceLab
Chapter 11: Data Reduction Module Group
output samples equals the number of input samples. Example: Average
with 3 samples
Using the data (a1, a2, a3, a4, a5...) the average (m) is calculated as follows:
m1 = (a1 + a2 + a3) / 3
m2 = (a2 + a3 + a4) / 3
m3 = (a3 + a4 + a5) / 3
m4 = (a4 + a5 + a6) / 3
...
Summing: For each sample, this function calculates the mean value of all
the previous data. The number of output samples equals the number of input samples. For example, using the data (e1, e2, e3, e4, e5, ... ) the average (a1; a2, a3 ....) is calculated as follows:
a1 = e1
a2 = (e1 + e2) / 2
a3 = (e1 + e2 + e3) / 3
a4 = (e1 + e2 + e3 + e4) / 4
a5 = (e1 + e2 + e3 + e4 + e5) / 5
a6 = (e1 + e2 + e3 + e4 + e5 + a6) / 6
...
Summing with restart after (x) values: Example:
x=3
a1 = e1
a2 = (e1 + e2) / 2
a3 = (e1 + e2 + e3) / 3
a4 = e4
a5 = (e4 + e5) / 2
a6 = (e4 + e5 + e6) / 3
…
1.3. Quadratic Mean
Block: The result of this function is one value for each block of n samples, where n is the defined number of samples to average. This value
equals the quadratic mean of the block. This function performs a data reduction with a factor n. Example: average with 3 samples
Using the data (a1, b1, c1, a2, b2, c2) the average (m) is calculated as
follows:
m1 =
1 2
(a 1 + b 1 2 + c 1 2 )
3
m2 =
1 2
(a 2 + b 2 2 + c 2 2 )
3
11-3
ServiceLab
Average Module
m3 =
1 2
(a 3 + b 3 2 + c 3 2 )
3
...
Running: This function calculates the running average over n samples.
The start segment contains the mean of the first data sample. The number
of output samples equals the number of input samples. Example: Average
with 3 samples
Using the data (a1, a2, a3, a4, a5...) the average (m) is calculated as follows:
m1 =
1 2
(a 1 + a 2 2 + a 3 2 )
3
m2 =
1 2
2
2
(a + a 3 + a 4 )
3 2
m3 =
1 2
2
2
(a + a 4 + a 5 )
3 3
...
Summing: For each sample, this function calculates the mean value of all
the previous data. The number of output samples equals the number of input samples. Example: Average with 3 samples
Using the data (a1, a2, a3, a4, a5...) the average (m) is calculated as follows:
m1 =
1 2
(a 1 + a 2 2 + a 3 2 )
3
m2 =
1
2
2
2
( m1 + a 2 + a 3 )
3
m3 =
1
2
2
2
( m1 + m 2 + a 3 )
3
m4 =
1
2
2
2
(m 2 + m 3 + a 4 )
3
m5 =
1
2
2
2
(m3 + m4 + a 5 )
3
...
1.4. Median
If the number of samples is uneven, the result of this function is the value
of the middle sample of the size-ordered series of the defined number of
received samples. If the number is even, the arithmetic mean of the both
middle values is used for the result of the function.
11-4
ServiceLab
Chapter 11: Data Reduction Module Group
Block: The result is one median for each block of samples, defined in
Average Samples (Sum of n values divided by n). This function performs
a data reduction with a factor n. Use Change Block Length to change the
output block length to the desired value.
Example 1: Median with 5 samples (uneven number)
Using the data (a1, b1, c1, d1, e1 and a2, b2, c2, d2, e2 and so on) are
sort in ascending order. The median m is the value in the middle:
a1 < b1 < e1 < c1 < d1 => m1 = e1
a2 < e2 < b2 < c2 < d2 => m2 = b2
e3 < b3 < a3 < c3 < d3 => m3 = a3
....
Example 2: Median with 6 samples (even number)
Using the data (a1, b1, c1, d1, e1, f1 and a2, b2, c2, d2, e2, f2 and so on)
sorted in ascending order, the median m is the arithmetic mean of the two
values in the middle:
a1 < b1 < e1 < c1 < d1 < f1 => m1 = (e1 + c1)/2
a2 < e2 < b2 <f2 < c2 < d2 => m2 = (b2 + f2)/2
e3 < b3 < a3 < c3 < f3 < d3 => m3 = (a3 + c3)/2
....
Running: In this function the median for each sample with the previous
number of data, defined in Average Samples, is calculated. Each new
sample gets a new median.
Example 1: Median with 5 samples (uneven number)
Using the data (a, b, c, d, e, and b, c, d, e, f, and so on) sorted in ascending order the median m is the value in the middle:
a <b <e <c <d ⇒
m1 = e
b < e < c <d < f ⇒
m2 = c
g < e < c <d < f ⇒
m3 = c
g < e <d < f < h ⇒
m4 = d
....
Example 2:
Median with 6 samples (even number)
Using the data (a, b, c, d, e, f, and b, c, d, e, f, g, and so on) sorted in ascending order the median m is the arithmetic mean of the two values in the
middle:
a <b <e <c <d <f
⇒
m1 = (e + c)/2
b <e <c <d <g<f
⇒
m2 = (c + d)/2
e<h<c<d<g<f
⇒
m3 = (c + d)/2
e <h<d <g<f<i
⇒
m4 = (d + g)/2
....
Exponential Weighted Mean: With this function you compute the (running)
mean with the following formula:
s (Tau, n) = sqrt (exp (-k) * sqr (s (Tau, n-1)) + k * sqr (x(n)) ),
11-5
ServiceLab
Block Average Module
where n is the sample number, x(n) is the sample at sample number n, k is
the sample distance divided by Tau, and Tau is the specified time constant.
1.5. Options
If the Restart after ... values option is chosen the calculated value will be
reset when the defined number of samples is reached. Calculation of the
average starts over.
The Restart after Data Hole option causes the module to reset if there is a
gap between two samples that is larger than the sampling distance. The
calculation of the average will start again. The values received up to this
time don’t have an effect on the new average.
2.
Block Average Module
Use this module to calculate the block average, maximum or
minimum of its input signals.
Input and Output Characteristics
Number of Inputs :
Input Block Size :
Number of Outputs:
Output Block Size :
Max. Number of Modules:
up to 16
any, but fixed
same as number of inputs
same as input block size
any
The Average function calculates the arithmetic means of blocks. The output will
always represent the mean value of the different blocks. In contrast with Average,
this module builds the mean with the value n of the consecutive blocks, not with
consecutive values. The Peak Hold function calculates the Minimum/Maximum at
each position n in block depending on the value of the incoming blocks at this position.
The following averages are provided:
Single Values: Each output block represents the mean of the specified
number of input blocks (see example above).
The number of output blocks will be lower than the number of input blocks.
The Average Samples, ´Restart after... Samples´and ´Time constant´parameters
can also be defined using Global Variables. The variables are only checked at the
start of experiment. They cannot be changed while measurement is running.
Example: Block size 4, Average 3 Blocks, Single Values
11-6
ServiceLab
Chapter 11: Data Reduction Module Group
With the Input data blocks (a, b c and d, e, f) with a size of 4 (1 up to 4)
the Output data blocks (g and h) are calculated as follows:
g1 = (a1 + b1 + c1) / 3
h1 = (d1 + e1 + f1) / 3
g2 = (a2 + b2 + c2) / 3
h2 = (d2 + e2 + f2) / 3
g3 = (a3 + b3 + c3) / 3
h3 = (d3 + e3 + f3) / 3
g4 = (a4 + b4 + c4) / 3
h4 = (d4 + e4 + f4) / 3 ... .
Running: This function recalculates the running mean for each input block.
The output block always represents the current block mean of all the previous input blocks. Example: Block size 4, Running average
With the Input data blocks (a, b and c ) with a size of 4 (1 up to 4) the
Output data blocks (e, f and g) are calculated as follows:
e1 = a1
f1 = (e1 + b1) / 2
g1 = (e1 + f1 + c1) / 3
e2 = a2
f2 = (e2 + b2) / 2
g2 = (e2 + f2 + c2) / 3
e3 = a3
f3 = (e3 + b3) / 2
g3 = (e3 + f3 + c3) / 3
e4 = a4 f4 = (e4 + b4) / 2 g4 = (e4 + f4 + c4) / 3 ...
Running with Restart: This function is similar to the running average, except that a reset will be performed after n blocks, where n is the entered
number of blocks. Example: Block size 4, Running average with Restart
after 3 blocks
With the Input data blocks (a, b, c, d and e ) with a size of 4 (1 up to 4)
the Output data blocks (g, h, k and 1) are calculated as follows:
g1 = a1
h1 = (g1 + b1) / 2
i1 = (g1 + h1 + c1) / 3
k1 = d1
l1 = (k1 + e4) /2
g2 = a2
h2 = (g2 + b2) /2
i2 = (g2 + h2 + c2) /3
k2 =d2
l2 = (k2 + e4) /2
g3 = a3
h3 = (g3 + b3) /2
i3 = (g3 + h3 + c3) /3
k3 =d3
l3 = (k3 + e4) /2
g4 = a4 h4 = (g4 + b4) / 2 i4 = (g4 + h4 + c4) /3 k4 =d4 l4 = (k4 + e4) / 2 ... and so on.
2.1. Peak Hold
Single Values: Each output block contains the Maxima/Minima of the x
input blocks
The number of output blocks will be lower than the number of input
blocks.
Example: Block size 4, Peak Hold Maximum of 3 blocks, Single Values
With the Input data blocks (a, b c and d, e, f) with a size of 4 (1 up to 4)
the Output data blocks (g and h) are calculated as follows:
a1 < b1 > c1 ⇒ g1 = b1
d1 > e1 > f1 ⇒ h1 = d1
a2 > b2 > c2 ⇒ g2 = a2
d2 > e2 > f2 ⇒ h2 = d2
a3 < b3 < c3 ⇒ g3 = c3
d3 > e3 > f3 ⇒ h3 = d3
a4 > b4 > c4 ⇒ g4 = a4 d4 < e4 > f4 ⇒ h4 = e4 ...
Running: This function creates an output block containing the minima
/maxima of the specific sample position of all received data blocks. Example : Block size 4, Peak Hold Maximum, Running
11-7
ServiceLab
Separate Module
With the Input data blocks (a, b and c) with a size of 4 (1 up to 4) the
Output data blocks (e, f and g) are calculated as follows:
a1 < b1 > c1 ⇒ e1 = a1
f1 = b
g1 = b1
a2 > b2 > c2 ⇒ e2 = a2
f2 = a2
g2 = a2
a3 < b3 < c3 ⇒ e3 = a3
f3 = b3
g3 = c3
a4 > b4 > c4 ⇒ e4 = a4
f4 = a4
g4 = a4 ...
Running with Restart: This function creates an output block containing the
minima /maxima of the specific sample position of the received data
blocks. Reaching x blocks the values are chopped and replaced with the
minima/maxima of the new blocks and cycle restarts. Example: Block
size 4, Peak Hold Maximum, Running with Restart after 3 blocks
With the Input data blocks (a, b, c and d) with a size of 4 (1 up to 4) the
output blocks (e, f, g and h) are calculated as follows:
a1 < b1 > c1 > d1
⇒
e1 = a1
f1 = b1
g1 = b1
h1 = d1
a2 > b2 > c2 = d2
⇒
e2 = a2
f2 = a2
g2 = a2
h2 = d2
a3 < b3 < c3 > d3
⇒
e3 = a3
f3 = b3
g3 = c3
h3 = d3
a4 > b4 > c4 > d4 ⇒ e4 = a4 f4 = a4 g4 = a4 h4 = d4 ...
Running values can be reset during an experiment using Event
Driven Actions .
3.
Separate Module
Use this module to reduce data by skipping the specified number
of blocks or samples.
Input and Output Characteristics
Number of Inputs :
Input Block Size :
Number of Outputs:
Output Block Size :
Max. Number of Modules:
up to 16
any
same as number of inputs
same as input or specified block size
any
This module achieves data reduction
by skipping an initial number of samples or blocks,
then repeatedly passing one sample or block to the connected modules,
then skipping a number of samples or blocks again.
Behavior at Start of Experiment
At the start of the experiment the specified number of samples or blocks (Ignore … once) is skipped once. The next sample or block will be passed to the
11-8
ServiceLab
Chapter 11: Data Reduction Module Group
connected modules. The maximum number is 32,000. If a greater number is inserted, it will be reduced to 32,000.
Use this function to perform an initial skip.
Behavior while Experiment is Running
After one sample (or block) has been passed to the module output, the number of
samples (or blocks) specified under Ignore … is read in but not passed to the
connected modules.
The next sample (or block) is passed again, then the defined amount of data is ignored, etc.
The Output Block Size can be set from 1 to 8,192 if the data reduction is based
on samples and not on data blocks.
This module is very useful if you need channels with high and low acquisition rates in one worksheet. Most drivers only support equal sampling rates for
all channels; this module can easily perform the necessary data reduction for the
slow channels.
You can also use Global Variables to define the number of samples. The variable is read each time a mesurement starts.
4.
Merge/Expand Module
Use this module to sequentially combine different data channels
into one data channel or to distribute the values of one data
channel to up to 16 channels.
Input and Output Characteristics
Number of Inputs:
Input Block Size:
Number of Outputs:
Output Block Size:
Max. Number of Modules:
up to 16 or 1
any
1 or more
same as input
any
Since this module provides two basic operations, you must first select the function type when you install the module.
Merge: up to 16 channels can be multiplexed onto one channel. Start time,
block size, and acquisition rate of all channels must be the same. The
number of input channels and the multiplex factor are set using the Channel Bar. The block size of the generated channel and the sampling rate is
multiplied by the number of channels
11-9
ServiceLab
Cut Out Module
Expand: one channel is distributed to the number of channels specified by
using the Channel Bar. The sampling rate of the output channels is divided
by the number of channels.
Use this module to route a large amount of data via one channel. The data can
also be processed partially if a Merge module is inserted at the beginning of the
channel and a Expand module at the end. Thus the worksheet can be simplified to
a large extent.
When used in combination with the Write Data module, this module allows you
to store more than 16 channels in one file.
Use the option mode to select between merging/expanding data as blocks or as
single samples.
5.
Cut Out Module
Use this module to specify a range of values to be extracted unchanged from a data block and routed to the output. The remaining values are set to 0.
One module can process up to 16 data channels with different settings. Use the
Channel Bar to specify the number of channels and the channel to be set (selected
channel).
Input and Output Characteristics
Number of Inputs:
up to 16
Input Block Size:
any
Number of Outputs:
same as input
Output Block Size:
same as input
Max. Number of Modules: any
Use Extraction to specify the values for each channel which should be passed on
unchanged to the output. All other values within the data block are set to 0.
If the limits are set to a size exceeding the block size of the data channel, the data
is passed on without any modifications.
Example: global block size: 512
data from sample no. 10 through 500
→
the values 1 to 9 are set to 0;
the values 10 to 500 are passed on unchanged;
the values 501 to 512 are set to 0 again.
This function can be used to extract only certain frequency parts of an FFT signal
and pass those on for display or further processing.
11-10
ServiceLab
6.
Chapter 11: Data Reduction Module Group
Time Slice Module (optional)
Use this module to combine signal segments from different
channels using a defined time schedule.
Since this module provides two basic operating modes, you must first select the
function type when you install the module.
T ime Controlled Multiplexer (Time Slice): This module can combine signal
segments from different channels by a defined time schedule. Use the Action Module to modify the schedule.
Amplitude Controlled Multiplexer: This module can combine signal segments from different channels by a defined signal.
In the TTL Controlled Multiplexer mode you can change the parameters using the
Action Module. This option is not available in the Amplitude Controlled Multiplexer mode.
6.1. Time Controlled Multiplexer
Input and Output Characteristics
Number of Inputs:
up to 16
Input Block Size:
any
Number of Outputs:
1
Output Block Size:
same as input block size
Max. Number of Modules: any
The Time Slice module can be used to combine streams of different signals from
several input channels according to the defined time slice.
Independent of the number of inputs, the module generates only one output signal,
which consists of signal segments taken consecutively from the activated input
channels. The first segment is always taken from module entry 0, the second from
module entry 1, and so forth.
The size of these segments can be specified for each individual input channel in
the module configuration dialog box. Their duration (or length) can be defined
either as a period of time or as a number of blocks.
After one segment of the specified size from each activated input channel has
been output, the first cycle is completed. The Restart at the End of the Cycle flag
then determines the output signal:
If this flag is set, another cycle will start beginning with a segment from
channel 0.
If this flag is not set, the signal from the last activated channel will be
output further.
11-11
ServiceLab
Time Slice Module (optional)
Use the Action module to change the settings using Event Driven Actions. You can
switch to the next or previous channel and reset or set output value depending on
a specific condition.
6.2. Amplitude Controlled Multiplexer
Input and Output Characteristics
Number of Inputs:
Input Block Size:
Number of Outputs:
Output Block Size:
Max. Number of Modules:
up to 16
any
1
same as input block size
any
The Time Slice module can be used to combine streams of different signals from
several input channels according to a defined signal slice.
Independent of the number of inputs, the module generates only one output signal,
which consists of signal segments taken consecutively from the activated input
channels. Activation of the input channel depends on the signal at input X of the
module.
The kind of signal can be specified in the module configuration dialog box.
Edge Controlled Increment: on detecting the rising edge of a TTL signal,
the module switches to the next channel. On reaching the last channel, a
new cycle will start, beginning with a segment from channel 0.
Edge Controlled Decrement: o n detecting the rising edge of TTL signal,
the module switches to the previous channel. On reaching the last channel,
a new cycle will start, beginning with a segment from channel 0.
Amplitude Controlled: The amplitude of the control signal at input X is
rounded to an integer that describes the number of the next actual channel.
At overflow (amplitude > max. number of channels) the last channel will
set. At underflow (amplitude ≤ 0) the first channel will be used. Since
there is always a useful value in this mode, the Action module cannot be
used.
You can use Event Driven Actions to switch to the next or the previous channel
and reset or set the output value depending on a specific condition (cannot be
used in Amplitude Controlled mode).
11-12
ServiceLab
7.
Chapter 11: Data Reduction Module Group
Circular Buffer Module
Use this module to save data into a buffer for a defined time interval and output it to the module outputs via an Event Driven Ac tion.
Input and Output Characteristics
Number of Inputs:
Input Block Size:
Number of Outputs:
Output Block Size:
Max. Number of Modules:
up to 16
any
same as input
--any
The Time Interval setting defines the length of time saved into the circular buffer.
Samples in the buffer are refreshed at each new measurement cycle, so the oldest
values are flushed and the newly received data is added.
An Event Driven Action will cause the complete contents of the buffer to be output, using the global block size; otherwise the output has no value.
The Post Trigger option allows you to include Samples that are received at the
module input while the event has happened.
The Buffer Status ->Global Variable option writes the actual status of the circular
buffer in a global variable.
8.
Shift Register Module (optional)
Use this module to store data, one point at a time –
controlled by a trigger, into a temporary register, and
outputs a block repeatedly.
Input and Output Characteristics
Number of Inputs:
Input Block Size:
Number of Outputs:
Output Block Size:
Max. Number of Modules:
up to 8 pairs (Data and Control Input)
any
up to 8
depends on module setting
any
11-13
Shift Register Module (optional)
ServiceLab
This module will save a data point into a block each time it receives a rising
edge at the Control Input. The block (register) is initially filled with zeros which
are replaced by real data. The module continually outputs the register as a block
using the sampling rate/block size of the inputs. When the register is filled, the
values shift to the left, losing the first sample, and adding the most recent to the
end of the register.
This module is different from the Circular Buffer module, because it continuously
outputs data, filling unused positions with zero. The Circular Buffer outputs a
block on demand, without fill.
The module allows you to combine samples that are not synchronous or otherwise aligned in time.
Register Size: Define the register size in samples. That value defines also the
output block size.
If the register is filled, the first (oldest) value is deleted and the new one is acquired (FIFO).
The block size at the module output is defined by the register size. The relation of sampling rate and block size is the same as at the input:
Global Sampling Rate =200 Hz; Block Size = 100; Register Size = 10
At input A/B = 200/100 = 2 ; at output Register Size = B = 10 => A = 20
11-14
ServiceLab
Chapter 12: Special Modules Group
Chapter 12: Special Modules Group
This module group consists of modules for creating Black Boxes, Event
New Black Box
optional
Module
Basic
version
Driven Actions, and for manipulating the time base of the signal.
x
Export / Import
Module (Black Box)
x
Action
x
Message
x
Time Base
x
Signal Adaptation
x
E-MAIL
x
12-1
Black Box
1.
ServiceLab
Black Box
Concept and Handling
With ServiceLab’s Black Box concept you can create worksheet elements often
used in your experiments, integrate them into one module (the Black Box) and use
them in future worksheets as ready-to-use units.
Use Black Box modules to create your own modules which perform custom algorithms to meet your specific needs.
This modular approach simplifies experiment setups by reducing the number of
elements (modules and data channels) in the worksheet. It also saves time, as
subordinate standard tasks need not be set up each time.
The Black Box module contains a complete worksheet, with modules arranged on
a worksheet and connected with each other through data channels. The worksheet
is just another ServiceLab worksheet. This means, for example, that it may use
up to 256 modules.
On the worksheet, the Black Box module looks like any other module. It can be
installed and handled in a similar way, it may be configured with several inputs
and outputs, and it can be connected to the other modules.
The Black Box module itself has an “inside” and an “outside”:
Inside, it contains a complete worksheet, with modules arranged on a
work area and connected to each other through data channels. The complexity of that worksheet is the same as that of any other ServiceLab
worksheet. This means, for example, that it may contain up to 256 modules.
Outside, the Black Box module looks like any other module on the worksheet of which it is an element. It can be installed and handled in a similar
way, it may be configured with several inputs and outputs, and it can be
connected to the other modules as usual.
Black Box modules offer some additional features:
On a Black Box worksheet you can insert another Black Box module,
which can then contain a Black Box module again, and so forth. Thus, the
worksheet becomes three-dimensional in a way, with the Main Chart (on
the actual ServiceLab work area) and several layers of subordinate Black
Box levels, each one embedded into the preceding one.
You can freely move up and down between levels using menu commands
and a Function Bar icon.
Data is exchanged between a worksheet and a Black Box worksheet embedded into it using the Export and Import module. This module may be
provided with up to 16 inputs and outputs.
Each Black Box module can be saved separately, so that you can easily
edit, manage, and insert several of them independently.
12-2
ServiceLab
Chapter 12: Special Modules Group
Each Black Box can be protected with separate passwords, so that it cannot be opened or changed.
1.1. New Black Box
Use this command to insert a Black Box module into the worksheet.
1.1.1
Black Box Module
Input and Output Characteristics
Number of Inputs :
Input Block Size :
Number of Outputs:
Output Block Size :
Max. Number of Modules:
up to 16
any
up to 16
any
any
The Black Box module symbol appears on the ServiceLab work area like any
other module, but is initially empty and does not have input or output symbols.
Double-click the Black Box module symbol to open the Black Box module worksheet. The Black Box module displays an empty worksheet. The worksheet looks
like that of the main chart except the background color is different to indicate the
new level (see below).
Black Box Worksheet
You can create the Black Box worksheet by installing modules, configuring and
connecting them, just as on the main worksheet.
Like any other ServiceLab worksheet, a Black Box worksheet may contain up to
256 modules .
Each Black Box can have its own Module Bar. You can create multiple customized Module Bars adapted for each Black Box task, save them to files and open
them later. Choose the commands from the Module Bar submenu on the Edit menu
to do so.
These settings will be saved with the Black Box worksheet.
Black Box Configuration
A Black Box can have up to 16 inputs and up to 16 outputs. These cannot be selected using a Channel Selection Bar, as with other modules, but they are created
when Black Box Export/Import modules are installed on the Black Box worksheet.
The number of inputs is independent of the number of outputs; the input block
sizes and input rates are independent of the output block sizes and output rates.
12-3
Black Box
ServiceLab
Use the Black Box Info command from the Edit menu to specify a Module Name
for the Black Box. You can also enter a descriptive text string and a Short Cut
identifying tag for the Black Box module symbol on the Module Bar.
Black Box Levels
In a Black Box worksheet, you can insert another Black Box module, which can
then contain a Black Box module again, and so forth, down to any level.
Leaving a Black Box
You can enter or open a Black Box by clicking its module symbol
on the worksheet; you can leave or close it to return to the preceding worksheet level by clicking this Function Bar icon, or by
choosing the command from the Black Box Module submenu on
the Edit menu (see Chapter 4 of the UserGuide for more information).
A Black Box may be closed either by clicking this function bar icon, or by choosing the command from the Black Box Module submenu on the Edit menu.
This command has two names: It is either Back to the Main Chart (if the current
Black
Box is an element of the
Main Chart), or it is
To Preceding Black Box Level (if the current Black Box is itself an element of
another Black Box worksheet).
After a Black Box has been closed, the worksheet on the preceding level is activated.
You can enter a Black Box (i.e. activate its worksheet for editing) only by
double-clicking its module symbol on the worksheet
Data Transfer between Black Box Levels
Data is transferred between the main chart and the subordinate Black Box worksheet using the Export/Import module. This module can be selected from the Black
Box module group on the Module menu or from the Module Bar.
You can switch between black boxes and the worksheet while measurement is
running.
Colors
The default background color setting of a new Black Box worksheet is blue. The
color settings can be selected individually for each Black Box. Choose the Colors
command from the Options menu to do so.
These settings are saved with the Black Box worksheet.
Use the background color as an indicator of the Black Box level. For example, a color code could be: the lower the level, the darker the color.
12-4
ServiceLab
Chapter 12: Special Modules Group
Black Box Files
Each Black Box module can be saved separately and can be edited, managed, and
installed independently.
The first 20 Black Box files in the ServiceLab directory will appear as menu
items on the Black Box Module submenu of the Module menu. Their Module
Names (as entered in the Black Box Info dialog box) appear as menu commands.
The Short Cut tag (as entered in the Black Box Info dialog box) is a string of up to
3 characters which is used to identify the Black Box module on the Module Bar.
The Module Bar icon representing that Black Box displays that tag.
For further information on the Edit menu commands to create, save, open and edit
Black Boxes, please refer to Chapter 4 of the User Guide.
Black Box Properties
In this dialog box you can enter descriptive text and identifying tags for the
Black Box module.
The Module Name helps to identify the module symbol in the worksheet.
The Black Box module symbol in the main chart (or the preceding worksheet level) displays this name in its title bar.
The first 20 Black Box files in the ServiceLab directory automatically appear as menu items on the Black Box Module submenu of the Module
menu. Their Module Names appear as menu commands.
In the Description box you can enter a short comment on the functions implemented in the Black Box.
The ID Tag is a string of up to 3 characters. It is used to identify the
Black Box module in the module bar. The module bar icon representing
that Black Box displays that tag.
A Black Box can only be saved if an ID Tag has been entered. If the identifying tag is missing, the Black Box Info dialog box will appear when you
save the Black Box.
The Password Protection check box enables separate password protection for the actual Black Box worksheet. If the password is not defined,
activating the option will open the input box for the password. The
Change ... button opens the input box if a password already exists.
12-5
ServiceLab
Black Box
1.2. Export / Import Module
This module provides the connection between a Blac k Box worksheet and the main chart (or the preceding worksheet) of which
that Blac k Box is an element. It transfers data between these two
worksheet levels.
Each Black Box worksheet can contain only one Import module and one Export
module.
To establish the connection, the module must be present on both worksheet levels. The Export or Import module symbol in the Black Box worksheet and the
module symbol of that Black Box in the main chart provides the corresponding
number of output and input symbols.
This module can only be inserted into a Black Box worksheet. The Export/Import
module can be included on the Module Bar.
When the module is inserted into the Black Box worksheet for the first time, select one of the following module types:
Export Data
Import Data
Once the module is integrated into the worksheet, its module configuration dialog
box provides the settings and options specific to the selected type. To change the
type, delete the module first, and install it again, choosing the new type.
Up to 16 module entries or outputs can be activated.
Unlike most other modules, the number of inputs is independent of the number of
outputs; the input block sizes and input rates are independent of the output block
sizes and output rates.
1.2.1
Export Module
Input and Output Characteristics
Number of Inputs :
Input Block Size :
Number of Outputs:
Output Block Size :
Max. Number of Modules:
up to 16
any
----1 per Black Box
Use this module to transfer data from the Black Box worksheet to the main chart
(or to the worksheet on the preceding level) for processing.
The Export module provides only inputs for the data going out to the main
chart.
The Black Box module provides the corresponding number of outputs to
deliver data from the Black Box worksheet to the main chart.
Each Black Box worksheet can contain only one Export module.
12-6
ServiceLab
1.2.2
Chapter 12: Special Modules Group
Import Module
Input and Output Characteristics
Number of Inputs :
Input Block Size :
Number of Outputs:
Output Block Size :
Max. Number of Modules:
----up to 16
any
1 per Black Box
Use this module to receive data from the main chart (or the worksheet on the preceding level) to process it in the Black Box worksheet.
The Import module provides only outputs for the data coming in from the
main chart to the Black Box worksheet.
The Black Box module provides the corresponding number of inputs to deliver data from the main chart to the Import module on the Black Box
worksheet.
Each Black Box worksheet can contain only one Import module.
1.3. List of up to 20 Black Boxes
The first 20 Black Box files in the ServiceLab directory will appear as menu
items on the Black Box Module submenu of the Module menu. Their Module
Names as entered in the Black Box Info dialog box appear as menu commands.
Simply choose the menu command to install that Black Box in your worksheet.
ServiceLab can only list a Black Box file on the menu if the Module Name
has been entered for the Blac k Box before saving it.
For information on how to save a Black Box, on the Black Box Info dialog box,
and on related Edit menu commands, please refer to Chapter 4 of the User Guide.
Any of the Black Boxes can be installed on the Module Bar. Their Short Cut ID
Tag (as entered in the Black Box Info dialog box) will be used to identify the
Black Box on the Module Bar. The Module Bar icon representing the Black Box
displays that tag.
You can insert any Black Box, saved in any directory, into your worksheet by
choosing Open … from the Black Box Module submenu of the Edit menu.
12-7
Event Driven Actions
2.
ServiceLab
Event Driven Actions
Concept
The concept of the Event Driven Actions represents a powerful set of tools for the
automation of actions in ServiceLab. Based on user determined conditions, a
wide variety of module actions can be triggered, including printing display instruments, resetting internal values of the mathematics modules, logging of
events, alarms, etc.
Sender / Receiver
An event driven action involves two (2) partners: a sender and a receiver.
A sender is an Action module that evaluates an incoming data channel with respect to various conditions. It initiates a desired action.
The receiver (specified in the Action module) is the module that performs the action or it is the main window in ServiceLab.
The assignment of action and receiver is made in the Action module via the name
of the receiver. The assignment to the action is lost if the name of a module performing an event driven function is changed after setting the action or if the receiver is deleted from the worksheet.
Synchronous / Asynchronous Actions
Synchronous Actions: Synchronous actions are performed on the data
block where the actions occurred. The data stream triggering the action
must be synchronous to the data stream the action should influence.
For example, it is not possible to apply a synchronous action that has been
initiated by a relay triggered data stream to an untriggered data stream.
Such tasks are only suited for asynchronous actions.
Synchronous actions are reasonable in cases where actions must occur at
an exact point in time in a data stream. A good example is the printout of a
special data block.
Synchronization is treated as an additional internal data channel and thus
requires computing time even if no actions are initiated.
The action always relates to the beginning of the block if the position
within the data block is of importance to a synchronous event (for example, with a Reset action).
The action is performed just once for the evaluated data block if the condition to initiate an action is satisfied within an evaluated data block more
than one time.
For synchronous actions, the data must arrive at the Action module and at
the Receiver module with the same block start time. Otherwise, ServiceLab will generate an error message.
Asynchronous actions
12-8
ServiceLab
Chapter 12: Special Modules Group
Asynchronous actions are performed without regard to whether the data
initiating the action was already processed by the module which should
perform the processing.
If, for example, the Print action is sent as an asynchronous action to the Y/t
Chart module, it is possible that the corresponding data block is not
printed but an earlier or later data block.
Asynchronous events feature a larger flexibility and are faster in the execution behavior. They should be used in such cases where the execution at
the time of a certain data block is not required. A good example is the activation/deactivation of channels in a visualizing window.
Of special importance is the fact that processing of asynchronous actions
does not require any additional computing time if no action is initiated
(the Action module to evaluate the data is the exception).
2.1. Action Module
This module is used to initiate various actions in ServiceLab or in
ServiceLab modules .
Once integrated into the worksheet, this module can initiate up to 16 different actions via one data channel.
Input and Output Characteristics
Number of Inputs:
Input Block Size:
Number of Outputs:
Output Block Size:
Max. Number of Modules:
1
any
----any
The Action module can initiate up to 16 different Event Driven Actions. . You can
define
up to 16 actions based on one input channel, or
up to 16 input channels with only one action for each channel.
Use the Channel Bar to specify the number of Event Driven Actions to be initiated.
The following specifications are required for each action to be initiated:
one event condition,
one receiver for the action,
the action itself and
the action dependent parameters.
12-9
ServiceLab
Event Driven Actions
Event
Specify the Event condition for which the input data block is evaluated. The following options are available.
Function
the action is initiated…
Rising edge:
when the input changes from TTL Low (numerical
value 0) to TTL High (numerical value 5).
when the input changes from TTL High (5) to TTL
Low (0).
when the input exceeds the specified threshold value.
when the input is less than the specified threshold
value.
when the input is TTL High (5).
when the input is TTL Low (0).
as long as the input value is larger than the threshold
value.
as long as the input value is less than the threshold
value.
This event reacts to the changing of the values of the
corresponding channel/module. The parameter used is
the minimum percentage the value has to change to
cause the action. The last value is taken as 100 %.
Don’t use the 0 %, because the program uses floating
point values in the comparison, they are infrequently
the same.
This event reacts to the correspondence of an input
channel value with the defined target value. The parameter used is the target value. A difference of +/0.001 % between target and input value will be accepted, because the program uses floating point values
in the comparison, they are infrequently the same.
at the beginning and/or at the end of the measurement.
Falling edge:
Threshold overflow:
Threshold underflow:
TTL High level:
TTL Low level:
Input larger than
threshold:
Input smaller than
threshold:
Input value has
changed
Input value is reached
(±0.001%)
Start/Stop of the
measurement:
Global String has
changed
Global Variable has
changed
Always:
Never:
if the named Global String has changed during measurement.
if the named Global Variable has changed during
measurement.
the action is constantly initiated.
the action is never initiated. (NOP)
The applicable threshold required for the condition is specified with Threshold. In the
following events you can use global variables as parameter:
12-10
ServiceLab
Chapter 12: Special Modules Group
Input larger/smaller than threshold
Threshold over/underflow
Input value has changed
Use the Rising/Falling edge and Threshold over/underflow conditions as often as
possible, since a hysteresis is applied to the condition.
For example, a slowly rising signal will trigger an action with Threshold overflow
only if the threshold is really exceeded. The next action will only be triggered after
the signal has dropped below the lower threshold and then exceeds it again.
In contrast, for Input larger than threshold, an action is initiated for every block for
which at least one value is larger than the set threshold. This means the action is
initiated every time the threshold exceeds and for every following block until the
signal value falls below the threshold value. Under certain circumstances this can
initiate many undesired actions, requiring a significant amount of computing time.
Receiver
Use Receiver to specify which module the initiated action should process.
In the pull-down module list box all modules present in the worksheet
(and which can perform actions) are listed together with the main window
of ServiceLab.
Use Channel to specify which channels of the selected module should
perform the actions. Individual channels can be separated with spaces or
commas. Channel groups are entered with hyphens.
Example:
To use the channels 1, 3, 7 and 9 up to 12 of the Receiver
module for the event, enter: 1 3 7 9-12 or 1,3,7,9-12.
This setting does not influence actions relating to the entire module.
Action
Select the Action which should be initiated if the set condition is satisfied.
In the pull-down list box, all Actions are listed which the selected Receiver module can perform.
After selecting an Action, you can specify whether the action should be
performed synchronously or asynchronously.
If the Receiver module can only asynchronously perform the selected action, this
setting is selected automatically. The synchronous option is disabled.
Parameter
If the selected Action requires additional inputs these options can be set using the
Parameter item.
This area of the dialog box depends on the selected Action. Depending on the selected Action , 1 text parameter, up to 4 integer parameters or up to 4 floating
point parameters can be entered.
12-11
ServiceLab
Event Driven Actions
Above each input, a header explains the purpose of the Parameter. In all parameter settings, you can also use an ”internal” variable of the Action module. This
variable ${INPUT} is only available in the Action module and contains the
value of the input. For example, you can switch between several layouts controlled by the value at the input of the module.
Hint for using Global Variables in Actions
You can access Global Variables and Strings in different ways such as using
numbers or corresponding names. To define them in Actions that use Variables
or Strings as a parameter, please look at the following example:
The example is the Set Variables area action:
The variables settings are:
Name of Variable 2 = KLOPS, numerical Value = 5 ,
Name of Variable 10 = MOPS, numerical Value = 8.
The value to be set is 0:
Parameter
Result of action
from 2
Set Variables 2 to 10 to value 0,
to 10:
from
KLOPS
MOPS
From ${KLOPS}
To ${MOPS}
to
Set Variables with the indices from variable
KLOPS (Index = 2) and MOPS (Index = 10)
to 0.
The variables from 2 to 8 are set to the value
0
Set the variables with the indices corresponding to the contents of variable KLOPS (= 2 )
and the contents of variable MOPS (= 8) to
0. The variables from 5 to 8 are set to value
0.
Mixed use is allowed,
e.g.
from
1
...to Set the variables with Index 1 to the variable
${VAR_10}
with the index corresponding to the contents
of variable 10 (= 8 ) to zero.
So the variables from 1 to 8 are set to value
0.
Notify
Each time an Action is performed, you can Increment a Global Variable . The
variable is incremented at the end of the Action. Select a global variable from
the list box.
12-12
ServiceLab
Chapter 12: Special Modules Group
Action List
This is an overview of the Event Driven Actions, of the modules which can perform such actions and of the applicable parameters.
Actions which change Displays
Action
Receiver
Description
Parame ter
global function
Activates previously stored display window arrangement
Window Arrangement
number
Ac tivate Layout
global function
activates a Layout window
Layout Number
Update Layout
global function
updates a Layout window
Layout Number
switches the Layout into
window mode
___
switches loaded Flowchart into
foreground window
___
Layout F ull s creen global function
switches the Layout Window
to full screen
Layout Number
Ac tualize Layouts all Visualization
updates the display windows
in all Layout windows
__
modules
One Chart
Y/t, X/Y, C hart
Recorder
switches display mode
to One C hart mode
---
Multiple Charts
Y/t, X/Y, C hart
Recorder
switches display mode
to Multiple Charts mode
---
Fade out Channel
Y/t, X/Y, C hart
Recorder, List
deactivates the display
of one or more channels
list of channels
Fade in Channel
Y/t, X/Y, C hart
Recorder, List
activates the display
of one or more channels
list of channels
Freeze / Actual
Y/t, Chart
Recorder
freezes data in display window or
switches to the actual data display
___
zoom area
Y/t, Chart
Recorder
shifts zoom area to left, right, begin- --ning or end
Select Window
Arrangement
Layout into window global function
Show Flowchart
(shift left/right
global function
gr/sm ...)
Restart Referenc e Y/t, Chart
Curve
Recorder
Display range to ... Chart
Set Title
Restarts the Reference curve used in Reference Curve File
the display module
name
Recorder
Sets the chart recorder X-axis
value in sec. min. or
display range to the defined number hours
Y/t, X/Y, C hart
Recorder
sets new title
for the display window
any text
12-13
ServiceLab
Event Driven Actions
Actions which create Messages or alerts
Action
Receiver
D escription
Parame te r
Mes sage
Message
displays a Message and/or logs it
(printer/file)
any text
clos e/open file
Message
closes or opens the named file (also
global strings are useful)
File name or global
String
Mes sage with
Message
displays a Message and/or logs it
(printer/file).
This message must be acknowledged by the user before it is erased
from the screen.
any text
Ac knowledgement
Play Wave file
Message
plays a wave file
name of wave file
AVI File start
Message
starts the AVI file declared in the
message module
No. of the AVI file
AVI File Pause
Message
AVI File next
Frame
AVI file before
Frame
Send eMail
Send mes sage
via DDE
pauses the replay of the AVI file
-
Message
switch to the next frame
of the AVI file
-
Message
switch to the previous frame
of the AVI file
-
Email
sends an text message via email to
the defined address
--
Message
sends an text message via DDE to
the defined DDE application
Any text or command
string
Actions to set or modify Global Variables / Strings
Action
Re ceiver
Set String
global function
defines a global string
No. ,string (ASCII)
Save String
global function
saves a global string in
SERVICELAB.INI
No. ,string (ASCII)
Load String
global function
loads a global string from
SERVICELAB.INI
Number
Save string into file global function
Read string from
12-14
Parame te r
save a global String into the named INI No.,String (ASCII),
file
Name of INI file (also
String)
global function
reads a global String out from the
named INI file
No.,
Name of INI file (also
String)
global function
reads a range of global strings
No. (from ...to)
file
Read String area
Description
ServiceLab
Chapter 12: Special Modules Group
Write String area
global function
writes a range of global strings
Read String area
global function
reads a range of global strings out of the No. (from ...to), Name of
named INI file
INI-file (also string)
global function
writes a range of global strings into the
named INI file
(file)
Write String area
(file)
No. (from ...to),
value
No. (from ...to), Name of
INI-file (also string),
value
Set Variable
Module: Write Sets all global variables defined in the
Global Variable module
Set Variable
global function
defines a global variable
No., value (ASCII)
Set V ariable
Latc h
defines a global variable out from the
received data
No. of Variable
Set Variable A rea
global function
sets a range of global variables to the
specified value
No. (from ...to), value
Save Variable
global function
saves a global variable in
SERVICELAB.INI
Number
read variable from
global function
reads a global variable out of the named No., Name of INI-file
INI file
(also string)
file
write variable to file global function
saves a global variable into the named
INI file
)
No., Name of INI-file
(also string)
Read Variable
area
global function
reads a range of global variables
No. (from ...to)
global function
writes a range of global variables
No. (from ...to),
value
global function
reads a range of global variables out of
the named INI file
global function
writes a range of global variables into
the named INI file
Write Variable
area
Read Variable
area (file)
Write Variable
area (file)
No. (from ...to), N ame of
INI-file (also string)
No. (from ...to), Name of
IN I-file (also string),
value
Variable + value
global function
adds a numerical value to
a global variable
No., value (ASCII)
Variable * value
global function
multiplies a global variable
by a numerical value
No., value (ASCII)
Load Variable
global function
loads a global variable from
SERVICELAB .INI
___
Actions which affect the program or System
Action
Re ceiver
D escription
Parame te r
12-15
ServiceLab
Event Driven Actions
Stop program
global function
Exit Windows global function(not in
exit ServiceLab
---
exit Windows
---
Windows NT)
global function(not in exit and restarts Windows
Windows NT)
---
dow
Start ex ternal
global function
Name of program incl. path
+ additional commands
Res tart Win-
starts the named program
program
Load Work -
global function
loads another worksheet after stopping the current one
file name of the worksheet
global function
loads and starts another
worksheet
file name of the worksheet
global function
stops the current measurement
-
global function
stops the current measurement and
starts it again
-
global function
creates a new directory
Name and path of the
new directory
sheet
Load and start
work sheet
Stop worksheet
Stop / Res tart
work sheet
Create directory
Lock Sc reen
global function
Screen Locking on
___
Unlock
global function
Screen Locking off
___
Sc reen
Actions to Save or Read data
Action
Re ceiver
D escription
Backup
Write Data
Backs up Data on Hard disk
Parame te r
path
Next file
Write Data
Switches to next multi file in file
sequence
__
Next file
Read Data
Switches to next multi file in file
sequence
__
open/c lose
Write Data
Data file will be opened and
checked
(or created new, if a global String is
used)
file name
(or global String)
Reset
Read Data
Reading of data starts at the beginning of file,
(or a new file is opened, if a global
String is used)
file name
(or global String)
Actions that control data flow
Action
Open Relay
12-16
Re ceiver
Relay
D escription
causes the Relay module to
pass data
Parame te r
___
ServiceLab
Chapter 12: Special Modules Group
Close Relay
Relay
causes the Relay module to
stop data
___
Actions to Print or Copy to Clipboard
Action
Re ceiver
Print Lay out
global function
prints a Layout
Number of Layouts
Print Dis play
Y/t, X/Y, Chart
Recorder, List
prints contents of display window
---
Y/t, X/Y, Chart
Recorder, List
copies contents of display window
to clipboard
---
Window Con-
D escription
Parame ter
tents
To Clipboard
Actions which change the module function type or parameters
Action
Set Value
Re ceiver
Slider
D escription
Parame ter
sets the regulating value to a specific
size
Set Value
Generator
sets, adds or multiplies frequency,
amplitude or offset values
---
Load Bitmap
Status Lamp
loads a Bitmap as
symbol in status display
Name of
Bitmap-File
Change Type
of Filter
FFT Filter
changes type of Filter
identification
digit
Change Type
of Control
Two-Point Control
changes type of Control
identification
digit
Change operating mode
PID Control
changes type of operating mode
identification
digit
Change Type
of Control
PID Control
changes type of control
identification
digit
Reset Control PID Control
resets the parameters
of PID control
identification
digit
Toggle s witch
Switc h
toggles to the other switch position
---
Clos e/open
Scaling
Reference file will be closed and a new
will be opened
file name
(or global String)
Zero point
Scaling
Calculates the Zero Point Offset Adjustment for the scaling module
---
Reset zero
point
Scaling
Resets the Zero Point Offset Adjustment for the scaling module
---
resets the internal value
---
Reset
*)
12-17
ServiceLab
Event Driven Actions
*) with the PID Control, Time Base Arithmetic, Integral, Average, Statistical Values, Counter, Timer, Time Slice modules
Actions which control the I/O interface modules
Action
Re ceiver
D escription
Parame ter
Send Data
Reques t
RS232/IEEEInterface
sends the defined data request commands to the external device
___
Send Start
Commands
RS232/IEEEInterface
sends the defined start commands to
the external device
___
Send String
RS232/IEEEInterface
sends the defined string to the external
device
___
Please refer to the notes in the README file since the features of this module
are under constant development.
For some actions you can specify whether the action should be performed synchronously or asynchronously.
2.2. Message Module
This module is used to display and output messages initiated by
one or several Action modules.
The module does not have any inputs or outputs.
Input and Output Characteristics
Number of Inputs:
Input Block Size:
Number of Outputs:
Output Block Size:
Max. Number of Modules:
--------any
With the Message module you can receive text messages from Action modules
and output those on a Screen, a Printer or write the information into a Log file .
Use Options to activate or deactivate additional global functions.
Manual input for messages opens a text input window. Using this window, text messages can be generated without influencing the measurement
execution speed.
The text can be typed in at the Message to be entered field. After clicking
on the Send switch, the message is sent to the owner module and the message is deleted from the input field.
In the Action module, you can choose between normal text messages and
text messages which must be acknowledged in a message window. With
12-18
ServiceLab
Chapter 12: Special Modules Group
messages which must be acknowledged, a setting window is displayed
for acknowledging the message. Message and acknowledgment are logged
in the log file and on the log printer.
If Deactivate acknowledgment is selected, messages which must be confirmed are not required to be acknowledged any more. Messages are not
logged in the log file if the message to be acknowledged is not confirmed
until the occurrence of the next message.
Use Message output device to determine to which output device the message will be sent. Any combination of output devices is possible.
Click Options to specify settings for the output devices: Message window, Log printer, Log file, DDE Poke/Execute WAV file and AVI File.
2.2.1
Message Window Options
These options influence the appearance and the format of the text to be displayed
by the Message module in the message window.
Use Window options to determine the behavior of the message window
when new messages are coming in.
Windows (starting with version 3.1) differentiates between 2 priorities
for the display of windows: normal windows (which can overlap and
cover each other) and always visible windows (e.g., Windows Clock or
Help windows, if the Always On Top setting is activated).
Window always on top: in any case the message window is always dis-
played on top of all other windows (also on top of dialog boxes, menus,
etc.). Visibility is thus guaranteed.
Open window at message: the message window is displayed on top if a
new message arrives. A minimized message window (icon) will be enlarged.
Use History options to specify the representation of the window.
Display only last message: a new message will always overwrite an existing message. Thus, only the newest message is visible.
Message with history: all incoming messages are stored. You can scroll
within the already received messages.
Empty at message start: at a stop or restart of the message the internal
buffer of the message window is emptied. In the course of a measurement
the buffer contents is preserved.
Use Additional information to select further information which will be
shown with the actual message.
Date and time: the time the message came in will be displayed with the
message.
12-19
Event Driven Actions
ServiceLab
T ime representation: the time the message came in can be output in realtime (current date, current time) or as past time since the start of the
measurement.
Message number: the current number of the recent message is also
logged.
Send module: the name of the module sending the message is also output.
Use Text formatting to select whether additional information in a separate line and whether an empty line should be inserted between the messages.
Use the Font switch to select the font, the font type, the font size and the
color. Use the Color switch to set the color of the background. By default,
the messages are black on a white background.
2.2.2
Log Printer Options
These options influence the appearance and the format of the text to be output by
the Message module on the log printer.
For this function ServiceLab does not use the Windows Print manager nor the default printer selected with the Windows Control panel. The selected log printer
is accessed directly and immediately for outputting a log message. The program
also does not wait until a page is full.
A simple matrix printer or ink jet printer, if applicable, with continuous paper is
probably best suited for this application. Please note that this printer must not
be used for other applications at the same time.
Use Printer options to specify the basic settings for the connected log
printer.
The communication port the log printer is connected to is selected with Interface.
With the settings Lines per page, Lines at top of page and Lines at bottom
of sheet, you can specify the Page format of the log printer. Please refer
to your printer manual for the relevant information.
ServiceLab always prints a message completely on one page. If the lines
of a message do not fit in the remaining space of a page, then the entire
text will be printed on a new page.
Select 72 lines per page for DIN-A4 size page. Select 66 lines per page for the
U.S. 8.5 x 11 format.
With Additional information you can select further information which will
be outputted together with the actual message.
Date and time: the time the message came in will be outputted together
with the message.
12-20
ServiceLab
Chapter 12: Special Modules Group
Time representation: the time the message came in can be outputted in
real-time (current date, current time) or as past time since
the start of the measurement.
Message number: the current number of the recent message is also
logged.
Send module: the name of the module sending the message is also outputted.
With Text formatting you select whether additional information in a separate line and whether an empty line should be inserted between the messages.
Log File Options
These options influence the appearance and the format of the text to be output by
the Message module into the log file.
Use File to specify the name of the log file to be written.
Use file options to specify the behavior of ServiceLab at the start of a
measurement. If Stop if file exists is selected, the measurement will not be
started at all if the selected file exists and a warning message is displayed.
Use Additional information to select additional information which will be
output with the actual message.
Date and time: the time the message came in will be output together with
the message.
Time representation: the time the message came in can be output in realtime (current date, current time) or as past time since the start of the
measurement.
Message number: the current number of the recent message is also
logged.
Send module: the name of the module sending the message is also output.
Use Text formatting to select whether the additional information in a separate line and whether an empty line will be inserted between the messages.
Send String via DDE Poke/Execute Options
The Send string via DDE Poke/execute option allows you to send text messages
from the Message module via DDE to other applications. The strings can contain
simple text such as command strings to be sent to a running application. The allocation of the strings to the events is controlled by an Action module .
DDE Receiver
Name the Application and the target area where you want to send the
string. You must insert the program name in the ''Service'' field and the
12-21
Event Driven Actions
ServiceLab
target area in the "Topic" field. Please also see the program description of
the target Application to determine the correct settings.
You can use two different send modes (Type of connection):
DDE Poke: The message is sent to the defined Name ( Item) of the selected
connection.
DDE Execute: The ''receiver'' application is instructed to process a defined command (in this case the Topic is often SYSTEM). The Item entry
is not available for this setting.
DDE Communication
This setting defines when the connection to the receiver is built.
Connection: Either the DDE connection can be established at the Start of
measurement and held open or it can be re-established for each new message, where the message is sent and the connection is ended. The second
option needs considerably more time for each message, but it provides a
reliable method to verify each time a message is sent (if a Net DDE connection is used), that a stable connection can be sustained.
What happens on communication errors: If there are errors in communications (e.g. break of the Net DDE connection because the target PC is
turned off) three options are available:
(a) The measurement is stopped and an error message is displayed.
(b) The communication link is ended and open again, to be prepared to
send the next message.
(c) Any error will be ignored (if the Open DDE link at Start option is
used, the connection will crash).
Logging Communication Errors:
You can specify that the errors can be logged. Any error messages are
send to the open message window, the log printer or/and the log file of the
same message module. To use this option you must activate the relevant
options in the Message Module. The format settings have to be made in
the corresponding option dialog boxes.
Wave File Options
You can define the wave files which will be played by the Message Module using an installed sound board.
In the Selected WAVE Files window, the wave files can be defined by
number using the File Name button. Up to 20 files are accessible. Link the
wave with specified actions in the Action module.
To define the way ServiceLab replays the wave files in the Option box:
Play default if wave file isn’t accessible.
Stop sound at end of experiment.
12-22
ServiceLab
Chapter 12: Special Modules Group
Play wave file once; don’t start new sound while playing.
Play wave file once; start new wave file immediately on action.
Repeat wave file until new wave file is selected by action.
AVI File Options
You can define the AVI files which should be played by the Message Module.
All AVI files are displayed in the Selected AVI files window, and are defined by number using the File Name button. Up to 20 files are usable.
Links of the AVI with specified actions are made using the Action Module.
You define the way ServiceLab replays the AVI files in the Option box
Scale AVI window: If this switch is not used, the AVI file is displayed in 1:1 format. If it is activated, the AVI picture is stretched
to the border defined in the layout. The following additional setting
is available:
Proportional Scaling: The AVI picture is stretched to the border, but
the original aspect ratio is used.
2.3. EMail Module
Use this module to send an e-mail message controlled.
Input and Output Characteristics
Number of Inputs :
Input Block Size :
Number of Outputs:
Output Block Size :
Max. Number of Modules:
any
The module creates an email message to the defined email recipient and sends it
triggered by an Event Driven Action. We have tried to test with a wide variety of
mail packages.
You can define:
Email address (To:):
Copy recipient (shown/hidden CC/BCC)
Subject
Message
Attachment.
The Setup button opens the windows dialog box to create an email profile.
12-23
Manipulating the Time Base
3.
ServiceLab
Manipulating the Time Base
The Time Base and Signal Adaptation modules are provided to allow you to manipulate the time and block information of a channel. There are applications
where you may need to extract the time information from a channel, or you may
need to change the time and block information of a channel to match another
channel.
3.1. Time Base Module
This Module either extracts time information from a data channel
or from the global acquisition rate and then sends it to the output
as data.
Function types
Since this module provides different basic operations, you must first select the
function type when you install the module.
The Extract Time Base From Data Channel function type provides a module with inputs. Time information is extracted from the data stream of up
to 16 data channels and, for every data value, it is applied as time value
to the corresponding output.
The Generate Global Time Base function type provides a module without
inputs. The time information is derived from the global acquisition rate.
Settings
Format sets the type of the output data per channel.
Measurement Time Since Measurement Start specifies the number of
days which have elapsed since the start of the measurement as related to
the current channel.
Measurement Time Since Measurement Start specifies the number of
seconds which have elapsed since the start of the experiment as related to
the current channel.
X-base in seconds, Hertz or pieces outputs …
… for the first function type, the additional information of the time, of
the frequency or the number of the values for this channel. If, for example, frequency data of a FFT module is involved, the frequency of
a value will be made available at the output.
… for the second function type, the global time information in seconds.
Block Size at Input gives Block Size.
Sample Rate at Input in Hertz gives Sample Rate in Hertz (1/sec.).
Sample Distance at Input in Seconds gives distance in seconds between
single samples.
12-24
ServiceLab
Chapter 12: Special Modules Group
Sample Distance at Input in Seconds gives distance in seconds between
single samples.
Real Time Status (only with function type 2) :
Each data generating module creates a data record if the internal time is
larger than the time according to the last sample of a data block. So if the
worksheet isn’t able to run under real time conditions, the data block is
transmitted after a delay time. This function calculates these delay times.
T ime of Day calculates the number of seconds elapsed since midnight. In
contrast to th other functions the calculated value depends not on the
measurement time but on the system time of the PC.
<new, De 28.05.1998>Pulse each Second, ... Minute, ... Hour, ... at Midnight generates TTL-pulses at the defined time. Only one pulse (one TTL-
High sample) is generated in the output block. This function depends on
the PC clock. For example it can be used to control via event driven action the switching to next file in multifile saving.
In addition the output values can be reset after a specified number of blocks.
This option is only available with X Base setting. If an event-driven action is
used to initiate the reset, the action will be ignored when one of the other
options is chosen.
This module opens up various possibilities for further evaluation and control of
sequences.
Time Base Extracted From Data Channel
This function type of the T ime Base module extracts time information from up to
16 data channels and applies it to the output.
Input and Output Characteristics
Number of Inputs:
Input Block Size:
Number of Outputs:
Output Block Size:
Max. Number of Modules:
3.1.1
up to 16
any
same as input
same as input
any
Generate Global Time Base
This function type of the Time Base module extracts time information from the
global acquisition rate and applies it to the output.
Input and Output Characteristics
Number of Inputs:
Input Block Size:
Number of Outputs:
Output Block Size:
----up to 16
same as global block size
12-25
ServiceLab
Manipulating the Time Base
Max. Number of Modules:
any
3.2. Signal Adaptation Module
This module synchronizes data streams that have different sampling rates, block sizes or starting times .
Input and Output Characteristics
up to 16
Number of Inputs :
Input Block Size :
any
Number of Outputs:
same as number of inputs
Output Block Size :
input block size of the first channel
Max. Number of Modules: any
This module changes parameters like the block size, the sampling rate or the start
time of a signal representation. The first channel (channel 0) is used as a reference. Its parameters are copied to all the other channels (channels 1 to 15).
This module does not perform any calculation of the signal, but it changes its internal representation.
Adapt T ime Only: ServiceLab provides its data blocks with a time stamp
representing the start time of this block. Calculations like addition or multiplication can only be performed on blocks with equal parameters like
the sampling rate, the start time and the block size.
This mode synchronizes the start time only. It is useful if the other parameters are equal and interpolation calculations are to be avoided.
Full Interpolation: Many modules cannot process data blocks acquired at
different sampling rates or block sizes if they have not been synchronized.
The Full Interpolation option synchronizes differing data streams by interpolation; by modifying their block sizes or their sampling rates as much as
necessary for further processing. The first channel (channel 0) is used as
a reference .
Ignore Real Time: With this setting, time info is built with Block Size *
Sampling Rate, also while triggered data are received at input channel.
This function is useful to link triggered data of DAP boards or of triggered channels.
Off: No changes are performed at all. Output data will have the same
representation as input data.
12-26
ServiceLab
Chapter 12: Special Modules Group
12-27
ServiceLab
Chapter 13: Network Module Group
Chapter 13: Network Module Group
DataSocket Input
DataSocket Output
13-1
DataSocket Communication
1.
ServiceLab
Network Modules
This group consists of modules which allow you to transfer data between several.
The network functions are based on the TCP/IP protocol which is not included
in standard Windows or Windows for Workgroups installations. You will need
to install the TCP/IP Stack to use the ServiceLab Network functions.
2.
DataSocket Communication
2.1. Overview
DataSocket, both a technology and a group of tools, facilitates the exchange of
data and information between an application and a number of different data
sources and targets. These sources and targets include files, HTTP/FTP servers,
OLE for Process Control (OPC) servers, and National Instruments DataSocket
servers for publishing live data between applications. Often, these sources and
targets are located on a different computer. You can specify DataSocket sources
and targets (connections) using URLs (uniform resource locators) that adhere to
the familiar URL model.
DataSocket uses an enhanced data format for exchanging measurement data, as
well as the attributes of the data. Data attributes might include information such
as an acquisition rate, test operator name, time stamp, quality of data, and so on.
Although you can use general purpose file I/O functions, TCP/IP functions, and
FTP/HTTP requests to transfer data between different applications, applications
and files, and different computers, you must write a significant amount of program code to do so. DataSocket greatly simplifies this task by providing a unified API for these low-level communication protocols. Transferring data across
computers with DataSocket is as simple as using a browser to read Web pages
on the Internet.
If DataSocket support is selected during the ServiceLab installation, the DataSocket library (cwds.ocx) and its required system files are installed in the
Windows system directory and the DataSocket interface (DSocket.dll) is installed in the ServiceLab directory. By default, the DataSocket Server and Manager are installed in ...\Program Files\National Instruments\DataSocket, and creates a National Instruments DataSocket start menu subdirectory.
For further information see the separate Installation Guide and Help files of the
DataSocket interface by National Instruments.
13-2
ServiceLab
Chapter 13: Network Module Group
2.2. Other Information
The tags in the OPC server that are used by the DataSocket Import module need
to be configured in the OPC server before connecting to them or browsing to
them from the DataSocket Import module.
If the OPC server is properly registered on the computer it will be started automatically when the flow chart is started. This may take a couple of seconds and
you may want to start the OPC server manually to avoid this delay.
The DataSocket Import module does not process OPC data attributes including
quality and time information.
The DataSocket Import and Export modules use the DataSocket technology from
National Instruments to access the OPC servers. The DataSocket software (in
addition to the ServiceLab DataSocket module) needs to be installed for these
modules to work properly. This is normally done by the ServiceLab installation
software if you select the DataSocket option during installation. You can also install DataSocket directly from the ServiceLab CD.
2.3. DataSocket Import Module
This module is used to connect to a data source using a number of
different protocols and read data into the experiment. The DataSoc ket Export module is used to write data to the different data
targets.
This module can read data of up to 16 different data sources and transfer them to
other modules using its signal channels.
For documentation purposes, the module can be provided with a description. The
module name and the channel name are set automatically by ServiceLab. The
user can change these defaults.
Input and Output Characteristics
Number of Inputs:
Input Block Size:
Number of Outputs:
Output Block Size:
Max. Number of Modules:
----up to 16
1 or same as global block size
32 Network modules (all types)
Operation
The DataSocket Import module is able to acquire data from up to 16 different
data sources, including other applications using DataSocket (through the DataSocket server), OPC servers, HTTP/FTP servers and more. The machine name
and item name identifying the data source are configured for each signal channel
individually. You can use multiple DataSocket Import modules on one flowchart
to access more data sources. The data sources (servers) can be located on the
same computer as ServiceLab or on another computer. In a remote application
13-3
DataSocket Communication
ServiceLab
cation using OPC, the OPC server must be properly registered on the local computer using DCOM and the DCOM configuration utility.
The connection to the data source is made when the flowchart with the
DataSocket Import module is started. The connection is closed when the flowchart is stopped. All blocks of data returned from the DataSocket Import module
are provided with the block size and timing information that is necessary to
process data in ServiceLab.
Data Format
The DataSocket Import module can receive data as single values or blocks (one
dimensional array) of numeric data or strings. Reading arrays of strings from the
data source is not supported.
URL Format
A URL is used to specify the data source from which data is read. The URL has
the following format.
protocol://machine_name/item_name
For example,
dstp://localhost/samplenum
The machine_name, and item_name are specified in the dialog window of the
module. When using OPC and if the OPC server is located on the local machine,
the machine name field should be left empty. In this case the double slash is also
not used in the URL.
opc:/server_name/tag_name
The item_name field is used to identify the OPC server and tag name and group,
National
Instruand
has
a
format
such
as
ments.OPCDemo/MotorRPMSensor.
The complete URL in this case would be
opc:/National Instruments.OPCDemo/MotorRPMSensor
Module Settings
Connection
The Type, Machine Name, and Item Name fields are used to specify the
data source from which data is read. The complete URL build from these
values is shown in the URL field
The URL can also be directly entered by selecting Use Custom URL and
entering the URL in the field. Changes in the URL are mapped back to the
component fields according to the URL format. You can use this option to
add optional parameters to the end of the URL.
13-4
ServiceLab
Chapter 13: Network Module Group
You can browse a DataSocket server and select an item from the server
by pressing Select Item. The selected item is copied to the URL field and
parsed to the individual components fields.
Data Source
You need to specify in the DataSocket Import module what type of data will be
supplied by the data source. The three possible types of data are individual (scalar) numeric values, blocks (one dimensional array) of numeric data, and individual strings.
Single Point – the data source supplies one numeric data item. The DataSocket Import module may combine consecutive values into a data
block.
Block Data - the data source supplies a block of data. The data is passed
to the ServiceLab experiment in the same block. You should specify the
maximum or exact block size of the data.
String – the data source supplies a simple string. The string can only be
passed to a global string in ServiceLab. You must specify the global
string number.
Options
The Options button opens a dialog where you can specify more detailed information about the timing behavior of the imported data. Data is returned by the module to the experiment according to these settings.
Return data every
Data Update: The data is passed directly to the ServiceLab experiment
when it is received from the data source, individual data points are returned as block of size one.
N seconds : the data is returned to ServiceLab experiment at the specified
rate. The data source is polled for new data at this rate. This is useful if
you want to reduce the amount of network traffic in an application where
you do not require fast updates in your application.
Global Data Block: This option is only allowed with single point data.
With this option individual data points are collected into blocks of data
matching the global timing settings in your experiment.
Custom Sample Rate
Normally blocks of data returned from the DataSocket Import module are assigned the sample rate set in Experiment Setup . You can specify a custom sample
rate that will be assigned to the imported data blocks. This option is useful if you
know the original sample rate of the incoming data.
Load and Save
The Load and Save buttons are used to store and retrieve the settings of the
DataSocket Import module. The files are stored with the suffix *.DMS
13-5
ServiceLab
DataSocket Communication
2.4. DataSocket Export Module
This module is used to connect to a data target and write data to
the items in the specified target. The DataSocket Import module is
used to read data from a data source.
This module can write to 16 different OPC tags.
For documentation purposes, the module can be provided with a description. The
module name and the channel name are set automatically by ServiceLab. The
user can change these defaults.
Input and Output Characteristics
Number of Inputs:
Input Block Size:
Number of Outputs:
Output Block Size:
Max. Number of Modules:
up to 16
any
same as number of inputs
same as input block size
32 Network modules (all types)
Operation
The DataSocket Export module is able to send data to 16 different data targets,
including other applications using DataSocket (through the DataSocket server),
and OPC servers. The machine name and item name identifying the data target
are configured for each signal channel individually.. You can use multiple DataSocket Export modules on one flowchart to write to more data targets. The data
target (servers) can be located on the same computer as ServiceLab or on
another computer. In a remote application using OPC, the OPC server must be
properly registered on the local computer using DCOM and the DCOM configuration utility. (Other Information)
The connection to the data target is made when the flowchart with the DataSocket
Export module is started. The connection is closed when the flowchart is
stopped.
Data Format
The DataSocket Export module can write data as numeric or Boolean data. Data
blocks with only one value are written as scalar values, data blocks with more
than one value are written as one-dimensional arrays.
URL Format
A URL is used to specify the data target to which data is written. The URL has
the following format.
protocol://machine_name/item_name
For example,
dstp://localhost/samplenum
13-6
ServiceLab
Chapter 13: Network Module Group
The Machine_Name, and Item_Name are specified in the dialog window of the
module. When using OPC and if the OPC server is located on the local machine,
the machine name field should be left empty. In this case the double slash is also
not used in the URL.
opc:/server_name/tag_name
The item_name field is used to identify the OPC server and tag name and group,
National
Instruand
has
a
format
such
as
ments.OPCDemo/MotorRPMSensor.
The complete URL in this case would be
opc:/National Instruments.OPCDemo/MotorRPMSensor
Module Settings
Connection
The Type, Machine Name, and Item Name fields are used to specify the data
source from which data is read. The complete URL build from these values is
shown in the URL field
The URL can also be directly entered by selecting Use Custom URL and entering
the URL in the field. Changes in the URL are mapped back to the component
fields according to the URL format. You can use this option to add optional parameters to the end of the URL.
You can browse a DataSocket server and select an item from the server by
pressing Select Item. The selected item is copied to the URL field and parsed to
the individual components fields.
The Type, Machine Name, and Item Name fields are used to specify the data target to which data is written. The complete URL build from these values is shown
in the URL field
Data Type
Data is written to the data target in the specified format. If you select to write
Boolean data from ServiceLab in a numeric format to the data target, each
True value will have a value of 5 and each False value will have a value of 0.
13-7
DataSocket Communication
13-8
ServiceLab
ServiceLab
Alphabetic List of Modules
Alphabetic List of Modules
Icon
Module Name
Group
Page
Action
Special
12-9
Analog Input
Input/ Output
3-6
Analog Meter
Display
9-27
Analog Output
Input/ Output
3-9
Arithmetic
Mathematics
5-2
Average
Data Reduction
11-2
Backup
Files
10-20
Bar Graph
Display
9-32
Bit Operations
Mathematics
5-13
Black Box
Special
12-2
Block Average
Data Reduction
11-6
A
B
15-1
ServiceLab
Alphabetic List of Modules
Icon
Module Name
Group
Page
Block Time
Control
8-39
Channe l Comparator
Mathematics
5-18
Chart
Recorder
Display
9-22
Check Refere nce
Statistics
6-12
Circular Buffe r
Data Reduction
11-13
Coded Switch
Control
8-12
Combi Trigger
Trigger
4-2
Correlation
Signal Analysis
7-3
Counter
Statistics
6-10
Counter Input
Input/ Output
3-12
Cut Block
Data Reduction
11-10
Ne twork
13-3
C
D
DataSocke t Input
15-2
ServiceLab
Icon
Alphabetic List of Modules
Module Name
Group
Page
DataSocke t Output
Ne twork
13-6
Data Window (optional)
Signal Analysis
7-6
DDE Input
Input/ Output
3-15
DDE Output
Input/ Output
3-19
Diffe rentiation/
Integration
Mathematics
5-10
Digital Input
Input/ Output
3-10
Digital Meter
Display
9-30
Digital Output
Input/ Output
3-11
Ele ctric Characteristics
Signal Analysis
7-15
Email
Special
12-23
Export/
Import
Special
12-6
FFT
Signal Analysis
7-11
Filter
Signal Analysis
7-2
E, F
15-3
ServiceLab
Alphabetic List of Modules
Icon
Module Name
Group
Page
Flip Flop
Mathematics
5-18
Formula Interpre ter
Mathematics
5-13
Fre quency Output
Input/Output
3-15
Generator
Control
8-2
Global Variable Read
Control
8-37
Global Variable Write
Control
8-38
Gray Code (optional)
Mathematics
5-22
Harmonic Distortion
Signal Analysis
7-19
Histogram
Statistics
6-7
ICOM Input
Input/ Output
3-45
ICOM Output
Input/ Output
3-49
IEEE-Output
Input/ Output
3-52
IEEE-Input
Input/ Output
3-58
G, H, I
15-4
ServiceLab
Icon
Alphabetic List of Modules
Module Name
Group
Page
IVI Digital Multime ter
Input/ Output
3-67
IVI Function Generator
Input/ Output
3-66
IVI Scope
Input/ Output
3-64
Latch (optional)
Control
8-29
List Display
Display
9-39
Logical Operations
Mathematics
5-12
Merge /Expand
Data Reduction
11-9
Message
Special
12-18
Min/Max
Statistics
6-2
MODBUS Analog Input/Output
Input/Output
3-69
MODBUS Digital Input/Output
Input/Output
3-71
L
M
Multi-Spee d Analog Input Input/Output
3-9
15-5
ServiceLab
Alphabetic List of Modules
Icon
Module Name
Group
Page
ODBC Input
Files
10-22
ODBC Output
Files
10-23
Period Check
Signal Analysis
7-22
PID Control
Control
8-12
Polar/ Cartesian
Signal Analysis
7-15
Position in Signal
Statistics
6-5
Pre/Post Trigger
Trigger
4-3
Pulse Analysis
Statistics
8-12
Read Data
Files
10-2
Refe rence Curve
Mathematics
5-24
Regression
Statistics
6-8
Relay
Trigger
4-7
N, O, P
R
15-6
ServiceLab
Icon
Alphabetic List of Modules
Module Name
Group
Page
Router
Control
8-33
RS232 Input
Input/ Output
3-22
RS232 Output
Input/ Output
3-41
Sample Trigger
Trigger
4-7
Scaling
Mathematics
5-6
Send Email
Special
12-23
Separate
Data Reduction
11-8
Serial Input
Input/ Output
3-22
Serial Output
Input/ Output
3-41
Shift Register
Data Reduction
11-13
Signal Adaptation
Special
12-26
SIMATIC S7 Input
Input/ Output
3-2
Slider
Control
8-10
S
15-7
ServiceLab
Alphabetic List of Modules
Icon
Module Name
Group
Page
Slope Limitation
Mathematics
5-13
Start/Stop Trigger
Trigger
4-6
Statistical Values
Statistics
6-4
Status Lamp
Display
9-36
Stop
Control
8-36
Switch
Control
8-7
Time Base
Special
12-23
Time Delay
Control
8-24
Time Slice
Data Reduction
11-11
Trigger On Demand
Trigger
4-7
Trigonometry
Mathematics
5-5
TTL Pulse Generator
Control
8-35
Two Point Control
Control
8-24
T
15-8
ServiceLab
Icon
Alphabetic List of Modules
Module Name
Group
Page
Write Data
Files
10-7
X/Y Chart
Display
9-8
Y/t Chart
Display
9-4
W, X, Y
15-9
Index
A
Abscissa
Crosscorrelation
7-4
Absolute Value
5-37
Arithmetic
5-3, 5-5
Action
12-9, 12-10
~ Module
Active Channel
2-6, 2-8
Adaptation
12-26
Signal ~ Module
Add Channel
2-6
Addition
5-29
Arithmetic
5-3, 5-4, 5-5
Algorithm
5-26
7-3
Aliasing
Amplification
Analog Input Channels
3-8
Amplitude
~ Correctio n
Data Windo w
7-10
~ Scaling
9-7, 9-8
7-12
~ Spectrum (FFT)
~/Offset Generator
8-4
9-27
Analog
Analog Input
~ Module
3-6
Amplification
3-8
3-8
Channel Information
Analog Meter Module
9-27
Analog Meter:
9-30
Analog Output
~ Module
3-9
7-14
Analysis (FFT)
AND
Logic Operator
5-31
7-2, 7-3
Anti-Aliasing
ArcCosine
5-34
Archiving
10-20
ArcSine
5-33
ArcSine/ArcCosine
5-5
ArcTangent
5-34
5-6
ArcTangent
Arithmetic
~ Module
5-2
5-2
One Operand
Operand and Constant
5-3
5-4
Two Operands
T wo or More Operands
Arithmetic Mean Values
Average Module
ASCII Data Format
Average
~ Module
ax+b
5-4
11-2
10-11
11-2
5-7
B
Backup Data
~ Module
Bar Graph
~ Module
Bartlet
Bessel Filter
Black Box
~ Module Group
Colors
Concepts/Handling
Create
Edit
Export/Import
New
Black Box Levels
Blackman
Blackman-Harris
Block
~ Based
Counter Module
Statistical Values
~ Count (Counter Module)
~ Number
Histogram
~ Size
Data Window
Blo ck Average
~ Module
Block Time
~ Mod ule
Buffer
Serial Module
Butterworth Filter
10-20
9-33
7-7
7-2
12-2
12-4
12-2
12-3
12-3
12-6
12-3
12-4
7-8
7-8
6-11
6-5
6-10
6-8
7-6
11-6
8 -39
3-28
7-2
C
Cartesia n/Polar
~ Mod ule
Cauchy
7 -15
7-8
Channel
~ Information
~ Name
~ Selection
~ Number
Inputs
Active
Add
Inactive
Remove
Selected
Channel Compa rator
~ Module
Channel Selection Bar
Channel Settings
Analog Meter
Chart Recorder
Y/t Chart
Characteristics
Filter ~
Chart Recorder
~ Module
~ Window
Chebyshev Filter
Clipboard, Copy to ~
List Display
Coded Switch Module
Coefficient
Correlation
Cold Junction Compensation
Colors
Black Box
List Display
Complex conjugate
Complex Conjugate
Complex FFT
Components (P ID)
Concept
Black Box
Event Driven Actions
Configuration
Channel Name
F7/F8 Function Keys
Input Channels
Module Description
Module Name
Configure
Module
Module by Keyboard
Conjugate
complex ~
3-8
2-8
2-6
2-7
2-6, 2-8
2-6
2-6, 2-8
2-6
2-7, 2-8
5-18
2-5
9-27
9-23
9-5
7-2
9-22
9-8
7-2
9-13
9-41
8-12
7-4
5-8
12-4
9-42
7-14
7-13
7-13
8-16
12-2
12-8
2-8
2-11
2-7
2-5
2-4
2-2
2-11
7-14
7-13
Complex ~
Constant
8-3
Generator Wave Form
Operand and ~
5-3
Regression
6-8
Continue
~ Data Display
List Display
9-42
Control
8-1
~ Module Group
Conventions
1-3
Coordinates
Polar/Cartesia n
~ Module
7 -15
Copy Inputs to Outputs 2-11, 9-5, 9-23, 9-27, 9-30,
9-33, 9-37 , 9-39, 10-9
Copy P arameters
2-11
Copy to Clipboard
9-13
List Display
9-41
Correlation
~ Mod ule
7-3
7-4
Coefficient
Cosine
5-32
Hyperbolic
5-6
7-7
P ower of ~ Data Window
Cosine/Sine
5-5
Counter
~ Mod ule
6-10 , 6-12, 6 -13
Counter Input
~ Module
3-13
Create
Black Box
12-3
7-14
Cross Spectrum
Crosscorrelation
7-4
Correlation
Custom Mathematics
5-26
11-10 , 11-13
Cut Block
Cut Out
11-10 , 11-13
~ Module
Cut-off Frequency
7-3
D
DADiSP Data Format
Damping
DASYTEC
Data Fo rmat
Data Acquisition Hardware
Analog Input
Analog Output
Counter Input
10-17
7-3
1 0-1 8
3-6
3-9
3-13
Digital Input
3-10
Digital Output
3-11
Data Format
ASCII
10-11
DADiSP
10-17
DASYTEC
10-18
DIA/DAGO
10-17
Famos
10-17
10-14
FLEX 4
IEEE 32 Bit
10-16
IEEE488 ~ Module
3-58
Remus
10-17
Signalys
10-17
Data Reduction
11-1
~ Module Group
Data Request Command
Serial Module
3-24
Data Storage Module
Flexpro
10-22 , 10-23
Data Trigg er
~ Trigger Module
4-6 , 4-7
Data Window
~ Module
7-6
7-9
~ Specifications
~ Types
7-7
Amplitude Correction
7-10
Bartlet
7-7
7-8
Blackman
Blackman-Harris
7-8
Cauchy
7-8
7-8
Gauss
Hamming
7-7
7-7
Hanning
Hanning-Poisson
7-8
7-8
Poisson
Power of Cosine
7-7
7-7
Rectangle
Tukey
7-8
Vector Size
7-10
dB Transform
7-13
FFT
DDE
~ Input Module
3-15, 3-16
3-19
~ Output Module
Decimal Logarithm
5-37
Delete
Module
2-2, 2-4
by Keyboard
2-11
Demultiplex
11-9
Description
Module ~
2-5
Deviation (Statistics)
DIA/DAGO Data Format
Difference
Arithmetic
Differentiation
~ Mod ule
Digital Input
~ Module
Digital Meter
~ Module
Digital Output
~ Module
Display
~ Module Group
Display Window
Analog Meter
Chart Recorder
Digital Meter
Edit
X/Y Chart
Y/t Chart
Display Y Unit
List Display
Division
Arithmetic
Dynamic Data Exchange
6-5
10-17
5-3
5 -10
3-10
9-30
3-11
9-1
9-30
9-8
9-33
9-17
9-8
9-8
9-42
9-42
5-29
5-3, 5-4
see DDE
E
Edges
Counter Module
Edit
Black Box
Display Window
Electric Characteristics
~ Mod ule
Equivalence
Arithmetic
Error messages
Formula Interpreter
Euler
Exponential Function
Event Driven Actions
Action Module
Asynchronous
Concept
Events
Synchronous
EXCLUSIVE OR
Logic Operator
exp (x)
6-10
12-3
9-17
7 -15
5-3
5-38
5-37
12-9
12-8
12-8
12-10
12-8
5-31
5-3
Exponential
Arithmetic
Exponential Function (Euler)
Export (Black Box)
Extended Cursor
Extract Bit
Arithmetic
5-3, 5-4
5-37
12-6
9-14
5-3
F
F7/F8
2-11
Famos Data Format
10-17
Fast Fourier Transform
see FFT
FFT
~ Module
7-10
dB Transform
7-13
7-11
Operations
Window module & ~
7-6
Files
~ Module Group
10-1
10-10
Write Multiple ~
Filter
~ Module
7-2
Characteristics
7-2
Cut-off Frequency
7-3
Order
7-3
Types
7-3
Highpass
Lowpass
7-2
7-2
Flatness
FLEX 4 Data Format
10-14
Flexpro Data Storag e
~ Module
10-22 , 10-23
Flow Chart
see Worksheet
Font Style
9-10
List Display
9-42
Format
see File ~s
Formula Interpreter Module
5-26
Fourier
7-14
Analysis
Spectrum
7-12
7-14
Synthesis
7-11
Theorem
FP M
5-28
fraction part
5-36
Freeze
9-14, 9-42
Frequency
7-11
~ Components (FFT)
Counter Input
3-14
Cut-off ~ Filter
7-3
8-3
Generator
Function Bar
List Display
Function Keys
9-10
9-42
2-11
G
Gauss
7-8
Generator
~ Mod ule
8-3
Amplitude Modulation
8-6
~ Module
Amplitude/Offset
8-4
8-3
Frequency
Frequency and Amplitude Modulation
8-7
~ Module
Frequency Modulation
8-6
~ Module
No Modulation
~ Module
8-5
8-4
P hase Shift
8-2 , 8-4
Real Time Output
Wave Forms
8-3
Global Settings
9-27
Analog Meter
Chart Recorder
9-22
9-4
Y/t Chart
Global Strings
Start-Up Dialog
1-6
Global Variable Rea d
~ Mod ule
8 -37
Global Variable Write
~ Mod ule
8 -38
Global Variables
Start-Up Dialog
1-6
Greater Than
5-29
Greater Than or Equal
5-30
Grid
9-10
H
Hamming
Hanning
Hanning-Poisson
Hardware Settings
Serial Module
Harmonic Distortio n
~ Module
Harmonic Functions (FFT)
Header
Hide
Setup
Show
7-7
7-7
7-8
3-28
7-1 9
7-11
9-11
9-11
9-11
Hide Header (Display ~)
Hide Legend (Display ~)
Highpass Filter
Histogram
~ Module
Normalization
Number of Blocks
Range
Horizontal Cursor
Hyperbolic
Cosine
Sine
Sine
Tangent
Hyperbolic Cosine
Hyperbolic Sine
Hyperbolic Tangent
Hysteresis
Pre/Post Trigger
9-11
9-11
7-3
6-7
6-8
6-8
6-7
9-14
5-6
5-6
5-6
5-6
5-35
5-35
5-35
4-5
I
ICOM Interface
~ Module
3 -4 6 , 3-50
ICOM Module
3-29
Monitor
IEEE 32 Bit Data Format
10-16
IEEE488
INES
~ Module
3-54
IOtech
~ Module
3-55
National Instruments Interface
~ Module
3-56
IEEE488 Data Format
~ Module
3-58
IEEE488 Interface
~ Module
3-53, 3-56, 3-59
Import (Black Box)
12-7
Inactive Channel
2-6, 2-8
INES IEEE488 Interface
~ Module
3-54
Information
3-8
Analog Input Channel
Input
2-7
~ Channel Selection
~ Range
3-8
Modules
Analog ~
3-6
Counter ~
3-13
DDE ~
3-15, 3-16
3-10
Digital ~
ICOM Interface3-4 6 , 3-50
IEEE488
INES Interface
3-54
National Instruments3-56
IEEE488 Interface3-53, 3-59
IEEE488 IOtech
3-55
RS232 Interface 3-23, 3-42
Serial Interface 3-23, 3-42
SIMATIC S7 ~
3-2
TCP /IP Interface3-46 , 3 -50
Input Range
3-8
Input/Output
~ Module Group
3-1
Channel Number
2-6
Install
Module
2-2
Instrument
9-27
Analog Meter
9-33
Bar Graph
Chart Recorder
9-22
9-30
Digital Meter
X/Y Chart
9-18
9-4
Y/t Chart
Integ ration
~ Mod ule
5 -10
Interface
ICOM ~ Module
3-46 , 3-5 0
IEEE488
INES ~ Module
3-54
IOtech ~ Module
3-55
National Instruments ~ Module356
IEEE488 ~ Module
3-53, 3-59
RS232 ~ Module
3-23, 3-42
Serial ~ Module
3-23, 3-42
TCP/IP ~ Mo dule 3-46 , 3-5 0
Interpolation
5-8
Scaling Module
Inverse (Arithmetic)
5-3
IOtech
IEEE488 Interface
~ Module
3-55
IVI Digital Multimeter
~ Module
3 -69
IVI function Generator
~ Module
3 -67
IVI Scope
~ Module
3 -65
J
Junction Points
Thermocouple Linearization
5-8
L
Lamp
see Status Display Module
Last Value
Analog Meter
9-28
Digital Meter
9-31
Latch
~ Module
8-29
Latch ~ Generator
8-29
Leakage Effect
7-6
Data Window
FFT Module
7-12
LED
see Status Display Module
Legend
Hide
9-11
Setup
9-11
Show
9-11
Less Than
5-30
Less Than or Equal
5-30
Levels
12-4
Black Box
lg (x)
5-3
Limitation
PID
8-16
Linear
~ Regression
6-8
~ Scaling
5-7
Linearization
5-8
Thermocouple ~
List Display
9-39
~ Module
5-3
ln (x)
Load
see Open
Lobe
7-6
Data Window
7-12
FFT
log (x)
5-3
Logarithm
Arithmetic
5-3
Base 10
5-37
Decimal
5-37
Natural
5-37
Logical AND
5-31
Arithmetic
5-5
Logical EXCLUSIVE OR
5-31
Logical Negation
5-31
Logica l Operations
~ Mod ule
Logical OR
Arithmetic
Lowpass Filter
5 -1 2 , 5 -13
5-31
5-5
7-2
M
Mathematics
~ Module Group
Custom
Max Position
Statistics
Maximum
Analog Meter
Arithmetic
Digital Meter
Histogram
Statistics
Mean Value
Analog Meter
Digital Meter
Mean Values
Arithmetic
Average Module
Statistics
Merge/Expand
~ Module
Min Position
Statistics
Minimum
Analog Meter
Arithmetic
Digital Meter
Statistics
MODBUS Analog I/O
~ Module
MODBUS Digital I/O
~ Module
Module
~ Basics
~ Description
~ Menu Commands
~ Name
Action
Events
Analog Input
Analog Meter
Analog Output
Arithmetic
Average
5-1
5-26
6-4
9-28
5-5
9-31
6-8
6-4
9-28
9-31
5-5
11-2
6-4
11-9
6-4
9-28
5-5
9-31
6-4
3 -70
3 -73
2-1
2-5
2-1
2-4
12-9
12-10
3-6
9-27
3-9
5-2
11-2
Backup Data
10-20
Bar Graph
9-33
Block Averag e
11-6
Block Time
8-39
Cha nnel Comparator
5-18
Channel Selection Bar
2-5
9-22
Chart Recorder
Coded Switch
8-12
Correlation
7-3
Counter
6 -1 0 , 6-12, 6-13
Counter Input
3-13
11-10, 11-13
Cut Out
Data Wind ow
7-6
DDE Input
3-15, 3-16
3-19
DDE Output
Differentiation/Integration 5-10
Digital Input
3-10
9-30
Digital Meter
Digital Output
3-11
Electric Characteristics
7-15
Export/Import (Black Box)
12-6
FFT
7-10
Filter
7-2
Flexpro Data Sto rage10-22 , 1 0-2 3
Formula Interpreter
5-26
Gen erator
8-3
Amplitude Modulation 8-6
Frequency and Amplitude
8-7
Modulation
Frequency Modulation 8-6
No Modulation
8-5
Global Variable Read
8-37
Global Variable Write
8-38
Harmo nic Distortion
7-19
Histogram
6-7
ICOM Interface
3 -4 6 , 3-50
IEEE488
3-54, 3-55
IEEE488
3-56
IEEE488 Interface
3-53, 3-59
install/configure/etc.
2-2
IVI Dig ital Multimeter
3-69
IVI Function Generatorr 3-67
IVI Sco per
3-65
Latch
8-29
9-39
List Display
Logical Operations 5-12 , 5-13
Merg e/Expand
11-9
MODBUS Analog I/O
3-70
MODBUS Digital I/O
3-73
New Black Box
12-3
Period Check
7-22
PID Control
8 -14
Polar/Cartesia n Coordinates 7 -1 5
Position in Signa l
6-5
Pre/Post Trig ger
4-3
10-2
Read Data
Regression
6-8
Rela y
4-9 , 4 -11
RS232 Interface
3-23, 3-42
Scaling/Interpolation
5-6
Separate
11-8
Serial Interface
3-23, 3-42
11-13
Shift Register
Signal Adaptation
12-26
Signal Ro uter
8-3 3
SIMATIC S7 Input
3-2
S lider
8 -10
Sort Channels
6 -13
Sta rt/Stop Trig ger
4-6 , 4-7
Sta tistical Va lues
6-4
9-36
Status Display
S to p
8 -36
S witch
8-8
TCP/IP Interface
3-46 , 3-5 0
T ime Delay
8-24, 8-29
11-11
T ime Slice
Trigonometry
5-5
T TL P ulse Generator
8-35
10-7
Write Data
X/Y Chart
9-18
Y/t Chart
9-4
Module Bar
12-3
Black Box
Module Configuration
Channel Number
2-6
Module Groups
12-2
Black Box
8-1
Control
Data Reduction
11-1
9-1
Display
Files
10-1
Input/Output
3-1
5-1
Mathematics
6-1
Statistics
T rigger Functions
4-1
Module Replace
1-6
Modules
Configuration
Copy Inputs to Outputs 2-11
Multiple function Types
2-10
Monitor
3-29
ICOM Module
Serial Module
3-29
Move
Module
MPI Address
Multiple Files
Multiplex
Multiplication
Arithmetic
2-2
3-5
10-10
11-9
5-29
5-3, 5-4, 5-5
N
Name
2-8
Channel ~
Module ~
2-4
Natural Logarithm
5-37
New
Black Box
12-3
Noise
8-3
Generator Wave Form
NOP
Arithmetic
5-3, 5-4
Normalization
Histogram
6-8
NOT
Logical Operator
5-31
Number of Blocks
Histogram
6-8
Numerical Display
see List Display
7-3
Nyquist
O
Offset
Generator
Hamming Window
Linear Scaling
Open
Read Data Module
Operand
~ and Constant
One ~
Two ~s
Two or More ~s
Operations
dB Transform
FFT ~
Log ical ~
Options
Serial Module
OR
Logic Operator
Order (Filter)
8-4
7-7
5-7
10-2
5-3
5-2
5-4
5-4
7-13
7-11
5-12 , 5-13
3-26
5-31
7-3
Order of Operations
Formula Module
Output
Channel Number
Modules
Analog ~
DDE ~
Digital ~
Oversampling (FFT)
Overshooting
5-27
2-6
3-9
3-19
3-11
7-11
7-2
P
Parameter
7-9
Data Window
Module
2-2
Period Check
~ Module
7-2 2
Phase
~ Shift
7-3
Filter Order
Generator
8-4
~ Spectrum (FFT)
7-12
PID
~ Mod ule
8 -14
8-16
Components
Control Limitation
8-16
Pointer Instrument
see Analog Meter
7-8
Poisson
Polar/Cartesian
~ Mod ule
7 -15
Poles
7-3
Filter Order
Position in Signal
~ Mod ule
6-5
Power
~ of Cosine
7-7
Data Window
Pre/Po st Trigger
~ Mod ule
4-3
4-5
Hysteresis
Range
4-4
Print
List Display
9-41
3-5
PROFIBUS Address
Pulse
8-3
Generator Wave Form
T TL ~ Generator
8-35
Q
Quadratic Mean Values
Average Module
Quit
11-3
see Exit
R
Rack Number
3-6
Raise to a P ower
5-30
Random
5-37
Range
Histogram
6-7
Input ~
3-8
Pre/Post Trigger
4-4
Start/Stop Trigger
4-6
Read
see Open
10-2
~ Data Module
Read Global Variable
8-37
7-12
Real FFT
Real Time Output
8-2, 8-4
~ Generator
Reciprocal (Arithmetic)
5-3
Recorder
see Chart Recorder
Rectangle
Data Window
7-7
8-3
Generator Wave Form
Reduction
11-1
Data ~ Module Group
Regression
~ Module
6-8
Relay
~ Module
4 -9 , 4-11
Remainder
Arithmetic
5-3
Remove
Channel
2-6
Remus Data Format
10-17
Replace Module
1-6
7-2
Ripple
RMS Value
Analog Meter
9-28
Digital Meter
9-31
Statistics
6-5
Rounding
Formula Interpreter Function 5-36
RS232 Interfacesee Serial Interface Module
~ Module
3-23, 3-42
Running
Average Module
11-2
Block Average Module
11-7
Counter Input
3-14
Counter Module
6-11
Statistical Values
6-5
S
Samples
Counter Module
6-10
Save
Backup Data Module
10-20
10-7
Write Data Module
Saw tooth
8-3
Generator Wave Form
Sca ling
~ Mod ule
5-6
Amplitude
9-7, 9-8
5-8
Interpolation
5-7
Linear ~ Module
T hermocouple Linearization 5-8
T ime ~
9-24
Chart Recorder
Scope
9-4
Select
Module by Keyboard
2-11
Selected Channel
2-7, 2-8
Selection Bars
Channel Number
2-6
2-7
Input Channels
Separate
11-8
~ Module
Serial Interface
~ Module
3-23, 3-42
Serial Module
Buffer
3-28
Data Request Command
3-24
Hardware Settings
3-28
3-29
Monitor
Options
3-26
Setup Header (Display ~)
9-11
Setup Legend (Display ~)
9-11
Shannon
7-11
FFT Module
Generator Frequency
8-4
Shift Register
11-13
~ Module
Show Header (Display ~)
9-11
Show Legend (Display ~)
9-11
Sign Function
5-38
Signal Adaptation
12-26
~ Module
Signal Generator
see Generator
Signal Router
~ Module
8-3 3
Signalys Data Format
10-17
SIMAT IC S7
~ Memory area in PLC
3-3
~ MPI/PROFIBUS Address 3-5
~ Setting up the interface
3-5
~ Variable type
3-3
SIMATIC S7 Input
~ Module
3-2
Sine
5-32
8-3
Generator Wave Form
Hyperbolic
5-6
Sine/Cosine
5-5
Single
Counter Input
3-14
Slider
~ Module
8-10
Slot Number
3-5
Snapshot
9-14, 9-42
Sort Channels
~ Module
6-13
Spectrum
7-11
FFT
Square
5-36
Arithmetic
5-3
8-3
Generator Wave Form
Square Root
5-35
Arithmetic
5-3
Standard Deviation (Statistics)
6-5
Start/Stop Trigg er
~ Module
4-6 , 4-7
Range
4-6
Start-Up Dialog
Strings and Variables
1-6
Statistica l Values
~ Module
6-4
Statistics
6-1
~ Module Group
Status Display
9-36
~ Module
Steepness
7-2
7-2
Step Response
Stop
~ Module
8-36
~ Trigger Module
4-6 , 4-7
9-22
Strip Chart
Subtraction
5-29
Arithmetic
5-3, 5-4
Sum
~ (x) (Arithmetic)
5-3
6-8
Histogram
Summing
Average Module
11-3
Switch
~ Mod ule
Syntax
Formula Interpreter
Synthesis (FFT)
8-8
5-28
7-14
T
Tan
Hyperbolic
5-6
Tangent
5-33
5-5
Tangent
TCP/IP
13-2
TCP/IP Interface
~ Module
3-46 , 3-5 0
5-8
Thermocouple
Time
~ Delay
~ Module
8-24, 8-29
~ Scale
9-24
Chart Recorder
~ Shift
7-4
Crosscorrelation
~ Slice Module
11-11
12-26
Adaptation
Timer
see TT L Pulse Module
Triangle
8-3
Generator Wave Form
Trigger
~ Module Group
4-1
Da ta
~ Module
4-6 , 4-7
Pre/Post ~ Modu le
4-3
Sta rt/Stop ~ Module
4-6 , 4-7
Trigonometry
~ Mod ule
5-5
ArcCosine
5-5, 5-34
ArcSine
5-5, 5-33
ArcT angent
5-6, 5-34
Co sine
5-5 , 5-32
Hyperbolic Cosine
5-35
Hyperbolic Functions
5-6
Hyperbolic Sine
5-35
Hyperbolic Tangent
5-35
Sine
5-5, 5-32
T angent
5-5, 5-33
Truncate Fraction Part
5-36
TTL Pulse Generator
~ Module
8-35
7-8
Tukey
Tutorial
see Instruction
U
Unfreeze
List Display
Unit (Display ~)
List Display
9-42
9-42
9-42
V
Variance (Statistics)
Vecto r
~ Size
Data Windo w
Window ~ (FFT)
6-5
7-10
7-12
W
Waterfall Display
Wave Forms
Generator
Window
9-11
8-3
see Data Window
With Output Channels
Write Data
~ Module
Multiple Files
Write Globa l Variab le
2-11
10-7
10-10
8 -38
X
X/Y Chart
~ Module
~ Window
9-18
9-8
Y
Y/t Chart
~ and Histogram
~ Module
~ Window
6-7
9-4
9-8
Notes: