1
Loughborough University
Institutional Repository
Usability problem reports for
comparative studies:
consistency and
inspectability
This item was submitted to Loughborough University's Institutional Repository
by the/an author.
VERMEEREN, A.P.O.S. ... et al, 2008. Usability problem reports
for comparative studies: consistency and inspectability. Human-Computer Interaction, 23 (4), pp. 329-380.
Citation:
Additional Information:
• This article was published in the journal, Human-Computer Interacc Taylor & Francis] and the denitive version is available at:
tion [
http://dx.doi.org/10.1080/07370020802536396
Metadata Record:
Version:
https://dspace.lboro.ac.uk/2134/4252
Accepted for publication
Publisher:
c Taylor & Francis
Please cite the published version.
This item was submitted to Loughborough’s Institutional Repository
(https://dspace.lboro.ac.uk/) by the author and is made available under the
following Creative Commons Licence conditions.
For the full text of this licence, please go to:
http://creativecommons.org/licenses/by-nc-nd/2.5/
1
Usability problem reports for
comparative studies: consistency
and inspectability
Arnold P.O.S. Vermeeren, Jelle Attema, Evren Akar,
Huib de Ridder and Andrea J. van Doorn
Delft University of Technology, The Netherlands
Çiğdem Erbuğ and Ali E. Berkman
Middle East Technical University, Turkey
Martin C. Maguire
Loughborough University, United Kingdom
ABSTRACT
The present study explores issues of consistency and inspectability in
usability test data analysis processes and reports. Problem reports resulting
from usability tests performed by three professional usability labs in three
different countries are compared. Each of the labs conducted a usability test
on the same product, applying an agreed test protocol that was collaboratively
developed by the labs. Each lab first analyzed their own findings as they
always do in their regular professional practice. A few weeks later, they again
analyzed their findings but then everyone applied the same method
(SlimDEVAN: a simplified version of DEVAN, a method developed for
facilitating comparison of findings from usability tests in an academic setting).
It was found that levels of agreement between labs did not improve when they
all used SlimDEVAN there was inherent subjectivity in their analyses. It was
found that consistency of single analysts in analyzing their data can be
improved by using a method like SlimDEVAN. Such methods can also help in
making the analysis process and findings more inspectable. Inspectability is
helpful in comparative studies based on identified usability problems because
it allows for the traceability of findings to original observations, as well as for
laying bare the subjective parts of the data analysis.
2
1. INTRODUCTION
1.1 Consistency of individual analysts (reliability)
1.2 Consistency of findings across multiple analysts (subjectivity)
1.3 Aim of the study
2. CASE STUDY
2.1 Usability tests on an advanced oven interface
The laboratories
The product
Sessions and task scenarios
Participants
2.2 The labs' data analysis procedures
Lab A
Lab B
Lab C
3. THE REFERENCE ANALYSES
3.1 Description of SlimDEVAN
3.2 How the labs learned to use SlimDEVAN
3.3 The labs' Slim DEVAN analyses
Lab A
Lab B
Lab C
4. COMPARING THE REPORTS
4.1 Making the reported findings comparable
Procedure and resulting material
Findings on consistency and inspectability
4.2 The comparisons
Comparing problems reported in a lab's subsequent
analyses
Comparing the reported problems across the three labs
5. DISCUSSION AND CONCLUSION
5.1 Inspectability
5.2 Consistency
Across-analyst consistency (subjectivity)
Within-analyst consistency
5.3 Follow-up study on causes of (in)consistency
Conclusions
Implications
3
Arnold Vermeeren is an industrial design engineer with an interest in
usability, user experience and interaction design; he is an Assistant Professor
at the faculty of Industrial Design Engineering of Delft University of
Technology. Huib de Ridder is sdsd s asfsfasf asfsf asfasf asfasfs asfas
asfasfa ags adgag xcvx xcvxcvc xcvc xcvxc xcvxccv xcvxcc xcv xvxcv fsdf
sfsdfsd ssd sgsdgsdg sdsdgsd sgsgsd sdgsdsdg sdgsdg sgd sdgsdg sdgsdsdgsd
sgsdgsdgsdgsdg dsgsdgsdg. Andrea van Doorn is sdsd s asfsfasf asfsf asfasf
asfasfs asfas asfasfa ags adgag xcvx xcvxcvc xcvc xcvxc xcvxccv xcvxcc xcv
xvxcv fsdf sfsdfsd ssd sgsdgsdg sdsdgsd sgsgsd sdgsdsdg sdgsdg sgd sdgsdg
sdgsdsdgsd sgsdgsdgsdgsdg dsgsdgsdg. Jelle Attema is sdsd s asfsfasf asfsf
asfasf asfasfs asfas asfasfa ags adgag xcvx xcvxcvc xcvc xcvxc xcvxccv
xcvxcc xcv xvxcv fsdf sfsdfsd ssd sgsdgsdg sdsdgsd sgsgsd sdgsdsdg sdgsdg
sgd sdgsdg sdgsdsdgsd sgsdgsdgsdgsdg dsgsdgsdg. Evren Akar is sdsd s
asfsfasf asfsf asfasf asfasfs asfas asfasfa ags adgag xcvx xcvxcvc xcvc xcvxc
xcvxccv xcvxcc xcv xvxcv fsdf sfsdfsd ssd sgsdgsdg sdsdgsd sgsgsd sdgsdsdg
sdgsdg sgd sdgsdg sdgsdsdgsd sgsdgsdgsdgsdg dsgsdgsdg. Cigdem Erbug is
sdsd s asfsfasf asfsf asfasf asfasfs asfas asfasfa ags adgag xcvx xcvxcvc xcvc
xcvxc xcvxccv xcvxcc xcv xvxcv fsdf sfsdfsd ssd sgsdgsdg sdsdgsd sgsgsd
sdgsdsdg sdgsdg sgd sdgsdg sdgsdsdgsd sgsdgsdgsdgsdg dsgsdgsdg. Ali
Berkman is sdsd s asfsfasf asfsf asfasf asfasfs asfas asfasfa ags adgag xcvx
xcvxcvc xcvc xcvxc xcvxccv xcvxcc xcv xvxcv fsdf sfsdfsd ssd sgsdgsdg
sdsdgsd sgsgsd sdgsdsdg sdgsdg sgd sdgsdg sdgsdsdgsd sgsdgsdgsdgsdg
dsgsdgsdg. Martin Maguire is sdsd s asfsfasf asfsf asfasf asfasfs asfas
asfasfa ags adgag xcvx xcvxcvc xcvc xcvxc xcvxccv xcvxcc xcv xvxcv fsdf
sfsdfsd ssd sgsdgsdg sdsdgsd sgsgsd sdgsdsdg sdgsdg sgd sdgsdg sdgsdsdgsd
sgsdgsdgsdgsdg dsgsdgsdg.
1. INTRODUCTION
Usability testing often takes place in the context of product development
processes (for software, websites, electronic products, etc.) as a way of getting
feedback on product usability. In some specific cases, findings from multiple
usability tests need to be systematically compared. For example, in academic
settings comparative studies may be conducted to study methodological issues
of user evaluations (e.g., Jacobsen, Hertzum & John, 1998; Vermeeren, 1999;
Cockton, Lavery & Woolrych, 2002; Molich, Ede, Kaasgaard & Karyukin,
2004; Vermeeren, Bekker, van Kesteren & de Ridder, 2007); in other settings
they may be conducted to compare usability of competing designs or design
proposals (e.g., Park and Lim, 1999; Hoenderdos, Vermeeren, Bekker, &
Pierik, 2002) and in international product development settings they may be
4
conducted to determine cultural differences in product use or usability (e.g.,
Daams & Hariandja, 2006, Noiwana & Norcio, 2006).
For being able to properly draw conclusions based on comparisons of
findings from different test conditions, one needs to be reasonably sure that
identified differences in findings can be attributed to differences in conditions,
rather than to for example inconsistencies in data analysis or idiosyncratic
focus or interpretations of an evaluator. Issues like these are often referred to
as issues of reliability and subjectivity (or objectivity) respectively. In the
present study, three labs in three different countries conducted usability tests
on the same product, applying an agreed test protocol and then (independent
from each other) analyzed their data and reported their findings. Based on the
labs’ problem reports, issues of reliability and subjectivity are studied with a
focus on the usability labs’ data analyses and reporting of results. Before
proceeding to the introduction of the case study, the following section will
discuss issues of reliability and subjectivity in more depth.
1.1. Consistency of individual analysts (reliability)
Hartson, Andre & Williges (2001) discuss a number of quality criteria for
Usability Evalution Methods (UEMs) including: thoroughness, validity,
effectiveness, and reliability. They define how to measure thoroughness,
validity and effectiveness based on counting usability problems. However,
they do not precisely define the concept of reliability in terms of how to
calculate it; Hartson, Andre & Williges (2001) define reliability primarily in
terms of evaluator agreement as "… a measure of the consistency of usability
testing results across different users of the UEMs (evaluators)." However, they
also speak about individual reliability, stating that "… In most UEMs, low
individual reliability means high variability among evaluators, which means
that merging results over a group of evaluators will give higher overall
thoroughness." Thus individual reliability seems to refer to evaluations
conducted by one single evaluator; presumably they refer to consistency of
UEM results in cases where an evaluator applies a UEM multiple times on the
same material (i.e., within-evaluator consistency).
In line with Hartson, Andre & Williges’ definition, Guba and Lincoln
(1989) state that (in research starting from a positivistic paradigm) the
establishment of reliability "… typically rests on replication, assuming that
every repetition of the same or equivalent instruments to the same phenomena
will yield similar measurements." However, they also state that in research
based on a naturalistic research paradigm, where by definition measurements
cannot be exactly repeated, the issue of reliability (or dependability, as it is
often referred to in that context) is dealt with mainly by making sure that the
used process is "… an established, trackable, and documentable process," so
5
that outside reviewers "… can explore the process, judge the decisions that
were made, and understand what salient factors in the context led the
evaluator to the decisions and interpretations made (Guba and Lincoln, 1989,
p. 242)."
Kanis (1993) performed an extensive literature study to determine how the
term reliability is used in two important constituent disciplines of human
factors and ergonomics, namely technical sciences and social sciences. As a
result of his inquiry he proposed "… to maintain a clear-cut distinction
between random variation and systematic deviance in outcomes of
measurements" and to use the term reproducibility rather than reliability.
According to Kanis (1993), reliability (or reproducibility) should deal with
random variation, rather than with systematic deviance.
In case of usability test data analyses based on extracting usability
problems, the analyst forms part of the instrument for identifying problems;
after all, ultimately, it is the analyst who judges whether an event is
considered problematic or not. Presumably, analyst judgments are largely
based on individual expertise, experiences, and ability to empathize with
users. In such a context reliability concepts based on ‘repeated measurements’
are problematic as they assume that in the repeated analysis, the analyst has
forgotten everything about the previous analysis, and has not gained any
relevant, additional knowledge or experience affecting his/her perception of
interactions (which will probably never be completely true). For the same
reason it is also questionable to what extent differences in findings from
multiple analyses of a single analyst can be regarded as 'random variation' (cf.
Kanis, 1993). Therefore, in the remainder of this article the term ‘reliability’
will be avoided and the issue will be dealt with mainly in terms of
‘consistency of individual analysts‘.
In this article, consistency of individual analysts will be dealt with by
using the repeated measures approach (within-analyst consistency), but taking
into account Guba and Lincoln’s (1989) advice to use established,
documentable and traceable processes.
1.2 Consistency of findings across multiple analysts
(subjectivity)
According to Guba and Lincoln (1989) objectivity is "…concerned with
assuring that data interpretations and outcomes of inquiries are rooted in
contexts and persons apart from the evaluator and are not simply figments of
the evaluator's imagination." In addition, they state that in a naturalistic
research paradigm one may not assume that methods can prevent the inquirer
6
to (even inadvertently) introduce subjectivity in findings. Instead, assurances
of integrity of findings are rooted in the data themselves. In other words, the
starting point is that (at least some degree of) subjectivity is acknowledged in
data analysis and should be dealt with properly. In Guba and Lincoln's view
this means that both the original data and the processes used to compress these
data should be available to be inspected and confirmed by outside reviewers
of the study. For this they adopt a criterion of confirmability rather than
objectivity. Probably, the term inspectability would be more appropriate, as
the products and processes should be available for inspection (not only for
confirmation, but also for falsification).
Because in usability test data analyses based on extracting usability
problems the analyst forms part of the measurement instrument, Hartson,
Andre & Williges’ (2001) definition of reliability as "… a measure of the
consistency of usability testing results across different users of the UEMs
(evaluators)" (and analyst agreement in general) should be seen as primarily
dealing with issues of subjectivity/objectivity, rather than with reliability
purely. Findings from a number of studies investigating the so-called
evaluator effect seem to confirm this notion. The evaluator effect (e.g.,
Hertzum & Jacobsen, 2001; Vermeeren, van Kesteren & Bekker, 2003; Law
& Hvannberg, 2004) is the effect that if several evaluators analyze the same
video recorded user test sessions there is a considerable lack of overlap in
their findings. The findings from the studies suggest that no matter how
careful, structured and detailed the analysis is, if it involves qualitative
analyses there is a considerable subjective component in it (e.g., see
Vermeeren, van Kesteren & Bekker, 2003). This suggests that, also in case of
user test data analyses, assurances for objectivity cannot be rooted entirely in
the method used and its subjectivity will have to be dealt with somehow.
In the remainder of this article, issues of subjectivity and objectivity will
be dealt with by using measures of analyst agreement as well as by keeping in
mind Guba & Lincoln’s (1989) advice that it should always be possible to
trace back on what data the findings are based and how the data transformed
from primary observations into findings (i.e. findings should be inspectable).
1.3 Aim of the study
Aim of the study presented in this article is to investigate issues of
consistency and inspectability of data analyses and reports from usability tests
based on extracting usability problems. For that purpose usability tests were
conducted by labs in three different countries. They all tested the same
product, applying the same test protocol. Subsequently, each individual lab
analyzed their data and reported about it. After the labs had finished writing
their reports, they were asked to re-analyze their data a few weeks later, now
7
applying (a simplified version of) the DEVAN tool (Vermeeren, den
Bouwmeester, Aasman & de Ridder, 2002); the DEVAN tool was originally
developed for improving an analyst’s consistency in data analysis, for
documenting the analysis procedures and for making findings inspectable (in
order to facilitate recognition of subjectivity in each of the data analysis
stages).
The labs’ reports formed the basis for making various comparisons. The
first step to making comparisons was to compile a ‘complete’ master list of
usability problems from the labs’ reports. As problem formulations in lab
reports were sometimes too ambiguous or incomplete to understand problems
in enough detail for direct comparison, there proved to be a need to track back
reported problems to their original sources. Experiences in trying to do so,
have provided insight into issues of inspectability of the labs’ reported
findings. Based on the master problem list, measures of consistency (withinanalyst consistency, as well as analyst agreement) were calculated.
Inconsistencies in findings were analyzed in more depth by trying to trace
back findings to the original data (inspectability) and identifying possible
causes of differences. Identified causes of differences indicate whether these
are due to issues of inconsistency of individual analysts or of inconsistency
between multiple analysts. Also, those procedures that had been described in
enough detail and those findings that were inspectable enough, indicated at
what stage in the data analysis process inconsistencies (either within
individual analysts or between analysts) occurred.
In the next section, the usability tests conducted by the three labs are
described, along with the analyses they performed and the way they reported
their findings. Subsequently, in section 3, the reference analysis procedure
(the simplified version of the DEVAN procedure) is explained, along with the
labs’ report formats that resulted from applying it. Section 4 discusses the
procedure, experiences and results of comparing the reported findings and
reports the identification of relevant analysis and report characteristics. In
section 5 the results are discussed and implications for data analyses and
usability problem reports in practice are drawn.
2. CASE STUDY
This section introduces the usability tests that the labs conducted. It then
discusses the ways in which the labs analyzed the user test data according to
their usual professional practices and shows examples of the used report
formats.
8
2.1 Usability tests on an advanced oven interface
The laboratories
The laboratories that conducted the user tests were UTEST at the Middle
East Technical University in Ankara (Turkey), the WIT-lab at Delft
University of Technology in the Netherlands, and ESRI at Loughborough
University in the United Kingdom.
At the time of the test, UTEST was a relatively new usability laboratory
within Middle East Technical University. UTEST provides services to
industry and promotes academic studies. The collaboration with industry
consists of both research and consultancy activities embracing military and
consumer products as well as software and electronic appliances. Evaluators
sitting in the control room of the lab can observe users in the test room
through monitors and a one-way mirror. Remote-controlled and portable
digital cameras are used to record user performance and observational
software is used for data analysis. The research team consists of experts
having diverse academic backgrounds.
The WIT-lab (Laboratory for Work and Interaction Technology) is a
laboratory at Delft University of Technology, for both commercial usability
services and for the support of research and educational projects. At the time
of the study it had more than ten years of experience in commercial usability
services. The lab has two test rooms, an evaluation room and a control room.
Staff members have a background in organizational psychology, experimental
psychology and systems engineering.
ESRI (The Ergonomics and Safety Research Institute) is located within
Loughborough University and was formed from two institutes on ergonomics
and human factors (HUSAT and ICE) dating back to the early 1970s. ESRI
provides research, consultancy and teaching in the area of human interaction
with computer systems, products and advanced technology. The ESRI
usability laboratory is fitted with audio-visual equipment for testing product
usability and is split into two areas: a user-work area and an evaluator's
control room from which users can be monitored directly through a one-way
mirror. Remote-controlled and portable video cameras are used to capture the
users' interactions and performance with the product. The camera images are
mixed and stored on tape for analysis. ESRI staff has a background in
ergonomics, computer science and psychology and has more than ten years of
experience in offering usability services in a commercial context.
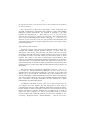
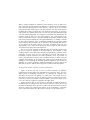
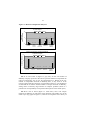
The product
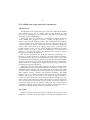
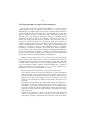
The product that was used as the object of evaluation was a prototype of an
advanced oven interface panel. The interface consisted of a combination of an
9
LCD display with two push buttons and a rotary knob; at all times during
product use, the function of each button is shown on the display. In the test
room a prototype of the complete oven casing was shown, with a non
functioning interface on it. Next to it was a cardboard mockup with a
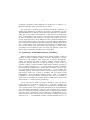
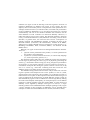
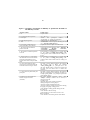
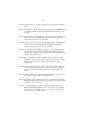
functioning interface on it (see figure 1).
Figure 1. A participant interacting with a mockup of the oven's interface
panel.
Sessions and task scenarios
Test protocols were collaboratively developed by the three labs. Scenarios
were defined prescribing what tasks each participant had to perform with the
control panel; these scenarios covered most of the functionality of the oven
and were phrased as real-life contextual goals to be reached by participants;
for example: "Suppose the test room is the kitchen of a friend of yours. You
enter the kitchen and you see that it is filled with smoke and that the smoke is
coming from the oven. You see that the oven is working…something is
cooking inside. Please go in and try to stop the cooking." and "For some
special dishes the oven knows how it has to be set. Now suppose that you
want to grill a large sized fish. See if the oven knows this recipe and if it does
then start grilling the fish."
After each task scenario, follow-up questions were asked for clarification
of actions with unclear intentions (e.g., "what did you expect would happen
when you pressed that button?" or "what did you think had happened when
you saw that screen appear?"). On average, sessions lasted about one hour.
10
Participants
Sampling of participants was done according to the manufacturer's market
profile. In each of the three countries eight participants took part in the trials
(6 female and 2 male, age varying between 20 and 55 years). All participants
were regular cooks and part of a family of 3 to 5 members. They all had either
recently purchased an oven or had recently considered the possibility of
purchasing one. Other characteristics included: they are full-time or part-time
employees; they are indigenous individuals, they cook for themselves at least
4 times a week; they not always cook ready-made meals; they live in a city or
town environment.
2.2 The labs’ data analysis procedures
For each of the labs, the lab’s data analysis procedure is described below.
Lab A
In lab A two researchers participated in the test. Researcher 1 acted as
facilitator, conducting the test sessions (providing participants with tasks,
helping them if necessary and asking questions). During task performance,
researcher 2 (acting as observer) watched participants performing tasks, took
some notes and sometimes discussed with two student observers what exactly
was happening. After the sessions, researcher 1 (the facilitator) watched the
video recorded task performance sessions and wrote notes about the sessions
in a format as shown in appendix 1. Researcher 2 (the observer) and the two
student observers did not take part in the analysis of the video recorded
sessions.
Lab B
In lab B, two researchers were involved in the test. Researcher 1 (the
observer) manually logged sessions in real time during task performance and
interviews, using dedicated database software. Logs were automatically timestamped and linked to the digital video recordings. Appendix 2 shows an
example log (NB. The logs were not part of the reports that were handed in
and thus could not be used in the comparisons). Researcher 2 acted as
facilitator during the test, but did not take part in the data analysis.
After the sessions, researcher 1 went through the event logs (during the
analysis video recordings were automatically kept synchronized with the log
files) and assigned so called findings to logged events. Findings were then
categorized according to tasks. Subsequently, for each finding a paragraph
discussing the weight of the findings was written, as well as a paragraph
11
providing suggestions for solutions. Weight and suggestions for solutions
were inspired by going through the additional non-finding events in the log
files. Finally, for each finding a number of example events was selected for
inclusion in the report. This resulted in a report format as shown in appendix
3.
Lab C
In lab C, two researchers participated in the test: researcher 1 acted as
facilitator, researcher 2 as observer. During task performance, researcher 2
(with no strong understanding of the product interface) took notes on a printed
version of the task protocol, focusing mainly on timing of tasks, as well as on
key comments and actions of participants. Researcher 1 took notes on a
printed version of the task protocol, using their own defined abbreviations.
The notes from both researchers were discussed amongst them and were then
combined and typed up as a single record of each session.
The data analysis was jointly done by both researchers. Subsequently,
researcher 1 wrote a report based on the combined notes. Video tapes were
now and then used as a reference during the process. Appendix 4 shows
examples of lab C's report.
3. THE REFERENCE ANALYSES
One to two months after the labs had reported their findings, the
videotaped sessions were analyzed again. This time a prescribed, detailed
analysis was performed, using SlimDEVAN (a simplified version of DEVAN;
Vermeeren, den Bouwmeester, Aasman & de Ridder (2002) as a reference to
compare the initial analysis to. Below, SlimDEVAN will first be explained,
followed by a brief description of how the labs got acquainted with it. Then
the labs’ SlimDEVAN analyses will be presented together with the report
formats they resulted in.
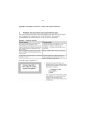
3.1 Description of SlimDEVAN
SlimDEVAN is a checklist-based approach to user test data analysis. It is a
simplified version of the DEVAN technique for video data analysis
(Vermeeren, den Bouwmeester, Aasman & de Ridder, 2002). Main
differences between DEVAN and SlimDEVAN lie in the way in which
overviews of interactions are made. In case of DEVAN, the procedure for
arriving at the overviews as well as the format for the overviews are
prescribed in much detail; in case of SlimDEVAN decisions on these issues
are largely left to the individual analyst, but advice and constraints are given
(see below). Both DEVAN and SlimDEVAN make use of a checklist. The
12
checklist (see figure 2) aids in detecting events that signal the existence of
interaction difficulties by defining such events. In this context, the term
difficulty does not necessarily refer to a complete halt in task performance. For
example, hesitations before (or frustration after) successful task performance
are also regarded as difficulties, as are erroneous actions that are corrected
instantaneously. The use of the checklist stimulates that evaluators use the
same definition of what constitutes an interaction difficulty. Moreover, it
makes the analysis process more explicit. The DEVAN checklist is based on
Lavery, Cockton and Atkinson's (1997) definition of usability problems which
describes, in general terms, the behavioral and outcome consequences of
usability problems. The SlimDEVAN checklist is basically the same as the
DEVAN checklist (Vermeeren, den Bouwmeester, Aasman & de Ridder,
2002) but was slightly adapted based on experiences in other projects (e.g.,
Barendregt and Bekker, 2005; Vermeeren, Bekker, van Kesteren and de
Ridder, 2007).
Basically, two types of observations are distinguished within the checklist.
These are:
• physical actions performed on the product (i.e. actions performed on
the products' control elements);
• expressions: (verbal) utterances from users, as well as body language
(i.e., facial expressions, gestures, etc.).
The checklist assumes that both types of difficulty signals can be found at
several stages of performing an action: (a) prior to physically performing the
action (e.g., user hesitates before acting), (b) during the physical performance
of an action (e.g., mis-pressing a button), (c) directly following an action (e.g.,
exclamation of surprise after seeing the system's reaction to an action) or (d)
later in a session (e.g., when after continuing with other actions the user
suddenly notices a preceding erroneous action and corrects it).
The SlimDEVAN approach works best if the analysis starts from a session
log that specifies time-stamped actions on the product, as well as (verbal,
gestural, facial) user expressions. The procedure is to go through a log file (or
if desired also review parts of video taped sessions) and search for the types of
events as defined in the checklist (the so-called difficulty signals). Codes for
detected difficulty signal events are added to the session logs (thereby making
the events time-stamped). Subsequently, for each participant, a list of difficult
moments is created, preferably with time-stamps added. A single moment of
difficulty can be signaled by multiple event types at a time (i.e., a single
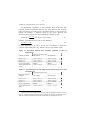
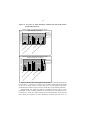
usability problem can be identified based on multiple signaling events). Figure
3 shows examples of how moments of difficulties can be specified (these
examples are taken from the SlimDEVAN user manual (Vermeeren, 2003)).
13
3.2 How the labs learned to use SlimDEVAN
The first time the labs heard about DEVAN was during the first project
meeting with all labs. In that meeting they were told about the existence of
DEVAN and were provided with copies of the article in which the tool was
first introduced (Vermeeren, den Bouwmeester, Aasman & de Ridder, 2002).
At that time, however, DEVAN was not considered feasible for use in the
project, due to its time-consuming nature. At a later stage, after the second
project meeting, the idea of using SlimDEVAN arose.
A brief description of how SlimDEVAN differed from DEVAN was sent
to all partners by email, along with a few paragraphs of information about
what actions would be required from them if they would be willing to use
SlimDEVAN. After the three labs agreed on using SlimDEVAN, a user
manual (Vermeeren, 2003) was written. The user manual included a separate
checklist reference card specifying the SlimDEVAN codes for difficulty
signals. In a third meeting the labs were provided with a copy of the user
manual. In addition, the procedures for using it were orally explained and
questions were answered in order to clarify what the labs could expect while
using it. It was suggested to the labs that they could send part of the results of
the analysis of one participant's task performance to the first author of the
present article (who had not been involved in conducting the tests). In this
way, they would have the opportunity to have their analyses checked for
misunderstanding SlimDEVAN. Lab C made use of this possibility.
14
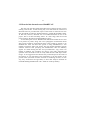
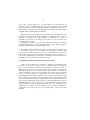
Figure 2. The SlimDEVAN checklist (at the time of the test the word
breakdown was used in the checklist, as a synonym for the word
difficulty in the present article).
Breakdown signals in the form of physical actions performed on the product
(code, short description: definition):
ACT, wrong action: An action does not belong in the correct sequence of actions,
an action is omitted from the sequence, an action within the sequence is replaced by another
action, or actions within the sequence are performed in reversed order
DISC, discontinued action: User points at function as if to start executing it, but then does
not, or user stops executing action, before it is finished.
EXE, execution problem: Execution of action not done correctly or optimally.
REP, repeated action: An action is repeated with exactly the same effect.
CORR, corrective action: An action is corrected with a subsequent action (or sequence of
actions), or an action is undone.
STOP, task stopped: User starts new task, before having successfully finished the current
task.
Breakdown signals in the form of utterances (verbal, sound) or body language (facial
expressions, gestures)
(code, short description: definition):
PER, perception problem: User indicates (in words or behavior) not to be able to hear or
see something clearly.
INTN, wrong goal or intention: User formulates a goal that cannot be achieved with the
product or that does not contribute to achieving the task goal; or user (verbally) specifies an
action that s/he think is needed in order to progress towards the goal, but the specified action
is not correct (indicating wrong user intention).
PUZZ, puzzled (before an action): User indicates (in words or behavior) not to know how
to perform the task or what action is needed for it, or not to be sure whether a specific action
is needed or not.
RAND, random actions: User indicates (in words or behavior): that the current action(s)
are chosen randomly
SEARCH, searching for a function (but not finding it): User indicates (in words or
behavior): not being able to locate a specific function
DIFF, execution difficulty: User indicates (in words or behavior) having physical problems
in executing an action, or that executing the action is difficult or uncomfortable
DSF, doubt, surprise, frustration (after an action): User indicates (in words or behavior)
not to be sure whether an action was executed properly, not to understand an action’s effect,
to be surprised by an action’s effect or that the effect of an action was unsatisfactory or
frustrated the user.
WEX, wrong explanation (after an action): User formulates an explanation for something
that happens, but this explanation is not correct; or user formulates an interpretation for
displayed feedback, but this interpretation is not correct.
REC, recognition of error or of misunderstanding: User indicates (in words or behavior)
to recognize a preceding error, or to understand something previously not understood
QUIT, quits task: User indicates (in words or behavior) to recognize that the current task
was not finished successfully, but continues with a subsequent task; or user indicates (in
words or behavior) that s/he thinks a task was successfully finished and continues with a
subsequent task, (whereas in fact the task was not finished successfully).
15
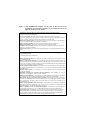
Figure 3. Part of a usability list, as an example format for the evaluators
(at the time of the test the word breakdown was used as a
synonym for the word difficulty).
Time stamp and Free-form breakdown
Inferences about what
signal codes
description
design elements may
have caused the
breakdown to occur.
0:02:40
User wants to change Time
At two places there
style, and clicks at the time
are settings related to
ACT
in the bottom right corner.
time. At only one of
DSF
0:04:20
Apparently, he expects that
those places it is
time style settings can be
possible to change
CORR
found there. He should have Time Style. User
gone to regional settings in
expects it to be where
the control panel.
the clock is, but it isn’t.
0:03:10
User expects to find Time
At two places there
style settings in the Time
are settings related to
INTN
Zone tab of the Date/Time
time. At only one of
ACT
Properties, instead of in the
those places it is
Regional Settings in the
possible to change
Control Panel.
Time Style. User
expects it to be where
the clock is, but it isn’t.
3.3 The labs' SlimDEVAN analyses
Below, each lab's implementation of the SlimDEVAN reference analysis is
described.
Lab A
In case of lab A, two researchers participated in the SlimDEVAN analysis.
These were the same researchers as in the lab specific approach. First, the
researchers together analyzed part of one participant's session that seemed
difficult to analyze and discussed their implementation of SlimDEVAN. In
this way they developed a common understanding about the use of it. Then,
each researcher watched the videos of four participants and took notes using
identical table formats (see appendix 5 for an example). The checklist card
was used as a reference during the analysis. In addition, researcher 2 (the
observer) sometimes compared fragments from different sessions to ensure
better consistency. Also, researcher 2 analyzed one (difficult to understand)
session twice to feel more confident about the findings. Subsequently,
researcher 2 went through all typed up tables of both researchers to check for
16
consistency in assigning codes. This led to only a few changes in the tables of
researcher 2. Finally, for each participant a usability problem list was created.
This was done by researcher 1. Appendix 6 shows an example of the format
used for reporting the problems.
Lab B
In case of lab B, researcher 1 (the observer) did the analysis. The
SlimDEVAN analysis started from the log files made in the lab’s initial
analysis. Appendix 7 shows an example of part of a session log made by lab
B. Appendix 8 shows an example report format1.
The researcher went through all log files on the computer and while going
through them, the video recordings were automatically kept synchronized with
the log files. The dedicated software for logging was modified to allow for
entering SlimDEVAN codes as markers into the log files. An additional
marker called Comment was added for difficulty signals found in the
interviews and for comments from the researcher (e.g., ideas for solutions to
problems). As the video recordings ran along with the log files, it was possible
for the researcher to especially focus on those parts of the video for which no
loggings were made, as well as on parts of the log files for which it was not
clear what exactly had been observed. At several points the original log files
(from the lab specific analysis) proved to be incomplete.
Subsequently, the log files (including the SlimDEVAN codes) were
filtered such that a list of (SlimDEVAN) coded events was created. Findings
were then defined based on the coded events and multiple events could be
linked to a single finding. In the next step of the analysis, the findings were
grouped into categories that emerged during the process itself (e.g.,
consistency, changing parameters during cooking, etc.). Categories in turn
were grouped into chapters. Summaries of the findings reported in a chapter
were made and frequencies of findings were related to variables like
participant, participant characteristics or tasks, to get more insight into those
situations in which problems occurred (in the report this was referred to as
validity). Descriptions of loosely judged problem severity were written as well
as suggestions for solutions. In writing about validity, severity and
suggestions, the researcher especially searched for inspiration by going
through those events that had not resulted in findings.
1
Although log files with SlimDEVAN codes were made for all eight participants,
lab B accidentally reported problems for only six participants.
17
Lab C
In case of lab C, both researchers together watched the tape of one of the
participants and discussed it in relation to the SlimDEVAN checklist.
Researcher 2 then watched the video of that participant again and wrote down
actions and times of actions. Subsequently, researcher 2 watched the video
again to add participant expressions to the action log, as well as to assign
SlimDEVAN codes to events. Researcher 1 followed the same procedure for
the other seven participants. Notes were typed up by each of the researchers in
a format as shown in appendix 9. Finally, researcher 1 used the format as
shown in appendix 10 to create a list of usability problems and indicate which
participants experienced each problem.
4. COMPARING THE REPORTS
In this section, the protocols for making comparisons are presented along
with the results of the comparisons. First, in section 4.1, it will be discussed
how the findings in the labs’ reports were re-formatted into a form that
allowed for making comparisons: across labs, as well as across each lab’s
subsequent analyses. Issues of inspectability of reports as experienced in this
process are discussed. Then, in section 4.2, it is discussed what exact
measures are used for making comparisons.
4.1 Making the reported findings comparable
Procedure and resulting material
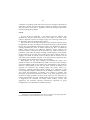
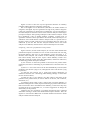
Figure 4 illustrates the process of making the reported findings
comparable. Starting points were the reports with problem descriptions as they
were handed in by the labs (figure 4, blocks at the top). The reports were used
and compared without any further clarification and explanations by the labs.
The comparer (the first author of the present article, who had not been
involved in conducting or analyzing any of the test sessions) read through all
reports and (as much as possible) annotated each moment of difficulty
reported in a problem description with a unique identification number (id).
However, this proved not always to be possible. In some cases, problem
descriptions referred to n unspecified users having experienced the problem,
or contained no reference to any specified user or specified number of users at
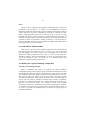
all. Figure 5 specifies the applied decision procedure for assigning ids to
moments of difficulty.
18
Figure 4. Problem descriptions in lab reports (blocks at the top) were reformatted into difficulty records (blocks in the middle). Then
similar moments of difficulty were grouped in order to arrive at
a master list of usability problems (block at the bottom).
19
Figure 5. Decision tree used for assigning difficulty records to reported
difficulties.
if a problem description explicitly referred to a moment in only one specified
user’s interaction (i.e., one moment of difficulty) this was recorded as one
single id (and thus as one single difficulty record), with a reference to
that specific user;
if a problem description referred to moments in all users’ interactions, these
were recorded as individual difficulty records for each individual user (so
in case of a difficulty for all 8 users, this turned into 8 difficulty records);
if a problem description referred to moments in n specified users’ interactions
(where n < the total number of users), the reported difficulties were
recorded as n difficulty records each referring to an individual user;
if a problem description referred to moments in n unspecified users’
interactions (where n < the total number of users), it was recorded as one
single difficulty record, and a reference was made to ‘n users’, without
specifying the users (because they were unknown).
if a problem description referred to moments in a not specified number of
unspecified users' interactions, it was recorded as one single difficulty
record, stating ‘unspecified’ in the database field referring to users.
After ids were linked to the specific problem descriptions, a difficulty
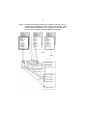
record was created for each id (figure 4, blocks in the middle). Figure 6
provides an overview of attributes of problem descriptions that were used as
fields in the difficulty records. This part of the process resulted in a total of
466 difficulty records.
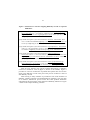
After entering as many attributes as possible for each of the moments of
difficulty, usability problems were defined based on similarity. This was done
in an iterative, data-driven process where the actual problem definitions
emerged from the descriptions of the moments of difficulty themselves. Figure
7 shows some example usability problems.
20
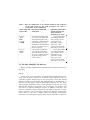
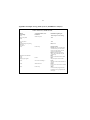
Figure 6. Attributes of moments of difficulty as specified in the fields of
the difficulty records.
Attributes (fields)
1. ID
Possible values
Unique number.
2. Lab that reported the problem
3. Participant
<A>, <B>, <C>
<Name>
and
<participant
number>,
or
<unspecified>, or <number of participants>
<Lab specific> or <SlimDEVAN>
<Task number> and short phrase indicating the task
(e.g., <Stop the cooking process>)
Copied from the labs' reports in unedited form
4. Data analysis approach
5. Task
6. Description of difficulties and
causes assumed by the evaluator
7. The action stage at which the
problem occurred
8. The context in which the problem
occurred.
9. Target context (i.e., screen image
that would have been shown had the
participant performed the correct
action in the context of the provided
task)
10. Action that would have been
correct in the context of the task and
would have led to the target context.
11. Action that was performed by the
participant
12. Relevance to the problem of a
number of high level issues
(variables).
Action stages based on Hartson (2003): <Planning>,
<Translation>,
<Physical>,
<Outcome>,
<Assessment>, <Independent>
Exact reference in grammar-form to a screen image
on the product: Cooking_mode_setting (Tab:
Cooking, Menu: menu where mode for cooking can
be set)
Exact reference in grammar-form to a screen image
on the product: Cooking_mode_setting (Tab:
Cooking, Menu: menu where mode for cooking can
be set)
Specified in loosely defined grammar that indicates
the required steps in detail. For example
<select_cooking_OK> (i.e., participant has to use
the rotary labeled 'select' to select the Cooking tab
and then press the button 'OK' to confirm the
selection).
Specified in loosely defined grammar that indicates
the steps performed by the participant in detail. For
example <press_select> (i.e., participant pressed the
rotary labeled 'select').
For each variable, relevance: <Yes>, <No>,
<Maybe>. Multiple variables can be relevant, at
least one is relevant.
Variables were:
- manually setting some cooking parameters
- making settings for selecting recipes
- actions for naming self-defined recipes
- actions for starting a cooking process, and for editing
or stopping an ongoing cooking process
- issues related to making general settings, like the
clock time etc.
- issues related to defrost settings
- issues related to low-level issues on how to use
buttons and menus
- issues related to the meaning and use of the 'Back'
21
button
Figure 7. Examples of usability problems.
Uses rotary to stop the cooking process
Presses rotary knob to stop the cooking process
Presses rotary knob to select a menu item or set
time
Participant hesitates to select EDIT for
prolonging the cooking time.
Inefficient having to do so many actions for
making settings: composing a name
Setting wintertime should not be done by just
changing the hours and minutes
Inconsistency between menu options with and
without default values
Misunderstanding that BACK in tabs menu
displays main menu showing the clock time.
Participant needs to be able to make longer names
for own recipes.
Moments of difficulty had to be similar in fairly high levels of detail for
considering them to be the same problem. For example, one might argue that
the first three problems mentioned in figure 7 essentially are instances of one
underlying problem, namely a problem with the rotary knob. However,
important in many comparative user studies and in studies conducted in design
contexts are inferences about causes of reported problems. In this example
case, the three mentioned problems led to different explanations of why the
rotary-knob related problems occurred; in case of the first problem,
participants in their attempts to stop the cooking process tried to set a very low
temperature by turning the rotary, whereas in the second case participants
most likely assumed that the cooking process could directly be stopped, by
pressing the rotary knob. These problems refer to two different strategies for
trying to stop the cooking process. As to the second and third problem: they
both start from the same wrong use of the rotary knob (trying to press it,
whilst this was not possible). In case of the second problem this was done with
the aim of trying to immediately stop the cooking process, whereas in case of
the third problem, this was done to select a menu item or to make a menu
setting. Thus, these three problems are likely to have different causes and it is
very likely that in a design context these problems would lead to different
interface revisions. Identifying these three problems as one single problem
might lead to false impressions of agreement similar to those reported by
Hertzum, Jacobsen and Molich (2002). The process described above resulted
in a list of 63 different usability problems (figure 4, block at the bottom).
22
As the choice of the level of abstraction of problems is to some extent
arbitrary and can be expected to influence agreement levels, a second way of
categorizing problems was used as well. This other way of categorizing was
purely based on the higher level issues as specified in the usability problem
attributes (see figure 6, attribute 12). In this higher level categorization,
problems were characterized by combining (mostly pairs of) higher level
issues that were marked as relevant to the reported moment of difficulty. For
example, if a moment of difficulty related to the issues manually setting the
cooking parameters (abbreviated as Cooking) and low-level issues on how to
use buttons and menu (in short Interaction techniques), it would be
categorized as <Cooking>-<Interaction Techniques>. In cases where only one
issue related to the moment of difficulty it was characterized as, for example
<Cooking>-<Only>. In rare cases of more than two issues, all possible
combinations of two marked issues were treated as separate categories. This
resulted in a total of 35 high-level problem category pairs. For most analyses
the (detailed) 63 problems were used. The 35 high-level problem category
pairs were only used for comparing agreement measures.
Findings on consistency and inspectability
The process of creating a master list of usability problems proved to be
hindered by how problem descriptions were structured (inconsistent formats),
by the formulations that were used, as well as by the reports' lack of
inspectability.
Inconsistencies in problem formulations
Sometimes problem descriptions were formulated in behavioral terms of
difficulties encountered by users (e.g. appendix 4: "… users continued
interacting thinking that the oven was still cooking" or "… one user tried to
reduce the temperature… "). In other cases problem descriptions were
formulated in terms of problematic product features; then it was sometimes
unclear whether any of the users actually experienced the problem or what
exact difficulty they had encountered (e.g., appendix 4: "Left hand arrow
indicating that there is a submenu available is not clear"). In yet other cases,
behavioral descriptions of problematic interaction episodes were given, but
the difficulties themselves were not described separately. This sometimes
made it difficult to infer what exactly the researchers thought the difficulty
was or whether they thought that multiple moments of difficulty had occurred
(e.g., appendix 1: "… Pressed rotary knob, turned. Presses ‘stop’ but puzzled
when she saw…(etc.)").
The inconsistencies in problem descriptions hindered the construction of a
master usability problem list. In cases where one of a lab's report described a
23
problem in behavioral terms, and the other described it in terms of a
problematic product feature, it often proved to be difficult to decide whether
the descriptions actually referred to the same moment of difficulty; to be able
to do so a comparer2 has to infer causal relationships between observed
behavior and problematic product features. Similar problems occurred in cases
where problematic interaction episodes were described without separate
descriptions or marking of difficulties. In order to find out to what extent such
a description refers to the same moment of difficulty as other problem
descriptions formulated in terms of an encountered difficulty, a comparer has
to infer what the analyst may have concluded about how many (and how many
types of) difficulties are embedded in the described interaction.
Useful information complementary to difficulty descriptions
The core of the problem descriptions in the labs’ reports (i.e., descriptions
of difficulties and of problematic features) was often provided with
complementary information. Such additional information sometimes proved to
be essential (and often at least very helpful) for a better understanding of the
problem. For example, mentioning the task in which a difficulty occurred
provides context that can help in envisioning the situation in which the
difficulty occurred. Suggestions for interface improvements or inferences
about how design elements may have caused the problems may implicitly
detail difficulty description (e.g., appendix 6: the description of the difficulty
only states "… User presses rotary knob to stop the oven", whereas the
inference about what may have caused the difficulty includes the statement:
"… The rotary knob is the most dominant element among the controls, so that
the user is directed to that without much intention." By stating this, the
researcher implicitly details the difficulty description by suggesting that the
user’s focus of attention may have been at the wrong place.)
Thus, information complementary to the core of the problem description
can be useful to a better understanding of the observed interaction. However,
in a number of cases another problem then showed up. For example, in some
cases suggestions for solutions or inferences about possible causes were not
linked to specific observed difficulties on a one-to-one basis; instead, a group
of inferences about causes were linked to a group of difficulties or reasons of
difficulties. For example, in appendix 3, it is unclear whether the researcher
intended to relate suggestion 3 about users’ preferences for a stop/start button
to one of three mentioned reasons or only to the main problem ("…Users find
2
From now on the person who makes the comparisons between the lab reports will
be referred to as the 'comparer' (for reasons of brevity).
24
the stop-button easily, press the button, but are then confused by the feedback
the oven provides").
Raw descriptions of what users said during or after interactions also
provided complementary information that helped in better understanding
ambiguous problem descriptions. For example in appendix 8: the main
problem was formulated as "… When alarm is set it is not clear if time
indicates time until alarm or indicates the actual time." The comment the user
gives in the second finding at the bottom of the page "… I was not sure if
duration was the total time or the time left" provides extra information that
can be taken into account in trying to interpret the (more or less cryptic, main)
problem formulation.
Inspectability of data analyses
In some lab reports, some of the raw descriptions referred to above were
included and clarified reported problems. However, in many cases raw
descriptions were missing and could only be found in the log overviews
representing observed interactions. In order for that to be of any use, it should
be possible to exactly trace back which raw descriptions relate to which
problem. This relates to the issue of inspectability. Inspectability of data
analyses can sometimes alleviate the problems mentioned above. For example,
if the description of a problematic feature has some kind of reference to a
specific moment that is captured in some representation of an interaction, that
interaction may be re-inspected to find out what observation lies at the basis of
the problem.
The primary reference needed for inspectability always is a reference to
the specific user that encountered the difficulty. In cases where it is not
specified which user encountered a difficulty, it becomes a very tedious and
difficult job to go through all interactions and try and identify the exact
session and moment at which the difficulty occurred. In those cases where this
was tried, it usually ended up with various candidate moments from multiple
users’ interactions. No further information was then available for a better
understanding of problem descriptions.
In addition to references to users, references to tasks also proved to be
very helpful. Not only because the task description in itself helps in
envisioning the context in which a difficulty might have occurred (see before),
but also because it makes it possible to search in a more focused way for the
specific interaction in which a difficulty has (or might have) occurred. In
many cases such a reference to a task is not needed, because it is almost
obvious in which task a difficulty must have occurred (e.g. appendix 4: it is
very likely – though not certain – that the difficulty "… after the user presses
25
Stop, there is no feedback that the oven has stopped cooking" refers to the task
in which the user is asked to stop the cooking process). However, in some
cases this is less clear (e.g., appendix 4: the problem left hand arrow
indicating that there is a submenu available is not clear could have occurred
in many tasks). In general, information about the task in which a difficulty
occurred helped in finding back interaction episodes when overviews of
interactions were available. Again, this was helpful because in such overviews
complementary information could be found that helped in understanding the
problem (e.g., verbal utterances of users, or for example, sequences of actions
that helped re-constructing what the state of the product must have been at the
time when the problem occurred).
4.2 The comparisons
The previous section described how problem descriptions were made
comparable. This was done by first re-formatting them into uniformly
structured difficulty records and by then constructing a master list of usability
problems. This process of making findings comparable allowed for the
comparisons that are described in the following section.
First, in section 4.2.1, comparisons between (findings from) the labs’
initial and reference analyses will be discussed. Quantitative comparisons are
made on the number of problems identified in each of the analyses, and the
amount of overlap in problems was determined. An analysis is given on why
certain problems were reported in one analysis and not in the other. This
provides some information on consistency of analysts, when re-analyzing
interactions. Experiences in trying to trace back causes of inconsistencies are
then discussed and shed a light on inspectability of reports.
Next, in section 4.2.2, comparisons between labs are discussed, for the
initial analyses as well as for the reference analyses. Quantitative comparisons
are made of what was specified about each difficulty in the labs' problem
descriptions, as well as about the extent to which labs reported similar or
different problems (agreement or consistency across labs).
Comparing problems reported in a lab's subsequent analyses
For comparing how many problems the labs’ subsequent analyses resulted
in, a measure of thoroughness (Hartson, Andre and Williges, 2001) was used,
and overlap in identified problems was examined. For calculating
thoroughness and overlap, usability problems (from the master list of usability
problems) were used as units of comparison. In addition, all problems that
were uniquely identified either by a lab’s initial analysis or by its reference
analysis were further inspected to trace back reasons of uniqueness. For that
inspection, usability problems were traced back to the difficulty records on
26
which they were based and if necessary to the labs' original problem
descriptions in their reports.
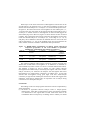
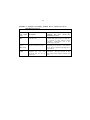
Thoroughness.
Hartson, Andre and Williges (2001) define thoroughness as the number of
real problems found divided by the number of real problems that exist. In this
case, it is assumed that all problems identified are real, as we have no
reference criterion to determine whether problems are real or not. The number
of real problems that exist, is defined here as the sum of all problems found by
all three labs (labA∪lab∪labC), using both their initial and reference
analyses (labXlabspecific∪labXSlimDEVAN). Figure 8 presents the results of the
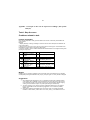
calculations.
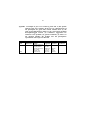
Figure 8. Thoroughness of data analyses (usability
comparison)
Initial analyses
(lab-specific)
A/(A∪B∪C)labspecific∪SlimDEVAN 26/63 = 41,3 %
3
B/(A∪B∪C)labspecific∪SlimDEVAN 23/63 = 36,5 %
C/(A∪B∪C)labspecific∪SlimDEVAN 23/63 = 36,5 %
problems as unit of
Reference analyses
(SlimDEVAN)
29/63 = 46,0 %
27/63 = 42,9 %
33/63 = 52,4 %
For all labs, the second (reference) reports describe a larger number of
problems than the initial lab reports. Thus the second analysis must have
revealed problems that were not revealed in the initial analysis. However,
based on the summative figures of thoroughness it cannot be excluded that the
initial analysis also identified some unique problems. Thus, as a next step, it
will be examined which analyses yielded unique problems and to what extent.
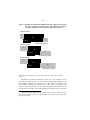
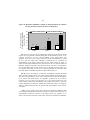
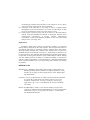
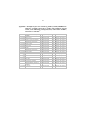
Overlap and uniqueness
Figure 9 shows that for all three labs, both the initial analyses as well as
the reference analyses identified unique problems. Because the thoroughness
of reference analyses was always higher than the thoroughness of initial
analyses the number of unique problems was always higher for the reference
analyses. Within-analyst consistencies (i.e., the proportion of overlap depicted
in figure 9) varied considerably across the three labs: 72% (=23/(23+3+6)) for
lab A, 43% (=15/(15+8+12)) for lab B and 37% (=15/(15+8+18)) for lab C.
3
Because for the reference analysis with SlimDEVAN the results of only six
(instead of eight) participants were reported, the measures for the lab’s initial report are
based on the results of the same six participants.
27
Figure 9. Number of problems identified in the labs’ initial reports and in
the labs’ reference (second) reports. The black areas indicate
overlap in problems between the first and second reports4.
Initial report
3
23
6
Lab A
Reference report
Initial report
8
15
Lab B
12
Reference report
Initial report
8
15
Lab C
18
Reference report
Inspecting why problems were reported in only one of the labs’ analysis
reports
Uniqueness of problems extracted in only one of the analyses can be
explained in at least two ways. It can be due to methodological differences in
the subsequent analyses (e.g., the focus of a data analysis procedure or the
way usability problems are defined), or it can be due to something like
‘chance’ (because researchers, as part of the measurement instrument, can not
be expected to be equally concentrated during all situations in their analysis).
4
Because lab B's SlimDEVAN report reported results of only six (instead of eight)
participants, the measures for the lab specific approach are based on the results of the
same six participants.
28
Below, unique problems are studied in more detail by trying to find out to
what extent the specific moments of difficulty on which they were based had
been observed and analyzed in both analyses, and how these were further
interpreted in each of the analyses. For that, problems were first traced back to
the difficulty records on which they were based and from there, if necessary
and possible to available interaction overviews that provided detailed insight
into what actually happened. For example, if a problem was identified in the
reference analysis, but not in the initial analysis, one could search in the
reports of the initial analysis to find out whether the moment of difficulty had
been observed at all and had been interpreted differently, or whether it seemed
to have been overlooked. Thus, if a moment of difficulty was uniquely found
in the reference analysis and it was not possible to find anything back about it
in the reports of the initial analysis, this tells something about the (un)
inspectability of the report from the initial analysis; after all both analyses
were based on the same observed interactions.
For 57 (out of 102) moments of difficulty that were uniquely based on one
of the two reports it appeared to be impossible for the comparer to find
anything about it in the other report because of inspectability problems. In the
remaining 45 cases there were no inspectability problems and reasons of
uniqueness could be analyzed. On closer inspection, in 10 out of these 45
cases a problem had incorrectly been considered unique; in these cases the
comparer had problems in interpreting the problem report which then led to
difficulties in recognizing the usability problem underlying the moment of
difficulty. In 35 cases uniqueness could be traced back to specific parts of the
data analysis process. Below these categories are dealt with in more detail.
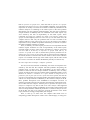
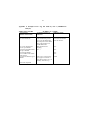
No inspection possible: unknown reasons of uniqueness
Figure 10 shows how the 57 cases in which moments of difficulty
appeared not be inspectable were distributed across the labs. There were two
main reasons for hindering inspectability: (1) although the problems were
described, the moments of difficulty on which they were based were not
described; in such cases one has no starting points for inspecting the other
report, or (2) it was not possible to link back from a problem description in the
report to a moment of difficulty reported in the other report.
Figure 10 shows that 45 (out of the 57) moments of difficulty with uninspectable reason of uniqueness came from the reference reports (the sum of
the values of the black bars), whereas 12 came from the initial reports (sum of
white bar values). By analyzing the reasons of un-inspectability, it becomes
clear to what extent these lie in the reference reports or in the initial reports.
29
Figure 10. Moments of difficulty relating to unique problems for which it
was not possible to inspect the cause of uniqueness.
Nr of moments of difficulty
for which causes of uniqueness
were not inspectable
30
Unique in initial analysis
Unique in reference analysis
24
25
20
15
15
10
5
7
6
5
0
0
Lab A
Lab B
Lab C
Lab A. In case of Lab A for five difficulties uniquely reported in the initial
report it was not possible to find anything back in the reference reports. As no
complete interaction overviews were available in the initial report (see
appendix 1) the only way to inspect where the moment of difficulty is, would
be to re-view the video tapes. Therefore, essentially this is a problem of
inspectability of the initial reports that did not guide enough in where to
search for the unique difficulty in the other analysis. In case of six moments of
difficulty uniquely reported in the reference report, the reason of uniqueness
was not traceable, again for the same reason: in the initial reports there were
no complete interaction overviews for verifying whether the interaction that
lies at the basis of the difficulty had even been observed or not.
Lab B. In case of Lab B for 15 moments of difficulty uniquely identified
in the reference analysis, there was a lack of inspectability of the initial report.
This lack of inspectability was a result of the fact that in the initial analyses
(or at least in the initial report; see appendix 3) there were no (relatively
complete) overviews that represented the users’ interactions (there were only
some example interactions embedded in the problem descriptions). Trying to
inspect uniqueness of moments of difficulty would then imply re-viewing the
video-recorded interactions for the specific task performance of the specific
user again.
Lab C. In case of lab C there was a total of 24 moments of difficulty that
were uniquely identified in the reference analysis, and for which there was an
inspectability problem in relation to the initial report (see appendix 4). A
major reason for that was that in the initial report those moments of difficulty
30
had no reference to specific users, some also had no reference to a specific
task and no interaction overviews were available. Therefore, it was practically
impossible to reliably trace back the moments of difficulty identified in the
reference analysis to something in the initial reports if the same problem
descriptions were not explicitly mentioned there. Also the cases of the three
unique moments of difficulty that were identified in the initial reports only
were caused by the lack of inspectability of the initial reports. These
concerned suggestions for solutions for which it was unclear whether any
specific observed difficulty had been at the basis of it. In four other cases, the
comparer had no idea why the problems had not been recorded in the
reference analysis: a lack of interaction overviews in the initial reports made it
impossible to verify whether the problem had actually occurred or not (unless
the video recordings would be re-viewed).
Thus, in summary, the initial reports proved to be less inspectable than the
reference reports. Problems of a lack of inspectability of the initial reports
occurred largely because: initial reports provided no complete interaction
overviews (lab A, B and C), no reference to specific tasks (lab C), no
reference to specific users (lab C) and because problems formulated in the
initial report were written as suggestion with no apparent moment of difficulty
mentioned (because of which it was unclear where to search in the reference
reports or in available session logs of the initial reports, and the video would
have to be re-viewed to see whether the difficulty actually occurred or not).
On closer inspection not unique: ‘comparer’ problems.
For ten (out of 102) moments of difficulty, the reason of uniqueness was
caused by the fact that the comparer had had problems interpreting the
problem report. In these cases, the inspectability of the reports made it
possible to find out that the 'unique' moments of difficulty were not really
unique. In eight of those cases the comparer had (on hindsight) made a wrong
decision on whether a statement in a report should be interpreted as a
problem or just as part of an overview of an interaction episode; this was the
case for six records that were uniquely found in the reference analysis of lab A
and for two unique moments of difficulty in the reference analysis of lab B.
Here, problem descriptions were embedded in incomplete overviews of
interaction episodes and were not separately and explicitly mentioned as such.
In two other cases the comparer had interpreted a problem description in one
analysis in a different way than he did in the other analysis. This happened
with only one unique moment of difficulty from Lab B’s initial analysis and
with one unique moment of difficulty from lab C’s reference analysis. In case
of lab B this was due to an ambiguous problem formulation in the initial
report, which was wrongly interpreted by the comparer.
Thus, to sum up, in some cases the comparer had made errors in
interpreting problem descriptions. These errors related largely to ambiguous
31
problem formulations (lab B) and lack of explicit distinctions between logs
and problem descriptions (lab A and B) in the initial reports. This could only
surface because in these cases the problem reports proved to be inspectable
enough.
Unique problems: tracing back reasons of uniqueness.
In the analysis of the remaining 35 (out of 102) cases for which the
comparer had concluded that a moment of difficulty was uniquely reported
and for which the reasons were traceable, the following categories of inferred
reasons for differences emerged:
(1) false-positives: moments of difficulty were reported but should not
have been reported, because from the detailed analysis it has become clear that
it is extremely unlikely that the problem actually occurred (and no other prove
of existence was found other than the final problem description in the lab’s
report);
(2) slips in the analysis leading to missed moments of difficulty: the
interaction in which the difficulty arose was observed in both analyses, but
(for unknown reasons) was not recorded as a difficulty in one of the analyses
even though it unambiguously represented a moment of difficulty;
(3) slips in the analysis leading to different problem descriptions: missed
observations or utterances leading to different interpretations of moments of
difficulty and thus to different interpretations of what exactly the problems
were;
(4) threshold differences: differences in an analyst’s decision of how
difficult a difficulty should be for recording it as a moment of difficulty in the
report;
(5) definition of 'usability problems': differences in what should lay at the
basis of a usability problem (e.g., defining the fact that the user needed a hint
as a moment of difficulty or not, distinction between problems of usability or
other problems like software bugs).
Figure 11 shows that of the 35 unique moments of difficulty that were
inspectable and regarded as being veritably unique, 23 were in the initial
reports (sum of all values in the graph at the top of the figure) and 12 were in
the reference reports (sum of all values in the graph at the bottom of the
figure).
32
Figure 11. Reasons of uniqueness analyzed
Reasons of uniqueness of moments of difficulty
in initial analyses
Number of
moments of difficulty
10
Lab A
Lab B
Lab C
5
5
4
4
3
3
2
1
1
0
0 0 0
0
0
0
0
False
positives
Slips
causing
misses
Slips
causing
differences
Threshold
differences
Differences
in problem
definition
Reasons of uniqueness of moments of difficulty
in reference analyses
Number of
moments of difficulty
10
Lab A
Lab B
Lab C
7
5
4
1
0 0
0
0
0 0 0
0 0 0
0 0
0
False
positives
Slips causing Slips causing Threshold Differences in
misses
differences
differences
problem
definition
Lab A. In case of lab A (figure 11: grey bar), for the one moment of
difficulty uniquely reported in the initial report that had been inspectable the
reason of uniqueness was of type threshold differences. Based on the low
number of inspectable moments of difficulty here, it may seem as if the
reports of lab A had been relatively un-inspectable. However, one should bear
in mind that lab A had the smallest number of unique moments of difficulty,
among which a relatively large amount of comparer problems (which is a
problem not of inspectability but of problem descriptions in the initial report).
Lab B. In case of lab B (figure 11: white bars), most ‘real’ unique
moments of difficulty for which the reason had been inspectable were in the
initial report (top graph of figure 11). Reasons of uniqueness were mainly of
33
types: slips causing differences, threshold differences and definition of
usability problems. In addition there were a few of types false-positives and
slips causing misses. In case of the slips uniqueness usually had to do with not
hearing or not noticing user’s verbal utterances containing clues that helped in
interpreting the specific moment of difficulty.
Lab C. In case of lab C (figure 11: black bars), reasons of uniqueness were
found to be in the categories threshold differences and definition of usability
problems. In addition, for eight moments of difficulty the reason of
uniqueness was placed in the category false positives (seven of these were
from the reference report).
Although the number of seven seems impressively large, it should be
mentioned that these were seven instances of one single usability problem,
and each of the instances was from a different user.
In summary, inspectability of the reports allowed for tracing back causes
of uniqueness in these 35 cases. Reasons for uniqueness included: slips
causing misses (lab B reference analysis), slips causing differences (due to for
example missing user utterances) (lab B initial analyses), threshold differences
(lab A, B, C), differences in definitions of usability problems (lab B and C)
and false positives in the reference analysis (lab C).
Comparing the reported problems across the three labs
Some of the categories of reasons for uniqueness mentioned in the
previous section seem to relate to issues of analysts working inaccurately
(e.g., lack of attention), whereas others might be related to issues of
differences in point of view, opinions or focus. For example, a more explicit
and detailed procedure (as in the reference analysis with its checklist of
signals of difficulty), may (but not necessarily does) bring about an implicit
focus on specific elements of interactions or specific interpretations in
formulating problems. If this would be the case, than one would expect to find
less consistency between labs in the initial analysis (lab-specific analysis) than
in the second (reference) analysis. Thus shifts in levels of agreement between
labs when moving from the initial analyses to the subsequent analyses can tell
something about the quality, in terms of biasing the results from the reference
analysis. Below, levels of agreement across labs are calculated. First,
comparisons are made of which problems were reported. Subsequently,
comparisons are made on the type of information that is given about each
problem.
34
Comparing which problems were reported
For determining consistency in what problems each of the three labs
reported, evaluator agreement measures are used. Hertzum and Jacobsen
(2001) suggest the use of the any-two agreement measure in cases where the
number of evaluators is relatively small. In this article, Hertzum and
Jacobsen's (2001) definition is used, substituting evaluators by labs:
the average of
Pi ∩ Pj
Pi ∪ Pj
(over all ½n(n-1) pairs of labs).
(1)
Similarly, agreement between x labs can be defined as:
Pi ∩ Pj ∩ ... ∩ Px .
(2)
Pi ∪ Pj ∪ ... ∪ Px
In these equations, Pi, Pj and Px are the sets of problems (or high-level
categories) detected by lab i, lab j, and lab x, and n is the number of labs.
Figure 12. Agreement between labs (usability problems as unit of
comparison)
Usability problems
Lab A vs. B
Lab A vs. C
Lab B vs. C
Any-two agreement
Three agreement Lab
A-B-C
Agreement between labs
Lab specific
Slim-DEVAN
11/38 = 28,9 %5
13/36 = 36,1 %
10/36 = 27,8 %4
30,9 %
(7/45 =) 15,6 %4
11/45 = 24,4 %
15/47 = 31,9 %
16/44 = 36,4 %
30,9 %
(9/56 =) 16,1 %
Figure 13. Agreement between labs (high-level problem categories as unit
of comparison)
Agreement between labs
High-level problem
categories
Lab A vs. B
Lab A vs. C
Lab B vs. C
Any-two agreement
Three agreement Lab
A-B-C
Lab specific
Slim-DEVAN
12/23 = 52,2 %
12/23 = 52,2 %
13/19 = 68,4 %
57,6 %
(11/25 =) 44,0 %
15/28 = 53,6 %
14/23 = 60,9 %
17/31 = 54,8 %
56,4 %
(13/31 =) 41,9 %
5
Because in case of Lab B for the reference analysis (SlimDEVAN) the results of
only six (instead of eight) participants were reported, the measures for the lab specific
analysis of Lab B are based on the results of (the same) six participants as well.
35
Figures 12 and 13 show the any-two agreement measures for usability
problems and for high-level categories respectively.
Due to the higher level of abstraction (and hence the smaller number of
categories) the higher any-two agreement for high level problem categories
comes not unexpected. On both levels of abstraction, any-two agreement in
the initial analysis is about the same as in the reference analyses. If the largely
prescriptive analysis and reporting techniques of the reference analysis would
have introduced a bias in finding usability problems, a higher level of
agreement would have been expected for the second (reference) analyses. No
indications were found that the reference analysis leads to a specific bias in
the labs’ results. In other words, the level of agreement does not seem to be
influenced by the fact that the labs' analysis methods used in the initial
analyses were different, whereas those in the second analyses were similar.
Comparing ‘what was specified about each problem’
Figure 14 shows, for each of the analyses, an overview of the elements that
problem descriptions consisted of in case of each of the three labs. For that,
the fields difficulty and cause in each difficulty record (see figure 6, 6th
attribute) were analyzed. The contents of these difficulty record fields had
been taken literally from the labs’ reports. These difficulty records were
analyzed to find out to what extent they mentioned (or otherwise referred to)
the following problem description elements:
(1) the situation in which the problem occurred (was the product status
mentioned, was there a mentioning of preconditions for actions that were not
met?)
(2) the user’s observable behavior at the time the difficulty occurred (what
parameters was the user trying to set, what physical action was the user trying
to perform?)
(3) what the user thought, felt or understood (explicit mentioning of
inferences about the user’s reasoning, understanding, feelings or about what
the user tried to achieve)
(4) what the effect of the difficulty was (this relates to the effect of the
problem on the product status, as well as effects on the user, like confusion,
frustration, etc.)
(5) inferences about what product element had caused the difficulty or
should be redesigned to avoid it (explicit mentioning of product characteristics
that are believed to have contributed to the difficulty, of the reason why they
are believed to have contributed to it, as well as suggestions to change the
functionality of the product).
Compared are the proportions of problem descriptions that contained
statements referring to each of the mentioned descriptive elements. Thus, the
figures are corrected for differences in absolute numbers between the initial
analyses and the reference analyses.
36
Figure 14. Overview of what descriptive elements the labs used in their
problem descriptions.
Proportion of problem descriptions that contained a specific
type of statement (initial analysis)
1,00
0,90
0,80
0,70
0,60
0,50
0,40
0,30
0,20
0,10
0,00
Initial Lab A
Initial Lab B
Initial Lab C
ns
t io
ac
d
em
em
oo
bl
bl
st
ro
ro
er
p
p
d
of
un
ed
ct
or
r
us
fe
se
ca
ht
ef
b
t
g
o
ha
ou
's
tt
th
er
lt,
en
us
fe
m
e
r's
el
se
ct
tu
du
a
o
r
p
wh
s it
n
tio
ua
e
bl
va
Proportion of problem descriptions that contained a specific
type of statement (reference analysis)
1,00
0,90
0,80
0,70
0,60
0,50
0,40
0,30
0,20
0,10
0,00
Reference Lab A
Reference Lab B
ac
t io
ns
fe
lt,
th
ou
gh
ua
tio
n
sit
ob
se
rv
ab
le
wh
at
us
er
's
us
er
's
to
ru
nd
er
st
pr
oo
od
d
ef
uc
f
te
ec
to
le
m
fp
en
ro
tt
bl
ha
em
tc
au
se
d
pr
ob
le
m
Reference Lab C
Figure 14 shows that in the graph at the bottom, the relations between the
bars per lab (i.e., all bars of a certain color) are more similar than in the graph
at the top. In other words, it seems that in the second analysis labs have
produced more similar reports in terms of what they reported about problems.
Summarizing, the reference analysis procedure did not lead to more
agreement on what usability problems were extracted, but it did lead to more
consistency in what was reported about each of the problems. Labs reported
more about the situation in which problems occurred and were more in
37
agreement with each other with respect to the amount of problem descriptions
containing behavioral observations and inferences about what users seemed to
understand, feel and think. Especially lab C, which originally reported
relatively little about what users did, now reported more about that. The labs
that in the initial reports mentioned only few possible causes of problems (labs
A and B), now showed a considerable increase, whereas lab C that already
was at a high level, reported relatively less causes. Finally, for labs A and B,
the reporting of effects of actions dropped to a very low level in the reference
analysis, whereas lab C stayed at an already relatively low level.
5. DISCUSSION AND CONCLUSION
The aim of the study was to investigate issues of consistency and
inspectability of data analyses and reports based on usability tests meant to
extract usability problems. Consistency of findings was studied for analysts
who analyzed their observed interactions twice with time intervals of one to
two months (the first time using their own usual method of analysis, the
second time all using the same reference method of analysis). Inconsistencies
were analyzed in detail in order to trace back their origin. Consistency across
labs was studied in terms of levels of agreement on problems and high-level
categories; it was determined to what extent these levels change when the
labs, in their re-analysis, all use the same data analysis method. Also, it was
explored to what extent the use of the same data analysis approach led to the
use of similar descriptive elements in the labs' problem descriptions. By
making the reported usability problems comparable as well as by analyzing
reasons of inconsistencies, it became clear which problem report elements
were important for (1) making reports inspectable and (2) making the reported
findings traceable to the original observations. Below the findings on
inspectability and consistency are discussed.
5.1 Inspectability
Inspectability of usability problem reports is important for laying bare
those elements in a data analysis process that involve subjective analyst
judgments. In this study it became clear that for comparative studies
inspectability is also important for two other reasons. Firstly, it proved to be of
crucial importance for understanding reported problems in enough detail to be
able to decide on their similarity. Secondly, inspectability proved to be of
major importance for tracing back reasons of why a lab reported a problem in
one analysis and not in the other. For example, problems of inspectability
when trying to trace back the origin of uniqueness were present in 57 of the
102 problem records that were reported in just one of a lab's analyses.
38
The absence of the following report characteristics proved to be a
hindrance in tracing back findings to more primary data. In other words, to
make usability problem reports more inspectable, the following issues can be
helpful:
(1) inclusion of descriptions of a user's actual behavior in the description of a
problem, e.g., descriptions of problematic user actions;
(2) making references to which users encountered a problem;
(3) making references to the task context or the (sub) goal that a user was
trying to accomplish at the time of the problem;
(4) making clear distinctions between descriptions of problematic
interactions and descriptions of interactions that are interpreted as
proceeding without problems;
(5) inclusion of (or making references to) overviews of observed interactions
(without substantial gaps), instead of only relying on problem
descriptions;
(6) inclusion of an account of a user's verbal utterances, as well as clear links
between such account and interaction overviews or problem descriptions;
(7) inclusion of inferences about causes of problems (or suggestions for how
to resolve problems) with clear links to behavioral problem descriptions.
5.2 Consistency
Across-analyst consistency (subjectivity)
Comparison of what descriptive elements were used to report problems
showed that the (SlimDEVAN) reference reports led to more across-lab
consistency, than the initial reports. In other words, without using an agreed
method for reporting problems, consistency across analysts on what elements
are used to report problems may suffer; this in turn makes it more difficult to
compare the usability problems identified by those analysts. In the present
study, the SlimDEVAN method led to more consistency in the degree to
which the analysts provided descriptions of the situations in which problems
occurred, of the behavioral descriptions of observable problematic actions, of
accounts indicating what analysts inferred users were feeling, understanding
or thinking, and in mentioning product elements that presumably had caused
problems.
Although consistency in what descriptive elements were used to report
problems was higher in the reference reports than in the initial reports,
measures of consistency on which problems were identified tell a different
story: any-two agreement levels were about the same for the initial and
reference analyses. This implies that adopting similar data analysis approaches
and using an agreed format for describing usability problems not necessarily
39
leads to more consistency in findings across analysts. Any-two agreement of
the labs (comparing usability problems) was 30,9% for both analyses. Based
on our data, it is unclear whether the lack of agreement stems (1) from
differences in the labs' original data (e.g., actual differences in interactions,
because the labs used different test participants in different countries) or (2)
from some analyst-specific (i.e.,: not method-specific) characteristic of the
analysis (e.g., inherent subjectivity in the data analysis process).
Within-analyst consistency
For measuring within-analyst consistency two measures were used: (1)
thoroughness of the first analysis and of the second analysis; (2) overlap: the
number of problems that a lab found in both analyses, divided by the total
number of problems they found in the two analyses.
In the reference analysis (the second analysis) thoroughness proved to be
consistently higher than in the initial analysis. Two possible reasons are: (1)
problems identified in the initial analysis may have a higher chance of being
identified again in the second analysis, while at the same time analysts have a
second chance for identifying problems that were overlooked in the first
analysis; (2) due to its characteristics the reference method is able to identify a
larger number of problems. The present data do not allow determining to what
extent these reasons contribute to the current findings.
The proportion of overlap of findings from the initial and subsequent
analyses was found to be substantially different across labs. One can think of
two possible reasons: (1) differences in levels of thoroughness between initial
and subsequent analyses varied considerably (e.g., more thoroughness in the
analyses increases the chance for more overlap); (2) the methods the labs used
in their initial analyses differed in the extent to which they facilitate analysts
to work in a consistent manner. Based on the available data it is unclear which
of these reasons is most likely.
The reasons behind the findings on (within-analyst as well as acrossanalyst) consistency all raised some questions. Due to issues of confounding
in the set up of the study, the questions can not be answered just by using the
data of the present study. In making within-analyst comparisons there was
confounding due to the analysis methods the labs used as well due to an order
effect (labs used different methods in their first and second analysis); in the
across-analyst comparisons, there was confounding due to the fact that the
three labs worked from observations of different test participants. Data from a
separate study described in Vermeeren, Koenderink-van Doorn and de Ridder
(2006) suggest possible answers. These are dealt with below.
40
5.3 Follow-up study on causes of (in)consistency
In the study described in Vermeeren, Koenderink - van Doorn and de
Ridder (2006) two pairs of students (in the context of a course on research
methodology) were asked to analyze parts of the recordings from lab B twice
with an interval of about three weeks and to use SlimDEVAN for both their
analyses. Students were free to decide how many and which sessions they
analyzed. They were third-year (Bachelor) students of Industrial Design
Engineering at Delft University of Technology and had no experience in
formal user testing and data analysis. However, they had three years of
experience in practical courses on user-centered design and evaluation of
consumer products. Students were provided with the English language user
manual of SlimDEVAN (Vermeeren, 2003), with an abbreviated Dutch
language user manual as well as with published literature on DEVAN
(Vermeeren, van Kesteren & Bekker, 2003; Vermeeren, 2004). In addition,
the first author of the present article explained and discussed SlimDEVAN
with each individual pair of analysts. In addition, after they had performed
their first session, analysts had their analysis checked by the first author of the
present paper to identify misunderstandings of SlimDEVAN.
Students analyzed the sessions of their choice twice with a minimum
interval of three weeks. During those weeks the students did not watch the
recorded sessions nor did they review their analyses; largely they spent time
on doing exams for other courses as well as on doing a literature search on the
topic of comparing usability evaluation methods. Student pair 1 decided to
analyze the sessions of test participants 1, 2, 3, 4 and 5; student pair 2
analyzed the sessions of test participants 2, 4, 5 and 6.
-
-
-
The following measures were taken to study issues of consistency:
across-analyst consistency in the second analysis, in terms of agreement
between findings of each student pair and of lab B (expressed as a
proportion of the total number of problems identified by the lab and the
student pair in their second analysis). Figures are based on the same
sample of test participants for student pair and lab B). See figure 15 for
the results.
thoroughness of the students' first and second analyses in comparison to
thoroughness of Lab B's analyses (again for the same sample of test
participants). Total number of usability problems that exist is defined here
as the total number of problems identified by all three labs and the two
student pairs in their first and second analyses (77 problems). See figure
16 for the results.
within-analyst consistency in terms of overlap between first and second
analysis in comparison to that of lab B (for the same sample of
participants). Overlap is expressed as the proportion of the total number
41
of problems identified by a lab/student pair in their two analyses. See
figure 17 for the results.
Figure 15. Analyst agreements of student pairs and lab B in the second
analysis (proportion of the total number of problems identified
by the lab and the student pair in their second analysis).
Analyst
Participant
Analyst agreement
combination
sessions
second
analysis
(SlimDEVAN)
Student pair 1
1, 2, 3, 4, 5
26,8%
vs. Lab B
Student pair 2 vs. 2, 4, 5, 6
29,4%
Lab B
In the discussion, the question was raised as to what had caused the limited
agreement in the labs' findings: would it be due to differences in the observed
interactions themselves (as the labs had used different participants) or to
issues of analyst subjectivity. Even though each of the student pairs and lab B
had analyzed exactly the same data (i.e., the same sessions of the same
participants), the levels of agreement still are roughly in the same range as
those of the labs (i.e., 24,4%, 31,9% and 36,4% for the SlimDEVAN analyses;
see figure 12). This is contrary to the expectation one would have if the
difference in original data would have been the most important factor for the
lack of agreement. This suggests that analyst-specific factors (i.e.,
subjectivity) play an important role in the lack of agreement. The fact that
agreement levels between lab B and the student groups were even lower than
agreement levels between labs may be explained by the fact that these were
based on data from a smaller number of participants.
Figure 16. Thoroughness of analyst groups compared across 1st and 2nd
analysis. Total number of usability problems that exist is 77.
Analysts
Participant
sessions
Thoroughness
1st analysis
Thoroughness
2nd analysis
Student
pair 1
Lab B
1, 2, 3, 4, 5
Student
pair 2
Lab B
2, 4, 5, 6
31,2%
(SlimDEVAN)
29,9%
(Lab specific)
49,4%
(SlimDEVAN)
26,0%
(Lab-specific)
32,5%
(SlimDEVAN)
35,1%
(SlimDEVAN)
53,3%
(SlimDEVAN)
32,5%
(SlimDEVAN)
1, 2, 3, 4, 5
2, 4, 5, 6
Increase in
thoroughnes
s
1,3%
5,2%
3,9%
6,5%
42
With respect to the observed increase of thoroughness from the first to the
second analyses, the question arose: to what extent would this be due to the
fact that the second analysis is a re-analysis or to some method-specific factor.
In figure 16, the observed increase in thoroughness for the student pairs (i.e.,
1,3% and 3,9%) can only be due to the sole fact that the second analysis was a
re-analysis. A similar increase in thoroughness for lab B would suggest the
same underlying reason. However, figure 16 shows that the increase for lab B
is higher. This suggests that the increase in the labs' thoroughness is partly due
to the fact that the analysis is a re-analysis (i.e., in the range of 1,3 - 3,9 %)
and partly due to differences between the methods that were used in the first
and second analysis (i.e., one of the methods being more thorough than the
other). Further research is needed to substantiate these speculations.
Figure 17. Within-analyst consistencies of analyst groups and lab B
compared (proportion of the total number of problems
identified by a lab/student pair in their two analyses).
Analysts
Participant
sessions
1st Analysis
2nd Analysis
Student pair 1
Lab B
Student pair 2
Lab B
1, 2, 3, 4, 5
1, 2, 3, 4, 5
2, 4, 5, 6
2, 4, 5, 6
SlimDEVAN
Lab specific
SlimDEVAN
Lab specific
SlimDEVAN
SlimDEVAN
SlimDEVAN
SlimDEVAN
Withinanalyst
consistency
63,3%
42,9%
71,7%
36,4%
The question regarding within-analyst consistency in terms of overlap was
whether this would relate to thoroughness or to differences in methods (as
some methods may make it easier to work in a consistent manner than others).
The findings in figures 16 and 17 suggest no clear relation between
thoroughness and within-analyst consistency; the highest and lowest withinanalyst consistency are found for the analyses with the highest and lowest
thoroughness, but within-analyst consistency of student pair 1 is also high
without their thoroughness being quite high. Note that within-analyst
consistency is high for both student pairs and low for lab B. This suggests that
indeed the used analysis method plays an important role in analysts being
consistent across subsequent analyses.
Conclusions
The findings in the case study together with those from the complementary
study suggest that:
(1) the levels of agreement between analysts relate to analyst-specific
characteristics, rather than to characteristics of the used analysis methods
or to differences in the original data. In other words there seems to be
considerable inherent subjectivity in findings from a usability test based
43
on identifying problems and consistency across analysts is not very likely
to be improved by using specific analysis methods;
(2) re-analysis of the same data is very likely to lead to a slightly higher
thoroughness in the second analysis even if the second analysis is done
one or two months later (in this case in the range of 1-4%);
(3) within-analyst consistency does seem to be sensitive to the used analysis
method; using the SlimDEVAN method in subsequent analyses led to
within-analyst consistencies of 63-72%, whereas within-analyst
consistencies of labs using different methods in their first and second
analyses were, on average 50%.
Implications
In usability studies that are based on comparing problems, it is important
that all data are analyzed by the same analysts. This is important because of
the inherent subjectivity in extracting usability problems from observations.
With appropriate methods that conform to the characteristics as present in
SlimDEVAN and as mentioned in section 5.1, within-analyst consistency can
be improved. Also, such methods make the findings inspectable. Inspectability
is important for laying bare subjective parts in data analyses and for making
sure that outside reviewers can falsify or confirm the findings. In comparative
usability studies inspectability is also important for a thorough understanding
of the reported problems. This is crucial for being able to decide on similarity
of problems.
REFERENCES
Barendregt, W., & Bekker, M.M. (2005). Developing a coding scheme for
detecting usability and fun problems in computer games for young
children. Proceedings of Measuring Behaviour 2005, Wageningen,
The Netherlands.
Cockton G., Lavery D. & Woolrych A. (2002). Inspection-based evaluations.
In J. Jacko & A. Sears (Eds.) The human-computer interaction
handbook: fundamentals, evolving technologies and emerging
applications, (pp. 1118 - 1138) Mahwah, NJ: Lawrence Erlbaum
Associates.
Daams, B. & Hariandja J. (2006). Cross-cultural usability, testing a food
processor in Indonesia and the Netherlands. Proceedings of IEA2006:
16th World Congress on Ergonomics IEA2006 , 1-5, Amsterdam,
The Netherlands: Elsevier.
44
Guba E.G., & Lincoln Y.S., (1989). Fourth generation evaluation. London:
Sage.
Hartson, H.R. (2003). Cognitive, physical, sensory and functional affordances
in interaction design. Behaviour & Information Technology, 22 (5),
315-338.
Hartson, H.R., Andre, T.S., & Williges, R.C. (2001). Criteria For Evaluating
Usability Evaluation Methods. International Journal of HumanComputer Interaction 13 (4), 373-410.
Hertzum, M. & Jacobsen N.E. (2001). The Evaluator Effect: A Chilling Fact
About Usability Evaluation Methods. International Journal of
Human-Computer Interaction, 13(4), 421-443.
Hertzum, M., Jacobsen, N.E. & Molich, R. (2002). Usability Inspections by
Groups of Specialists: Perceived Agreement in Spite of Disparate
Observations. Extended abstracts of the ACM CHI 2002 Conference,
662-663, New York: ACM.
Hoenderdos, R., Vermeeren, A.P.O.S., Bekker, M.M. & Pierik A. (2002)
Design for experience: the "Look, mama!" experience. Proceedings
of Interaction Design and Children, 4-10, Eindhoven: The
Netherlands.
Jacobsen, N.E., Hertzum, M. & John, B.E. (1998). The Evaluator Effect in
Usability Tests. Proceedings of the CHI’98 Conference on Human
Factors in Computing Systems (Summary), 255-256, New York:
ACM.
Kanis, H. (1993). Reliability in Ergonomics/Human Factors. Contemporary
Ergonomics, 91-96, London: Taylor and Francis.
Lavery, D., Cockton, G., & Atkinson M. (1997). Comparison of evaluation
methods using structured usability reports. Behaviour & Information
Technology, 16 (4), 246-266.
Law E. L.-C. & Hvannberg E.T. (2004). Analysis of Combinatorial User
Effect in International Usability Tests. Proceedings of ACM CHI
2004 Conference on Human Factors in Computing Systems. April
24-29, 2004, 9-16, Vienna, Austra.
45
Molich, R., Ede M.R., Kaasgaard K. & Karyukin B. (2004). Comparative
usability evaluation. Behaviour & Information Technology, 23 (1),
65-74.
Noiwana J., & Norcio A.F. (2006). Cultural differences on attention and
perceived usability: Investigating color combinations of animated
graphics. International Journal of Human-Computer Studies 64 (2),
103-122.
Park K.S. & Lim C.H. (1999). A structured methodology for comparative
evaluation of user interface designs using usability criteria and
measures. International Journal of Industrial Ergonomics 23, 379 389.
Vermeeren, A.P.O.S., (1999). Designing scenarios and tasks for user trials for
home electronic devices. In W.S. Green & P.W. Jordan (Eds.),
Human Factors in Product Design: current practice and future
trends (pp 47-55). London: Taylor & Francis.
Vermeeren, A.P.O.S. (2003). The DEVAN checklist for detecting problems in
interactions: user manual (checklist version 1.1) (Technical Report).
Delft, The Netherlands: Delft University of Technology, Faculty of
Industrial Design Engineering.
Vermeeren, A.P.O.S. (2004). Structured Video Analysis of User test Data,
using the DEVAN Tool. In Ç. Erbuğ (Ed.) Usability testing:
Methods, Experiences, Achievements (pp. 123-140). Ankara, Turkey:
Middle East Technical University, Faculty of Architecture,.
Vermeeren, A.P.O.S., Bekker, M.M., van Kesteren, I.E.H. & de Ridder, H.,
(2007). Experiences with Structured Interviewing of Children during
Usability Tests. In L.J. Ball et al. (eds.) Proceedings of HCI 2007,
The 21st British HCI Group Annual Conference, 139-146. Swindon,
UK: BCS.
Vermeeren, A.P.O.S., den Bouwmeester, K., Aasman, J., & de Ridder, H.
(2002). DEVAN: a tool for detailed video analysis of user test data.
Behaviour & Information Technology, 21 (6), 403-423.
Vermeeren, A.P.O.S., van Kesteren, I.E.H., & Bekker M.M. (2003).
Managing the Evaluator Effect in User Testing. Proceedings of
INTERACT'03, 647-654, Amsterdam, The Netherlands: IOS Press.
46
Vermeeren A.P.O.S., Koenderink-van Doorn A.J., Ridder H. de (2006)
Reliability of a check-based user test data analysis procedure.
Proceedings IEA 2006 Congress: Meeting Diversity in Ergonomics,
Maastricht, The Netherlands.
ACKNOWLEDGMENTS
Many thanks to the anonymous reviewers and to review editor Clayton
Lewis for their well-considered and helpful comments and suggestions on an
early draft of this article. Also, the authors would like to thank the test
participants for their efforts in the usability tests, Deana McDonagh, Pelin
Gültekin and Zeynep Karapars for their contribution to the user tests, Nigel
Bevan for his contributions in the early phases of the collaborative project and
Jans Aasman for comments on an early draft of this article.
47
Appendix 1. Example of part of a session log from lab A (lab specific
analysis; task: stop cooking). In the top row, characteristics of
the participant are given. The various columns show (1) the
task, (2) task effectiveness (either 1 or 0), (3) free-form problem
description/logged actions, (4) evaluator's suggestions for
solutions to the problem, (5) general comments, (6) answer to
the question whether the product met the participant's
expectations with respect to this task.
<Name> 41
High
Female
Task
Problem
Pressed rotary knob,
turned. Pressed
'stop' but puzzled
when she saw 'menu'
and 'cooking'.
Pressed 'stop'
unintentionally.
Suggestion
Comments
Meets
expectations?
Display may
turn dark;
feedback or
a text may
appear on
the screen
Not safe,
Didn't
provide
feedback
_
Stop
Effectiveness
1
48
Appendix 2. Example of a part of lab B's session logs (lab specific
analysis). Columns show (from left to right): date and time;
recorded events; code for participant; task; video frame
number; reference to video file.
28-10-2003
10:35
28-10-2003
10:35
28-10-2003
10:35
28-10-2003
10:36
28-10-2003
10:36
28-10-2003
10:36
28-10-2003
10:36
28-10-2003
10:36
28-10-2003
10:37
28-10-2003
10:37
[SYS][switched to task Prolong
the cooking time]
start
36
36
I will make it thiryt minutes …iot his
right
I forgot to check how many
minutes you still have to go…what
is twenty minutes more
…Im not sure I forgot to check how
many minuytes to go…
stops and explains
36
36
you did not check the temperaty
36
I will try
36
goes to edit
36
goes to temperatue
36
change temperature
36
36
36
Prolong the
cooking time
Prolong the
cooking time
Prolong the
cooking time
Prolong the
cooking time
1589
Prolong the
cooking time
Prolong the
cooking time
Prolong the
cooking time
Prolong the
cooking time
Prolong the
cooking time
Prolong the
cooking time
Prolong the
cooking time
1624
1591
1593
1602
1650
1670
1676
1679
1683
1687
NL281003_930_riette.av
i
NL281003_930_riette.av
i
NL281003_930_riette.av
i
NL281003_930_riette.av
i
NL281003_930_riette.av
i
NL281003_930_riette.av
i
NL281003_930_riette.av
i
NL281003_930_riette.av
i
NL281003_930_riette.av
i
NL281003_930_riette.av
i
49
Appendix 3. Example of how lab B reported its findings (lab specific
analysis).
Task 1 Stop the oven
Problems related to task
Find the stop button:
Users find the stop-button easily, press the button, but are then confused by the feedback the
oven provides.
Reasons:
1. Display still says "cooking", indicating a menu-item. Novice users interpret it as feedback: the
oven is still cooking.
2. When users go up one level, they find an icon that shows a cooking pan. It is animated and is
interpreted by novice users as: the oven is still cooking
3. There is no tactile, visual or audible feedback that indicates that the oven stopped cooking after
pressing the stop button.
EventnoEventlog
Did things…I pushed a
794 button…I think the oven
stopped
375Goes to settings
Does not see that it has
653
stopped already
Is it stopped…goes to
320
start now
What do you think when
518 you saw this…what
should I do now
481Tries to turn
Msec.Video file
4819NL281003_930_riette.avi
5156NL281003_1400_robert.avi
5482NL30102003_Marion.avi
6025NL031103_1400_Femke.avi
6244NL04112003_900_karin_1.avi
6749NL051103_1400_wim.avi
Weight:
Weight = high. In emergency situations novice users will not be sure whether the oven stopped
and especially in dangerous situations they may try to stop it again or to verify whether it stopped.
Suggestions:
1. Give feedback when stopping the oven, for example a small screen indicating that the
oven stopped. Or an indicator of the on/off status of the oven that can be seen in each
menu. Suppose that the oven evolves and users can change settings without stopping
cooking, such an indicator maybe very useful (see findings on alarm-clock)
2. The word “cooking” is very active: it seems to indicate the status of the oven. Maybe
there is an alternative word. After selecting suggestion 1 the confusion is probably
already over.
3. Some users preferred a stop/start button. This is also a way of providing immediate
feedback: a clear start/stop button that is in or out depending on the status of the oven.
50
Appendix 4 Examples from lab C's report (lab specific analysis).
(From the report's appendix 1:)
51
Appendix 5 Example of a log made by lab A (SlimDEVAN analysis).
USER 7: FEMALE, 41, HIGH INCOME
Actions
(time stamp)
Verbal utterances, user
behaviour
(00:27)
Breakdown signal types
TASK: Stop the oven cooking
Shall I stop now?
presses rotary knob
(00:28)
ACT
turns rotary knob
(00:29)
Repeated turning and pressing
rotary knob
<0:29: 00:32>
(00:33)
ACT
REP, ACT
Didn’t stop!
TASK GOAL ACHIEVED
(00:34)
(00:35)
cooking diplay appears
(00:43)
Now select something ?.....
(00:44)
What shall I do?
(00:53)
Didn’t stop !
Hımm...
RAND and DSF
RAND: After the end of the task it
was indicated by the user that she
hadn’t seen stop button, she had
pressed it unintentionally.
DSF: Surprized by the action’s
effect, can’t understand why she
couldn’t stop
DSF
Doesn’t understand action’s effect
DSF
Surprised by the action’s effect
INTN
Specifies an action that she thinks is
needed
PUZZ
Doesn’t know what action is needed
to stop
WEX
Oven has already stopped but she
formulates a wrong explanation for
the display
52
Appendix 6. Example of usability problem list as reported by lab A
(SlimDEVAN analysis).
<Name>
Time stamp
and signal
codes
(00:28)
ACT
Free-form
description
difficulty
<0:29:
00:32>
REP, ACT
User rotates and presses the
knob several times to stop.
(00:53)
WEX
Although she successfully
stopped the oven she
expresses that she was not
successful.
User presses rotary knob to
stop the oven
Inferences
about
what
design
elements may have caused the
difficulties to occur.
The rotary knob is the most dominant
element among the controls, so that user
is directed to that without much
intention. Furthermore, stop is not
sufficiently expressed.
User expects to control the oven with
the knob, just as she uses a conventional
oven. This is a problem regarding user’s
expectation.
After the oven is stopped user is not
informed. The info present in the
following screen actually misleads the
user.
53
Appendix 7. Example of part of a session log made by lab B (SlimDEVAN
analysis). Columns (from left to right): time and date; logged
events; code indicating participant; task; video frame number;
reference to video file.
28-10-2003
14:15
28-10-2003
14:15
28-10-2003
14:15
28-10-2003
14:15
28-10-2003
14:15
28-10-2003
14:15
28-10-2003
14:15
28-10-2003
14:15
28-10-2003
14:15
28-10-2003
14:15
28-10-2003
14:15
28-10-2003
14:15
28-10-2003
14:16
[SYS] [switched to task Stop the
cooking]
….go ahead
37
Stop the cooking
289
37
Stop the cooking
344
NL281003_1400_robert.avi
this is the oven
37
Stop the cooking
349
NL281003_1400_robert.avi
presses…loooks, turns the button
37
Stop the cooking
352
NL281003_1400_robert.avi
[DEVAN] [ACT], Wrong Action:
presses…loooks, turns the button
presses at back
37
Stop the cooking
357
NL281003_1400_robert.avi
37
Stop the cooking
360
NL281003_1400_robert.avi
goes to menu
37
Stop the cooking
363
NL281003_1400_robert.avi
recipes
37
Stop the cooking
369
NL281003_1400_robert.avi
[DEVAN] [ACT], Wrong Action:
recipes
goes to settings
37
Stop the cooking
369
NL281003_1400_robert.avi
37
Stop the cooking
375
NL281003_1400_robert.avi
alarm
37
Stop the cooking
378
NL281003_1400_robert.avi
status of alarm
37
Stop the cooking
380
NL281003_1400_robert.avi
cooking
37
Stop the cooking
383
NL281003_1400_robert.avi
turns knob
37
Stop the cooking
389
NL281003_1400_robert.avi
I'm looking for a stopbutton
37
Stop the cooking
394
NL281003_1400_robert.avi
[DEVAN] [SEARCH], Searches for
Function: Im looking for a
stopbutton
I can't find it
37
Stop the cooking
394
NL281003_1400_robert.avi
37
Stop the cooking
402
NL281003_1400_robert.avi
54
Appendix 8. Parts from the usability problem report of lab B
(SlimDEVAN analysis).
Usability issues related to the cooking screens.
MAIN
1. When alarm is set it is not clear if time indicates time until alarm or indicates the actual time
STARTING/STOPPING
1. All users press the stop button when asked to stop the cooking process. However: the feedback is not
clear. The "cooking" title above the menu, the animated and moving "Cooking"-picture suggest that the oven
is still operating.
2. Cooking is interpreted as "Boiling". The animated gif with the boiling pan supports this interpretation.
It is better to have a picture of an oven.
Weight
The issues related to starting and stopping the oven are found several times in each session (in total 34
times).
The issues related to editing were found 16 times, and in each session. The issues related to the menu,
status were found in at least three sessions. The defrost issues were found in two sessions.
The start/stop issues are therefore probably quite general for the user population, also the issues related to
the edit-menu. The issues related to status, menu and defrost were found in specific sessions in which users
were less experienced.
Validity
Start and stop issues and issues related to the edit cooking are quite central to the operation of the oven. In
general it can be concluded that users can learn to operate the oven, without a manual but they need some
learning time. Reaching errorless and routine performance will probably take some time, for the less used
functions it may be difficult to reach.
Suggestions
1. If applicable, present In the opening screen also information on selected program and alarm settings.
2. The term "Cooking" is confusing. Although it finally remains the only option for setting settings after users
have tried the other items (setting duration in the time dialog or in the alarm dialog, looking in recipes). The
icon is associated with boiling (potatoes, vegetables) and not with an oven.
The cooking icon is animated, suggesting that the oven is actually working. Also the title "cooking" suggests
that the oven is working. A clear indication of the status of the oven, a program or alarm could help users to
understand what the oven is doing when they are in the main menu.
3. Pressing the stop-button should give feedback, for instance a sound.
55
Appendix 9. Example from a log file made by lab C (SlimDEVAN
analysis).
TEBA OVEN STUDY
SUBJECT 5: <NAME>
Actions/Times
(minutes and seconds)
Verbal utterances/User
behaviour
0.11 Pressed STOP.
"The natural thing would
be to press the button that
says Stop. But I don’t think
that’s right. Perhaps I’ll
twiddle that knob."
"But that doesn’t do
anything.
"So…"
0.17 Tries out knob and
moves up to MODE.
0.30 Down to DURATION
and up to MODE.
0.32 Selects MODE
0.36 Twiddles knob within
mode options.
0.39 Presses BACK to go to
MODE
0.44 Task completed
Difficulty signals
Task 1: Stop the cooker
User achieves task but
does not realise it.
ACT
ACT
ACT
ACT
"The oven’s going to blow
up I suppose. I’m stuck. I
don’t know what to do. I’ve
probably messed it up."
PUZZ
56
Appendix 10. Example from the problem list made by lab C.
(SlimDEVAN analysis).
Problem list following by subjects who experienced them (numbered 1 to 8).
Lack of feedback when stopping oven (1,2,3,4,5,6,7,8)
Fixed order of making settings in cooking menu (1,2,3,4,5,6,7)
Hesitating or not realising that they should select COOK to start cooking (1,2,3,4,5,6,7,8)
Expects selection bar in View and Cook screen (7)
Did not realize had to press VIEW AND COOK (4)