1
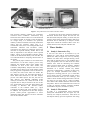
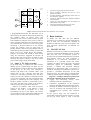
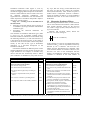
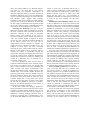
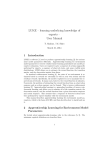
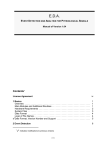
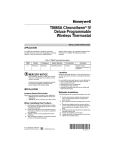
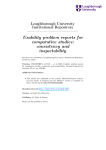
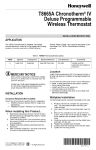
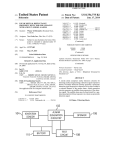
Human-Computer Interaction -- INTERACT'03
M. Rauterberg et al. (Eds.)
Published by IOS Press, (c) IFIP, 2003, pp. 647-654
Managing The Evaluator Effect in User Testing
Arnold P.O.S. Vermeeren1, Ilse E.H. van Kesteren1, Mathilde M. Bekker2
1
Delft University of Technology, Industrial Design Engineering,
Landbergstraat15, NL 2628 CE Delft, The Netherlands.
[email protected]
2
Technical University of Eindhoven, Technology Management, Den Dolech 2,
NL 5600 MB Eindhoven, The Netherlands.
Abstract: If multiple evaluators analyse the outcomes of a single user test, the agreement between their lists of identified
usability problems tends to be limited. This is called the ‘evaluator effect’. In the present paper, three user tests, taken from
various domains, are reported and evaluator effects were measured. In all three studies, the evaluator effect proved to be less
than in Jacobsen et al.'s (1998) study, but still present. Through detailed analysis of the data, it was possible to identify
various causes for the evaluator effect, ranging from inaccuracies in logging and mishearing verbal utterances to differences
in interpreting user intentions. Suggested strategies for managing the evaluator effect are: doing a systematic and detailed
data analysis with automated logging, discussing specific usability problems with other evaluators, and having the entire data
analysis done by multiple evaluators.
Keywords: usability testing methods, evaluator effect, consumer products, children.
1
Introduction
In research on usability evaluation methods as well
as in design practise, user testing is considered one
of the best techniques for getting insights into
usability problems. However, recently a number of
studies have been published that question the
reliability of user test data. For example, in studies
of Molich et al. (1998) and Molich et al. (1999),
multiple usability laboratories (3 and 6 respectively)
were asked to evaluate the same software. The
average agreement on usability problems by two
laboratories proved to be no more than 7%. Molich
et al. (1998) speculate that this limited agreement
may be a result of the different approaches taken to
user testing. In a study by Jacobsen et al. (1998),
four evaluators independently analysed the same
video recordings of four user test sessions. They
found that on average two analysts agreed on only
about 42% of the usability problems they
collectively found. This suggests that the user test
data analysis process itself plays a significant role in
the lack of agreement between analysts as well.
Jacobsen et al. (1998) call this the ‘evaluator effect’.
In the present paper, the evaluator effect is studied in
more detail.
Hertzum and Jacobsen (2001) provide an
overview of eleven studies on the evaluator effect in
relation to user evaluation methods. Three out of the
eleven studies concerned user testing. They analysed
where the usability evaluation methods ‘fell short of
providing evaluators with the guidance necessary for
performing reliable evaluations’. Two out of the
three shortcomings they found directly relate to the
analysis of user test data. These are: vague
evaluation procedures and vague problem criteria.
About the consequences of vague evaluation
procedures they state that: ‘differences in [...]
evaluators’ general views on usability, their personal
experiences with the system under evaluation, their
opinions about it, and so forth, lead them to make
some observations and remain blind towards others’.
In addition, they state that vague problem criteria
lead ‘to anything being accepted as a problem’.
Hertzum and Jacobsen (2001) argue that the
principal reason for the evaluator effect is that
usability evaluation involves interpretation. They
state that ‘although some usability problems are
virtually self-evident, most problems require the
evaluator to exercise judgement in analysing the
interaction among the users, their tasks and their
systems [...]. In general, individual differences [...]
preclude that cognitive activities such as detecting
(a) Jammin” Draw (study 1).
(b) The Honeywell Chronotherm III
thermostat (study 2).
(c) The Philips combined TV-video
recorder (study 3)
Figure 1. The products that were tested in the three studies
and assessing usability problems are completely
consistent across evaluators’. Furthermore, they
believe that the evaluator effect can not be dismissed
as a chance incident, an artefact of the peculiarities
of a single study, or a weakness of a particular
usability evaluation method. Their study made them
realise that the evaluator effect will, to a
considerable extent, have to be managed rather than
eliminated. Hertzum and Jacobsen's (2001)
conclusions were based on comparing set-ups and
outcomes of reported usability studies. Due to the
lack of explicitness in the analyses of the reported
studies, causes of the individual evaluator effects
could not be determined directly from the data, but
were inferred based on comparing characteristics of
the studies.
The present paper examines in more detail how
characteristics of the data analysis process may
influence the evaluator effect. Three studies were
conducted. In each of the three studies, two
evaluators independently analysed the same video
recorded user test data. In one of the studies, a data
analysis approach comparable to that of Jacobsen et
al. (1998) was used. In the other two studies, the
data analysis process was prescribed and done in
much detail and decisions in the data analysis
process were made explicit. For this, the user test
data analysis tool DEVAN (DEtailed Video
ANalysis; Vermeeren et al., 2002) was used. It was
expected that an analysis based on the use of this
tool would suffer less from the shortcomings that
according to Hertzum and Jacobsen (2001)
contribute to the evaluator effect (i.e., vague
evaluation procedures and vague problem criteria).
In addition, the explicitness of the data analysis
process would provide opportunities to better
understand what data analysis activities contribute
most to the evaluator effect.
In section two, the set-ups of the three studies are
described. Section three reports how the user test
data have been analysed. Finally, in section four, the
results in terms of the measured evaluator effects are
described. This is followed by an analysis of what
might have caused the evaluator effect in the two
studies that have been analysed with DEVAN.
2 Three Studies
2.1
Study 1: Interactive Toy
A user test was done on an interactive toy for
children of 5 years and up, named Jammin” Draw
(Mattel Inc. 2003, see figure 1a). It is a toy whereby
children can make music through drawing colour
plates that are placed on the toy. Ten children (age 6
to 8) participated in the test. Data from two of the
children were used for measuring the evaluator
effect. Sessions lasted about 30 minutes. Children
were allowed to first play with the product for a
maximum of 5 minutes without any further
instruction. Subsequently, a number of tasks were
given. For example (translated from Dutch): “I
brought this colouring plate for you. I would like
you to colour it for me. I would like to hear various
musical instruments while you are colouring”, and
“Please choose another background music and tell
me when you are ready with it”. Video recordings
were made of the children and their interaction with
the product. The test was conducted in the context of
a study on assessing usability evaluation methods
with children subjects (van Kesteren, 2003).
2.2
Study 2: Thermostat
In study 2, a programmable home thermostat
(Honeywell Chronotherm III, see figure 1b) was
tested by five subjects (Vermeeren, 1999). None of
the subjects had any previous experience with using
breakdown
interaction
time stamp
0:00:00
0:00:12
2
3
1
log
segments
context
action
description of
task 1
action
interaction
description
0:00:13
action
segment
0:00:19
action
description of
0:00:21
action
interaction
0:00:22
action
segment
0:00:23
action
4
0:00:24
action
0:00:25
action
(verbal utterance)
0:00:44
action
description of
task 2
0:00:46
action
interaction
description
0:00:49
action
segment
0:00:50
action
(verbal utterance)
indications
1
2
code
3
5
4
7
code
5
6
6
code
7
column for logging user-product interaction
primary boundary, indicating the start of a new
interaction segment
secondary boundary, indicating the possible start of a
new interaction segment
column for definitive interaction segment boundaries
and descriptions
column for task descriptions and descriptions of
intermediate level episodes
column for breakdown indication type codes
event marked as breakdown indication
Figure 2. General format for DEVAN’s interaction overview table.
a programmable thermostat. The data from one of
these subjects was used for measuring and analysing
the evaluator effect (a subject who’s task
performance was not too extreme in terms of speed
and breakdowns). Subjects were given 12 tasks on
paper. Sessions lasted about 20 to 25 minutes. Tasks
were formulated as scenarios, in terms of user goals
describing a desired behaviour of the heating
system. For example: ‘You are going away on
holiday and don’t find it necessary that the house is
heated during that time. Make settings such that the
house will not be heated during the holidays’.
Subjects were asked and trained to think aloud,
using the instructions suggested by Ericsson &
Simon (1984). All sessions were recorded on video
(showing the subject’s hands as well as an overall
picture of the subject sitting at the table).
2.3
Study 3: TV-Video recorder
In the third study, a combined TV-video recorder
(Philips type nr. 21PT351A/00, see figure 1c) was
tested with twelve subjects. Data sets of two subjects
of age group 30 –40 years, were analysed to
measure and analyse the evaluator effect. One
subject (user A) was a relatively quiet man, who
worked in a reasonably systematic way. The other
subject (user B) was a talkative woman who seemed
to work less systematic and who experienced many
problems in performing the tasks. Subjects were
asked to perform 38 tasks in a maximum of onehour time. All tasks were related to the product’s
video functions and to general TV functions.
Subjects sat behind a table with the remote
control of the product, a user manual, a quick
reference card and a TV-guide on it. The
experimenter sat next to the subject. All sessions
were recorded on video (showing the handling of the
remote control as well as the TV in front view).
3 Data Analysis
In studies two and three the tool DEVAN
(Vermeeren et al. 2002) was used for analysing the
data. In study one, only DEVAN’s checklist of
breakdown indication types was used. Below, the
most important characteristics of DEVAN are
described.
3.1 The DEVAN Tool
DEVAN (Vermeeren et al. 2002) was developed as
a tool for structured and detailed analysis of video
data from user tests of interactive systems. It
provides clear and detailed data analysis procedures
and detailed criteria for what constitutes a
breakdown in an interaction. Interactions are
transcribed to a specified format that assists
evaluators in making explicit how they interpreted
interactions (figure 2). Additionally, DEVAN
provides a checklist that facilitates detecting
breakdowns in interactions (table 1), as well as a
format for describing the breakdowns. Moreover, it
provides a procedural description of the data
analysis process. Two main stages are distinguished,
consisting of three and two sub stages, respectively:
Stage one - creating a table that represents the
interaction at multiple levels of abstraction:
• logging and transcribing actions, verbal
utterances and non-verbal behaviour;
• preliminary segmentation of the interaction
based on threshold pause times between actions;
• deciding on definitive interaction segments, as
well as clustering and abstracting these to
intermediate-level episodes and task-level
episodes.
At the end of stage one, the interaction is
represented in the format shown in figure 2 (except
for the grey marks (figure 2, item 7) and the
breakdown indication codes (figure 2, item 6),
which are added in stage two). The interaction table
includes all loggings and transcriptions of utterances
and non-verbal behaviour that are used as the basis
for detecting interaction breakdowns. The
segmentation in combination with the abstractions
makes explicit how evaluators interpreted a subject's
interaction with the product.
Stage two - creating a list of breakdowns in
the interaction:
• detecting events that indicate the occurrence of
a breakdown, by using a checklist of breakdown
indication types;
• describing the observed indications for
breakdowns.
The checklist of breakdown indication types (table
1) serves as a list of usability problem criteria.
Detected breakdown indications are described using
the following elements: 1) a time code reference, 2)
a description of the observed event, 3) the context in
which the event occurred (task context and product
mode), 4) the code for the type of breakdown
indication, 5) a free-form description of the
breakdown indication.
It should be noted that at different points in time
multiple indications can exist for the occurrence of a
single breakdown. For example, an evaluator may
observe that the user erroneously selects a button
(first indication of breakdown), may hear the user
Short description
Breakdown indication types based on
observed actions on the product
User chooses wrong action
User discontinues an initiated action
Code
ACT
DISC
User has problem in physically executing an
action
An action is repeated with exactly the same
effect.
EXE
User corrects or undoes a preceding action.
CORR
User stops task, task not successfully finished.
STOP
REP
say ‘oops, that was wrong’ (second indication) and
may then see that the user undoes the erroneous
action (third indication). Thus, another step that is
needed before comparisons between evaluators’
results can usefully be made is to group breakdown
indications that refer to the same occurrence of a
breakdown.
3.2
Measuring Evaluator Effects
For measuring the evaluator effect, several measures
can be used. Hertzum and Jacobsen (2001) discuss
three popular measures. These are: the detection
rate, Cohen’s kappa (Cohen, 1960) and the any-two
agreement measure.
Hertzum and Jacobsen (2001) define the
detection rate as the average of
Pi
Pall
(over all n evaluators).
In this equation, Pi is the set of problems detected by
evaluator i and Pall is the set of problems collectively
detected by all n evaluators. The detection rate
suffers from the drawback that its minimum value
varies with the number of evaluators. Moreover, the
detection rate rests on the assumption that the
number of breakdowns collectively found by the
evaluators is identical to the total number of
Short description
Breakdown indication types based on verbal
utterances or on non-verbal behaviour
User formulates an inadequate goal
User’s seems to be puzzled about what to do
next.
From the user’s words it is clear that actions
are selected at random.
User indicates to be searching for a specific
function and can’t find it, or function does
not exist.
User indicates that physical execution of an
action is problematic or uncomfortable.
User expresses, doubt, surprise or frustration
after having performed an action.
From the user’s words it is clear that a
preceding error is recognised as such, or
that something previously not understood
now has become clear.
User realises that the current task was not
successfully finished, but continues with
next task.
Code
GOAL
PUZZ
RAND
SEARCH
DIFF
DSF
REC
QUIT
Table 1. DEVAN’s checklist of breakdown indication types (short descriptions; for full definitions, see Vermeeren et al., 2002).
breakdowns in the interface. This means that for
small groups of evaluators, the detection rate
becomes overly high. The second measure, Cohen’s
Kappa,
(Cohen, 1960) presupposes a similar
assumption. It assumes that the total number of
breakdowns is known (or that it can reliably be
estimated). For small numbers of evaluators this
typically is not the case. Therefore, Hertzum and
Jacobsen (2001) suggest using the any-two
agreement measure in such cases.
The any-two agreement measure is defined as the
average of
Pi ∩ Pj
Pi ∪ Pj
(over all ½n(n-1) pairs of evaluators).
In this equation, Pi and Pj are the sets of problems
detected by evaluator i and evaluator j, and n is the
number of evaluators. For the studies reported here,
the any-two agreement measure is used.
As one of the units of comparison, the number of
breakdowns is used. In section 3.1 it was explained
how evaluators can use DEVAN to create lists of
occurrences of breakdowns in interactions. In
studies two and three, DEVAN was used to its full
extent; in study one, evaluators only used DEVAN’s
checklist of breakdown indication types (which is
somewhat comparable to Jacobsen et al.’s (1998) list
of usability criteria), as well as a specified format for
reporting the breakdowns (comparable to that of
Jacobsen et al. (1998)).
In Jacobsen et al.’s (1998) study, Unique
Problem Tokens (UPTs) were chosen as units of
comparison. In their study, each evaluator's problem
report (problem reports are comparable to
breakdown descriptions in DEVAN) was examined
as to whether it was unique or duplicated. Thus, a
final list of UPTs was created. To be able to
compare the present studies’ evaluator effects to the
evaluator effect Jacobsen et al. (1998) found,
duplicate breakdowns were filtered out. Breakdowns
had to be similar in much detail (in content as well
as in level of abstraction) for being considered
duplicates. For example, the breakdown “user is
puzzled about how to get a still image” is considered
different from (the more concrete, but similar
breakdown) “user tries <stop> to get a still image”.
Also, in its detailed content, the breakdown: “user
uses <cursor down> instead of <cursor right>
while trying to set a menu-item” is different from
“user uses <cursor down> instead of <cursor left>
while trying to set a menu-item”. Thus these are
regarded as unique breakdowns.
4 Results
Table 2 shows the evaluator effects that were found
in the three studies, as well as the evaluator effect
found by Jacobsen et al. (1998). The evaluator
effects were measured in terms of occurrences of
breakdowns as well as in terms of UPTs. Of the
three studies reported in this paper, the data analysis
process of study one (the Jammin” Draw study)
compares best to that of Jacobsen et al. The study
seems to yield somewhat higher agreements than
Occurrences of Breakdowns
detected
Any-two
detected
in total
agreement
by both
evaluators
Study 1: Jammin" draw user A (n=2)
Jammin" draw user B (n=2)
Study 2: Thermostat (n=2)
Study 3: TV video user A (n=2)
TV video user B (n=2)
Jacobsen et al. (1998):
Multimedia authoring software (n=4)
8
9
30
43
66
15
15
49
54
110
53%
60%
61%
80%
60%
Unique Problem Tokens (UPTs)
detected
Any-two
detected
in total
agreement
by both
evaluators
8
9
21
26
42
15
14
33
32
61
27*)
39**)
93***)
53%
64%
64%
81%
69%
42%
Table 2. Overview of measured evaluator effects. As a measure for the evaluator effect the ‘Any-two agreement’ as
proposed by Hertzum and Jacobsen (2001) is used. Its value ranges from 0% in case of no agreement to 100% in case of
full agreement; n signifies the number of evaluators.
*)
Average number of UPTs found by two evaluators based on data from one user. This figure compares best to the figures
of study 1, 2 and 3.
**)
Average number of UPTs found by two evaluators based on data from four users.
***)
Number of UPTs found by four evaluators based on data from four users.
Jacobsen et al.’s (1998) study, but the evaluator
effect is still considerable. Hertzum and Jacobsen
(2001) stated that the evaluator effect persists across
differences in system domains, as well as in system
complexity (amongst other variables). Clearly,
Jammin” Draw is from an entirely different system
domain (and user group) than the multimedia
authoring software that Jacobsen et al. (1998)
evaluated. Considering the total number of UPTs
found, the complexity of the Jammin” Draw
interface most likely is less than that of the
multimedia authoring software used by Jacobsen et
al. (1998). Thus, comparing Jacobsen’s study to the
Jammin” Draw study seems to support Hertzum and
Jacobsen’s statement that the evaluator effect
persists across various situations.
Like study one, studies two and three are from
different system domains. In these studies, the data
analysis process was expected to suffer less from the
shortcomings that Hertzum & Jacobsen (2001)
considered being major contributors to the evaluator
effect. However, even here considerable evaluator
effects were found, although less than in the other
studies.
In section 4.1, the evaluator effects of studies
two and three are analysed in more detail: using the
representations created with DEVAN it is analysed
during which data analysis activities differences first
occurred. Suggestions are made for how to manage
the evaluator effect.
4.1
The Evaluator Effect Analysed
In studies two and three a total of 126 UPTs were
detected. 37 out of the 126 UPTs were listed by no
more than one evaluator. Below, the differences in
the lists of UPTs are analysed. Five main groups of
causes emerged during the analysis of differences,
these are related to: 1) interpreting verbal utterances
and non-verbal behaviour, 2) guessing user
intentions, 3) judging to what extent inefficiencies
or redundant actions are considered problematic, 4)
distinguishing usability problems from problems of
the test, and finally 5) inaccuracies in doing the
analysis. Below, these categories are discussed in
more detail.
Interpreting verbal utterances and non-verbal
behaviour: For 14 out of the 37 differences, the
only indications used to detect the UPTs were verbal
utterances or non-verbal behaviour. In nine of these
cases, only one evaluator had recorded the utterance
or non-verbal behaviour. Missed events included,
for example, frowning, a subject visually scanning
an interface panel, and verbal utterances that
indicate ‘puzzlement’. In case of the other five
UPTs, both evaluators had transcribed the utterance
or behaviour, but differed in what they had heard or
decided differently on whether this indicated a
problem or not.
Most of the cases mentioned above concerned
utterances or behaviour that indicated ‘puzzlement’
(code PUZZ, in DEVAN’s checklist, see table 1). It
seems that especially for this type of indications it is
difficult to interpret whether the observed event is
significant enough to record or interpret as
indication of a breakdown.
A closer look at the 14 UPTs suggests that this
problem may be less disconcerting than the figures
seem to indicate. In case of eight out of the 14
UPTs, closely related UPTs (of a different level of
abstraction) were found in addition to the indication
of puzzlement. For example, one of the UPTs
concerned puzzlement about how to use the timer
menu for scheduling the video recorder to record
something ‘tomorrow’. After having expressed her
puzzlement, the subject went through all menu-items
without setting anything. She expressed her
frustration about ‘how difficult the thing is’, and
subsequently ran into a number of problems while
setting the items in the menu. Almost all of these
UPTs were detected by both evaluators. Thus, the
interaction directly following the puzzlement,
clearly revealed that to the subject it was not
immediately clear how to schedule the video
recorder, and missing the ‘puzzlement’ UPT, would
not lead to different conclusions as compared to
having detected it.
In six cases, the UPTs that were missed by one
of the evaluators were not followed by closely
related UPTs. Two of these concerned brief
instances of puzzlement in the beginning of a task,
which were quickly followed by trouble-free and
smooth task performance. Thus, these UPTs do not
seem to be very significant. Four out of the six UPTs
were really unique, and provided new insights. For
example, in one case the user was trying to remove a
menu from the TV screen. The menu indeed
disappeared and the screen changed from showing
video images to showing TV images. However, due
to the response time of the TV screen, the screen
was black for a moment. This confused the user and
made her conclude that ‘the whole thing’ did not
function anymore. Although one could argue about
the severity of this problem, it is a usability problem
that was missed by one of the evaluators.
Summarising, it seems that in only four out of
the 14 cases, differences in the evaluators’ lists of
UPTs contained unique and potentially important
information. On the other hand it should be realised
that in the present studies a very thorough analysis
was done. It is very likely that in a less explicit
analysis, with less systematic transcription of
utterances and which lacks an extensive checklist of
breakdown indication types, many more differences
may be expected in this category of causes. Hertzum
and Jacobsen (2001) suggest using multiple
evaluators to gain better insights into what usability
problems may occur in an interaction. It seems that
for this category of differences this approach would
not be very efficient. Doing a detailed and explicit
data analysis would probably be more efficient.
Guessing user intentions: Five out of the 37
differences in UPTs related to problems in guessing
the users’ intentions. This concerned two levels of
intentions: intentions at the level of individual
button presses and intentions at the level of
sequences of button presses. In three out of the five
cases, the intention behind a sequence of button
presses was clear, whereas the intention behind one
of the button presses was not. This led to
disagreement between evaluators on whether the
single button press indicated a problem or not. For
example, in study three, one UPT concerned
reducing the TV’s sound volume with the ‘minus’
buttons on the remote control. Typically, subjects
reduced the volume by repeatedly pressing the
minus button and then pressing the plus button once
to raise the volume a little. Evaluators disagreed on
whether this signified an overshoot in reducing the
volume or a deliberate way of searching for a
convenient volume level.
On a more global level, there were two cases in
which the intention behind a series of button presses
was unclear. For example, in one case during study
three, a subject needed a menu for scheduling the
video recorder. The subject systematically went
through all available menus, finally arriving at the
needed menu. It was unclear whether the user was
inspecting each menu to find out whether it was the
menu she needed, or whether she was just exploring
all menus to learn about them for later use. If an
evaluator thinks that a wrong menu was opened
because the user expected it to be the correct menu
for the task, this should be counted as a problem.
However, if a menu is opened just to learn from it, it
should not be counted as a problem.
In all cases within this category, differences
between evaluators’ lists of UPTs seem to have been
caused by evaluators having different views on the
specific intentions of the users. For this category of
differences, involving multiple evaluators seems a
useful way of getting new or complementary views
on the same data. Different views on intentions can
coexist in such cases, as deciding which view is
valid is seriously hindered by a lack of information
about ‘what went on inside the user’s head’. Thus,
another approach could be to gather more data
during the test itself (e.g., eye movements or
additional verbal data from retrospective interviews)
in order to get more insights into the user’s
intentions.
Inefficiencies and redundant actions: Five out
of the 37 differences in UPTs were caused by the
fact that in some cases evaluators differed in judging
whether an inefficiency in the interaction should be
regarded as problematic or not. In case of three
UPTs, the inefficiencies concerned ‘unnecessary but
harmless’ actions, like pressing a rewind button
while the recorder had already started rewinding
(“just to be sure”). In case of two out of the five
UPTs, the inefficiency did not concern an individual
button press, but the choice of an inefficient strategy
for performing a task. In both cases, the user was
asked to cancel a scheduled recording (which could
be done with a single button press). However, the
user’s strategy was to set both ‘start time’ and ‘stop
time’ to ‘0:00’. Evaluators decided differently on
whether this should be regarded as a problem or not.
In all five cases, both evaluators had indicated to
be unsure about how to treat these cases and realised
that other evaluators might treat them differently. In
the development of DEVAN, evaluators had already
run across this problem and it had been tried to solve
this problem by defining more specific usability
criteria. However, this did not seem to work. To
resolve issues like these, it would probably suffice to
discuss with other evaluators the specific instances
of problems about which an evaluator is unsure.
Test or usability problem? In five out of the 37
cases it was clear that there was a problem, but it
was unclear whether it should be regarded as a
usability problem or as a problem introduced by the
test itself. For example, in three out of the five cases
the observed process of scheduling the thermostat or
video recorder was technically correct, but a wrong
value was entered for one of the settings (a wrong
temperature and wrong dates, respectively). In these
cases it was not clear whether the problem was
caused by problems in memorising the task, or
whether subjects really believed they had to set the
chosen value to successfully perform the task.
In two out of the five cases, there were problems
that related to interference of the experimenter
during the test. For example, in case of one task in
the TV video recorder test, the subject was asked to
tell how many TV programs she had scheduled to be
recorded. As the subject had not succeeded in
properly scheduling the video recorder, nothing was
scheduled (although she believed she had been
successful). In looking up how many programs she
had scheduled, the subject was not able to
understand the timer menu well enough to conclude
that nothing was scheduled. After some time, the
experimenter implicitly suggested the answer to the
subject, who then gave the right answer. Evaluators
decided differently on whether this should be treated
as a problem or not.
Like in the previous category, both evaluators
indicated to be unsure about how to treat such
problems. To resolve issues like these, it would
probably suffice to discuss the views of other
evaluators on specific instances of such problems.
Inaccuracies of the evaluator: Eight out of the
37 differences in UPTs were caused by inaccuracies
of the evaluators during the analysis. For example,
in three out of the eight cases, button presses were
not accurately logged. In two cases, one evaluator
had observed that a user repeatedly pressed a button,
whilst the other had only seen one long button press.
In the third case, a button was not properly pressed
and its function was not activated; one evaluator
failed to notice this. In one out of the eight cases, a
subject forgot to confirm settings that she had just
made. Again, one of the evaluators had not noticed
this. In yet another case, one evaluator had forgot to
copy a breakdown indication from DEVAN’s
interaction table to the list of breakdown indications.
Finally, in three cases, the difference was caused by
vagueness in the description of when to record
events as breakdown indications of type ‘GOAL’
(see table 1). This only happened in study two. In
study three, the definition of breakdown indication
type ‘GOAL’ was improved and the problem did not
occur again.
Most likely, doing a systematic and detailed data
analysis and automated logging would reduce
evaluator effects caused by inaccuracies of the
evaluator.
5. Discussion and Conclusion
The results of the present studies show that the
evaluator effect is a phenomenon that is found in
various system domains and with systems of varying
complexity. Insights were gained in possible causes
of the evaluator effect. Identified causes lay in
differences in interpretations of verbal utterances
and non-verbal behaviour, in guessing user
intentions, in decisions regarding how problematic
inefficiencies in the interaction are, in distinguishing
usability problems from problems introduced by the
test set-up itself and in inaccuracies in doing the
analysis. Suggested strategies for managing the
evaluator effect are: 1) conducting a systematic and
detailed data analysis with automated data logging,
to minimise errors in logging and in making
transcriptions, 2) discussing with other evaluators
the specific problems about which an evaluator is
unsure (e.g., in case of inefficiencies in interactions
or problems that might have been caused by the test
set-up itself), 3) having the analysis done by
multiple evaluators so that multiple views on user
intentions can be gathered.
References
Cohen J., 1960. A Coefficient of agreement for nominal
scales.
Educational
and
Psychological
Measurement, Vol. XX, No. 1, pp. 37 - 46
Ericsson K.A., Simon H.A., 1984. Protocol Analysis:
verbal reports as data. Cambridge Massachusetts:
MIT Press, pp 376-377.
Mattel Inc., http://www.fisher-price.com/us/ (14 January,
2003)
Hertzum M., Jacobsen N.E., 2001. The Evaluator Effect:
A Chilling Fact About Usability Evaluation
Methods. International Journal of HumanComputer Interaction, 13 (4), 421-443.
Jacobsen, N.E., Hertzum M. and John B.E. 1998, The
evaluator effect in usability tests, in Proceedings of
the conference on CHI’98, Summary: Conference
on Human Factors in Computing Systems (Los
Angeles, April 18-23) (ACM, New York), 255-256.
Molich R., Bevan N., Curson I, Butler S., Kindlund E.,
Miller D. and Kirakowski J., 1998, Comparative
evaluation of usability tests. In Proceedings of the
Usability Professionals Association 1998 (UPA98)
Conference, Washington D.C. USA, June 25-26,
1998.
Molich R., Damgaard Thomsen A., Schmidt L., Ede M.,
Oel W. Van and Arcuri M 1999, Comparative
evaluation of usability tests, in Proceedings of
CHI’99, extended abstract, 83-84. Data available at
http://www.dialogdesign.dk/cue.html (last verified
September 2002)
Van Kesteren I.E.H., 2003. Usability Evaluation Methods
with Children. Master’s Thesis, Delft University of
Technology, Faculty of Industrial Design
Engineering.
Vermeeren, A.P.O.S. 1999, Designing scenarios and tasks
for user trials of home electronic devices, in W.S.
Green and P.W. Jordan (eds.) Human Factors in
Product Design: Current Practice and Future
Trends, (Taylor & Francis, London), 47-55.
Vermeeren A.P.O.S., den Bouwmeester K., Aasman J., de
Ridder H., 2002. DEVAN: a tool for detailed video
analysis of user test data. Behaviour & Information
Technology, 21 (6), 403-423.