1
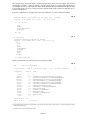
& denotes fractional leaves.
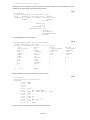
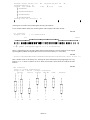
Stemleaf-plots can be adapted for other purposes, for instance comparison of the distributions of two
variables on the same display, showing them back to back.
Ex.7
30 countries
Stemleaf:LifeEM(6) Life Expectancy (men)
with
:LifeEF(7) Life Expectancy (women)
Legend: 68|0 stands for 68.00; 82|0 for 83.00
LifeEM
LifeEF
|lo |TURQ
000000|
00|
000000000|
0000000000000|
|
|
|
|
68|
70|
72|
74|0
76|0000
78|00000000
80|000000000000
82|0000
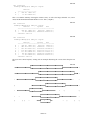
or to study differences between groups...
Ex.8
Stemleaf:GNPAgr(20) %GNP for Agriculture
Groups defined by Continents
Legend: 0|0 stands for 0.00;
5|5 for
Asia
Africa
0|0111112234
|34
0|55778
|55567
1|01
|1224444
1|6899
|566
2|123
|111112
2|5567
|577
3|24
|011344
3|9
|567
4|12
|3444
4|
|5555677
5|11
|01123
5|
|5
hi
|(* 4)
|GNEQ
55.00
Europe
|1123333334444
|55666788
|134
|667
|03
|
|3
|
|
|
|
|
N&C.Am
|1122233444
|5667899
|134
|666999
|124
|
|03
|
|
|
|
|
|
|
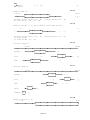
The next example is a histogram showing case ids as “leaves”.
Ex.9
30 countries
Histogram:Urb(5) Urbanization
midpoint
32.50 | PORT
37.50 | ALBA
42.50 |
47.50 |
52.50 | ROUM
57.50 | A
IRLA GREC HNGR
62.50 | TURQ CH
POLO CHYP FI
67.50 | BULG
72.50 | N
I
F
77.50 | TCHE LUX
82.50 | LIE S
87.50 | DK
MALT UK
NL
92.50 | ISLA D
E
97.50 | B
MONA
AND
The next series of examples shows various numerical summaries
-EDA 1.3 -