1
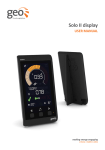
Solo III User manual Solo III | User manual Welcome to geo’s energy management service. You’ve taken that all important first step towards complete control of your home energy use. Your Solo III will help you manage and visualise your energy – helping you on the way to optimise efficiency and maximum cost savings. In this manual you’ll find everything you need to quickly and simply set up and start using your display. You’ll also find out more information about how the monitor works, how it can help you and how you can identify ways to save energy (and money). Safety information J Do not fit rechargeable batteries j Keep the Solo III away from water and other liquids. Clean only with a dry, soft cloth. If any components appear damaged or faulty, please contact your utility L For use in a dry, indoor environment only N To protect the environment, these products and any batteries must be disposed of safely at the end of their life. Please take to a recycling centre for safe disposal MRoHS compliant O CE approved J Please only use the power supply provided 2 IMPORTANT SAFETY NOTICE IMPORTANT SAFETY NOTICE jj • • • • • • • The following safety regulations must be observed at all times. Failure to observe precautions could result in severe injury or death. This equipment contains two disconnection switches for interruption of supply that do not provide supply isolation. Means of isolation from the supply must be provided as part of the building installation. Do not work on the equipment unless the supply is isolated. If isolation is made by removal of fuses or other cut-outs, the removed devices must be kept secure from replacement whilst work is performed. If isolation is provided by a switch, the switch must conform to the requirements of IEC 947-1 and IEC 947-3 or equivalent. Over-current protection is not provided by the equipment and must be provided as part of the building installation. For the domestic supply the maximum over-current device rating is 100A at 415V AC, conforming to the requirements of BS1361 or equivalent. Only suitable trained and qualified personnel shall be allowed to work on the equipment. Local safety standards shall be observed and shall take precedence over these regulations in points of conflict. The meters must be held securely during installation. They can cause injury if dropped. Meters that have fallen must not be installed. Even if no damage is apparent, meters must be returned to the manufacturer for testing. Internal damage can result in functional disorders or short-circuits. The meters must only be cleaned whilst disconnected and with a dry cloth without solvent and on no account be cleaned with running water or with high-pressure devices. Penetrating water can cause internal short-circuits. A terminal cover protects inadvertent exposure to the meter tail connections and must be fitted prior to energising the electrical supply. 3 Solo III | User manual CONTENTS IMPORTANT SAFETY NOTICE 3 CONTENTS4 CONTENTS OF YOUR SOLO III 5 METER6 HUB (OPTIONAL)7 SOLO III DISPLAY (OPTIONAL)8 ABOUT THE SOLO III 9 SETTING UP PAIRING THE HUB TO THE TWIN ELEMENT METER10 PAIRING THE OPTIONAL DISPLAY TO THE HUB11 PAIRING THE OPTIONAL DISPLAY DIRECTLY TO THE METER WITHOUT HUB12 USING THE DISPLAY 13 DISPLAY BUTTON FUNCTIONS 14 DISPLAY MODES 15 DISPLAY INFO & SETTINGS 17 READING YOUR DISPLAY ICONS19 SETTING TARIFFS 20 ENERGYNOTE21 ASSOCIATING SOLO III SYSTEM WITH ENERGYNOTE22 4 ENERGYNOTE EXPLAINED23 ENERGYNOTE SETTINGS OPTION24 ENERGYNOTE ANALYSIS25 FAQS26 TECHNICAL REFERENCE 27 CONTENTS OF YOUR SOLO III CONTENTS OF YOUR SOLO III Your Solo III kit contains the following items: Meter • MID approved twin element meter Hub (optional) • Power supply • Ethernet cable Display (optional) • Power supply 5 Solo III | User manual METER Buttons & LEDs The red and green LEDs on the upper section of the meter indicate that it is transmitting information to the hub Reading the meter You may be required to record the total generation from your Solar PV system About the meter Locate the meter The twin element meter connects to both the PV system and the consumer unit to allow the Solo The meter will typically be located near the main electricity meter for your home and close to where your fuses or trip switches are located. III system to measure generation, import, export and consumption via a low powered radio link. Note down the reading Using the generation, consumption and export information, the energynote® platform and optional Solo III display can show you this detailed information in both energy and cost. The meter measures active and reactive energy consumption in single phase two wire installations. See the separate energynote® and Solo III display Quick Reference Guides for further information. 6 As shown in the example below, the meter will only show the total generation for your Solar PV system in kWh (kilowatt-hours) The figure is shown with hundredths of kWh, so the reading in the example is 1,273.85 kWh. EXP or IMP indicate if exporting or importing hub (optional) HUB (OPTIONAL) Overview About the hub The hub connects.the meter to the internet and allows the user to view their generation, import, export and consumption data online using their smartphone, tablet or computer. AA B B C E D It is important that the hub is powered on at all times to ensure that all the generation and consumption information is kept up to date. A link button (f) and status light It is also recommended that the hub is permanently connected to your broadband connection. C Ethernet socket Buttons & LEDs B cloud button (g) and status light D Power socket E USB (not used) The link (f) and cloud (g) buttons are used during the setting up of your Solo III system. All of the components of your system have been connected together during installation, so you do not normally need to use the buttons. The lights indicate the health of the system. 7 Solo III | User manual SOLO III DISPLAY (OPTIONAL) About the optional display Your Solo III display will help you understand just how much electricity your solar PV system is generating, how much your house is using and whether there is any electricity being exported to the grid. Signal strength Signal quality to the hub Cloud energynote® connected Speedometer Shows how much is being generated, consumed, exported or imported now. The digits show the value in kWh. (Only shown when in usage view.) Usage totals Choose between GEN (generation), USE (house consumption), IMP (amount being used from the grid) and EXP (amount being exported to the grid). All values are shown in kWh. Generation available Green bars g mean you are currently exporting. Now is the time to use cheaper energy. Temperature Current temperature where the display is located Cost totals Select between SAVE (savings), COST (cost of import) and EARN (earnings from export). Importing Red bars g mean you are currently importing. This is the most expensive electricity. Buttons c changes the total being shown, e changes the time period and d switches between usage and cost views. FURTHER INFORMATION ON THE DISPLAY CAN BE FOUND ON PAGES 19-20 8 About the solo iii ABOUT THE SOLO III The Solo III PV is designed for installers looking for a hassle-free installation, reliable meter accurate information and an engaging user interface for the end user. The Solo III picks up and displays generation, import and export information helping you get the most out of your Solar PV system. The system uses our geo energynote® online service and an optional in-home display. The Solo III can be installed either as a standalone system connected directly to the twin element meter or as part of a connected system with a hub. Features & Benefits • • • • • • Works independently of the inverter and compatible no matter what invertor you specify. The geo MID approved twin element meter records generation, import and export, the display then works out the usage. No additional sensors required, the meter talks directly to the display. • • • • The hub pushes all data continuously to geo’s online service which allows the user live access from their smartphone, tablet or PC. • Meter accurate information sent wirelessly to the geo hub and display. • Compatible with 1-20kW PV arrays – single phase only. Optional display indicates when to switch on appliances based on precise export levels. Shows when you are importing and when you are exporting. Shows FIT earnings and savings by using your generated energy and deeming amounts. Monitor electricity bills to ensure there is no over-charge from utility company. Simple and engaging online energynote® service. Live and historic information via smartphone, tablet and PC. Trends and analysis data download available free for the first year. * 9 Solo III | User manual SETTING UP PAIRING THE HUB TO THE TWIN ELEMENT METER 1. Once the installer has wired in your new twin element meter using the wiring diagram below, power on the hub and connect it to your internet modem using the Ethernet cable provided. (Please refer to the installer guide for more info on installing the meter.) Twin-element meter Utility meter Element A Element B 5 LOUT 4 B D C NOUT NIN LIN Utility supply (C) Connect L from utility meter to terminal 4 (D) Connect L from PV MCB / isolator to terminal 5 (E) Connect L from consumer unit to terminal 1 A 16A MCB Consumer unit 3 100A isolator E 2 (B) Connect N to either terminal 2 or 3 20A isolator 1 (A) All N wires can be connected together PV inverter 2. Once the hub is connected to the internet it will perform an automatic software update, you will see two flashing green lights to indicate that the hub is going through an update, this can take around five minutes to complete depending on your internet speed. Once the hub has updated and is ready to pair with the meter, the status LEDs will show the following: Link LED (f) is RED - Cloud LED (g) is AMBER 3. Press and hold the button on the front of the meter for five seconds then release, you should see the word “Pairing” on the LCD of the meter. 4. Press and hold the link button on the hub until the LED flashes amber. 5. The hub link LED should turn green as soon as it pairs to the twin element meter. 10 Pairing the optional display to the Hub PAIRING THE OPTIONAL DISPLAY TO THE HUB 1. Power on the display using the power supply provided. 2. Once the display powers on it will show “PAIR HUB?” (If the display fails to show “Pair hub” or has been previously paired to a hub then you will need to carry out a reset, to do this refer to the troubleshooting page 27). 3. Press the left button (y) on the display for “yes”. 4. Press and hold the link button on the hub until the status LED flashes amber (If you fail to press and hold the link button within 60 seconds of pressing “yes” on the display you will see “HUB FAIL” displayed on the screen and then return to the start) 5. Display should now read “HUB OK” and show live reading on the screen. 6. The figure is shown with hundredths of kWh, so the reading in the example is 1,273.85 kWh. Pairing flow diagram Power on Solo III display PAIR HUB NO on screen? Perform factory reset of display YES Press left button () within 5 minutes Press and hold link button (A) on the hub until the status LED (f) flashes amber NO HUB OK on screen? YES Display is now paired and ready 11 Solo III | User manual PAIRING THE OPTIONAL DISPLAY DIRECTLY TO THE METER WITHOUT HUB Follow the steps below if you do not have the optional hub 1. Power on the display using the power supply provided. 2. Once the display powers on it will show “PAIR HUB?” (If the display fails to show “Pair Hub” or has been previously paired to a hub then you will need to carry out a reset, to do this refer to the troubleshooting on page 27). 3. Press the right button (n) on the display for “No”. 4. Press and hold the button on the front of the meter for 5 seconds then release, you should see the word “Pairing” on the LCD of the meter. 5. Enter the pair code using the left and right buttons and press the middle button to move to the next step, the code can be found on the top of the meter (e.g. ABC123). 6. Once you confirm the code the display should read “PAIRING MTR” followed by “METER OK”. If the verification fails, then the words ‘METER FAIL’ shall be shown for five seconds and the user is returned to the ”PAIR HUB?” screen. Pairing flow diagram Power on Solo III display screen shows YES PAIR HUB Press right button () NO Press and hold the button on the front of the meter until is shown The display is paired to a meter already - perform a factory reset within 5 minutes Enter the pair code on the display using the left and right buttons and press the middle button to move to the next step METER FAIL PAIRING MTR NO METER OK on screen? 12 YES Display is now paired and ready Using the display USING THE DISPLAY The Solo III display will immediately start to show live generation and consumption readings taken directly from the twin element smart meter. Pressing the left button will cycle through the following screens: • • • • GEN TODAY Total generation from the PV system for today USE TODAY Total usage for the whole house for today IMP TODAY Total amount of energy imported from the grid for today EXP TODAY Total amount of energy exported to the grid for today Pressing the right button will change between TODAY, Y’DAY (yesterday), THISWK (this week), LSTWK (last week) and this and previous month (e.g. AUG, JUL). Pressing the middle button will also show SAVE for savings based on energy that has not been imported from the energy supplier, COST for total cost charges from the energy supplier and EARN for earning from the PV system. $$ After a new installation all the readings will start from zero and start to increment from the point at which the Solo III and hub are first paired. When associated with energynote®, all data will be reset. 13 Solo III | User manual DISPLAY BUTTON FUNCTIONS The three buttons have the following functions: Left button The left button allows the user to move through the historic totals: Period Screen words Info Today TODAY The cumulative kWh from 00:00 today to now Yesterday Y'DAY The total kWh for yesterday from 00:00 to 23:59 This week THISWK The cumulative kWh of consumption from 00:00 on the preceding Monday Last week LASTWK The total kWh for last week, from Monday 00:00 to Sunday 23:59 This month MAY 3 letters month name The cumulative kWh for the current month, from 00:00 on the 1st day of the month Last month APR 3 letters month name The total kWh for last month, from 00:00 on 1st of the month to 23:59 on the last day of the month Middle button The middle button allows you to switch to the COST screens, showing the same period as currently selected in the NOW screen. (for example, if viewing GEN THISWK, pressing the middle button will show SAVE THISWK). Right button The right button allows the user to move between the four NOW screens, keeping the same period. 14 Display modes DISPLAY MODES The display has the following modes for showing live and historic information, shown on the upper dial. SLEEP • This puts the LCD to sleep and uses the LED indicator on the left side of the display to show if the system is exporting or importing. green LED indicates export and red LED indicates import. Import description: • NOW • • • • Generation (from solar array) Consumption (energy being used by the home) Import (amount being imported from the grid / utility) • • COST Savings • Cost of import • Income (if generation or export rate has been set) This can be used to understand if the appliances can be switched off to protect themselves from the costs of import. Export description: Export (amount being exported to the grid) • This screen shows the current difference between generation and consumption, showing if the home is consuming more than it is generating. It will only show kW and kWh and is updated as soon as the new data is received from the smart meter. • This screen shows the current difference between generation and consumption, showing if the home is generating more than it is consuming. It will only show kW and kWh and is updated as soon as the new data is received from the smart meter. This can be used to understand how much available energy there is to use to benefit from the generation and the savings. 15 Solo III | User manual DISPLAY MODES The display has the following modes for showing live and historic information, shown on the upper dial. Generation description: • This screen shows the current output from the PV array. It will only show kW and kWh and is updated as soon as the new data is received from the meter / hub. Cost description: • Calculation Cost is calculated on an on-going basis as: Cost = imported kWh * Tariff Consumption description: • This screen shows the current consumption of the home. It will only show kW and kWh and is updated as soon as the new data is received from the meter / hub. Savings description: • This shows the savings that have been made by using self-generated electricity as opposed to off-grid electricity. Calculation This is calculated on an on-going basis as: Savings = min (generation kWh, consumption kWh) * Tariff 16 This shows the cost that has been incurred using off-grid electricity. Income / earnings: • This shows the cumulative earnings that have been generated by the PV system. This is the summation of generation and export tariffs. Display info & Settings DISPLAY INFO & SETTINGS From any of the NOW or COST screens, a long press of the middle button will allow you to enter the settings screens. The settings are split in to two sections, [INFO] and [SETTINGS], pressing the left or right button will cycle between the two. After 30 seconds of no use, the display will return to the previous NOW or COST screen. Info: The info screens are read only and are accessed sequentially by pressing the middle button. At the end of the list, the middle button will allow you to return to the previous NOW or COST screen. The following information will be available in the INFO settings: Info Title Description Sample Local time TIME Local time from the network in 24hour format 14:33 DST active DST Whether daylight saving time is active or inactive OFF Active import tariff IMPORT TRF Current active TOU import tariff £0.185 Standing charge STAND CHG Current standing charge, if set £0.20 Active export tariff EXPORT TRF Current export tariff rate £0.15 GEN TRF Current generation tariff £0.10 Active generation tariff 17 Solo III | User manual DISPLAY INFO & SETTINGS Settings: The user can configure the following settings: the value shall flash (0.5s on/off) and pressing the left button will decrement and the right button will increment. Pressing the middle button will confirm and change the setting. At the last setting, the middle button will return the user to the previous NOW or COST screen. The following settings are possible: Info Title Description Increment Sample DST active DST Set DST to be ON or OFF - ON Tariff 1* TARIFF1 Tariff 1 cost £0.001 £0.122 Tariff 2* TARIFF2 Tariff 2 cost £0.001 £0.000 Tariff 2 start time* TARIFF2 ON Starting time for tariff 2 - only visible if tariff 2 is greater than zero 00:15 22:00 Tariff 2 end time* TARIFF2 OFF End time for tariff 2 00:15 6:00 Tariff 3 TARIFF3 Tariff 3 cost, only visible if tariff 2 is greater than zero £0.001 £0.000 Tariff 3 start time* TARIFF3 ON Start time for tariff 3 - only visible if tariff 3 is greater than zero 00:15 00:00 Tariff 3 end time* TARIFF3 OFF End time for tariff 3 00:15 00:00 Standing charge STANDING CH Daily standing charge £0.001- £0.000 Currency CURRENCY Configuration of the currency from the available units (£, €, $, kwd, kr) - £ Display off DISPLAY OFF Time for the display to be switched off 00:15 22:00 Display on DISPLAY ON Time for the display to be switched on 00:15 06:00 * = Only visible if no hub present 18 READING YOUR DISPLAY ICONS READING YOUR DISPLAY ICONS Gen - Cons: >=2kW >=1kW >=500W >=50W Cons - Gen: >=2kW >=1kW >=500W >=50W Signal strength Gen - Cons: >=2kW >=1kW >=500W >=50W Cons - Gen: >=2kW >=1kW >=500W >=50W The signal strength icon shows the quality of the radio connection to the optional hub or meter depending on what it is connected to. Cloud Gen - Cons: >=2kW >=1kW >=500W >=50W Cons - Gen: >=2kW >=1kW >=500W >=50W When the cloud icon is on solid without flashing it means that the Solo III display is paired to the hub and connected to the internet. When the cloud icon is flashing it means the Solo III display is paired to the hub but not connected to the internet. This is because the hub is not connected to the broadband router or the hub is failing to receive internet connection. If the service is down (energynote®/internet) for 12 hours or longer then “CLOUD ERROR” will appear on the screen. Pressing a button will suppress the message for a further 12 hours. Please note: If you do not have the optional hub the cloud icon will not appear on the Solo III display. Gen - Cons: >=2kW >=1kW >=500W >=50W Cons - Gen: >=2kW >=1kW >=500W >=50W Temperature This represents the current temperature where the display is located. Gen - Cons: >=2kW >=1kW >=500W >=50W Speedometer The import / export bars indicate if the home is exporting or importing electricity to indicate if there is excess generation that can be used in the home. Segment index (n) Step per segment (kW) Segment count Cumulative (kW) 1 0.005 1 0.005 2 to 20 0.05 19 1.0 21 to 35 0.50 15 8.5 36 to 40 2.50 5 21.0 Import / export bar Gen - Cons: >=2kW >=1kW >=500W >=50W Cons - Gen: >=2kW >=1kW >=500W >=50W The import / export bars indicate if the home is exporting or importing electricity. If there is excess generation that can be used in the home, then it will show the green LED, if more than 50W is being imported, then this will change to the red LED. Cons - Gen: >=2kW >=1kW >=500W >=50W LED indicator The LED indicates if the home is exporting or importing, If more than 50W is being exported. I Threshold icon This lights up when you are generating enough power to run a heavy load appliance (e.g. your tumble dryer or washing machine). 19 Solo III | User manual SETTING TARIFFS Please note: you will only get the following options if your display is directly paired to the twin element meter without the hub. If you have the optional hub you will need to enter the tariff settings on energynote®. Refer to page 25 for further information. The Solo III display can work with single energy tariff (same charge throughout the day) and also dual rate tariff (where the charges vary between day time and night time), If the energy supplier does not provide this information on the bill, then the tariff(s) and standing charge (if charged by the supplier) can be worked out by the following simple Entering the tariff To enter the tariff information on the display, do the following: • • • • equations: Tariff = (charge for period in £ / energy used during period in kWh) Press the right button until SETTINGS is shown and then press the middle button. Repeatedly press the middle button until TARIFF1 is shown. Use the left and right buttons to decrease and increase the tariff and then press the middle button to store the value. If using more than one tariff, enter the night–time rate first. • Daily standing charge = (charges for period in £ / number of days in the period) • • 20 Press and hold the middle button on the display. If there is more than one tariff, enter the second tariff in TARIFF2 settings menu. If there is no second tariff leave it as £0.000. Enter the start time and end time for the tariff. Finally, enter any daily standing charge. Press the middle button to complete setting the tariff. energynote® ENERGYNOTE® Register and create your account now www.energynote.eu/ What is energynote®? Account creation: energynote® is a cloud based platform that enables you to view in-depth information on the generation, consumption and other earning related information and can be accessed from a desktop, laptop, tablet computer or via a smartphone. Visit www.energynote.eu/ and follow the instruction to create an account Is this important? Yes. The most efficient use of electricity generated by solar PV is to use it within the home, as this maximises the savings that can be made. While it is also important to earn from exporting unused electricity to the grid, it is also cheaper to use your own electricity as opposed to paying for electricity from your utility. Your installer will probably have helped you register as your system was professionally installed, but if not please visit the web address below to create an account. • Click Register now • Enter the end user's name and valid email and password • Click Register to create the account Account verification Within five minutes the user will receive an email with an activation link and instructions on how to complete their account creation. Please note: it is strongly advised to complete the account an activation during the system installation otherwise all date accumulated in the intervening time between installation and association may be lost. 21 Solo III | User manual ASSOCIATING SOLO III SYSTEM WITH ENERGYNOTE® Once the user has created and verified their online energynote® account follow the steps below. 1. Press and hold the cloud button (g) on the hub for five seconds. 2. If you have the optional display, a code will appear on the screen and this will need to be entered on energynote® to complete the association process. (The display must be paired to the hub and connected to the internet in order for the code to appear.) If you do not have the optional display, pressing and holding the cloud (g) button for five seconds will automatically associate the hub to your energynote® account. The cloud (g) LED should change to green which indicates the hub has successfully associated to the energynote® account. Association flow diagram: Press and hold the cloud button (g) on the hub for 5 seconds NO Is there a Solo III display present? YES NO Is there a code shown on screen? YES Enter code on energynote® NO Cloud status LED (g) turned green? YES Association complete. Solo III data aligned with energynote® 22 Energynote® explained ENERGYNOTE® EXPLAINED Once you log in to energynote® you will be greeted with the following home page: The home page allows the user to see live generation, usage, grid import, solar use, income and spend / total income in £. The “solar use” and “income” widgets allow you to also view historical data, (yesterday, last 7 days and last 28 days). 23 Solo III | User manual ENERGYNOTE® SETTINGS OPTION In the settings page you will have the option to input the following: • Budget settings – this calculates the cost and compares it to your budget. • Tariff settings – this calculates the electricity cost. • Microgeneration settings – this allows you to enter the size of your solar array. • 24 Download your data – allows you to download data straight to your computer in CSV format which can then be viewed offline. Energynote® analysis ENERGYNOTE® ANALYSIS The analysis page allows the user to view the live and historical data information. From the drop down option you can select the following to view in more detail: • How much energy do I use? • Was I over or under budget? • How much does my PV array generate? • How much has my PV earned me? • How much carbon did my PV save? • What is my import/export balance? • • How much does PV save off my bill? Do I make the best use of the different tariffs? The user has the option to also select the following: Today, yesterday, this week, last week, this month, last month, winter, spring, summer, autumn, this year and last year’s data. The user also has the option to select any date from the “calendar select” option to analyse further. 25 Solo III | User manual FAQS The Solo III display is blank Check that the power supply is connected to the display. Also try and press any button, as it could be that the display has switched off the back light and is in power saving mode. The dial is not being shown If the current usage view is zero then the dial will not be shown. No generation or consumption is being shown Check the signal strength icon and try and move the display close to the meter. Your hub must be connected at least once every two weeks to upload the data. I have forgotten my energynote® password Go to www.energynote.eu/ and click the forgotten your password? link on the login page. How do I change my energynote® password? You can change your password using the reset password from the link above. Link light (f) is off Check that the hub is properly connected to the How do I reset my display? Remove power to the display and then press and hold the three buttons while powering the display back on. Press the right (n) for DATA RESET and then left button (y) to confirm FULL power supply and that is it switched on RESET Link light (f) is red or amber This means your hub is not connected to the meter. Refer to the supplied installer guide or contact your system installer. More Solo III troubleshooting can be found in the link below: www.greenenergyoptions.co.uk/support/solosupport/solo-iii/ Cloud light (g) is off Check the Ethernet cable is connected between the hub and broadband router and check the router is powered on. Does my hub need to be connected to my home broadband for energynote® to work? The quick answer is yes. Your hub continuously sends data to the energynote® cloud service and uses your broadband connection to do this. 26 technical reference TECHNICAL REFERENCE Hub specification Supply voltage 5Vdc Supply power 250mA, 1.25W Operating temperature +5 to +45ºC Operating humidity 0 to 85% RH non-condensing Storage temperature 0 to +55ºC Storage humidity 0 to 85% RH non-condensing Solo III display specification This product is double insulated. n At the end of its life please recycle at a suitable recycling facility. l For use in dry, indoor environments j only. m These units have been tested and conform to all relevant European safety and regulatory standards where applicable. Meter specification Supply voltage 5Vdc Supply power 100mA, 0.5W Operating temperature +5 to +40ºC Operating humidity 0 to 85% RH non-condensing Storage temperature 0 to +55ºC Storage humidity 0 to 85% RH non-condensing Supply voltage 220 - 240Vac 276Vac maximum Supply frequency 47 - 53Hz Maximum current 100A Operating temperature -20 to +55ºC non-condensing Ingress protection IP52, according to BS EN 60529 Manufacturer Green Energy Options Ltd. 3 St. Mary’s Court, Hardwick, Cambridge, CB23 7QS, UK Hub status LEDs The following table shows what the different coloured LEDs mean LED f g Colour Meaning OFF Check the power supply to the hub RED The hub is not paired to the meter and / or Solo III display AMBER (flashing) The hub is in pairing mode and waiting to pair with the meter or Solo III display AMBER Devices paired, but signal lost (see FAQs) GREEN The hub is paired to the meter OFF Check the Ethernet cable - the hub is unable to obtain a network IP address AMBER (flashing) Requesting association with online service AMBER The hub is connected to the broadband and ready to associate with the user's account GREEN The hub is connected to the broadband and associated with the user's account 27 Designed and manufactured by: Green Energy Options Ltd 3 St. Mary’s Court Main Street Hardwick Cambridge CB23 7QS UK www.greenenergyoptions.co.uk Version: SOL3-A-USG-001