1
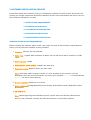
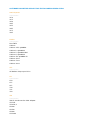
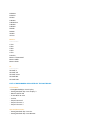
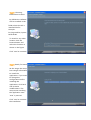
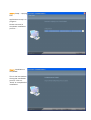
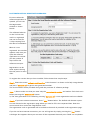
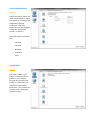
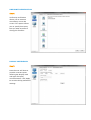
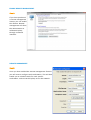
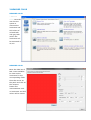
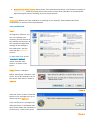
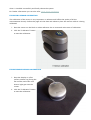
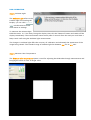
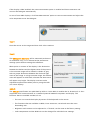
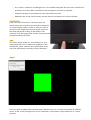
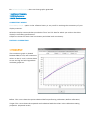
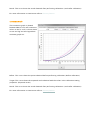
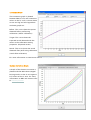
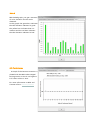
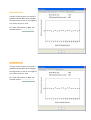
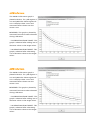
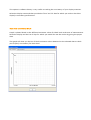
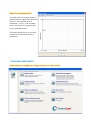
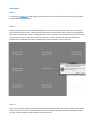
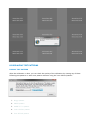
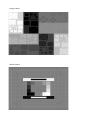
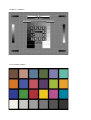
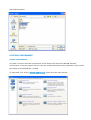
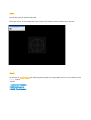
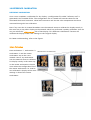
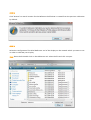
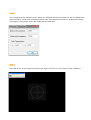
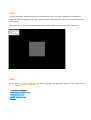
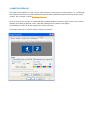
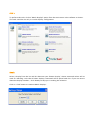
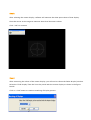
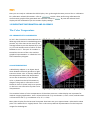
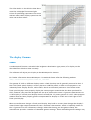
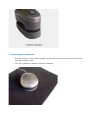
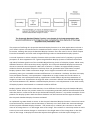
PERFECTLUM USER MANUAL: TABLE OF CONTENTS
Introduction
When it comes to medical imaging,
seeing the whole picture is
important. With a standard set up
you run the risk of missing the
details. In turn, this represents a
health risk to the patient. A missed
detail may lead to an expensive
lawsuit. The problem isn't in the
image itself, or in the practitioners
eye. It is in the monitor itself.
PerfectLum adjusts your display to DICOM (Digital Imaging Communications) standards. This changes
your monitor from it's original calibration, and ensures that you see the finer details of every image
displayed. With the software installed on all of your computers, you thus ensure that no matter what
image you are looking at, it will be the same on every display.
This manual will walk you through all of the functions in PerfectLum. To navigate the online manual
use the buttons above to work through each section. The links to the right will take you to other
sections of the manual. At any time you can return to this table of contents by clicking on the "Main
Window" link (also on the right).
TABLE OF CONTENTS
Section 1: Installation
Section 2: Setting Up PerfectLum
Section 3: Measure Color
Section 4: Perform Calibration
Section 5: Scheduling Jobs
Section 6: PerfectLum History
Section 7: Checking Uniformity
Section 8: Displaying Test Patterns
Section 9: Dicom Conformance
Section 10: Reference Calibration
Section 11: Match Displays
Section 12: Important Information and Glossary
PerfectLum License Agreement
ABOUT PERFECTLUM
PerfectLUM is a calibrating
software tool based on
DICOM part 14 GSDF
standard. This tool
performs
Calibration,conformance
check and maintains
consistency to all the
medical viewing stations.
With this software, the
professionals at medical
imaging industries can
maintain their display to
the international standard
and quality.
KEY FUNCTIONS AND FEATURES IN THE SOFTWARE
•
CALIBRATION according to COLOR and DICOM part 14GSDF standard.:
-LCD Displays
-Gamma correction over video card and display LUT
•
DICOM CONFORMANCE.
•
REFERENCE CALIBRATION.
•
MATCH DISPLAYS
-Calibration for Multi-displays.
•
Display TEST PATTERNS
-to visually check the result of calibration..
•
The software also SUPPORTS:
-8 bit and 10 bit Gamma correction
-Uploading of 10 Bit Gamma to display LUT
-Multiple sensors
-Multiple displays
•
UNIFORMITY -to check the homogenity of brightness over the entire screen.
•
MEASURE COLOR -utility to measure luminance of any colored and RGB values.
•
HISTORY -to compare and check the results and quality of the calibrations done on a certain
date of several workstation displays.
1.SOFTWARE INSTALLATION PROCESS
Follow these below links carefully if you are installing the software for the first time. These links will
provide you enough information about the installation process and requirements and how to carry on
the installation procedures correctly.
1. INSTALLATION REQUIREMENTS
2. PRE-INSTALLATION CHECK
3. POST-INSTALLATION REGISTER
4. UN-INSTALLATION PROCESS
5. SENSOR DRIVER INSTALLATION
MINIMUM INSTALLATION REQUIREMENTS
Before installing the software, please make a pre-check for some of the minimum requirements to
have in your PC where the software is being installed.
1. Processor: Pentium, G4 and Intel Mac
2. Video Card : Capable with resolution of atleast 1024 X 768 pixels with a minimum of 16bit
colors.
3. Minimum RAM: 128MB.
4. Minimum free space needed: 100MB in the hard disk.
5. Operating system: Windows 2000, XP, Vista 32bit.
Note: Perfectlum needs windows installer 3.1 to be installed in your machine. you can
download it from the microsoft website. The link is also provided. Click here to download and
click here to read a article about it ]
6. Display resolution: Minimum 1024 X 768
7. Sensor supported:Gretag Macbeth Eye One display, Xrite DTP94, Sequel , Wellhoefer Lxplus
photometer.
8. CD ROM Drive
Note: Before beginning the installation process, please make sure that the measurement
device is not connected. Connect this after the software is successfully installed.
SOFTWARE HAS NATIVE SUPPORT FOR THE FOLLOWING VIDEO CHIPS:
Intel Chipsets:
---------i810
i815
i830
i845
i855
i865
i915
i945
NVidia:
---------Riva TNT2
GeForce
GeForce 256, QUADRO
GeForce2, QUADRO2
GeForce3, QUADRO DDC
GeForce4, QUADRO4
GeForce FX, QUADRO FX
GeForce 6xxx
GeForce 7xxx
GeForce 8xxx
ATI:
----------
All Radeon chips up to R5xx
SiS:
---------650
651
661
740
741
760
VIA
---------VIA S3 Unichrome Pro VGA Adapter
VT8378
VT8622/3
CN400
CN700
CN800
CX700M
K8M800
K8N800
KN400
P4M800
P4M800Pro
P4M890
P4M900
PM880
PM800
VN800
VX700
Matrox:
---------G100
G200
G400
G450
G550
Parhelia
Matrox TheatreVUE
Matrox MED
Matrox RAD
S3:
---------SAVAGE 4
SAVAGE 3D
SAVAGE 2000
SAVAGE MX
SAVAGE PRO
LIST OF HARDWARES SUPPORTED BY THE SOFTWARE:
Colorimeter:
-GretagMacbethEye-One display
- Gretag Macbeth Eye-One display 2
- Monaco OPTIX XR
- X-Rite DTP 94 USB
- LX Plus
- Sequel Gamma 3
- Sequel Chroma 4
- Sequel Chroma 5
Spectralphotometer:
- Gretag Macbeth Eye-One Pro
- Gretag Macbeth Eye-One Monitor
Spot Luminacemeter :
- IBA dositometry / Wellhoefer LX Plus
- IBA dositometry / Wellhoefer LX Can
- IBA dositometry / Wellhoefer LX Chroma
Displays:
- NEC MultiSync LCD 1980
- NEC MultiSync LCD 2180
- IIYAMA PLH2130-2
- IIYAMA PLH2130-3
- LumiMED MM02
- LumiMED MM03
- LumiMED MM05
- LumiMED MM03A
- LumiMED MM05A
- Olorin VL211D
- Olorin VL200D
-VIEWMEDIC EV-C119
-VIEWMEDIC RV-C219
-VIEWMEDIC RV-C221
-VIEWMEDIC RV-C321
Projectors
- Cannon SX6
- Cannon SX60
- Cannon X600
PRE INSTALLATION CHECKS
Note: Before installing the software on your display(s),
1.Verify that the displays input matches with the graphic board output.
2.It is suggested to power on the WS with display(s) that are already connected.
3.Check the screen resolution of your system. The screen resolution should be
at least 1024 x 768 pixels for a 16 bit color display.
Step 1.
To check the screen resolution: Right click on your system desktop and select properties as shown in
the figure.
Step 2
In the Display Properties screen, go to
'settings' tab as shown in the image beside.
Check the screen resolution and Color
settings.
If the screen resolution is less than 1024 x 768
pixels, change it using the Pointer on the slider
bar. Also, for color display,change the Color
quality to 24 bit or higher and click OK
Now, your system is ready to start installation
process.
INSTALLATION
Step 1:
Before running this
setup it is strongly
recommended to exit
all windows
program.Now Click
'next' to start
installation.
Step 2: Choosing
Destination Location
By default the software
will be installed in the
folder where the OS is
installed like for
example:
D:\ProgramFiles\iiyama\
PerfectLUM.
To install in any other
location click the
browse button and
select the location as
shown in the figure.
Click 'next' to continue.
Step 3: Ready To Install
At this stage, the setup
has enough information
to install the
application. if you want
to change the
configuration before
installing the
application, click back
and do those
modifications. The
setup starts installing
the application once
'next' is pressed.
Click 'next' to continue
the installation.
Step 4: Setup - copying
files
Application set up is in
progress..
Please wait until it
completes installation
process. . .
Step 5: Installation is
completed.
This is the last window
during the installation
process. Click on
'Finish' to complete the
installation.
POST INSTALLATION- REGISTRATION PROCESS
First time when the
software application is
opened, you can see
the Registration
window as shown
beside.
The software behaves
as the Trial Version
until it is registered
and can be used for
15days starting from
the date of installation.
When it is not
registered, this window
appears each time you
open the software
application to remind
you the number of
days left for the
software to expire.
Registration can be
done anytime during
the trial period or even
after.
To register the version that you have installed, follow these three simple steps.
Step 1: Enter the correct software serial number in the location1 as shown in the help image beside
and press "Generate ID" to get an auto generated number.
The serial number will be provided along with the purchase of software package.
Note: 1) Please make sure that you enter only the correct serial number and make a final check on it
before pressing the "Generate ID" button.
2) The auto generated id so created by pressing "Generate ID" is non regenerative and non editable.
Step 2: If you have internet connection ,Press "Web" button below. The default web browser opens.
You are directed to the registration page where you need to fill in the requested data. Enter the
correct email id to receive the "Registration code".
The registration code so generated will be mailed to the email id provided in the registration page.
If you do not have internet connection, you can still register by simply pressing the "Fax" button .
A dialogue box appears where you can enter all the requested data and press "SAVE" on completion.
A PDF file is generated. click the PDF button to view the filled in form.
Now, print them and fax it to +1 (925) 940-8856 or mail to [email protected]. The "registration code"
will be sent to your mail id.
Step 3:
Enter the "registration code" received from us through mail, in location2 as shown in the help image
beside and press "Register".
The registration process is complete and the software is ready to use.
SENSOR DRIVER INSTALLATION
Windows "plug and play" feature is not always successful. Perhaps they should have named it "Plug
and Pray". Root cause of most USB issues is that the customer plugs the hardware into the computer
BEFORE installing all required supporting software. When this is done, the "Found New Hardware"
wizard launches but is not able to complete the installation. Either the customer cancels or the wizard
aborts leaving the task incomplete.
The steps below detail the removal of a partially installed device followed by the additional steps
required to perform a fresh installation. Before you begin, ensure that you have your hardware or
software installation disk at hand.
•
Close all applications. Leave the USB hardware attached and turned on.
• Right-click on the "My Computer" icon on your desktop then from the dialog box, left-click on
"Properties".
• Left-click on the "Hardware" tab and then on "Device Manager".
• Scroll to the bottom of the list and expand the "Universal Serial Bus Controllers" entry.
• Look for a sensor. Chances are it is present but with a yellow warning icon indicating a
problem with the installation.
• Right-click on that entry and select "Uninstall".
•
After the uninstall is completed, disconnect the hardware from the PC.
•
Wait about 15 seconds then re-attach the instrument.
• The "Found New Hardware" wizard should launch.
•
Follow its prompts. If it asks for the product CD then insert your installation disk and
continue.
In the majority of cases, the above steps will resolve the USB installation. If it does not, or the driver
installation finishes but the device is still usable, do the following:
1. Uninstall the device as in steps 2-7 above.
2. Search your system for "XRUSB.sys", "XRUSB.inf", "XRUSB.pnf", plus those relevant to the
instrument you are using.
3. Note the location of each of these files and delete them
4. Reboot the computer.
5. It is normally located at: C:\Program Files\iiyama\PerfectLUM\Sensor Drivers
6. The Wizard should be able to finish the installation successfully. Remember to click "Continue
Anyway" if you receive a prompt about "Windows Logo testing."
This procedure resolves problems with corrupted driver files or instances where multiple versions of
the driver were installed on top of each other.
Uninstallation
To remove the software from your system, proceed as follows:
You must have administrator privileges to uninstall the software.
1. Exit the software.
2. From the start menu, select settings -> control panel.
3. Double-click on the add/remove program icon.
4. Select the software from the list box in the add/remove program properties dialog.
5. Click on the change/remove button.
6. Follow the instructions on the screen to finish uninstallation.
2.SETTING UP PERFECTLUM
Preferences and Display preferences are two prior settings for defining your display and the type of
calibration and other options to be fed in before running any tasks.
The different heads that you could be seeing in the preference settings are as follows:
•
Language Settings
•
Ambient Settings
•
White level settings
•
Color temperature settings
•
ICM Profile settings
The different heads that you could see in display preferences settings are as follows:
•
Select display type
•
Select type of display communication
•
Serial Commmunication
•
Select sensor type
LANGUAGE SETTINGS.
Step 1:
This software
supports
Multilingual
support and
henceforth select
here, the
language that
you feel
comfortable to
run your
software
application. The
default language
would be your
system OS
language. The
other languages
supported is
English,French,
German,Japanese and Chinese.
AMBIENT LIGHT.
Step 2:
It is the light from the environment surrounding the display system which illuminates the display
medium. It contributes to the luminance that is received by an observer from the image display.
Ambient light reduces the contrast in the image.
With the ambient light
option you can enter a
numeric value either that
you know from experience,
or that you use for all your
workstations, or else you
must measure the actual
ambient light while
performing the calibration.
WHITE LEVEL SETTINGS.
Step 3:
Select 'Use this value' option
to enter the corresponding
value in cd/m2. During
calibration you can adjust
the luminance of white level
to this value.
COLOR TEMPERATURE.
Step 4:
Check the option 'adjust the
color temperature' to adjust
the display to a certain color
temperature during
calibration. The color
temperature of the daylight
is between 5000K and
6500K ( K=Kelvin ).
The other options available
are:
•
CIE D50
•
CIE D65
•
Bluebase
•
clearbase
•
9300
ICM PROFILE.
Step 5:
Check this option if you
want to create an ICM/ICC
profile for your display.
Through this function the
profile is created after the
calibration.(Information
about ICM / ICC profiles you
can find on the web page
www.color.org)
UNIFORMITY VERIFICATION.
Step 6:
Uniformity verification
allows you to measure
consistency across the
screen. This option allows
you to specify how many
test you want to perform
during this function.
DISPLAY PREFERENCES
Step 7:
Here the user will have to
provide accurate inputs
defining the display used
and type of display
communication. Click Apply
to save the dislay preference
settings.
ENABLE REMOTE MANAGEMENT.
Step 8:
If you have purchased
a remote management
license, you can enable
this feature. Remote
management will allow
the administrator to
calibrate displays
through a network
interface.
REMOTE MANAGEMENT
Step 9:
Once you have enabled the remote management function
you will have to configure each workstation. This will then
enable you to schedule tasks for each specific
workstation, and to match displays across the network.
3.MEASURE COLOR
MEASURE COLOR
1.Measure
Color :Here the
user has the
option to
measure the
luminance and
XYZ values of
colored RGB
and gray RGB
values.The
luminance will
be measured in
cd/m2
MEASURE COLOR
Move the slide bar of
Red, Green and Blue
to measure the
luminance for the
corresponding fields.
Place the sensor on
the patch and click on
the measure
button.The
measurements such
as luminance and XYZ
values will be shown.
MEASURE COLOR
Similarly the
luminance and XYZ
values for Gray RGB
values can also be
measured.
4.PERFORM CALIBRATION
CALIBRATION
As we know the Calibration of the display is very important. It improves the quality of graphics,
photos and allows the user to view a better image in his display. By choosing a calibration standard
we attempt to make the image look more accurate. If everyone viewing a project adheres to the same
standard, then there will be much less disagreement over any changes needed. Proper display
calibration ensures that what you see today will match what you see tomorrow, and that the
judgments and decisions you make based on what you see, remains valid.
PRESETS FOR CALIBRATION
Before starting the calibration process, please make certain basic essentials in order to get the best
quality out of your display.
1. Cleanliness of your display screen Please check your screen if it's clean, dust free, no finger
prints and like., A clean screen is always suggested before calibration for accurate performance.
2. Avoid light Reflections Switch off your screen to check if no light reflections are observed on the
screen. If you happen to see any reflections on any part of your screen, change the position of
the screen to avoid them
3. Ambient light The ambient light in your working environment should comply with the relevant
standards.
4. Measurement device position Please check if the measurement device is positioned accurately as
suggested here. and also position flat on the screen surface while calibration to avoid ambient
light entering the sensor resulting incorrect measurements.
Note:
Screensaver: Before you start calibration or profiling of your displays, please deactivate all the
screensavers to avoid incorrect measurement.
RUN CALIBRATION
Step 1:
Through this software, you
can now calibrate your
display(s) and be assured of
the stability and accuracy of
the displayed images.After
making all the settings in
the preferences, we now
start with the calibration
process.
To start with, Click on the
"CALIBRATE DISPLAY"
option from the main
wizard, as shown in the
figure.
Step 2: Sensor calibration
Before starting the calibration, the
sensor has to be calibrated. So set
the sensor dark level as shown in
Figure-a.
Figure-a
If the the sensor is NOT connected,
then an error message pops up as
shown beside in Figure-b.
If you see this error message even
after the sensor is connected, then
verify if the cables and connections
of the sensor, check if the sensor
Figure-b
driver is installed successfully and finally reboot the system.
For further information you can also refer sensor driver installation
EYEONE PRO SENSOR CALIBRATION
The calibration of the sensor is very important, as otherwise will affect the quality of all the
measurements directly. Follow this page to know how and where to place the sensors while it is being
calibrated
1. Place the sensor on the black or white reference tile as instructed at the time of calibration.
2. Click the "Calibration" button
to start the calibration.
EYEONE DISPLAY SENSOR CALIBRATION
1. Place the display on a flat
surface (rubber ring facing the
flat surface) and make sure
that no light gets into the
screen.
2. Click the "Calibration" button
to start the calibration.
RUN CALIBRATION
Step 3: Ambient Light
The Ambient Light refers to the
external light surrounding the
Display. you can refer Ambient
light in Preferences to know
more about its settings
To measure the ambient light,
Hold the sensor 10-15cm away, facing the display. Now click the "Measure" button and switch off the
display immediately. The measurement starts exactly after 5 seconds from this and you could hear a
beep sound confirming the Ambient light measurement.
The changes in ambient light affect the accuracy of calibration and ultimately the appearance of the
image being viewed. The standard range of ambient light lies between 0.0 min to 4.5 max.
Step 4: Measure Color Temperature
The Measure color temperature option is used for adjusting the RGB value through measurement and
bringing the value as close as target value.
If the display is DDC enabled, the auto measurement option is enabled and hence measures and
corrects the RGB gain automatically.
In case of non-DDC displays, click 'New Measurement' option to start a measurement and adjust the
color temperature over the RGB gain.
Step 5:
Place the sensor on the target and then click Ok to continue.
Step 6:
The white point luminance will be measured at the time
of calibration only, if it is selected at the preferences
settings option before starting the calibration.
White point or contrast of the display is the distinction
between the darkest and the lightest area of the picture.
A low contrast image will be viewed in shades of gray,
with no proper distinction between the dark and light
areas of the image. In a high contrast image, the darkest
areas will appear as solid black, whereas the white areas
will appear very bright. The display contrast can be
adjusted to optimize the white point by using the OSD
(on screen display).
DDC/CI
The DDC/CI specification was published by VESA in 1998. DDC/CI enables the bi-directional, iC-bussupported serial communication as a standard protocol between computers and display. The
functions that are available via DDC/CI are
•
The user can control the display by means of the keyboard or the mouse.
•
The functions that are available via DDC/CI are numerous, varied and serve the most
demanding user.
•
Brightness and contrast can be adjusted or, if desired, can be reset to the factory setting.
•
Color temperature and the RGB Gain can be changed for individual user settings.
•
Pin-cushion, trapezoid, parallelogram etc. are available alongside the more basic functions for
geometry correction; More cancellation and convergence can also be adjusted.
•
Automatic display of test pattern for each adjustment function.
•
Metadata such as the serial number and the date of manufacture are easily displayed.
New Measure :
If the user doesn't have an e-connector then, he
should adjust the contrast of the display by using the
on screen display (OSD) in order to come as close as
possible to the target value by placing the sensor on
the white patch and clicking on the button "new
measure" until the target value and the measured value
are approximately the same.
OSD :
On screen display (OSD) is a set of buttons on your
display that helps you to adjust the brightness (also
called black point), contrast (also called white point),
and color temperature manually during calibration.
Step 7:
Once you have completed the required steps calibration will run. You will be required to hold the
sensor to the screen through much of this calibration. If prompted, simply follow the on-screen
prompts.
Step 8:
If you have selected the option 'create a ICM profile' in the Preferences-> ICM PROFILE setting, then
at the end of calibration process a profile is created by name "Display Profile.ICM" and will be saved
by default in the system color folder.
Step 9:
At the end of Calibration the following graphs are generated which can be viewed in the History
option .
For GSDF Color Caibration, Five graphs are generated. they are as listed below.
1.Luminance Response
2.Gamma Correction Curve
3.JND Conformance
4.AAPM Conformance
5.DeltaE
For GSDF DICOM calibration , Four graphs are generated which are listed below.
1.Luminance Response
2.Gamma Correction Curve
3.JND Conformance
4.AAPM Conformance
5.SCHEDULING JOBS
SCHEDULING JOBS
Step 1:
With Perfectlum it is also possible to schedule tests from the remote management interface. You will
be able to schedule tasks on a daily, weekly, or monthly basis. To start, click add a task.
SCHEDULING TASKS
Step 2:
You will then be able to select the type of test you want to perform, and schedule the test itself.
It is possible to schedule conformity tests and conformance tests for the various displays on your
network.
6.PERFECTLUM HISTORY
HOW TO USE THE HISTORY OPTION?
To view the performance of the display after calibration and conformance through easily
understandable graphs, click on the view history option in the main window.
The history window appears as shown, you can see the information like task name, date and time of
the task performed, serial number of the calibrated display and like.
Double click on the task name you wish to see the results.
The software displays graphical results for the corresponding tasks. Click the task names below to
view various graphs based on the performed tasks.
CALIBRATION
For GSDF Color Caibration, Five graphs are generated. they are as listed below.
1.Luminance Response
2.Gamma Correction Curve
3.JND Conformance
4.AAPM Conformance
5.DeltaE
For GSDF DICOM calibration , Four graphs are generated which are listed below.
1.Luminance Response
2.Gamma Correction Curve
3.JND Conformance
4.AAPM Conformance
For DICOM Conformance, there are three graphs generated
1.Luminance Response.
2.JND Conformance.
3.AAPM Conformance.
CONSISTENCY GRAPH
Consistency Graph : option in the software history is very useful in tracking the consistency of your
display overtime.
Select the display name and then provide the 'from' and 'to' date for which you wish to check the
display's consistency performance.
Graphs are shown for black level consistency and white level consistency.
HISTORY: CALIBRATION
Luminance Graph
The Luminance graph is plotted
between DDL(X-axis) and Luminance
values on the (Y-axis). It shows three
curves and log and anti logarithmic
resultant graphs viz.
Before: This curve shows the points obtained before performing calibration.( Before calibration)
Target: This curve shows the expected result obtained with the values in the calibration setting
properties. (Expected result )
Result: This curve shows the result obtained after performing calibration. (result after calibration)
For more information on Luminance refer to Glossary Section.
Luminance Graph
The Luminance graph is plotted
between DDL(X-axis) and Luminance
values on the (Y-axis). It shows three
curves and log and anti logarithmic
resultant graphs viz.
Before: This curve shows the points
obtained before performing
calibration.( Before calibration)
Target: This curve shows the
expected result obtained with the
values in the calibration setting
properties. (Expected result )
Result: This curve shows the result
obtained after performing calibration.
(result after calibration)
For more information on Luminance refer to Glossary Section.
Gamma Correction Graph
A Graph of the Gamma correction is
plotted with the DDL values (Digital
Driving Levels) on the X-axis against
LUT values on the Y-Axis. For more
information on DDL and Gamma refer
to Glossary Section.
JND graph
After each calibration and gray
patches being measured, this graph is
plotted with JND (Just Noticeable
Difference)/ Luminance Interval
against Luminance interval and Mean
JNDs/ Luminance is calculated over
the collected data and the Standard
Deviation (SD) is also calculated on
the entire range.
Just-Noticeable Difference (JND): is
the luminance difference of a given
target under given viewing conditions
that the average human observer can
just perceive.
For more information on JND refer to
Glossary Section.
Gamma Correction Graph
A Graph of the Gamma correction is
plotted with the DDL values (Digital
Driving Levels) on the X-axis against
LUT values on the Y-Axis.
For more information on DDL and
Gamma refer to Glossary Section.
Delta E
With DeltaE graph, you get a overview
of color deviation for the result
obtained.
In this graph, the green bars indicates
that the deviation obtained is good.
the yellow bars indicates that it is
medium and the red bars indicates
that the deviation obtained is bad.
JND Conformance
A Graph of the Gamma correction is
plotted with the DDL values (Digital
Driving Levels) on the X-axis against
LUT values on the Y-Axis.
For more information on DDL and
Gamma refer to Glossary Section.
JND Conformance
A Graph of the Gamma correction is
plotted with the DDL values (Digital
Driving Levels) on the X-axis against
LUT values on the Y-Axis.
For more information on DDL and
Gamma refer to Glossary Section.
JND Conformance
A Graph of the Gamma correction is
plotted with the DDL values (Digital
Driving Levels) on the X-axis against
LUT values on the Y-Axis.
For more information on DDL and
Gamma refer to Glossary Section.
AAPM Conformance
The AAPM Conformance graph is
plotted with DL/L for a JND against Yaxis and JND Index Values against Xaxis. It displays three curves and
measured values shown over the
center curve.
MEASURED: This graph is plotted by
measured luminance values obtained
during calibration.
+10% DEVIATION FROM TARGET: This
graph is obtained after adding 10% of
deviation values to the target values.
-10% DEVIATION FROM TARGET: This
graph is obtained after subtracting
10% of deviation values to the target
values
HISTORY: CONSISTENCY GRAPH
Detailed Report
Here Graphs are
displayed for Black
level and white
level to identify
the consistency of
these levels for a
selected display
for a selected
period of time.
This option in software history is very useful in tracking the consistency of your display overtime.
Select the display name and then provide the 'from' and 'to' date for which you wish to check the
display's consistency performance.
Black level consistency Graph
Graph is plotted based on the different luminance values for Black level at the time of measurement.
Select the display and the list of days for which you would like see the results by giving the proper
date.
The graph will show you the list of black luminance values obtained on the selected date to check
your display's consistency for black level.
White level consistency Graph
The white level consistency Graph is
plotted between measured Luminance
values (Y-axis) and the time of
calibration ( X-axis ) .The resultant
values are shown for the given date
for the selected display.
This graph will give you an accurate
picture of the luminance result of
white level.
7.CHECKING UNIFORMITY
How to check the homogeneity of brightness over the entire screen?
UNIFORMITY
STEP 1 :
To check the Uniformity of the display screen, please click on the "Perform Uniformity Check" option
in the software main window.
STEP 2 :
Now by placing the sensor on the White Patches at all corners of the Display, the user can measure
the uniformity of the screen. The following figure shows the luminance value, which is calculated for
the center of the display screen. Similarly the user has to measure the luminance value for all the four
corners of the screen to find the uniformity. The user is also provided with the exact difference
between each calculated luminance, keeping the center luminance value as Primary.
STEP 3 :
Here, you can see the figure showing the measured luminance values for all the corners of the screen.
Uniformity of the screen is measured and the user is provided with the luminance difference values
for each corner, keeping center luminance as the primary.
8.DISPLAYING TEST PATTERNS
DISPLAY TEST PATTERN
After the calibration is done, you can check the quality of the calibration by viewing any of these
following test patterns or other user pattern selection using the 'user defined pattern'
1. Briggs pattern
2. SMPTE pattern
3. AAPM TG-18 pattern
4. Color checker pattern
5. User defined pattern
Briggs Pattern
SMPTE Pattern
AAPM TG 18 Pattern
Color checker pattern
User Defined Pattern
9.DICOM CONFORMANCE
DICOM CONFORMANCE
This task is used to check the conformance of the display with that of the DICOM standard
Conformance. Using this option one can verify the results obtained from the Calibration amd confirm
the display to the DICOM part 14 GSDF
To start with, Click on the "DICOM conformance" option from the main wizard.
Step 1:
Follow the steps to perform the task.
Place the sensor on the target and click on the 'OK' button to start conformance process.
Step 2:
At the end of Conformance the following three graphs are generated, which can be viewed in the
History option
1.Luminance Response
2.JND Conformance
3.AAPM Conformance.
10.REFERENCE CALIBRATION
REFERENCE CALIBRATION
Once a user completes a calibration for his display, a configuration file called "reference.xml" is
generated in the installed folder. The configuration file so created will have the values for the
calculated black level luminance, white level luminance and also the color temperature which was
measured during this last calibration.
Now if any user who is situated elsewhere over the network wants to calibrate his display exactly in
the same way as any other display on the network which has performed a quality calibration, then he
can just select the "reference.xml" file of that display. This 'Reference Calibration' function will
calibrate the display to the same settings as the Original display.
For better understanding, refer to the figures.
Before Calibration
Here workstation-1, workstation-2,
workstation-3 and the master
workstation are on the same
network. Now if any workstation
over the network wants to calibrate
his display exactly in the same way
as the master workstation, then he
must select the configuration file of
the master workstation. So, that he
can calibrate his display to the same
settings as that of the master
workstation.
After Calibration
Once all the workstations are
calibrated to the same settings of
that of the master workstation, then
the images in all workstation's
display looks exactly the same as
shown in the figure beside.
HOW TO CALIBRATE?
Step 1:
In order to start reference calibration, click on the option REFERENCE CALIBRATION in the main
window as shown in the figure.
STEP 2:
Click "Browse" to search location for the Reference Profile that is created from the previous calibration
by default.
STEP 3:
Select the configuration file called Reference.xml of the display on the network which you want to use
in order to calibrate your display.
Note: Please don't double click on the Reference.xml select the file and click on open.
STEP 4:
The configuration file "Reference.xml" which was selected will have the values for the calculated black
point luminance, white point luminance and also the color temperature which is displayed as shown
in the figure. Using these values the display will be calibrated.
STEP 5:
Place the sensor on the target as shown in the figure and click on 'OK' button to start calibration.
STEP 6:
During calibration, depending upon the measurement option you have selected in the preference
page, the number of patches will differ. Before measuring the patches, the environment initialization
will be done.
After this various patches of different RGB levels are displayed and will be used for calibration.
STEP 7:
At the end of Reference Calibration the following graphs are generated which can be viewed in the
History Option.
1.Luminance Response
2.Gamma Correction Curve
3.JND Conformance
4.AAPM Conformance
5.DeltaE
11.MATCH DISPLAYS
This task in the software is used only for multi-displays connected to a single system. i.e., calibrating
the display connected to a system with that of the already calibrated display connected to the same
system. This concept is called Matching of display.
First, to know if your system is connected with multiple displays correctly, right click on your system
desktop and select properties. Then, open the settings tab as shown in the figure.
click Identify to check if all the displays are shown correctly.
click Apply, then OK to confirm proper display connection.
STEP 1:
To perform this task, click on 'Match displays' option from the main menu in the software as shown:
This task could be run only in a multi displays configuration
Step 2:
Select a display from the list and this becomes your 'Master display', whose measured values will be
used for matching, such that all other displays connected will be paired with this. If you are unsure
about the display numbers , click identity to help you in making the selection.
Click on �?OK’ button to continue Match displays.
Step 3:
After selecting the master display, software will measure the white point values of that display.
Place the sensor on the target to measure white level luminance values.
Click �?OK’ to continue
Step 4:
After measuring the values of the master display, you will now be shown the 'Multi-Display' window.
Select the 'Child display' from the list to be paired with the master display as shown in the figure
beside.
Click on �?OK’ button to continue matching of display process.
Step 5:
Now you are ready to calibrate the child display. You go through the same process like in calibration.
For calibration related information, refer to Calibration section. After performing calibration the
conformance graph will be generated and could be viewed in History. By now the selected child
display will be calibrated as per the master display settings.
12.IMPORTANT INFORMATION AND GLOSSARY
The Color Temperature
CIE CHROMATICITY COORDINATES
In 1931 the Commission Internationale de
lEclairage (CIE) devised a methodology that
permits any color that can be seen by the
average human eye to be denoted by a pair
(x,y) of real numbers each of which is seen
between 0 and 1. This pair of numbers is
termed the chroma of the color and the
graphical representation is called the 1931
CIE Chromaticity diagram.
COLOR TEMPERATURE
A Black body radiator is an object which
when heated sufficiently produces a light
emission whose color is directly related to
the temperature. When the temperature
versus the chromaticity of the emitted
color is plotted on the CIE Chromaticity
diagram, the graph is referred to as the
Planckian locus or black body locus points
on the locus are referred to by their Color
Temperatures.
Two standard values of color temperatures of the white point on a video display are important for
medical imaging applications. One is 9300 Kelvin with (x,y) coordinates ( 0.285, 0.292) and the other
is 6500 Kelvin with (x,y) coordinates of (0.313, 0.329).
Many Color display for the Personal Computer have been set up to approximate a 9300 Kelvin white
point. This white level is slightly bluish. This is the most preferred representation for the Grayscale
images for Radiologists.
The 6500 Kelvin is also bluish-white but is
more like a daylight fluorescent light.
Colors for pathology specimens look more
realistic when video display system has the
value set at 6500 Kelvin.
The display Gamma
GAMMA
A mathematical function, with which the brightness distribution (gray tones) of a display can be
described from black to white correctly.
The software will adjust your display to the DICOM part14 Gamma.
For further information about DICOM part 14 standards Please refer the following website
"http://medical.nema.org/dicom/2004/04_14PU.PDF"
The gamma of CRTs in different displays varies a little, but they are all generally assumed to be 2.5.
Non-CRT (fixed-pixel) displays, such as plasma or LCD flat panels, or DLP or LCD projectors, are
inherently linear display devices, unlike CRTs, which are inherently nonlinear. Since these newer
fixed-pixel displays must properly display the same program material that has been produced for
CRTs, however, they must be designed and set up to produce the same 2.5 gamma characteristics as
a CRT display. If a fixed-pixel display doesn’t emulate the 2.5 power gamma of a CRT, video program
material that has been properly gamma compensated for display on a CRT won’t look right on the
fixed-pixel display.
When a manufacturer designs a fixed-pixel display, they build in circuitry that changes the display’s
natural linear light output characteristic into a nonlinear characteristic, which is hopefully similar to
the 2.5 gamma of a CRT. Oftentimes, though, rather than having just one gamma setup, the
manufacturer provides a number of selectable gamma settings. These selectable gamma settings may
be in the user menu, or they may be in the service menu. The question then becomes: “what is the
proper setting of the gamma selection switch?” The answer is: whichever gamma setting comes
closest to providing a 2.5 gamma characteristic, to mimic the gamma of CRT displays.
Color Management
Color management is today a firm component of most operating systems. It
describes color areas and thus characteristics of devices such as monitors,
scanners, printers, digital cameras and the transformation of colors between
these devices.
DICOM is thereby responsible for the production of a precise ICC profile of your
monitor after a calibration, and this profile can be saved. This profile can
guarantee then in interaction with the profiles of the other devices of the production chain a precise
representation.
GRAYSCALE STANDARD DISPLAY FUNCTION (GSDF)
The DICOM Grayscale Standard Display Function (GSDF) describes the non-linear human perceptual
response to different levels of luminance in mathematical terms, based on Barten’s model of the
human visual system. The GSDF defines a standard curve against which different types of display
devices can be calibrated, such that the calibrated image display uses the available contrast of the
display device in a perceptually linear way (i. e. the difference between black and 5% gray is perceived
equal to the difference between white and 95% gray).
A calibration of different types of display devices (e. g. screen/film and grayscale monitor) according
to the GSDF cannot yield an identical image display if the physical properties of the display devices in
terms of spatial and contrast resolution differ. However, instead of identical, the calibration can yield
a consistent image display which means that the appearance of the image to the human observer is
as similar as possible given the differing properties of the display devices.
The DICOM GSDF model can be applied to a wide range of display devices, including CRT (cathode ray
tube) and flat-panel monitors (which are considered as a display system together with the graphics
adapter to which they are attached), reflective hardcopy printers (paper) and transmissive hardcopy
printers (film).
Sensor calibration
The calibration of the Sensor is very important, since it affects the quality of all the measurements
directly.
SENSOR CALIBRATION
•
Place the sensor on the white reference tile.
•
Click the "Calibration" button to start the calibration.
DISPLAY SENSOR CALIBRATION
•
Place the display on a flat surface (rubber ring facing the flat surface) and make sure that no
light gets into the screen.
•
Click the "Calibration" button to start the calibration.
What is the DICOM Standard?
Mathematically, Dicom standard is the Grayscale Standard Display Function of Standardized Display
Systems. These systems may be printers producing hard-copies viewed on light-boxes or electronic
Display Systems for soft-copies.
Hard-copies may consist of transmissive films as well as reflective prints. The image in these prints is
represented by optical density variations in transmission or diffuse reflection. To an observer, every
element of the image appears with a certain Luminance depending on the Illuminance and the optical
density of the image element.
Soft-copies may be produced by emissive Display Systems (such as CRT or LCD monitors) or
electronic light valves (such as light sources and liquid crystal displays).
Display Systems take a Digital Driving Level and produce Luminance or optical density variations
which represent the image. Predictable application of image transformations, such as the modality,
value-of-interest, and presentation look-up tables specified in the DICOM standard, requires
knowledge of the Characteristic Curve of the Display System. Standardizing the response function
expected of the Display System simplifies the application of such image transformations across
several different Display Systems such as encountered in a network environment.
It does not define when conformance with the Grayscale Standard Display Function is achieved or how
to characterize the degree of conformance reached.
Note: A definition of conformance would require thorough evaluations of human visual system
sensitivity to deviations of Display Functions from the Grayscale Standard Display Function for
medical images.
Figure show the context for the Grayscale Standard Display Function. The Grayscale Standard Display
Function is part of the image presentation. There will be a number of other modifications to the
image before the Grayscale Standard Display Function is applied. The image acquisition device will
adjust the image as it is formed. Other elements may perform a –window and level” to select a part of
the dynamic range of the image to be presented. Yet other elements can adjust the selected dynamic
range in preparation for display. The Presentation LUT outputs P-Values (presentation values). These
P-Values become the Digital Driving Levels for Standardized Display Systems. The Grayscale Standard
Display Function maps P-Values to the log-luminance output of the Standardized Display System.
How a Standardized Display System performs this mapping is implementation dependent.
The boundary between the DICOM model of the image acquisition and presentation chain, and the
Standardized Display System, expressed in P-Values, is intended to be both device independent and
conceptually (if not actually) perceptually linear. In other words, regardless of the capabilities of the
Standardized Display System, the same range of P-Values will be presented similarly.
The purpose of defining this Grayscale Standard Display Function is to allow applications to know a
priori how P-Values are transformed to viewed Luminance values by a Standardized Display System.
In essence, defining the Grayscale Standard Display Function fixes the units for the P-Values output
from the Presentation LUT and used as Digital Driving Levels to Standardized Display Systems.
A second objective to select a Display Function which provides some level of similarity in grayscale
perception or basic appearance for a given image between Display Systems of different Luminance
and which facilitates good use of the available Digital Driving Levels of a Display System. While many
different functions could serve the primary objective, this Grayscale Standard Display Function was
chosen to meet the second objective. With such a function, P-Values are approximately linearly
related to human perceptual response. Similarity does not guarantee equal information content.
Display Systems with a wider Luminance Range and/or higher Luminance will be capable of
presenting more just-noticeable Luminance differences to an observer. Similarity also does not imply
strict perceptual linearity, since perception is dependent on image content and on the viewer. In
order to achieve strict perceptual linearity, applications would need to adjust the presentation of
images to match user expectations through the other constructs defined in the DICOM Standard (eg.
VOI and Presentation LUT). Without a defined Display Function, such adjustments on the wide variety
of Display Systems encountered on a network would be difficult.
Display Systems often will have Characteristic Curves different from the Grayscale Standard Display
Function. These devices may contain means for incorporating externally defined transformations that
make the devices conform with the Grayscale Standard Display Function . It provides examples of test
patterns for Display Systems with which their behavior can be measured and the approximation to
the Grayscale Standard Display Function evaluated.
As explained in greater detail in Annex A, the Grayscale Standard Display Function is based on human
Contrast Sensitivity. Human Contrast Sensitivity is distinctly non-linear within the Luminance Range
of the Grayscale Standard Display Function . The human eye is relatively less sensitive in the dark
areas of an image than it is in the bright areas of an image. This variation in sensitivity makes it much
easier to see small relative changes in Luminance in the bright areas of the image than in the dark
areas of the image. A Display Function that adjusts the brightness such that equal changes in P-
Values will result in the same level of perceptibility at all driving levels is –perceptually linearized”.
The Grayscale Standard Display Function incorporates the notion of perceptual linearization without
making it an explicit objective.
The employed data for Contrast Sensitivity are derived from Barten's model of the human visual
system . Specifically, the Grayscale Standard Display Function refers to Contrast Sensitivity for the
Standard Target consisting of a 2-deg x 2-deg square filled with a horizontal or vertical grating with
sinusoidal modulation of 4 cycles per degree. The square is placed in a uniform background of
Luminance equal to the mean Luminance L of the Target. The Contrast Sensitivity is defined by the
Threshold Modulation at which the grating becomes just visible to the average human observer. The
Luminance modulation represents the Just-Noticeable Difference (JND) for the Target at the
Luminance L.
Note: The academic nature of the Standard Target is recognized. With the simple target, the essential
objectives appear to be realizable. Only spurious results with more realistic targets in complex
surroundings were known at the time of writing PS 3.14 and these were not assessed.
The Grayscale Standard Display Function is defined for the Luminance Range from 0.05 to 4000
cd/m2. The minimum Luminance corresponds to the lowest practically useful Luminance of cathoderay-tube (CRT) monitors and the maximum exceeds the unattenuated Luminance of very bright lightboxes used for interpreting X-Ray mammography. The Grayscale Standard Display Function explicitly
includes the effects of the diffused ambient Illuminance.
QA TASKS
In softcopy diagnostic systems, displays are used to judge medical images and to take conclusions
about patients physical condition.
It is obvious that the image quality is of the utmost importance. Therefore it is necessary to check the
quality of the system, and especially the displays image quality, on a regular basis.
QA tests can be performed to check the image quality of all the displays on a medical viewing station.
It consists of a number of QA tasks. Some QA tasks have target values and tolerances that can be set
to generate a warning or an error. For other tasks, the user must judge if the result is OK or not.
When an error occurs, measures must be taken immediately to restore the image quality.These QA
tasks can be scheduled to start automatically on the specified date & time.
CONFORMANCE(CONFORMITY)
When the software is installed, certain pre settings are defined for each display in the viewing station.
This settings are the reference for the displays visual behavior. When the display image quality is
good, the display is conform to the defined settings.
CALIBRATION
In many cases, calibration is the remedy for a display that no longer conforms to its pre settings. The
calibration routine restores the black luminance, the white luminance and the display function.
DISPLAY FUNCTION
A Display Function describes how a display device converts the voltages at the inputs into light. The
display function is a graph that shows how the light from the picture tube evolves from minimum to
maximum luminance while the data levels at the input of the imaging board go from 0 to maximum.
DIGITAL DRIVING LEVEL (DDL)
A digital value which given as input to a Display System produces a Luminance. The set of DDLs of a
Display System is all the possible discrete values that can produce Luminance values on that Display
System. The mapping of DDLs to Luminance values for a Display System produces the Characteristic
Curve of that Display System. The actual output for a given DDL is specific to the Display System and
is not corrected for the Grayscale Standard Display Function.
DISPLAY SYSTEM
A device or devices that accept DDLs to produce corresponding Luminance values. This includes
emissive displays, transmissive hardcopy viewed on light boxes, and reflective hardcopy.
ILLUMINANCE
Light from the environment surrounding the Display System which illuminates the display medium. It
contributes to the Luminance that is received by an observer from the image display. Ambient Light
reduces the contrast in the image.
JUST-NOTICEABLE DIFFERENCE (JND)
The Luminance difference of a given target under given viewing conditions that the average human
observer can just perceive.
JND INDEX
The input value to the Grayscale Standard Display Function, such that one step in JND Index results in
a Luminance difference that is a Just-Noticeable Difference.
LUMINANCE
Luminance is the luminous intensity per unit area projected in a given direction. The Systme
Internationale unit (used in PS 3.14) is candela per square meter (cd/m2), which is sometimes called
nit. Another unit often used is footlambert (fL). 1 fL = 3.426 cd/m2.
LUMINANCE RANGE
Luminance Range is the span of Luminance values of a Display System from a minimum Luminance to
a maximum Luminance.
GAMMA
The Gamma function is a kind of display function, characterizing an apparatus that converts voltages
into light or ink or vice versa. Displays, printers, scanners, ... all have their own, unique Gamma
function. In a display, this function is exponential. The Gamma value is the exponent that determines
the shape of the function.
DICOM STANDARD
DICOM stands for Digital Imaging and Communications in Medicine. It is a standard developed by the
American College of Radiology (ACR) and the National Electrical Manufacturers Association (NEMA).
The standard specifies how digital image data can be moved from system to system. In addition,
Supplement 28 Part 14 specifies a function that relates pixel values to displayed Luminance levels
and is called Grayscale Display Function Standard.
For further information about DICOM part 14 standards Please refer the following website
"http://medical.nema.org/dicom"
PERFECTLUM LICENSE AGREEMENT
QUBYX SOFTWARE LICENSE AGREEMENT
IMPORTANT - READ CAREFULLY:
This License Agreement ("Agreement") is a legal contract between You, a user ("You"), and QUBYX
LTD, NICE, France ("QUBYX") for the QUBYX software identified above, which encompasses all material
and software accompanying this Agreement, including computer software, the associated printed
material, readme file, the online help, and any other accompanying information and documentation
(collectively, "Software").
By clicking the acceptance button, installing, or otherwise using the Software, You are consenting to
be bound by the terms of this Agreement. If You do not agree to all of the terms of this Agreement,
QUBYX is not willing to license the Software to You. If You do not agree to be bound by the terms of
this Agreement, click the button that indicates You do not accept its terms, do not install, copy, or
otherwise use the Software, and contact QUBYX (in France +33 (0)870 406 212) for instructions on
how to return the unused Software.
1 Software License
a) Grant of License
QUBYX hereby licenses to the extent described below the use of, but does not sell the Software to
You. You acknowledge that You do not acquire any rights of ownership or title in the Software. You
own the media and the dongle, if any, on which the Software resides and is copy-protected,
respectively, but QUBYX retains all right, title and interest in and to the Software, which is the subject
of copyright, trade secret, trademark and patent rights, among other intellectual property and
proprietary rights ("Proprietary Rights").
b) Restricted use
QUBYX hereby grants You under all its Proprietary Rights the personal, non-exclusive right to install
and use the Software for its intended purpose in connection with ICC-profiles and LUT´s (Look Up
Tables), in particular the creation thereof on a single personal computer or workstation and to make
one copy of the Software in machine-readable form for backup purposes only. You must reproduce
on any such copy the copyright notices and any other proprietary legends that were on the original
copy of the Software. QUBYX grants no rights or license of any kind to the Software to You other than
those expressly granted above.
c) Additional Specified Restrictions
For the avoidance of doubt, the limited license to use the Software granted above places in
particular the following limitations and restrictions on Your use of the Software.
i) Reverse Engineering and Decompilation
You understand and acknowledge that the codes, structures, methods and other elements comprising
the software are confidential to and trade secrets of QUBYX. Accordingly, You may not disassemble,
decompile, reverse engineer or otherwise attempt to create or derive source codes for the computer
program comprising the Software or reduce such programs of any of their component structures,
algorithms or other elements to a human-perceivable form. You may not modify or translate any part
of the Software.
ii) No other Use
Except as expressly permitted in Section 1(a) above, You may not disclose, distribute, modify, make
or have made any copies of the Software, in whole or in part, nor sell, rent, lease, license or lend the
Software without the prior written authorization of QUBYX.
iii) Multiple installation / Single Use at the time
The Software may be used by You on one single personal computer or workstation at the time.
Specifically, You may install the Software on more than one computer at Your premises or at Your
home at a time, however, the use of the Software must always be connected with the use of the
dongle provided by QUBYX. You are not permitted to circumvent the protection given by the dongle.
Furthermore, it is not allowed to use the Software or to network the Software to multiple computers
or terminals without first obtaining an expanded license from QUBYX to cover such additional users
and computers. QUBYX may replace the dongle by any other means of protection without previous
announcement.
2 Use of LUT (Look Up Table) and profiles
a) The Software is licensed for use only as follows:
(i) To create LUT´s and profiles on the specific input or output device that You own or otherwise
possess and for which they were created ("Your Device"). You may make these LUT´s and profiles
available to third parties only in circumstances in which the third party will be optimizing images that
have been created on, or will be output on, Your Device, provided that Your Device continues to be
owned by You or in Your possession at such time that a profile is made available to such third party;
or
(ii) to create LUT´s and profiles by using reference characteristic data which are publicly and without
consideration provided by professional or trade associations like standardization institutes to be
used for their intended purpose.
b) No Distribution of generic LUT´s and profiles
This Agreement does not grant You the right to distribute or embed created LUT´s and profiles, also
not under Your private label, into any software, devices or consumables like Computer Displays,
Digital cameras, Printers, Projectors ,paper that You manufacture, market or distribute to third
parties. If You wish to create LUT´s and profiles for this purpose, You will need a separate license for
each device. With regard to generic LUT´s and profiles created by non-profit organizations like the
ECI, QUBYX is however prepared to permit to embed such LUT´s and profiles into any software,
devices or consumables to be distributed commercially by an agreement on a case by case basis. For
information on a separate license You may contact [email protected]. .
3 Copyrights, Trademarks and Patents
The marks "PerfectLum", "PressProof", "Display4Proof", "QUBYX", "ChromaView", as well as QUBYX’s
logo are trademarks or registered trademarks of QUBYX or its affiliated companies. The technology in
this product is covered by European patents, with additional U.S. and international patents pending.
The Software, including, without limitation, any images, and text incorporated therein as well as the
ICC-profiles and LUT´s created by You are the subject of international copyright protection. This
Agreement grants You no other rights, licenses, or interests of any kind in or to such copyright,
trademarks and patents, other than as granted herein. You agree that You will assert no other rights,
licenses or interests other than those granted herein or otherwise challenge QUBYX or QUBYX’s
affiliated Companies exclusive ownership of such copyrights, trademarks and patents.
4 Duty to Inform
You agree to make reasonable efforts to notify and inform everyone having access to the Software or
the computer on which it is installed of all the applicable restrictions limiting use of the Software, as
well as Your other duties and obligations under this Agreement. You agree to provide notice to
QUBYX immediately after learning of or having reason to suspect a breach of any of the restrictions
set forth in this Agreement.
5 Termination
This Agreement is effective until terminated. You may terminate this Agreement at any time by
returning to QUBYX any disks, CDs and any associated dongles as well as the associated
documentation or other copies of the Software under Your control, together with written notice of
Your intent to terminate this Agreement. If You fail to comply with any provision of this Agreement,
this Agreement will automatically and immediately terminate without notice from QUBYX or the
requirement of any other action by QUBYX. Upon termination by QUBYX, You must destroy or return
to QUBYX all copies of the Software in Your control.
6 Improvements
You agree that QUBYX may, on a non-exclusive basis, use for any purpose, in any media now known
or hereafter devised, all suggestions, improvements, and any other information, ideas, concepts,
know-how, works of authorship, and inventions (including corrections to problems with the Software,
whether written or oral) (collectively, "Improvements") developed by You during the term of this
Agreement. You will promptly notify QUBYX of all such Improvements without any duty of accounting
or other compensation by QUBYX.
7 Government Licensee
If You are acquiring the Software on behalf of any unit or agency of the United Sates Government, the
following provisions apply. The Government acknowledges QUBYX’s representations that (a) the
Software was developed at private expense, contains information that is confidential and proprietary
to QUBYX, is a trade secret and is copyrighted; and (b) the Software is "Restricted Computer Software"
as that term is defined in Clause 52.227-19 of the Federal Acquisition Regulations ("FAR") and is
"Commercial Computer Software" as that term is defined in the Department of Defense Federal
Acquisition Regulation Supplement ("DFARS"). The Government agrees that if the Software is supplied
to the Department of Defense ("DoD"), the Software is classified as "Commercial Computer Software"
and the Government is acquiring only "limited rights" in the Software as that term is defined in Clause
252.227-7013(a)(13) of the DFARS. If the Software is supplied to any unit or agency of the United
States Government other that DoD, the Government agrees that the Software is classified as
"Restricted Computer Software" and the Government’s rights in the Software will be as defined in
Clause 52.227-19(c)(2) of the FAR.
8 No Warranties
THE SOFTWARE IS PROVIDED "AS IS", WITHOUT ANY WARRANTY OF ANY KIND. QUBYX EXPRESSLY
DISCLAIMS ALL WARRANTIES, WHETHER EXPRESSED OR IMPLIED, INCLUDING BUT NOT LIMITED TO,
THE IMPLIED WARRANTIE OF MERCHANTABILITY AND FITNESS FOR A PARTICULAR PURPOSE; ANY
WARRANTIES ARISING FROM A COURSE OF DEALING, USAGE OR TRADE PRACTICE; AND ANY
WARRANTIES OF NON-INFRINGEMENT OF ANY THIRD PARTY'S PATENT(S), TRADE SECRET(S),
TRADEMARK(S), COPYRIGHT(S) OR OTHER INTELLECTUAL PROPERTY RIGHTS. QUBYX DOES NOT
WARRANT THAT THE FUNCTIONS CONTAINED IN THE SOFTWARE WILL MEET YOUR REQUIREMENTS,
THAT THE OPERATION OF THE SOFTWARE WILL BE UNINTERRUPTED OR ERROR-FREE, THAT DEFECTS
IN THE SOFTWARE WILL OR CAN BE CORRECTED. FURTHERMORE, QUBYX DOES NOT WARRANT OR
MAKE ANY REPRESENTATIONS REGARDING THE USE OR THE RESULTS OF THE USE OF THE SOFTWARE
IN TERMS OF THEIR CORRECTNESS, ACCURACY, RELIABILITY, OR OTHERWISE. NO ORAL OR WRITTEN
INFORMATION OR ADVICE GIVEN BY QUBYX OR QUBYX'S AUTHORIZED REPRESENTATIVE OR ANY
REPRESENTATION MADE BY QUBYX OR ITS AUTHORIZED REPRESENTATIVE SHALL CREATE ANY
WARRANTY.
9 Limitation of Liability
UNDER NO CIRCUMSTANCES SHALL QUBYX BE LIABLE FOR ANY LOST REVENUE OR PROFITS OR ANY
INCIDENTAL, INDIRECT, SPECIAL, PUNITIVE OR CONSEQUENTIAL DAMAGES THAT RESULT FROM THE
USE OR INABILITY TO USE THE SOFTWARE, EVEN IF QUBYX OR ITS AUTHORIZED REPRESENTATIVE HAS
BEEN ADVISED OF THE POSSIBILITY OF SUCH DAMAGES IN ADVANCE OR SUCH DAMAGES WERE
CAUSED BY QUBYX'S NEGLIGENCE. IN NO EVENT SHALL QUBYX'S TOTAL LIABILITY TO YOU FOR ALL
DAMAGES, LOSSES AND CAUSES OF ACTION, WHETHER IN CONTRACT, TORT (INCLUDING
NEGLIGENCE) OR OTHERWISE, EXCEED THE AMOUNT PAID BY YOU FOR THE SOFTWARE.
10 General
a) The material laws of France shall govern the interpretation and enforcement of this Agreement. If
You are in North America, the material laws of the State of New York shall govern the interpretation
and enforcement of this Agreement.
b) If any term or provision of this Agreement or application thereof to any person or circumstances
shall, to any extent, be invalid or unenforceable, the remainder of this Agreement, or the application
of such term or provision to persons or circumstances other than that which is held to be
unenforceable or invalid, shall not be affected thereby, and each such term and provision shall be
valid and be enforced to the full extent permitted by law.
c) This Agreement constitutes the entire understanding of the parties with respect to the Software
and supersedes all prior and contemporaneous agreements, understandings, representations,
warranties, promises and other communications of any kind, whether written or oral, between the
parties with respect to the Software. No alteration, modification, variation or waiver of this
Agreement, or any of the provisions hereof shall be effective unless executed by both parties in
writing.