1
StatView
®
Using
StatView
®
Copyright
Copyright © 1998 by SAS Institute Inc. Second edition. First printing, March1998. Acrobat
edition revised October 1998.
All rights reserved. Printed in the United States of America. No part of this publication may
be reproduced, stored in a retrieval system, or transmitted, in any form or by any means, electronic, mechanical, photocopying, or otherwise, without prior written permission of the publisher, SAS Institute Inc.
Information in this document is subject to change without notice. The software described in
this document is furnished under the license agreement packaged with the software media.
The software may be used or copied only in accordance with the terms of the agreement. It is
against the law to copy the software on any medium except as specifically allowed in the
license agreement.
StatView® and SAS® are registered trademarks of SAS Institute Inc. in the and other
countries. All trademarks above are registered trademarks or trademarks of SAS Institute Inc.
The symbol “®” indicates registration. Other brand and product names are trademarks or
registered trademarks of their respective companies.
Technology License Notices
Mac2Win © software 1990–94 Altura Software Inc. All rights reserved. Mac2Win® is a registered trademark of Altura Software, Inc.
Portions of this software are copyrighted by Apple Computer Inc. Apple® and Macintosh®
are registered trademarks of Apple Computer Inc.
Portions of this software are copyright by Microsoft Corporation. Microsoft® , Windows,
Windows® 95, and Windows NT® are either trademarks or registered trademarks of
Microsoft Corporation.
Infinity Windoid is © 1991–95 Infinity Systems.
ISBN: 1-58025-162-5
Origin
StatView began with Jim Gagnon and Daniel S. Feldman, Jr. Subsequent versions of StatView
owe credit also to developers Joe Caldarola, Alex Benedict, Ania Dilmaghani, William F. Finzer, Keith A. Haycock, and Jay Roth. StatView has enjoyed its celebrated place in the international marketplace thanks to the ongoing efforts of Hulinks (Japanese StatView),
(French StatView), Cherwell (German StatView), and many others in the United States and
worldwide.
In 1997, John Sall, Senior Vice President and Cofounder of SAS Institute Inc., led SAS Institute’s acquisition of StatView and undertook its development.
Credits
Recent development of StatView was completed by Eric Wasserman, Ph.D., and Charles
Soper. Clifford Baron led recent product design and development efforts. Colleen Jenkins,
Director of the Statistical Instruments Division, guided StatView’s entry into the Statistical
Instruments offerings of SAS Institute, with sales, marketing, and technical support from Bob
McCall, Chuck Boiler, Bonnie Rigo, Nick Zagone, and Mendy Clayton. Annie L. Dudley led
the testing efforts of Nicole Hill Jones and Brenda Sun; early testing was done by Sid Butts
and Bruce Gilbert. Ann Lehman, Ph.D., Kristin Rinne, Terri March, and Lynn Scott made
production possible.
The manuals were written by Erin Vang. Authorship credit for significant portions of the StatView Reference is due to Nicholas P. Jewell, Ph.D. (Division of Biostatistics and Department of
Statistics, University of California-Berkeley, logistic regression and survival analysis), Clifford
Baron (QC analysis and survival analysis). Additional contributions were made by Daniel S.
Feldman, Jr., Samantha Sager, Pete Schorer, and Phil Spector, Ph.D. (Department of Statistics, University of California-Berkeley). Erin Vang also coordinated localization and revised
the help systems originally created by Clifford Baron.
Statistical consulting was provided by Phil Spector, Ph.D., Alan Hopkins, Ph.D., and Nicholas P. Jewell, Ph.D.
Acknowledgements
We are grateful to StatView users around the world for their continued support, and particularly for their comments, criticisms, suggestions, and praise. A special note of recognition is
due the users who have volunteered their time to beta test StatView.
Acknowledgements
It is through the efforts of all the people named above and many more whom we could not list
that we are able to accomplish our mission: to enable anyone—not just an expert—to perform
data analysis and present results. We do so by creating, marketing, and supporting statistical
and data analysis software that is easy to use and is therefore accessible to those who practice,
teach, or are learning data analysis.
Finally, we thank the Technical Support and Professional Services Divisions of SAS Institute,
whose contributions enable us to move forward and truly deliver on that mission.
Overview
Overview
The StatView manual comes in two volumes, Using StatView and StatView Reference. This volume, Using StatView, shows how to work with StatView.
1. The first chapter, “Tutorial,” steps you through every phase of a data analysis product with
StatView, from collecting and entering data, to analyzing data, to presenting your results.
If you read nothing else, read the tutorial.
Subsequent chapters expand on the concepts introduced in the tutorial.
2. “Datasets” discusses the structure of StatView datasets—how to arrange your data for StatView, how to enter and edit data in the dataset window, how to work with StatView’s data
attributes, and how to use category and compact variables.
3. “Importing and exporting” shows how to get datasets into StatView from other programs,
through Microsoft Excel files and plain text () files.
4. “Managing data” shows StatView’s special tools for generating and transforming variables,
sorting data, and studying subsets of your data.
5. “Analyses” shows how to build and modify analyses—statistical tables and graphs—and
how to work with tables and graphs in the view window.
6. “Templates” shows how to recycle a complete set of analyses by applying it as a template to
other datasets—a quick set of steps that can save you countless hours.
7. “Customizing results” shows how to redesign the appearance of StatView’s tables and
graphs to suit your needs and preferences.
8. “Drawing and layout” shows how you can assemble analysis results into a full-color presentation, complete with annotations and enhancements you draw yourself.
9. “Tips and shortcuts” shows how to use various online help facilities and how to set preferences to suit your way of working. Then, it demonstrates example documents and templates, answers common questions, and gives troubleshooting suggestions.
The second volume, StatView Reference, presents a reference chapter for each analysis, reviewing statistical ideas, then detailing data requirements, dialog box options, results, and related
templates. Finally, each chapter demonstrates the analysis with a step-by-step exercise. The last
chapter in StatView Reference is “Formulas,” a comprehensive reference for the mathematical
expression language used throughout StatView. Finally, StatView Reference is where you’ll find
algorithms and formulas, a glossary of statistical terms, and references.
StatView’s keyboard and mouse shortcuts are summarized on the StatView Shortcuts quick reference card.
Overview Examples
Examples
If you try examples shown in the manual, your results might look a little different from ours.
Some differences you might see:
1. In a dataset, variable attribute settings (type, format, number of decimal places, etc.) can
cause values to look different.
2. We often resize or scroll windows to focus the readers attention on a specific item, and we
often change display attributes such as plotting symbols, line types, and colors to accommodate black-and-white printing.
3. Illustrations show both Windows and Macintosh versions of StatView. Interface elements
such as title bars, window sizing controls, scroll bars, combo boxes or pop-up menus vary
slightly between platforms. If important interface elements differ, we show both Windows
and Macintosh illustrations side by side; Windows first, then Macintosh.
4. International system configurations can cause numeric, currency, and date/time formatting
to differ. We use a variety of formats in our examples.
5. Be aware that StatView performs numeric calculations in the fullest precision of the
machine you are using; therefore, results can differ slightly among platforms.
6. StatView represents missing values by bullets (•), and illustrations in these manuals use
bullets for maximum visibility. However, international versions of StatView represent missing values in the dataset and elsewhere with periods (.)
Keyboard and mouse chords
Often in StatView, special keyboard and mouse chords let you perform special functions. A
chord is any combination of simultaneous keystrokes and/or mouse actions.
For example, if you hold the Shift key while mouse-clicking several variables in the variable
browser (and then release the key and the mouse button), you can select multiple adjacent
variables at once. We write “Shift-click” to describe this action. Or, you can Copy the current
selection into the clipboard by holding the Control key (Windows) or the Command key
(Macintosh) and typing the letter “c,” then releasing both keys. We write “Type Control-C”
(Windows) or “Type Command-C” (Macintosh) to describe this action. Another example:
you can select several nonadjacent variables in the variable browser by holding the Control key
(Windows) or the Command key (Macintosh) and clicking the variable names. We write
“Control-click” (Windows) or “Command-click” (Macintosh). When Windows and Macintosh chords differ, we describe each separately; Windows first, then Macintosh. StatView’s
keyboard and mouse shortcuts are summarized on the StatView Shortcuts quick reference card.
Some chords require holding several keys as well as clicking with the mouse. For example, you
can Control-Shift-Alt-double-click (Windows) or Command-Shift-Option-double-click
(Macintosh) a variable name in the browser to clone an analysis with the Split By button.
Overview Keyboard and mouse chords
(Windows only) You can perform special functions by using the second mouse button. If you
are right handed, the first mouse button is the left button, and the second mouse button is the
right button. We describe clicking with the second button as “Right-click.”
Overview Keyboard and mouse chords
Contents
Contents
1 Tutorial
Data analysis the StatView way
Why should I bother with a tutorial?
Manage data
Our sample data
Enter data by hand
Import data
Open a dataset
Analyze data
Sort data
Examine summary statistics
Edit data
Compute formulas
Build an analysis
Remove variables
Edit a display
Edit analysis parameters
Split by groups
Clone an analysis with different
2 Datasets
variables
Use Criteria to examine a subset
Adopt variable assignments for a new
analysis
Create an analysis with several parts
Create a new grouping variable
Grouped box plots
Create an unpaired t-test
Create an ANOVA using a template
Save your work
Present results
Clean up results
Add some color
Print a presentation
Save a presentation
Save a template
Notes
Dataset structure
Example
Data class
Data arrangement
Other arrangements
Columns vs. variables
Dataset windows
Dataset preferences
Variable browser
Enter data
Name variables
Set attributes
View summary statistics
Enter values
Manipulate columns and rows
Move and scroll
Edit data
Select data
Cut, clear, and delete data
Copy data
Paste data
Paste transposed data
Contents
Copy and Paste unusual selections
Save datasets
Exchange datasets between Windows
and Mac versions of StatView
Close datasets
Open datasets
Print datasets
Variable attributes
Type
Source
Class
3 Importing and exporting
Microsoft Excel
Read Excel files
Write Excel files
ASCII text
Import text
Export text
How StatView imports data
Variable names
Data types
4 Managing data
Missing values
Category definitions
Example
Older StatView products (Macintosh
only)
Text
Old StatView data
SuperANOVA data
Manage multiple datasets
Include and exclude rows
Formula
Build definitions
Some examples
Exercise
Shortcuts
Errors in formula
Dynamic vs. static formulas
Sort data
Recode data
5 Analyses
Format
Decimal places
Categories
Create category definitions
Enter category data
Edit category definitions
Delete unused categories
Compact variables
Build compact variables
Expand compact variables
Analyze compact variables
Continuous data to nominal groups
Missing values to a specified value
Exercise
Series
Exercise
Random numbers
Create criteria
Define criteria
Criteria pop-up menu
Edit/Apply Criteria
Exercise
Overview
Exercise
Determine whether results are
selected
Edit Analysis
Edit Display
Contents
Multiple and compound results
Control recalculations
Analysis windows
View window
Analysis browser
Variable browser
Results browser
View (Windows only) and Window
menu
Analyze subsets
Exercise
Create an analysis, then assign
variables
Assign variables, then create an
analysis
6 Templates
Add more results
Add variables to existing analyses
Adopt variables for new analyses
Split analyses by groups
Save a view
As a view
As a template
As a text file
As a PICT file
As a WMF or EMF file
Reopen your work
Use original variables
Assign different variables
Print a view
Use templates
Assign variables to templates
Manipulate results
Exercise
Manage templates
7 Customizing results
Rearrange templates
Update the Analyze menu
Build templates
Template tips
Exercise
Preferences
Edit Display dialog boxes
Preview changes
Undo changes
Clipboard commands
Cut and Copy
Duplicate
Clear
Paste
Graphs
Select graphs
Select components
Overlay graphs
Resize graphs
Move graphs or components
Change text items
Change overall structures
Change axes
Change legends
Change plotting symbols
Change colors
Tables
Select tables
Select components
Resize tables
Move tables or components
Change text items
Change overall structure
Change line thicknesses and pen
patterns
Change colors
Contents
8 Drawing and layout
Draw tools
Select objects
Add text objects
Draw objects
Import objects
Change fill patterns, pen patterns, and
line types
Change colors
9 Tips and shortcuts
Tool Bar (Windows only)
Help
Hints window
Help (Windows only)
Status bar (Windows only)
Tool tips (Windows only)
Apple Guide (Macintosh only)
Balloon help (Macintosh only)
Error messages
Alert messages
Preferences
Application preferences
Color Palette preferences (Macintosh
only)
Dataset preferences
Formula preferences
Graph preferences
Hints preferences
Survival Analysis preferences
Index
Layout tools
Control page layout
Arrange objects
Move objects
Lock and unlock objects
Group objects
Overlap and overlay objects
Rulers and grid lines
Table preferences
View preferences
StatView Library
Example Views and Datasets
Dataset Templates
Normality Test
Compute Bartlett’s Test and Compute
Welch’s Test
Make your own dataset templates
Common questions
Dataset
Formulas and criteria
QC analysis
Survival analysis
Troubleshooting
General problems
Importing
Printing
Formulas and criteria
Tutorial
1
Data analysis the StatView way
Data analysis is hard enough without software getting in your way. That’s why StatView is
designed to be easy to use. We’re not saying your research will be easy. If research were easy
we’d have a cure for the common cold by now. We’re just saying that you should be able to
concentrate on your research instead of your software.
So we designed StatView to be simple, consistent, flexible, and powerful. We think that if you
spend just an hour with this tutorial, you’ll learn everything you need to know to get around
in StatView. And you’ll also know where to look in StatView for the trickier techniques you
want to know.
We designed StatView to do everything you need to do, starting with data spreadsheets and
going all the way through your project to full-color presentations. And we made it dynamic,
so that any changes you make to your data along the way automatically trickle through all
your analyses. So you can change any graph or any table any time, directly, in place, without
having to redo anything. So you can fix that one tiny error you made weeks ago—quickly, the
morning of your presentation.
All of StatView’s advanced analyses work the same way as the simple ones, so once you know
how to build one analysis, you can build any analysis. (If you need a quick review of some of
the statistical techniques, we’ll give you a hand with that, too.)
Why should I bother with a tutorial?
This tutorial is meant to get you started using StatView by stepping through typical activities
in each phase of a data analysis project:
1. Manage data (collect data, enter or import data into StatView, find and fix errors, sort
groups, get a feel for the numbers)
2. Analyze data (explore the data, look for patterns, test your hypotheses, turn raw data into
information)
3. Present information (put together persuasive graphs, annotate results with your comments,
call attention to the discoveries that lead to your conclusions)
It is also meant to give you a taste of chocolate.
1 Tutorial Manage data
What?!
No, seriously! By the time you finish this tutorial, you will be craving a candy bar. What’s
more, you’ll know which candy bars are the most nutritionally sound.
Usually you concentrate on your data, not StatView. But now we want you to concentrate on
how StatView works, so we’re going to use a simple, fun dataset—something you won’t have
to think about too much.
Don’t take it too seriously: we’re not trying to get a grant, cure cancer, or influence public
opinion. That’s what you do. We just try to help by providing simple, powerful software.
Manage data
In any data analysis project, the first thing you have to do is collect data. We’ll introduce the
sample dataset you’ll be using in this tutorial.
Then you need to get it into StatView. Some common ways to do this:
1. Enter the data by hand into StatView’s data window
2. Import the data from a text file or another application, such as Excel
3. Open a StatView dataset that somebody else created
We’ll step you through each possibility.
Our sample data
Background
Since 1994, the United States Food and Drug Administration () has required uniform,
easy-to-read nutrition labeling for nearly all foods. The purpose of the new label is to reduce
confusion and help consumers choose more healthful diets. Unlike prior labeling laws, the
reform requires that even such items as candy bars carry full nutrition labels, and also requires
that nutritional facts per realistic serving must be reported, including total calories, total fat,
saturated fat, cholesterol, sodium, total carbohydrate, dietary fiber, sugars, protein, vitamins A
and C, calcium, and iron.
The United States Department of Agriculture () and the Department of Health and
Human Service () have teamed up to produce the Food Guide Pyramid, which recommends eating a variety of foods, an appropriate number of calories, and a modest amount of
fat—specifically, 30% or fewer of your total number of calories per day should be calories
from fat, and only a third of those should be calories from saturated fat. Fat is the densest
source of calories, at 9 calories per gram. (Alcohol is a close second at 7 calories per gram.)
For adults consuming 2000 calories per day (which is about right for moderately active
women and somewhat sedentary men), that works out to no more than 65 grams of fat, no
more than 20 grams of which are saturated fat.
1 Tutorial Manage data
Chocolate
We want to know how many candy bars can fit into this daily diet. The first thing we need to
do is gather nutritional data. We went clipboard in hand to a few stores near our Berkeley,
California offices and stood in the candy aisle copying down nutritional facts about every
candy bar we could find.
We also included some non-bar candies like M&Ms and Reese’s Pieces, because they’re very
similar to many candy bars. Once we’d made that decision, it seemed only fair to include
other non-chocolate candies, such as Skittles and Super Hot Tamales. Was this a good decision, theoretically? Maybe, maybe not. We’ll have to study that in our analysis. Fortunately,
StatView has all sorts of tools for excluding “weird” cases from analyses, so if it’s a mistake, we
won’t suffer too much.
Then we came back to the office (miraculously, without a single candy bar!) and sat down to
enter the data.
Enter data by hand
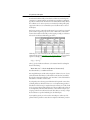
Here’s a small part of the dataset:
Brand
Name
Serving/
pkg
Oz/pkg
Calories
Total fat g Saturated
fat g
M&M/Mars
Hershey
Hershey
M&M/Mars
Charms
Snickers Peanut Butter
Cookies 'n' Mint
Cadbury Dairy Milk
Snickers
Sugar Daddy
1
1
3.5
3
1
2
1.55
5
3.7
1.7
310
230
220
170
200
20
12
12
8
2.5
7
6
8
3
2.5
StatView’s data organization
These data are already organized the way StatView wants: each case or observation (each specific candy bar) is in a horizontal row, and various characteristics or variables appear in vertical columns. Each value occupies a cell in the table.
This row-and-column design is important. It means that any value in any column belongs to
one row (one case, one observation, one candy bar) and only one row. The very organization
of the numbers tells you something. For example, the 170 in the Calories column is not just
any measurement of calories on any subject. It corresponds exactly to the Name in the same
row: Snickers. It corresponds exactly to the measurement of total fat in the same row: 8 grams.
StatView holds its data in a dataset, a spreadsheet format in which columns represent variables
(such as gender, weight, height) and rows represent cases (such as patients in a medical study
or plots in a field study).
1 Tutorial Manage data
Start StatView
• Double-click the StatView icon
The first thing you see (after a splash screen) is a welcome message in a Hints window:
Keep an eye on the Hints window as you begin to work with StatView. As its welcome says, it
gives helpful information about what you’re doing, how to handle errors, and what to do next.
You can close the window if you prefer. To reopen it at any time, select Hints from the View
menu (Windows) or Window menu (Macintosh).
Start a new dataset
• From the File menu, select New
• You see an empty, untitled dataset. You can resize or move the window if you want. Take a
moment to look at the parts of the window.
First notice the top row of variable names. Right now we have only one name, “Input Column.” Let’s change that to be our first variable name, Brand:
• Click the “Input Column” cell to select it
• Type a new name: Brand
• Press Enter or Return
Now you have another empty “Input Column.”
1 Tutorial Manage data
• Click the next column and type Name
• Press Tab to move to the next column, and type Serving/pkg
• Name the rest of the columns: Oz/pkg, Calories, Total fat g, Saturated fat g
Next, notice the attribute pane. The top five rows of the dataset tell you the type, source,
class, format, and decimal places for each variable. You can change each of these attributes
directly: just click and hold the cell you want to change, then select the correct setting from
the pop-up menu. You can show or hide as many of the rows as you desire by double-clicking
or clicking and dragging the attribute pane control on the vertical scroll bar. Notice that the
control changes appearance when the attribute pane is closed.
open
closed
open
closed
attribute pane control
The first attribute, type, indicates whether the data are integers, real numbers, categories
(group memberships), string, currency, or date/time. Since our first variable, Brand, contains
group or category data, we need to change the type to category:
•
•
•
•
Scroll back to the first column
Click and hold the mouse button on the Real cell in the attribute pane
Select the correct type: Category
Release the mouse button
The category data type is a timesaving feature in StatView. When a variable records group
memberships, the same values are used repeatedly for many cases. For example, many different candy bars are manufactured by the major brands, Hershey, Nestle, and M&M/Mars.
(Each candy bar is a case belonging to one of the brand groups.) Creating a category definition makes it faster to enter the data, prevents data entry errors, and saves and disk space.
Here’s how it works: first we create a category definition containing the group or level names
we plan to use. Then we use this category definition to enter the data.
• Click New to create a new category definition
1 Tutorial Manage data
•
•
•
•
•
Type the first Brand name in the Group label box: M&M/Mars
Click Add
Type the next name (Hershey) and click Add
Type the last name (Charms) and click Add
Click Done
StatView automatically sets Format and Decimal Places to “missing,” since those attributes
don’t make sense for category variables. We’ll discuss missing values some more later; “not
applicable” is the idea here.
The second attribute, source, answers the question, “Where did these data come from?” Most
data are user entered raw values, but others are computed from static or dynamic formulas
(such as the sum of several variables), and others are generated by analyses (such as residuals
from a regression).
The third attribute, class, tells how the data are to function: as continuous measurements
(such as calories, fat in grams, etc.), as nominal data (such as our brand groups), or as informative (such as name labels or identification numbers). Since we’ve set type to category, StatView automatically sets class to nominal.
Having set all the attributes for Brand, we are ready to enter data. Now we can see the power
of categories:
1 Tutorial Manage data
• Click the first empty (gray) cell in the Brand column to select it
• Type the first letter of the first value (M&M/Mars): m
StatView supplies the rest of the name. (If you had several groups beginning with M, you
would need to type a few more letters.) All you need to do is accept the value:
• Press Enter or Return to move to the next cell
You can also enter category values by typing its number: 1 for the first group, 2 for the second
group, etc., in the order that you defined them. This alone saves you time. Now think of how
much time you’ll save not having to correct your typing mistakes—especially on a hard-totype name like M&M/Mars!
Let’s try using both shortcuts to finish entering brand names:
• Type h and press Enter or Return
• Type 2 and press Enter or Return
• Type 1 and press Enter or Return
• Type c and press Enter or Return
Now we’re ready for the Name variable. First, we need to change its type from real to string,
because the candy bar names are text, not numbers.
• From the Type pop-up menu, select String
(In the Name column, click and hold Real, select String from the pop-up menu, and
release the mouse button)
Again, we don’t need to do anything with source, format, or decimal places. We do need to
change Name’s class from nominal to informative: (Name is not a grouping variable, because
each value is unique. Rather, the names identify each case.)
• From the Class pop-up menu, select Informative
Now we can enter values:
• Click the empty cell in the first row for Name
• Type the first name: Snickers Peanut Butter
• Press Enter or Return to store the value and move to the next cell
• Enter the rest of the names the same way: Cookies ’n’ Mint, Cadbury Dairy Milk, Snickers, Sugar Daddy
1 Tutorial Manage data
The rest of the variables are all numeric, so we don’t need to change their attributes. Notice
that the cells all contain missing values (periods . for numeric variables, blank cells for character variables) right now, indicating that no values have yet been specified. Let’s just enter the
values:
• Click in the first cell for Serving/pkg and type the first value: 1
• Press Enter or Return to store the value and move to the next cell
• Enter the rest of the values the same way: 1, 3.5, 3, 1
Notice that StatView reformats the numbers to have three decimal places, which matches the
current attribute setting for decimal places. (This setting only affects the way numbers are displayed; StatView stores values exactly as you specify them and carries the fullest precision supported by the hardware platform through calculations and analyses.)
• Enter the values for Oz/pkg: 2, 1.55, 5, 3.7, 1.7
• Enter the values for Calories: 310, 230, 220, 170, 200
• Enter the values for Total fat g: 20, 12, 12, 8, 2.5
• Enter the values for Saturated fat g: 7, 6, 8, 3, 2.5
Now take a moment to check your work. If any values are wrong, just click the cell, type a
new value, and press Enter or Return.
An easy way to check for data entry mistakes is to view all rows of the attribute pane, and look
at the summary statistics:
• Click and drag the attribute pane control ( ) downward to expose the twelve rows of
summary statistics for each variable
1 Tutorial Manage data
If any of those statistics seem wrong, look for an error in the column. With large datasets, this
trick can be a big time-saver. (Results can differ slightly among different platforms due to differences in numerics handling. For example, on some systems, the Sum of Squares for Oz/pkg
is 47.982; on others, it is 47.983.)
We’ll examine this summary pane later in the tutorial. For now, let’s close the summary pane.
• Double-click the pane control to hide the summary statistics
Now let’s make a few aesthetic adjustments. First, notice that all the Calories values are whole
numbers. We can save memory by storing this variable with type integer.
• From the Type pop-up menu, select Integer
Also notice that the other variables have only one significant decimal place. It will be easier to
view these numbers with just one decimal place.
• Control-click (Windows) or Command-click (Macintosh) the four variable names to select
all four columns
• From the Decimal Places pop-up menu in any one of the columns, select 1
(Click and hold the “3” cell in one of the columns, select 1, and release the mouse button)
1 Tutorial Manage data
Let’s also make the Name column wide enough for its values:
• Click any value in an unselected column to deselect the four columns
• Click and hold the border between Name and Serving/pkg
• Drag the border to the right and release the mouse button
Let’s close the attribute pane and save the dataset
• Double-click the pane control to close the attribute pane
• From the File menu, select Save
• Specify a filename Candy Bars First 5
• Click Save
Let’s close this dataset.
• From the File menu, select Close Candy Bars First 5
Next, we learn how to import data.
Import data
Often you have data already entered in another application. StatView can read Excel files
directly, and it can read plain text () files exported by other applications. f
1 Tutorial Manage data
Read an Excel file
Check the WhatsNew.PDF document finstalled in the StatView folder for the latest information on versions of Excel files that StatView can read.
• From the File menu, select Open
• For Files of type (Windows) or Show (Macintosh), select Excel
• Select the file Candy Bars.xls from the Sample Data folder
• Click Open
While StatView is importing the dataset, the cursor changes to a yin-yang, and a message window shows its progress:
StatView reads the entire Excel worksheet into a single StatView dataset. StatView reads only
the values in each cell—it does not import functions, macros, or links. This is the complete
Candy Bars dataset. Take a moment to scroll right and left to see all the variables, then scroll
up and down to view all 75 rows.
StatView converts Excel data types and formats to the nearest StatView equivalents. (For
details on how this works, see the chapter “Importing and exporting,” p. 99.) We only need to
change a few of the variable attributes.
• Change Brand from type string to category
(Click and hold the Real cell in the Brand column, select Category, and release the mouse
button)
(StatView automatically figures out how to define the category by scanning the values present
in the column. You may examine the definition, if you want, by selecting Edit categories from
the Manage menu.)
1 Tutorial Manage data
• Change Name from class nominal to informative
If you were going to use this dataset for a real analysis, you might also want to make some aesthetic adjustments. (You aren’t going to use this dataset, so you may prefer to close the file and
skip ahead to the next section, “Open a dataset,” p. 13.)
• Control-click (Windows) or Command-click (Macintosh) the names Serving/pkg, Oz/
pkg, Total fat g, and Saturated fat g to select all four columns
• From the Decimal Places pop-up menu, select 1
• Click and drag over the variable names for Brand and Name to select both columns
• Click and drag the border between their names to widen both columns
• Shift-click or click and drag over all the numeric variables’ names to select those columns
• Click and drag the border between any two variable names to make all the columns narrower at once
• Double-click the
pane control to close the attribute pane
• From the File menu, select Save
• Change the filename if you want, then click Save
• Close the file
Read a text file
In this exercise, we will import a plain text () file. Most applications have an option to
save in a plain text format. StatView can read files delimited by tabs, spaces, commas, returns,
or any character you specify.
• From the File menu, select Open
• Choose the Text file format
• Select Candy Bars.txt from the Sample Data folder
• Click Open
• Click Import
(Our sample file is tab delimited, so we don’t need to change any settings)
StatView reads the values in each column of the text file and does its best to guess the appropriate attributes.
1 Tutorial Manage data
Notice that StatView made the same guesses for this file as it did for it’s Excel equivalent. You
would need to make the same adjustments to its attributes. (You may experiment with it if
you like.)
• Close the dataset
Open a dataset
Often you will begin your StatView data analysis sessions by simply opening a StatView
dataset—perhaps one you saved the day before, perhaps one you received from a colleague.
Since all display attributes are saved along with the values, you just open the file and begin
your analysis.
• From the File menu, select Open
• Select Candy Bars Data from the Sample Data folder
• Click Open
A complete dataset with attributes all set and ready to go appears:
1 Tutorial Analyze data
Analyze data
Sort data
One of the most important (and overlooked!) data analysis tools is sorting. It would be easier
to get a feeling for these candy bars if they were grouped by brand. Let’s also alphabetize them
within each brand.
• From the Manage menu, select Sort
• Select Brand and click Make Key
• Double-click Name
The up arrows ( ) next to each sort key indicate ascending sort (least to greatest numerical
sorting, alphabetical text sorting). If you preferred descending sort, you could click the arrow
to change it to a down arrow ( ).
• Click OK
Quiz
(Quizzes are optional. If you’re in a hurry, skip ahead to the next section.) Now scroll through
the dataset and get a feel for the data. See if you can answer some questions just by looking at
the data.
Which candy bar manufacturers make the most candy bars? Notice that Hershey, Nestle,
and M&M/Mars appear in big clumps. This wasn’t obvious before we sorted.
Which candy bars have been popular enough to spawn sequels? Snickers, Reese’s Peanut
Butter Cups, Milky Way and others have several varieties. Before sorting the names, we
couldn’t see these easily.
Examine summary statistics
In most data analysis packages, if you want basic descriptive statistics (means, standard deviations, and so forth), you need to type some commands. If your data change, you need to start
1 Tutorial Analyze data
over. In StatView, all you have to do is open a pane in the dataset window. If your data
change, the statistics update automatically.
• Click and drag the attribute pane control ( ) downward to expose the twelve rows of
summary statistics for each variable
• Scroll to the right so you can see the numeric variables
Edit data
These summary statistics can help you spot and fix data entry errors quickly. For example, let’s
change the top Oz/pkg value from 1.25 to 125—dropping a decimal point is a common data
entry error.
• Click the cell to select it
• Type 125
• Press Enter or Return
Notice that the summary statistics change right away—probably faster than you can see. Now
notice that the Maximum is 125. That would be a big candy bar!
Also notice that the Mean candy bar is 3.84 oz., but the standard deviation is 14. We know
that, if candy bar sizes are normally distributed, most candy bars should fall within two stan-
1 Tutorial Analyze data
dard deviations of the mean. That would mean some candy bars have negative weight. Even if
sizes aren’t normally distributed, these statistics would not seem likely!
Either discovery would tell us to look for an error.
• Click the 125 cell
• Change it back to 1.25
• Press Enter or Return
These statistics make more sense.
Quiz
Try to answer these questions by examining your summary statistics pane. You may need to
scroll through the dataset to answer some questions. You also might want to resize the data
window to be taller and wider.
What’s the smallest number of calories per serving you can find in a candy bar? Look at
Minimum for Calories. The least value is 125.
How much does the per-serving total fat vary from candy bar to candy bar? What’s the average? See Range (or Minimum and Maximum) for Total fat g. The candy bars range from 0g
to 29g per serving. They average just below the halfway mark at 11.9g, and most should fall
within two standard deviations (10.4g) above or below that, if they’re normally distributed.
That’s a pretty big spread.
If you were watching your fat intake, which candy bars would be good choices? The Minimum for Total fat g is 0g. Scroll through and look for the case(s) with 0 values to see that
Super Hot Tamales are your choice. Other choices with small numbers are Big Hunk, York
Peppermint Patty, Skittles, Sugar Daddy, Tiger Sport, and Twizzler.
How many candy bars are in the dataset? Look at the Count for Calories. The count is 75,
which means we have 75 nonmissing cases. Since Missing Cells is 0, we also know that our
dataset has 75 rows.
Did any manufacturers refuse to tell us about saturated fat? Look at Missing Cells for Saturated fat g. Since it’s 0, we know that the manufacturers complied with rules and printed this
information for all the candy bars.
When you’re done, close the entire attribute pane.
• Double-click the pane control ( ) to shrink the pane
• Double-click it again to close it completely
1 Tutorial Analyze data
Compute formulas
Before we move on to analysis, let’s generate a formula. The guidelines say we can have up to
2000 calories a day. How many candy bars would that be, if we didn’t eat anything else?
• From the Manage menu, select Formula
• Use the calculator pad or your keyboard to enter “2000 / ”
• Double-click Calories from the list of variables in the upper left corner
• Click Compute
Now at the right end of the dataset, you should see a new variable with a boring name.
• Click that boring name (Column 18)
• Type a better name: Bars per day
• Press Enter or Return
Now you have a brand new variable whose values tell you how many of each candy bar you
could eat. There’s only one problem—you can’t see the Name column anymore.
Not to worry! You can split the dataset window horizontally.
• Drag the horizontal split-pane handle to the right
(It’s the black bar to the left of the horizontal scroll bar)
• Scroll Brand and Name into view on the left side
• Scroll the right side to the end, so you can see Bars per day
1 Tutorial Analyze data
(We also made the whole window small for this illustration. You can pick a size you like.)
It’s easy to see you could have 12 Cup O Golds, or 8 Almond Joys, or 4 Mr. Goodbars, or 11
Peppermint Patties…
Oops! We forgot that these data are per serving, not per bar, and some of the candy bars are so
big they have several servings per package! We need to fix that formula.
• Open the attribute pane
Double-click the attribute pane control
• From the Source pop-up menu for Bars per day, select Dynamic formula
Click and hold that cell, then release the mouse button
Now we just edit the formula in the dialog box to have another division term:
• Click just after the existing formula
• Click / in the keypad area of the formula dialog box, or type a / (slash)
• Double-click Servings/pkg from the list of variables
• Click Compute
1 Tutorial Analyze data
The sad truth is we can only have 4 Almond Joys—that one had 2 servings per package. Accurate data analysis disappoints coconut and almond lovers everywhere.
Quiz
If you’re in a hurry, you can skip past these quizzes. If you have the time, though, they’ll give
you some practice and help you learn more about the functionality you’ve learned.
You’re supposed to limit total fat intake to 65 grams per day. How many candy bars could
you eat if you were only worried about total fat? Create a new variable called “Total fat
rule” with this formula:
65 / "Total fat g" / "Serving/pkg"
Now you are reduced to 8 Cup O Golds, or 2 Almond Joys, or 2 Mr. Goodbars. But, now you
could have 16 York Peppermint Patties.
Only 20 grams of that total fat should be saturated fat. How many candy bars could you eat
if you were only worried about saturated fat? Create a new variable called “Sat fat rule”
with this formula:
20 / "Saturated fat g" / "Serving/pkg"
Yikes! More bad news! You’re down to 4 Cup O Golds, 1 Almond Joy, or 1 Mr. Goodbar. And
York Peppermint Patties are back down to 8.
Most people should try to get 25 grams of fiber per day. How many candy bars would that
take? What’s the best choice for fiber? Create a new variable called “Fiber rule” with this formula:
25 / "Dietary fiber g" / "Serving/pkg"
Clearly, candy bars are not a good source of fiber. Most would take more than 20 packages,
and some don’t have any fiber at all (see the missing values). If you open the summary statistics pane, you see that 4.2 is the Minimum—scrolling down, you find that’s the Almond Joy.
Is there any candy bar that would give you enough fiber without putting you over the calorie and fat limits? This is a complex one, and we’ll need to rely on StatView’s logical functions to do it efficiently. Create another formula variable called “Composite” with this formula:
if "Fiber rule" <= "Bars per day" AND
"Fiber rule" <= "Sat fat rule" AND
"Fiber rule" <= "Total fat rule"
then 1
else 0
Click the “if…” button in the keypad area of the formula dialog box. (Or type “if,” or use the
function browser in the lower left corner of the formula dialog box. We’ll show you that in the
“Managing data” chapter under “Function browser,” p. 111.) Don’t worry about formatting
the formula exactly like you see here; we just broke the lines like this to make it easier to read.
Now scroll through the results, and see whether any candy bars have a “1,” meaning they meet
all the requirements. Tiger Sport is the only one: 12.5 Tiger Sports give you all the fiber you
need, but you could have 16 before you broke the calorie rule, according to Bars per day.
1 Tutorial Analyze data
Build an analysis
We’ve already analyzed these data quite a bit, without ever having left the dataset window.
Now it’s time to see some real analysis power.
• From the Analyze menu, select New View
Now you see StatView’s view window. This is where you’ll build statistical analysis tables,
draw graphs, and put together presentations. Think of the view window as your paper.
Along the left side of view window is the analysis browser, which is a scrolling list of the statistical and graphical analyses you can create in StatView. To create an analysis, just select the
analysis from the analysis browser, then click the Create Analysis button. (Some analyses, like
Frequency Distribution, have little triangles in front of their names. Click any triangle to
reveal a more specific set of choices.)
For example, we can get Descriptive Statistics about the candy bars:
• Click Descriptive Statistics
• Click Create Analysis
A dialog box asks which descriptive statistics we want. Take a look at “More choices” if you
want to see all the descriptives StatView can do. For now, we will just compute the basic set of
statistics.
1 Tutorial Analyze data
• Choose Basic
• Click OK
Now you should see an empty analysis object, with black selection handles indicating that the
object is selected:
The note on the empty object says what to do next. We use the variable browser to add variables to the empty analysis:
• Make sure the object is still selected (has black handles); if not, click it to select it
• In the Variable Browser, Shift-click to select Calories, Total fat g, and Saturated fat g
• Click Add
(Notice that each of these variables is marked with a
icon in the variable browser, indicating that the variables are continuous. Similarly, Brand has an
icon for nominal, and Name
has an
icon for informative. We made these class settings in the attribute pane of the
dataset window, and now the browser reminds us. StatView also uses these settings to help you
assign appropriate variables to each analysis.)
Ta-dah! You’ve completed your first analysis in StatView. Black handles indicate the object is
still selected.
1 Tutorial Analyze data
While the analysis is selected (has black handles), notice that the variable browser marks
which variables are used: each variable has an X marker. The X marker means the variable is
an X (or independent) variable in the selected analysis. We’ll see other markers later.
Here’s the fun part. Analysis objects are incredibly flexible. You can:
1. add variables
2. split the analysis by a nominal (grouping) variable
3. remove variables
4. replace variables with different variables
5. change the way statistics are displayed
6. choose different statistics
7. etc., etc., etc.!
We’ll try some of these things as we continue our quest for the ideal candy bar.
Remove variables
Let’s just look at calories for now.
• Make sure the analysis is still selected (has black handles); if not, click it
• In the variable browser, select Total fat g and Saturated fat g
• Click the Remove button
1 Tutorial Analyze data
Our analysis is updated, in place, to show just calories. Also, the variable browser updates so
that only Calories has an X marker.
Notice the analysis is really short and wide. It might look better if we flipped it sideways.
Edit a display
• Make sure the analysis is still selected
• Click the Edit Display button at the top of the view window
• Check Transpose rows and columns (click the checkbox so it has a check mark)
• Click OK
As easy as that, we’ve transposed the whole table:
1 Tutorial Analyze data
Just as easily, we could have changed the table’s number formats, borders, and row height.
Edit analysis parameters
You may not be surprised about how easy it is to transpose a table’s display. Would you believe
it is just as simple to change the parameters of an analysis?
• Make sure the analysis is still selected
• Click the Edit Analysis button at the top of the view window
Now we see the same dialog box of analysis parameters as when we first created the analysis.
Almost all of StatView’s graphs and analyses have a set of options for specifying exactly how to
complete the analysis, and you can always change your mind by clicking Edit Analysis and
making new choices.
• Click More choices
This expanded version of the analysis parameters dialog box lets us choose exactly which statistics we want. (Scroll down to see all the possibilities.) Since we know our dataset has no
missing values, let’s save space by turning off the Number missing option.
• Uncheck Number missing
(Click the box to remove the check mark.)
1 Tutorial Analyze data
• Click OK
Split by groups
How does per-serving calorie content of candy bars vary among the different brands? We can
split this analysis by Brand group to find out:
• Make sure the analysis is still selected (if not, click the object to select it)
• In the variable browser, select Brand
• Click the Split By button
Now we have a table of descriptive statistics broken down by Brand groups. Unfortunately, it’s
so wide it runs off the window. Let’s untranspose it.
• Make sure the analysis is still selected
• Click the Edit Display button at the top of the view window
• Uncheck Transpose rows and columns (click the checkbox to remove the check mark)
• Click OK
1 Tutorial Analyze data
This table shows descriptive statistics for the candy bars made under each brand name—for
example, 160 is the mean calories per serving for the bars made by Adams & Brooks (of which
there is only 1, according to the Count statistic), whereas all the different M&M/Mars bars
average out to 236 calories per serving. The top row of the table shows statistics for the total,
or for candy bars from all brands combined.
Clone an analysis with different variables
We’re still interested in fat, so let’s clone this table into a new one using the Total fat g variable:
• Make sure the analysis is still selected
• In the variable browser, select Total fat g
• Control-Shift-click (Windows) or Command-Shift-click (Macintosh) the Add button
1 Tutorial Analyze data
Cloning an object makes a new copy of the object using the new variables, leaving the original
object unchanged. (We could have added Total fat g to the original table instead, but two separate tables are easier to read.)
Notice that Split By Brand is still in effect. Let’s clone this analysis for Saturated fat g, also:
• Make sure the analysis is still selected
• In the variable browser, select Saturated fat g
• Control-Shift-click (Windows) or Command-Shift-click (Macintosh) the Add button
Dotted red lines in the view window indicate page breaks.
1 Tutorial Analyze data
Use Criteria to examine a subset
The numbers in the Count columns of these tables reveal that only Hershey, Nestle, and
M&M/Mars have six or more different candy bars. (Annabelle has five, so you might want to
include that brand as well; it’s your choice.) Perhaps we should narrow our study to these three
major brands. StatView makes it easy to do that.
• Bring the dataset window to the front by clicking it or by selecting Candy Bars from the
Window menu
• From the Criteria pop-up menu, select New
• In the Criteria dialog box, double-click items in the scrolling selection list to build the criteria definition:
Brand ElementOf {Hershey, "M&M/Mars", Nestle}
(Start by double-clicking Brand. Now you have a new set of choices: double-click ElementOf.
Your choices change again: click Hershey, then M&M/Mars, and finally Nestle. Notice how
StatView guides you through each step, so you don’t have to learn any special rules.)
• In the Criteria name box, type a name for the criterion: Big Three
• Click Apply
Look at the dataset window. Notice how the row numbers for candy bars made by other manufacturers are dimmed, indicating that the cases are not included in analyses. Also, the Criteria pop-up menu shows the criterion in effect.
1 Tutorial Analyze data
Now, look at the view window—click the window or select Untitled View #1 from the Window menu. Notice how all your analyses have already updated themselves to show just the
results for the big three brands.
And, so that you don’t forget that you’re looking at just a subset of your data, each object’s title
now includes “Inclusion criteria” information.
Adopt variable assignments for a new analysis
If a picture is worth a thousand words, a graph must be worth a thousand statistics. Let’s look
at a box plot of these variables.
1 Tutorial Analyze data
We can do this a number of ways. We could create a box plot analysis and add variables to it,
just as we did to create our first descriptive statistics table. Or, we could select a table and then
adopt its variable assignments for a new analysis:
• Select the first table by clicking it
• From the analysis browser, select Box Plot
• Click Create Analysis
StatView creates a box plot analysis object, and then automatically adds the Calories variable.
StatView also assigns Brand as a Split By variable again, so that this box plot is the graphical
equivalent of the statistics table.
Quiz
Which brand offers the widest variety of calories per serving in its candy bars? Examine
the box plots. The box-and-whisker for Hershey is more than twice as wide as the other boxes.
Which brand has the highest-calorie-per-serving candy bar? Again in the box plot, notice
that Hershey’s highest point is well above the maxima for the other two brands.
Which brand has the lowest-calorie-per-serving candy bar? M&M/Mars takes the honors
here: its lowest point is right at the bottom of the graph.
Is the fat variation similar to the calorie variation? Do a box plot of Total fat g: select the
Total fat g descriptive statistics table, select Box Plot from the analysis browser, and click Create Analysis. The only surprise is that Hershey has the lowest fat-content candy bar, while
M&M/Mars has the lowest calorie-count candy bar.
Is the saturated fat variation similar? Similarly, do a box plot of Saturated fat g by starting
with the statistics for Saturated fat g. Again, the results are similar. Hershey also has the lowest
saturated fat content. Since saturated fat is part of the total fat, it is not surprising that these
two go closely together. However, the plots show somewhat different distributions, which
means that the proportions of unsaturated fat content (something nutrition labels don’t
report) do vary.
Are the other brands (besides Hershey, M&M/Mars, and Nestle) much different? Temporarily turn off the Big Three criterion: in the dataset window, select No Criteria from the Criteria pop-up menu. When you’re ready to continue, select the Big Three criterion again.
1 Tutorial Analyze data
Create an analysis with several parts
Sideways triangles ( ) sit in front of many items in the analysis browser. These triangles indicate that more detailed choices are available. Clicking the triangle tips it downward ( ) and
reveals a list of possible results. Some even have subcategories of possible results. In all cases,
the triangles let you show or hide levels of detail, as seen in the picture below.
For example, Frequency Distribution analysis can produce summary tables, histograms, Zscore (standardized) histograms, and pie charts.
QC Subgroup Measurements is a more complex example. It has four categories of measurements (Xbar, R, S, and Statistics) and a Summary Table. Each category produces several types of results: line charts, needle charts, bar charts, point charts, and results tables.
Let’s work with Frequency Distribution to create a summary table and a histogram of Calories. These will help us determine whether the variable is normally distributed.
• Click somewhere in the white space of the view window to be sure no results are selected
(This way, we avoid adopting variables from any analyses that are selected.)
• Click the triangle next to Frequency Distribution to show the detailed list
• Click and drag to select both Summary Table and Histogram
• Click Create Analysis
• Click OK to accept the default analysis parameters
1 Tutorial Analyze data
• In the variable browser, select Calories and click Add
It looks like Calories is bimodal: the histogram has two humps. This is likely to be a problem
in further analyses. (Dotted red lines indicate page breaks; we won’t worry about them for
now.)
Quiz
If Calories are bimodal, perhaps it’s because some candy bars have more fat or carbohydrates than most. Are these variables bimodal as well? Clone the frequency distribution
analysis with the other variables that are likely to be bimodal: Total fat g, Saturated fat g, and
Carbohydrate g.
1 Tutorial Analyze data
A glance at the histograms doesn’t show bimodality in the fat and carbohydrate variables,
although both Saturated fat g and Carbohydrate g seem to have small jumps at the high end.
More information is needed.
What about when we include the smaller brands? Does increasing the sample size make any
relationships more apparent? Turn off the Big Three criteria. Bring the dataset window forward by clicking it or selecting Candy Bars from the Window menu. From the criteria pop-up
menu at the top of the window, select No Criteria.
Still no apparent bimodality except in Calories. Reselect the Big Three criterion to continue
the analysis.
Create a new grouping variable
One way to cope with this problem in further study is to divide the candy bars into two
groups: high calorie and low calorie. StatView’s Recode feature lets you do this quickly.
• From the Manage menu, select Recode
• From the scroll list on the left, select Calories
• Click Continuous values to nominal groups
Since we’re recoding a continuous variable (Calories) into a grouping variable, we need to
choose a category for the groups. The only category defined thus far in the dataset is for
Brand, which wouldn’t work. Therefore, we need to define a new category with values “low”
and “high.”
• Click New
• Specify a name for the category: Category for Calorie Groups
1 Tutorial Analyze data
•
•
•
•
•
Specify the first Group label: Low
Click Add
Specify the second Group label: High
Click Add
Click Done
Now we need to specify the cutpoint for the groups—which Calories values go in the Low
group, which in the High. The rectangular area represents the total range of Calories, from
125 to 450; we need to click some value below which values should be grouped “Low” and
above which they are “High.”
• Move the cross-hair cursor up and down until you find an appropriate cutpoint—some
value in the “gap” between high and low values, like 360
• Click at that cutpoint
StatView shows the group assignments in pop-up menus to the right. Because we defined category groups in order from small to big, StatView’s initial guesses were correct. (If we had not
defined them “in order,” we’d have to use the pop-up menus to fix the group assignments.)
• Click Recode
The dataset has a new variable showing Low and High group memberships.
• Click the dataset window to bring it forward, or select it from the Window menu
• Click the variable’s name to select it
1 Tutorial Analyze data
• Type a new name: Calorie groups
• Press Enter or Return
Grouped box plots
Now let’s try to learn the reason for Calories’ bimodality. In the quiz above, we determined
that fat and carbohydrates were not clearly bimodal. However, their values could still differ
between groups; or, other nutrients could be relevant. A grouped box plot is a quick way to
examine several possibilities all at once.
Previously we grouped a box plot of Calories by brand name. This time, let’s examine several
variables at once and split it by calorie grouping.
• Click somewhere in the white space of the view window to be sure no results are selected
• In the analysis browser, double-click Box Plot
(This is a shortcut for selecting Box Plot and then clicking Create Analysis.)
• In the variable browser, click and drag from Total fat g down to Protein g and click Add
• In the variable browser, click Calorie groups and click Split By
One thing we notice right away is that the large range of Sodium mg values makes the vertical
scale too large for the other variables, which are squashed together in the lower half of the
graph. Since sodium content probably doesn’t contribute significantly to calorie content
(sodium may be bad for people with high blood pressure, but it’s not fattening). Let’s remove
it from the analysis.
• Make sure the analysis is still selected (has black handles); if not, click it
• In the variable browser, select Sodium mg and click Remove
1 Tutorial Analyze data
Now the most likely culprits are easier to examine. And sure enough, the fat content (both
total and saturated), carbohydrates, sugars, and protein all seem to be greater for the high than
for the low calorie candy bars.
Create an unpaired t-test
A statistical test for this conclusion is an unpaired t-test. A t-test tests the null hypothesis that
the means of two groups are the same, and a significant p value (say, less than 0.05) means
they are not the same. Let’s just look at Total fat g for now.
• Click somewhere in the white space of the view window to be sure no results are selected
• In the analysis browser, double-click Unpaired Comparisons
• Click OK to accept the default parameters
(The default options produce an unpaired t-test with a null hypothesis difference of 0.)
The note below the empty analysis objects says we need to add both a nominal and a continuous variable.
1 Tutorial Analyze data
• In the variable browser, Control-click (Windows) or Command-click (Macintosh) Total
fat g and Calorie groups
• Click Add
We see that the mean difference is quite large, and the p value is well below 0.05. However,
the groups are vastly different sizes (45 and 6), so we shouldn’t take this result too seriously.
Still, it seems apparent that the fat content between groups is significantly different, and it
does make sense that candy bars with more fat would have more calories.
What about saturated fat?
If you took the quiz, you probably noticed that calories and total fat were, on average, pretty
similar among the big three brands. However, the median lines in the box plots for saturated
fat looked pretty different. In case you’re skipping the quizzes, here’s a plot you would have
examined:
From the looks of this plot, the M&M/Mars bars are lower in saturated fat per serving than
the Hershey and Nestle bars: compare the median lines in the middle of the boxes. However,
the Nestle median falls inside the M&M/Mars box height, and all three boxes are overlapping
with each other.
We can’t be sure just by looking at box plots. The nutrition guidelines tell us to keep tabs on
saturated fat, so let’s look into this some more.
1 Tutorial Analyze data
Create an ANOVA using a template
Let’s do an analysis of variance () to see whether the numbers back up our visual interpretation. Our null hypothesis is that there is no significant difference in saturated fat content
between brand families, and the box plot suggests we’ll be able to reject that hypothesis.
We could create an by using the analysis and variable browsers, as we’ve been doing. In
fact, you can try that right now, if you like—you can probably figure it out quite easily.
Instead, though, we’re going to look at one of StatView’s most powerful features: templates. A
template is simply a way of saving a view of analysis and graph results—in any combination—
so that it can be recycled in a future analysis, with a twist: you can apply the template to different datasets and different variables. So, where other data analysis packages only allow you to
save batches of commands for repeating analyses exactly, StatView lets you repeat an analysis
strategy with completely different variables—no editing, no typing, no mistakes. What’s
more, you can save all your annotations, layout, and color settings so that the template puts
together not just the analysis but your complete presentation.
StatView ships with dozens and dozens of pre-built templates that produce complete analyses—for example, the template we’ll use assembles an table, a means table and a
bar chart of the effects, and even a Fisher’s (Protected Least Significant Difference) posthoc test.
• From the Analyze menu, select the /t-tests submenu and select or
•
•
•
•
Drag Saturated fat g to the Dependent Variable slot
Drag Brand to the Factor(s) slot
Leave the Covariate slot empty
Click OK
1 Tutorial Analyze data
StatView does all the work, putting together all four parts of a complete analysis of variance.
The table is first. The p value is well under 0.05, so it looks like we can reject the null
hypothesis.
ANOVA Table for Saturated fat g
Inclusion criteria: Big Three from Candy Bars Data
DF Sum of Squares Mean Square F-Value
Brand
Residual
2
106.516
53.258
48
419.023
8.730
6.101
P-Value
Lambda
Power
.0044
12.202
.878
The next part of the output is a means table, showing that M&M/Mars has the smallest
mean. You may examine the bar chart of means and confidence intervals and the post-hoc test
for further details on the analysis. An “S” for “significant” marks the Fisher’s p value for
the Hershey, M&M/Mars combination: the p value is well under 0.05. (Since the count for
Nestle is considerably smaller than for the other two, we shouldn’t pay much attention to the
other results.)
Fisher's PLSD for Saturated fat g
Effect: Brand
Significance Level: 5 %
Inclusion criteria: Big Three from Candy Bars Data
Mean Diff. Crit. Diff P-Value
Hershey, M&M/Mars
3.103
1.850
.0015
Hershey, Nestle
2.270
2.664
.0931
M&M/Mars, Nestle
-.833
2.844
.5585
S
Means Table for Saturated fat g
Effect: Brand
Inclusion criteria: Big Three from Candy Bars Data
Count
Mean Std. Dev. Std. Err.
Hershey
29
8.103
3.434
.638
M&M/Mars
16
5.000
2.338
.585
6
5.833
1.169
.477
Nestle
(If you’ve forgotten what some of these statistics mean, you’ll be relieved to know that the
chapters in StatView Reference include discussions of the theories behind each type of analysis—and they give pointers on which tests to use, what you need to check first, how to interpret the numbers, and where to turn next.)
1 Tutorial Analyze data
We also get an interaction bar plot. This simply shows us the means and confidence intervals
graphically.
Interaction Bar Plot for Saturated fat g
Effect: Brand
Inclusion criteria: Big Three from Candy Bars Data
9
8
Cell Mean
7
6
5
4
3
2
1
0
Hershey
M&M/Mars
Cell
Nestle
Notice that these results are no different from results created with the analysis browser. You
can clone them, add variables, remove variables, reformat them—even resave them to be a
new template!
Quiz
Are saturated fat values normally distributed? We should check that assumption before taking our results seriously. If we were doing an important analysis, we’d want to do more tests
to be sure. For our purposes, it’s reasonable simply to examine the histogram for Saturated fat
g that we created earlier.
Can we predict calorie content from saturated fat content? Use the Regression - Simple
template, specifying Calories as the Dependent Variable and Saturated fat g as the Independent Variable.
From total fat content? Use the Regression - Simple template, specifying Calories as the
Dependent Variable and Total fat g as the Independent Variable.
From both total and saturated fat? Use the Regression - Multiple templates, specifying Calories as the Dependent Variable and both fat variables as Independent Variables. Notice that
the Independent Variables slot grows to accommodate more than one variable.
How are these variables correlated? Use templates or browsers to create a correlation matrix
and some bivariate scattergrams.
Since we never quite resolved the question of Calories’ bimodality, among other reasons, it’s
probably best to refrain from drawing any major conclusions. We’ll leave interpretation of
these results up to you.
Save your work
Normally at this point in a data analysis project, you would want to save your work (if you
haven’t already).
1 Tutorial Analyze data
Save a dataset
Since we’ve made some changes to the dataset (new variables and criteria), we should save:
• Make sure the dataset is the frontmost (active) window
If not, click it or select Candy Bars Data from the Window menu.
• Select Save As from the File menu
• Type a filename: Candy Bars Data 2
• Click Save
StatView saves everything about the dataset: the values, the variable names, the attributes and
summary statistics, the criteria (and whether one is in effect), and more. This way, you can
resume working exactly where you left off.
Save a view
We also want to save our view full of graphs and tables.
• Make sure the view is the frontmost (active) window
If not, click it or select Untitled View #1 from the Window menu.
• Select Save from the File menu
• Type a filename: Nutrition analysis
• Click Save
StatView also saves everything about a view: the analyses and graphs, variable assignments, the
dataset(s) in use, etc. We can later reopen the view and continue our analysis, resuming right
where we left off. All objects are still dynamic: you can still add and remove variables, change
analysis parameters, and so forth.
For best results, always save datasets first, then views. Otherwise, when you reopen the view,
StatView might have trouble locating its dataset(s).
Save a template
Now, suppose you have some candy bar data of your own—perhaps you’ve collected data on
your own favorites. Perhaps you live in Japan and would prefer to study Japanese candy bars.
Perhaps you prefer salty snacks, and want to do a similar analysis of potato chips, corn chips,
pretzels, and crackers.
If you were to save your view in the Template (Windows) or StatView Templates (Macintosh)
folder, you could use it as a template to redo this entire analysis on another dataset.
• Make sure the view is still the frontmost (active) window
If not, click it or select Nutrition analysis from the Window menu.
• Select Save As from the File menu
• Navigate to the template folder inside the main StatView folder
• Create a new folder named My Projects
(Windows 3.1 or Windows NT: before saving, use File Manager to create a new folder.)
1 Tutorial Analyze data
• Save in the new folder
Next, we rebuild the Analyze menu so that it offers your new folder and its template.
• From the Analyze menu, select Rebuild Template List
And here’s the new, customized Analyze menu:
Remember two things:
1. Saving a template is the same as saving a view, except that you put it inside the templates
folder.
2. Using a template is the same as reopening a view, except that you can specify different
datasets and/or different variables with a template.
1 Tutorial Present results
Present results
So far we’ve just explored our data and done some analysis. It would probably be pretty hard
to get anybody to pay much attention if we printed these analyses and tacked them up to a
wall. Let’s pull it all together into an eye-catching presentation!
Close the analysis browser
We’re done analyzing these data, so let’s make more room in the view window by closing its
analysis browser pane.
• Double-click the split-pane control ( )in the lower left corner of the view window
You can reopen the browser by double-clicking the control (now
) again.
Clean up results
First, let’s straighten up these results, space them evenly, and move them off page breaks.
• From the Layout menu, select Clean Up Items
• Click Clean Up
Add some color
Now let’s highlight those analysis objects that concern saturated fat. We can automatically
select all those objects by working with the results browser. This browser is just like the analysis and variable browsers we’ve already seen, and it lets you work with analysis results.
• From the View menu (Windows) or Window menu (Macintosh), select Results browser
• In the results browser, select By Variable for the Order pop-up menu
1 Tutorial Present results
(Your list of results may be somewhat different, since “Quiz” sections are optional.)
• Resize the browser to make it wide enough for its entries
• Scroll down to the heading “Saturated fat g (Candy Bars Data 2)”
• Click this heading to select all its entries
(You may instead Control-click (Windows) or Command-click (Macintosh) individual
entries underneath it, if you only want to highlight certain results.)
• Click the Select button
In the view window, all the analyses that involve the saturated fat variable are selected, so you
can change them all at once. Next, we use StatView’s drawing tools to make them red.
• Select Draw Palette from the View menu (Windows) or tear off the Draw palette from the
Draw menu (Macintosh)
• At the bottom of the tool palette, click and hold the pen color tool (top rectangle)
• Drag and release to select red from the pop-up color palette
1 Tutorial Present results
(Apologies for the gray “colors”!)
• Now the saturated fat results are red and eye-catching. (We won’t bother to show the
results here—a gray color palette looks silly enough!)
Art assignment
Call attention to the candy bar lowest in saturated fat per serving
• Use the results browser to find the box plot of saturated fat split by Brand
(If you skipped the quizzes, make a box plot of Saturated fat g split by Brand now.)
• Choose the line tool from the Draw palette
• Change the arrow to have an arrow head on the left end
1 Tutorial Present results
• Draw an arrow pointing to the lowest point
(Click at the lowest point and drag to below the plot.)
• Use the text tool to add a caption: This is the candy bar to eat!
(Select the A tool, click where the arrow ended, and type a caption.)
• Use the regular arrow cursor and Shift-click to select both the arrow and the caption
• Use the pen color tool to make the arrow and caption blue
(Click the upper rectangle and drag to select blue from the palette.)
(Again, apologies for the gray depiction!)
You could continue to refine this plot, and the others, to your heart’s content. We’ll stop here.
1 Tutorial Present results
Print a presentation
After you’ve put the finishing touches on your presentation, you’ll want to print it. If you have
a color printer, you can print in full color.
• Make sure the view is the frontmost (active) window
If not, click it or select Nutritional analysis from the Window menu.
• From the File menu, select Print
• Adjust the printing options and click OK (Windows) or Print (Macintosh)
Save a presentation
You’ll want to save the view again, so that all your finishing touches are preserved.
• From the File menu, select Save
If your data change, StatView updates your analyses automatically. You don’t have to repeat a
single step. Suppose you discover the morning of your big presentation that someone entered
a few data values wrong. (That never happens!) No need to panic. You just fix the values, and
StatView does the rest—and your layout is preserved!
Save a template
You can also save this whole presentation—colors, annotations, and all—as a template. Then,
you could apply all these analyses and artistic efforts to a completely different dataset in one
simple step.
• From the File menu, select Save As
• Change to your My Projects folder inside the template folder
• Type a filename: Nutrition presentation
• Click Save
1 Tutorial Notes
Notes
Where to go from here
Now you have a feel for data analysis the StatView way. The easy way.
There is much more to learn. Many more tools are available for helping you manage your
data. Lots of drawing and layout tools give you complete control over every detail of your presentation. Scan through the remaining chapters of Using StatView to learn what’s available.
StatView offers a broad range of statistical analyses and graphs—not just the sample we’ve
used. A comprehensive StatView Reference devotes an entire chapter to each type of analysis
you see in the browser.
Finally, as you get comfortable with StatView, you’ll find countless shortcuts, tricks, and powerful variations for how to get your work done. These manuals, the Hints window, Balloon
Help and Apple Guide (Macintosh only), and Windows Help (Windows only) are available to
help you.
But, no matter where you concentrate your efforts, all the basic techniques you’ve just learned
will serve you well. All of StatView’s analyses work the same basic way, whether you use
browsers or templates, whether you’re using basic tables and graphs or specialized survival and
quality control analyses.
Afterword
No candy bars were injured or mistreated in the making of this tutorial. All scenes involving
candy bars were carefully supervised by humane, chocolate-loving professionals.
Datasets
2
The first step of any analysis is to get data into a dataset. StatView’s dataset is a column-byrow spreadsheet-style window. This chapter discusses how to arrange datasets and how to
enter and edit data in StatView.
This chapter also discusses in detail how to work with variable attributes—how to tell StatView what kind of data each column contains. The time you take in organizing your dataset
pays big rewards when you analyze your data. StatView can guide you in building analyses
with the appropriate kinds of data, and it can prevent you from using variables incorrectly.
Subsequent chapters discuss how to exchange data with other applications, how to manipulate
data with formulas, and how to restrict analyses to data subsets by excluding cases manually or
with logical expressions.
Dataset structure
Understanding the structure of your data is a very important first step in creating your dataset.
To enter data properly, you must determine two things:
1. Data class: whether data are continuous or nominal. Continuous data are measurements
that can assume any value within a given range; nominal data identify group memberships.
Some analyses expect continuous data, some expect nominal data, and some expect both.
(A third data class, informative, identifies cases in a dataset but is not used in analyses.)
2. Data arrangement: how to organize data into rows and columns properly for analysis in
StatView.
We’ll discuss each of these in detail after looking at an example.
Example
Suppose you’re studying heart disease. Your data might include each patient’s name, gender,
age, weight, cholesterol levels, and alcohol use.
Class continuous or nominal? Names are informative—they merely identify each case. You
can’t do any statistical or graphical analyses on an informative variable.
Gender is nominal, since each patient belongs either to a male group or a female group.
2 Datasets Dataset structure
Age is continuous, since each patient has an exact measurement that falls somewhere along
the continuum between birth and death. Similarly, weight and cholesterol are continuous
variables of exact measurements.
Alcohol use could be either continuous or nominal. You could record each patient’s average
daily number of drinks exactly in a continuous variable; or, you could group their daily averages into a nominal variable with several intervals—say, fewer than two, between two and six,
and more than six. For a heart disease study, a nominal variable might make the most sense.
Arrangement? You would most likely arrange this dataset to have a row for each patient in
the study and a column for each quantity measured, like this:
This one-case-per-row arrangement is the most typical, and it is the arrangement usually
expected by StatView. (Some analyses also accept other arrangements.)
Data class
The class of a variable is crucial to how it is used in an analysis. StatView interprets a variable
differently depending on whether it is continuous or nominal.
Continuous data are measurements that can assume any numerical value over a given interval,
such as weights of cars or batting averages of baseball players. Nominal data identify group
memberships, such as the countries in which cars are built, or whether baseball players compete in the National League or American League. Informative data give case identifications,
such as model names, player names, or jersey numbers.
Why do I need groups?
Many statistical and graphical analyses try to answer in various ways one basic question: do
measurements differ among groups of individuals? For example, do husbands and wives vote for
the same or different political candidates? How do American and National baseball league
batting averages compare? Do men and women perform equally well on math tests? Do
patients treated with a new drug have more or fewer heart attacks than patients not treated?
Such analyses include unpaired t-tests, s, unpaired nonparametric tests, contingency
tables, cell plots, grouped box plots, and percentile comparison plots.
Therefore, these analyses require that data identify the group to which each observation
belongs. If you set a variable to class nominal, StatView understands that its values represent
various groups in the dataset. If you set a variable to class continuous, StatView understands
that its values represents measurements that could fall anywhere along an interval. Because
StatView understands these things in a properly-constructed dataset, it can make sure that you
use variables appropriately in analyses.
2 Datasets Dataset structure
In other words, your setting the correct class for each variable enables StatView to help you
analyze your data. For each analysis, StatView coaches you to assign variables of the appropriate class and prevents inappropriate assignments.
Also, StatView can break down any analysis by groups. Suppose you are studying heart disease, but you want to study men and women separately. If you have a nominal gender variable, you can split all your analyses—you’ll get separate results for men and for women.
Data types
One of StatView’s most powerful features is that it allows you to set variables of any type to be
nominal. For example, gender can be text with values such as Male and Female, or it could be
numeric with values such as 0 and 1. Similarly, informative data can be any type (numeric or
text). However, continuous data can only be numeric (real, currency, integer, long integer, or
date/time).
To look at this (the relationship of type and class) the other way around, any numeric data can
be continuous, nominal, or informative. However, text data (type string) can be either nominal or informative, and category data (type category) can only be nominal.
For more detail on data types, see “Type,” p. 73.
Change classes
Another powerful feature is that you can easily change variables from continuous to nominal
and vice versa. Sometimes the class of a variable is flexible or ambiguous.
Many variables could be either continuous or nominal, depending on how they are analyzed.
For example, alcohol usage might be recorded as a nominal variable for a heart study, but if
you’re studying liver and stomach enzymes, it might be more appropriate to record exact (continuous) measurements of alcohol consumption. As another example, three levels of a drug
(10, 25 and 50 i.u.) could be seen as three drug administration groups (nominal) or as three
values along a range of possible values (continuous).
Class can be ambiguous. Many variables, although they are continuous in the strictest sense,
are effectively nominal. For example, body weights are strictly continuous, because their values can fall anywhere within an interval if you measure them precisely enough. However,
most people tend to report their weights rounded to the nearest five or ten pounds (or kilograms). You should assign the class that makes the most sense in the context of your research.
Occasionally researchers will study variables both ways—for example, they’ll use nominal
weights in tables but continuous weights in descriptive statistics tables.
Data arrangement
Typically, data are arranged so that each single row represents a single distinct case or individual, and each column contains a variable of measurements on each case. Most datasets are
arranged this way, and all StatView analyses can use data arranged this way.
For example, we could record eye color and gender data for eight people like this:
2 Datasets Dataset structure
Each nominal variable is a separate column in the dataset. Each row represents one person,
and the values in that row identify that person’s eye color and gender— that is, the eye color
and gender groups to which that person belongs.
This is the most typical data arrangement. Continuous variables can record other measurements for each individual—for example, this dataset could also have columns for weights,
heights, and ages. Throughout all columns, though, one row in the dataset must represent one
observation—one individual subject—one case.
Within this one-case-per-row arrangement, you can use a special compact variable structure,
in which continuous values are recorded in separate columns representing groups of a nominal variable, and these columns are linked together (compacted) into a single structure within
the spreadsheet. Repeated measures requires that the levels of the within factor (the
repeated measures) be stored in a compact variable. Elsewhere in StatView, compact variables
are optional. For a complete discussion, see “Compact variables,” p. 84.
This arrangement, with or without compact variables, is accepted by all analyses in StatView.
Other arrangements
A small number of analyses in StatView can also handle other data arrangements in addition
to the usual one-case-per-row arrangement:
1. Contingency Tables also accept summary data and two-way table data.
2. Certain QC analyses accept summary data.
3. Factor Analysis can analyze correlation matrix data.
Summary data
Summary data show how many individuals fall in each combination of group memberships.
The hair color and gender example would contain two nominal grouping variables in columns and an additional column with the count in each combination of groups (cell):
The dataset contains six rows, one for each possible combination of eye color and gender: blue
eyes/female, blue eyes/male, brown eyes/female, and so on. Each combination is made up of
entries in the nominal Eye Color and Gender columns. The count for each combination
2 Datasets Dataset structure
appears in the count column. Note that you cannot record information about individuals—
you can only count how many individuals fall in a group.
You are not required to have as many rows as there are combinations. If duplicate combinations appear in your data, StatView sums the counts for that combination. Also, if a fractional
value appears in a count column, the value is rounded to the nearest integer.
Only Contingency Tables analysis and certain QC analyses can analyze summary data.
Two way table
In a two-way table, each column is a column of the contingency table and each row a row of
the table. The observed frequencies are entered in individual cells. There will be as many columns as groups in one nominal variable and as many rows as groups in the second nominal
variable. Our example would look like this:
The two columns represent the two gender groups: male and female. The three rows the three
eye color groups: blue, brown and green. The values in each cell are the counts for the particular combination. Note that you cannot record information about individuals—you can only
count how many individuals fall in a group.
Only Contingency Tables can analyze two-way table data.
Correlation matrix
A correlation matrix is a tabular arrangement of data with a correlation coefficient in each cell
of the table.You can use Factor Analysis or Correlation/Covariance analyses to create a correlation matrix dataset. You can also enter a correlation matrix by hand.
Only Factor Analysis can analyze correlation matrix data.
Columns vs. variables
For most purposes, and in the most typical one-case-per-row data arrangement, the terms column and variable are interchangeable. However, we do make a distinction. Strictly speaking, a
column is the vertical arrangement of cells in a dataset. A column usually contains a variable.
A variable is the data contained within a column. Therefore, when we refer to a column in
this chapter and throughout the manual, we are referring to the structure itself—not the data
in it. When we refer to a variable, we mean the variable itself—not the cells it fills.
Columns and variables are not the same thing in the context of compact variables (see “Compact variables,” p. 84).
2 Datasets Dataset windows
Dataset windows
In this section, we discuss the windows you will use when working with StatView datasets: the
dataset window and the variable browser.
The variable browser is useful with both dataset and view windows; we discuss how to use the
variable browser with view windows in the chapter, “Analyses,” p. 131.
StatView stores data in a special dataset window. Each dataset has its own window, and you
can have thousands of datasets open at a time if enough memory is available. You can even
analyze variables from several datasets at once.
The first step in creating a dataset is to open a new data window.
• From the File menu, select New
Input column
Input row
Input cell
Attribute pane
Input column
Input row
Input cell
Attribute pane
Each dataset window is a fully independent window. You can move it, scroll it, resize it, and
close it like any other window in any other program.
The dimmed cell in the upper left corner of a new dataset represents both an input row and
an input column. As soon as you enter a value into this cell, a new input row appears below it
and a new input column appears to the right. You create columns (variables) by entering values into the input column and add rows by entering values in the input row. Each row represents a case and each column contains a variable.
A new input column appears when you start to fill the current input column or change its
name. You can use Add Multiple Columns from the Manage menu to add several columns at
a time; see “Add multiple columns,” p. 62.
Here’s what the window looks like with a dataset entered and the attribute pane closed:
2 Datasets Dataset windows
Dataset title (name)
Compact and Expand buttons
Criteria pop-up menu
Click here to
deselect any
selection
Show/hide variable browser
(Mac only)
Show/hide
attribute pane
Row numbers
Variable names
Message area
(Mac only)
Split-pane control
Horizontal and vertical scroll bars
When your dataset has many columns, you might find it helpful to split the window horizontally into two panes, so you can visually compare columns that are far apart in the dataset. To
split the dataset, click and drag or double-click the split-pane control (the black rectangle just
to the right of the message area in the lower left corner). Double-clicking this control splits
the dataset into two panes, and double-clicking again returns it to a single pane. When the
dataset is split, you can use the scroll bars at the bottom to scroll either half of the dataset.
Dataset preferences
Preferences from the Manage menu allows you to set dataset preferences. You can choose
defaults for decimal formatting, fonts, and which direction the cursor should move after you
enter a cell—down to the next row of the same variable, or right to the next column of the
same case. See “Dataset preferences,” p. 227.
2 Datasets Dataset windows
Variable browser
Variables in the dataset are listed in the variable browser, a floating window that appears
alongside both dataset and view windows. When you are working in a dataset window, the
variable browser allows you to:
1. Choose open datasets and open new datasets
2. Select variables
3. Create and expand compacted variables
To show or hide the variable browser, select Variable Browser from the View menu (Windows)
or Variables from the Window menu (Macintosh). You can also show or hide the variable
browser with the
button in the toolbar (Windows) or the
button in the upper right
corner of the dataset and view windows (Macintosh). An Application Preference lets you
choose whether the variable browser is shown or hidden by default; see “Application preferences,” p. 225.
You can move the variable browser, resize it, or close it by using its window controls.
Buttons at the top of the browser change according to whether a view or dataset window is
active. When a dataset window is active, its buttons let you Show, Compact, and Expand variables. When a view window (a window where you create analyses) is open, its buttons let you
assign variables to play various roles in analyses.
Dataset
View
Dataset
View
In the middle part of the browser, a Data pop-up menu lets you open datasets and select
among any datasets that are already open. The name of the currently active dataset is shown.
Click on the menu to choose another open dataset, and choose Other to locate and open a
previously saved dataset.
An Order pop-up menu lets you choose how to sort variable names in the scrolling list:
Dataset order
Alphabetical
The order in which variables appear in the dataset’s columns (left to right).
Alphabetical order by variable name, with nonalphabetic names first.
2 Datasets Enter data
Variable type
Usage
Grouped in order by continuous, nominal, and informative.
Ordered first by variable use in analyses and then in alphabetical order. When a dataset window
is active, ordering is only alphabetical.
Variables are shown in a scrolling list. Icons next to variable names indicate their data class:
for continuous,
for nominal, and
for informative.
Compact variables (see “Compact variables,” p. 84) are preceded by a triangle and followed
by a
symbol. Click the triangle to tip it downward
and display the category of the variable. These categories are marked nominal .
Show variables
The Show button selects a variable in the dataset and scrolls the dataset so the variable is visible. If you select more than one variable, Show scrolls the dataset to make the leftmost variable visible.
• Select one or more variable names
To select one variable, click its name. To select several adjacent variables, click and drag or
Shift-click their names. To select several nonadjacent variables, Control-click (Windows)
or Command-click (Macintosh) their names.
• Click Show
A shortcut for Show: simply double-click a variable name. (The topmost button of any
browser is always the default button; double-clicking an item has the effect of selecting the
item and pushing the top button.)
Compact and expand variables
The Compact and Expand buttons let you create and expand compact variables directly from
the variable browser, rather than by selecting the columns and using the Compact and Expand
buttons in the dataset window itself.
• Select the variables to compact or expand
• Click Compact or Expand
For a discussion of compact variables, see “Compact variables,” p. 84.
Enter data
The chapter “Tutorial,” p. 1, presents a step-by-step exercise for entering a sample dataset. If
you’d like to get a feel for the overall process of entering data and working with a dataset, the
tutorial is a good place to start. This chapter discusses in more detail all the rules, variations,
and shortcuts for entering and editing data, and it goes into more detail about what everything means.
2 Datasets Enter data
Name variables
The default variable name is “Column n” where n is the number of the current column. It is
better to give variables meaningful names, so it is easy to remember which variable is which
when you are building analyses.
You can enter or edit variable names at any time.
• Click the cell containing the current name to select it
• Type a new name
(Do this while the old name is selected and you have an I-beam cursor . To change only
part of the name, select the part you want to change and correct it.)
• Press Enter or Return to store the new name
(Or press Tab to select the next variable name.)
Analyses and graphs are labeled by the names of the variables in use, so you should use names
that will be meaningful. You should capitalize and spell names in the dataset the way you’d
like them to appear in results.
Variable names can be up to 80 characters long and can use any characters except colons (:)
and quotation marks (“ ”). Each variable name must be unique within its dataset; you can
have several datasets open at a time in StatView, and it is not a problem for variable names to
be repeated among datasets.
Variable names should not begin with numerals, and they should not be the same as any function name (for example, “Log” is a function that computes the logarithm of a variable; “Log”
should not be used as a variable name) or any group label defined in a category. You may
break both rules if you need to, but StatView warns you with an error message.
For a complete list of function names, see “Formulas,” p. 315 of StatView Reference. For more
information about category group labels, see “Categories,” p. 80.
Set attributes
Each column in the dataset has specific attributes that describe the variable you enter in the
column. These attributes are data type, source, class, format, and number of decimal places.
Each of these is discussed in detail in the section “Save datasets,” p. 70.
You set variable attributes in a part of the data window called the attribute pane. The first five
lines of this area are pop-up menus for each variable attribute. The input column of a new
dataset begins with default attributes:
• Position the cursor over the cell of the attribute you want to change
The cursor changes to a pop-up menu icon:
.
2 Datasets Enter data
• Click and hold the mouse button
• From the pop-up menu, select the correct attribute
• Release the mouse button
To change the attributes of several columns at once:
• Select all the columns you want to change
Shift-click or click and drag to select adjacent columns. Control-click (Windows) or Command-click (Macintosh) to select nonadjacent columns.
• Make changes to any one of the selected columns
You should specify column attributes for each column before entering data. Doing so ensures
that each column is set up appropriately for the data it is to contain. If you enter values that
are not compatible with the attributes specified, StatView warns you that the values are
incompatible.
Change attributes
You can change the attributes of a variable anytime except:
1. You cannot change the class of a variable that is in use in an analysis or formula definition.
2. You cannot change the type of a variable that is in use in an analysis or formula definition
to category or string.
3. You cannot change any attributes for a compact variable except format and decimal places.
4. If the source of the variable is analysis generated, you cannot change the type or class.
Additional guidelines for changing each attribute are given under “Save datasets,” p. 70.
View summary statistics
The variable attribute pane also contains a set of summary statistics for each variable. Usually,
these statistics are hidden, but you can reveal them either by scrolling the attribute pane
downward or by increasing the size of the attribute pane.
• Click and drag the attribute pane control
downward
2 Datasets Enter data
For continuous variables, you see summary statistics: mean, minimum, maximum, standard
deviation, standard error, variance, coefficient of variation, count, range, sum, sum of squares
and number of missing cells. For nominal variables, only count and missing cells are calculated, and the other cells contain missing values. No statistics are shown for informative variables. When you open the attribute pane you always have complete, current summary
information; the statistics update automatically whenever you make any change to your
dataset. You can copy cells from the attribute pane and paste them into other windows or
applications as needed. You cannot edit summary statistics or paste into their cells.
Control window panes
To hide the summary statistics, double-click the
control. To close the attribute pane completely, double-click it again. When the pane is closed, the pane control looks different ( ).
Double-click the control to reopen the attribute pane.
Opening, closing, and resizing the attribute pane does not affect the lower data pane of the
window. Row 1 (or the input row in a new dataset) always starts right under the attribute
pane. You can scroll the attribute and data panes independently.
Summary statistics are calculated only when the attribute pane is open. If you need to make
many changes to your dataset, close the attribute pane to avoid delays from frequent recalculations.
2 Datasets Enter data
Enter values
When you have set the attributes for a variable with the controls in the attribute pane, you are
ready to enter the data for that variable in the dataset. The tutorial gives step-by-step instructions for entering a sample dataset; here we give general rules.
• Click a cell to select it
• Type a value
• Press Enter, Return, or Tab
When you enter a value, a new input column appears to its right and a new input row appears
below it, so you can enter another value. Also, the cursor moves to the next cell—either down
to the next row, or right to the next column. Continue entering values in input cells until you
complete one row or column.
Windows
Macintosh
Enter on numeric
Enter
keypad
Enter on main part of Return
keyboard
Tab
Tab
Direction cursor moves
Either down or to the right, depending on your Dataset Preferences.
Down. From an input cell at the bottom of a column, the cursor moves
to the top of the next row.
Right. From an input cell at the end of a row, the cursor moves down
to the beginning of the next row.
Enter across
If you prefer to enter values across (filling in all the variables for one observation or case), you
should name and set attributes for all your variables in advance. To begin a new row, either
click the first cell for the row, or press Tab from the empty input cell at the end of the first row.
Enter down
If you prefer to enter values down (filling in all the cases for a variable), you might prefer naming and setting attributes for each variable individually. To begin a new column, either click
the first input cell in the column, or press Return from the empty input cell at the bottom of
the previous column.
Missing values
Sometimes you don’t have a value for a given case of a variable. Perhaps a respondent didn’t
answer a question, or a doctor forgot to take a blood pressure reading for one patient, or perhaps a variable is simply not applicable to an observation for one reason or another. These
2 Datasets Enter data
cases are missing values. A missing value is exactly that: it’s a data point that has no value.
Cases with missing values on a particular variable are excluded from most analyses of the variable.
Do not enter 0 (zero) or any other number for missing values!
You can enter a missing value by simply leaving the cell blank. Missing values are displayed as
periods ( . ). If you want, you can enter missing values in numeric variables by typing a
period. For string data, simply leave an empty cell.
If you need to recode missing values to some specific value (perhaps for exporting to another
application), use Recode from the Manage menu (see the chapter “Formulas,” p. 315 of StatView Reference).
Manipulate columns and rows
You create one column at a time by entering a value in the input cell, pressing Tab, and repeating the process. You create a new row by entering a value in the input row, pressing Return,
and repeating the process. Additional commands let you create several columns at one time as
well as insert columns and rows between existing rows and columns.
Add multiple columns
You can add several columns at once using the Add Multiple Columns command in the Manage menu. This is especially convenient for adding several variables with the same attributes.
To add several columns:
• Choose Add Multiple Columns from the Manage menu.
• In the dialog box, enter the number of columns you want to create
• Use the pop-up menus to set the attributes for these variables and click OK
For more details on variable attributes, see “Variable attributes,” p. 73.
The columns are appended to the right of existing columns. The default name for the nth
variable to be created in a dataset is “Column n.” You can use the Undo command in the Edit
menu to delete the new columns if you make an error. You must select Undo immediately
after adding columns, before taking any other action.
Insert columns
You can insert a column between two existing columns in the same dataset:
• Control-click (Windows) or Command-click (Macintosh) the border between two variable
names
Position the cursor between two variable names, over the vertical line separating the columns: the cursor changes to a cross-arrow
shape. Hold the Control (Windows) or
Command (Macintosh) key down: the cursor changes to a double-arrow
shape. Click
and release the mouse button. Release the key.
2 Datasets Enter data
The newly inserted column has default variable attributes and is filled with missing values ( . )
until you enter data.
Repeat to insert additional columns.
Remove columns
You can remove a column at any time:
• Click the variable name to select the column
• Press the Delete or Backspace key or select Delete from the Edit menu
Insert rows
Inserting a row is similar to inserting a column:
• Control-click (Windows) or Command-click (Macintosh) the border between two row
numbers
Position the cursor between two row numbers, over the horizontal line separating the rows.
Hold the Control (Windows) or Command (Macintosh) key down: the cursor changes to
a double-arrow shape. Click and release the mouse button. Release the key.
• In the dialog box, specify how many rows to add by typing a number
• Click Insert
Rows are added between the two rows where you clicked. Cells of the input rows contain
missing values until you enter data. Repeat to insert additional columns.
Resize column widths
To increase or decrease the size of columns:
• Click and drag the border between variable names
Position the cursor to the right of a variable name, on the vertical line separating columns:
the cursor changes to a cross-arrow
shape. Click and drag to the left or right to make
the column narrower or wider.
To resize several columns at once, select the columns and resize one of them. Shift-click or
click and drag to select several adjacent columns. Control-click (Windows) or Commandclick (Macintosh) to select several nonadjacent columns.
2 Datasets Edit data
If a column is too narrow to display its data, pound signs (###) appear in place of numbers,
and ellipses (...) appear in place of text data. Attributes and variable names in the attribute
pane are similarly abbreviated.
Move and scroll
You can move the cursor from one cell to another by clicking or by using keyboard shortcuts.
Windows
Tab
Shift-Tab
Enter
Shift-Enter
Enter on numeric
keypad
Shift-Enter on numeric
keypad
Page Up
Page Down
Home
End
Mac
Movement
Return
Shift-Return
Enter
Right (with wrap-around)
Left (with wrap-around)
Down, except in input row (with wrap-around)
Up (with wrap-around)
Right or down, as set in Dataset Preferences
Shift-Enter
Left or up, as set in Dataset Preferences
Scroll up one page
Scroll down one page
Upper left corner of dataset
Lower right corner of dataset
Edit data
You can edit an individual value directly by clicking its cell and typing a new value.
You can also use the standard Cut, Copy, Paste, Clear, and Delete commands from the Edit
menu on selected cells in a dataset. If you need to see what you have selected, choose Show
Selection from the Edit menu to scroll the dataset to the highlighted section.
Datasets and views are dynamically linked, so if you make any changes to your data, StatView
automatically recalculates graph and analysis results in the view.
Select data
The following tables tell you how to select cells, rows, and columns for editing.
Windows
Macintosh
Click the cell.
Click one cell and drag vertically or horizontally to highlight all of them. Or, Shift-click the
cells.
Type of
selection
a single cell
several adjacent cells
2 Datasets Edit data
Control-click the cells
Command-click the cells.
Click the corner cell and drag diagonally to the opposite corner.
Click a cell in one corner of the block. Scroll to the diagonally opposite corner of the block.
Shift-click that corner cell.
Select one block with either of the above
Select one block with either of the above
techniques. Control-click and drag to select
techniques. Command-click and drag to select
another block.
another block.
From the Edit menu, choose Select All Rows or Select All Columns.
Click the row number. Be careful to single-click, not double-click; double-click is used for
Include and Exclude; see “Include and exclude rows,” p. 108.
Click the variable name.
Click a row number or variable name and drag over adjoining row numbers or variable names.
To select a large block of data, click the first row or column, scroll to the row or column at
the end of the group, and Shift-click.
Control-click the row numbers or variable
Command-click the row numbers or variable
names.
names.
Control-click criteria name in Criteria pop-up menu
several nonadjacent
cells
a small block of cells
a large block of cells
nonadjacent blocks of
cells
all rows or all columns
an entire row
an entire column
adjacent rows or
columns
nonadjacent rows or
columns
rows that meet a
criterion
To deselect any rows, cells or columns selected in the dataset quickly, click once in the empty
rectangle above the row numbers and to the left of the first column heading.
Cut, clear, and delete data
You can remove entire columns or rows using Edit menu commands or your keyboard.
Windows
Macintosh
Result
Cut (Control-X)
Cut (Command-X)
Removes selected data to the Clipboard.
If data do not constitute an entire row or column, the row or column
remains in the dataset. Cells where data have been cut contain missing
value symbols.
If an entire row or column is selected (including row number or
variable name), Cut completely removes the row or column from the
dataset. Rows below a cut row move up, and columns to the right of a
cut column move left.
2 Datasets Edit data
Clear
Clear (Command-B)
Delete (Backspace key) Delete (Delete key)
Removes selected data and replaces them with missing values. Data are
permanently cleared unless you immediately select Undo from the Edit
menu or type Control-Z (Windows) or Command-Z (Macintosh). Clear
does not remove rows or columns.
If an entire row or column is selected, Delete removes it from the
dataset. Deleted rows or columns are permanently removed unless you
choose Undo immediately after deleting.
With nonadjacent rows or columns, the dataset shrinks by the number
of deleted rows or columns.
Copy data
You can Copy selected data to the Clipboard by selecting Copy from the Edit menu. You can
Paste data from the Clipboard back into a selected area of any active StatView dataset. When
you cut or copy numeric data to the Clipboard, they are converted to text when you switch to
a different application. When data are converted from numeric to text format, only the number of decimal places currently displayed are saved. If you paste data outside of StatView, be
sure to display enough decimal places before copying to preserve your data values.
A yin-yang cursor
spins while data are converted to text. When you return to StatView,
the information is in the Clipboard (assuming you have not placed anything there from
another application).
You can merge data from different datasets using Copy and Paste commands. Then you can
copy data from the source dataset and paste them into the empty cells of the target dataset. It
is important to understand StatView’s rules for pasting data, described next.
Paste data
\Pasting data into a dataset is much easier if you first familiarize yourself with the data you
want to paste. You should also know the row-by-column size. You should consider the following things:
1. the size of the data relative to the size of the selected target area
2. the type of data to be pasted and the data type in the target area
3. the target location for the pasted data (such as the input row or the input column)
Size of the target area The selected area can have four basic sizes relative to the data in the
Clipboard:
1. It can be the exact size of the data in the Clipboard. In this case, StatView pastes an exact
copy of the data.
2. It can be smaller than the data in the Clipboard. In this case, StatView pastes as many values as it can, starting in the upper left cell and leaving out the additional data.
For example, if the Clipboard contains an array of numbers 3 columns wide and 3 rows deep,
and the selected area is only 2 by 2, only the first four data points of the source data (2 by 2)
2 Datasets Edit data
are pasted. Paste does not shift cells to the right of the selected area further to the right, nor
move the cells underneath the selected area down.
3. It can be larger than the data in the Clipboard, and an exact multiple. In this case, StatView duplicates the data as many times as necessary to fill the selected area.
4. It can be larger than the data in the Clipboard, but not an exact multiple. In this case, StatView copies the data only once and fills the remaining cells in the selected area with missing
value symbols. This is a handy way to fill many cells with one value or several repeating values.
Data type to be pasted When you paste data into a dataset, the pasted data are converted to
the selected area’s data type, if the types are compatible. (Recall that you can set data types in
the attribute pane.) When you paste data of one type into a selected area of a different type,
the conversion in data type can cause a loss of data. See the data loss precautions in the section
“Save datasets,” p. 70.
Location of pasted data You can paste data into four areas of a dataset—the input row, the
input column, the intersection of the input row and input column, or the body of the dataset.
When you paste data into the input row, the dataset grows to accommodate the new rows.
However, if your source data have more columns than you have highlighted in the input row,
the extra data are not pasted. To paste data into the input row of a dataset, highlight the entire
row or as many cells across the input row as your source data occupy and choose Paste from
the Edit menu.
When you paste data into the input column, the dataset grows to accommodate the new column(s). The type of the new column(s) is determined by the same procedures used in importing data. To paste data into the input column of a dataset, select the entire column or as many
cells as your source data occupy and use Paste from the Edit menu. If you are pasting into a
new dataset, simply highlight the input cell. The dataset adds the appropriate number of rows
and columns to accommodate the data.
When you paste data into the intersection of the input row and the input column, the dataset
grows to accommodate the new rows and columns. This is the one place where the dataset can
grow to accommodate any number of pasted cells. To paste data into the intersection, highlight the single cell where the input row and input column meet and use Paste from the Edit
menu.
You can paste columns of data, rows of data, or a block of data into existing dataset cells. In
this case, data are only pasted into the highlighted area of the dataset. (See the earlier section,
Size of the selected area.)
If you paste nonadjacent data into a dataset, be sure to paste rows into rows, columns into columns, and blocks into blocks the same size. StatView joins nonadjacent data in the Clipboard
and cannot preserve the column/row structure of copied data unless they are pasted into areas
the same shape as their origin. This capability is mainly useful for extracting subsets to a different dataset, or for replacing rows or columns in one dataset with nonadjacent (discontiguous) rows or columns from another. Pasting blocks of data into rows, columns, or blocks of
different shapes should be done with caution.
2 Datasets Edit data
Paste transposed data
Data in the Clipboard can be transposed while you paste. Use the Paste Transposed command
to change entire rows into columns and entire columns into rows. For example, the following
integers in a 3×3 section of a dataset transpose like this:
To transpose data, choose Paste Transposed from the Edit menu. The block of cells in the target dataset should be as wide as the data to be transposed are tall. For example, if you have a
3×8 set of data to be transposed, you need a block of cells 8×3 for the transposed data. To
transpose the following data, you need to either select the cell at the intersection of the input
row and column or an 8×3 pattern of target cells:
If the target dataset does not have enough rows or columns to hold the new data, either create
enough rows or columns to hold the data or highlight the correct number of cells in the input
row or input column. If you paste into the input row or input column, the dataset automatically enlarges to hold the transposed data.
Copy and Paste unusual selections
As we’ve described above, StatView lets you Copy and Paste data selections of any shape or
size, and from one shape to a different one. Why would you want to Copy and Paste data
from one cell to many, or from one nonadjacent selection to another of a different shape?
Suppose you are entering data for a typical factorial experiment:
In real life, the factor levels would be more tedious to type than simple one-digit numbers,
and you would have more cells to enter. Therefore, it could be handy to type the values one
time each and then use clever Copy and Paste steps to finish the data entry. Here’s one way we
could enter these data:
• From the File menu, select New
• Create three columns by typing the variable names A, B, and C
• Select all three columns by clicking and dragging across the variable names
2 Datasets Edit data
• In one of the column’s variable attribute pane, select Integer for the Type (this changes the
type for all three columns in one step)
• Enter the value 1 for the first row of A
• Control-click (Windows) or Command-click (Macintosh) the border under the row number label for the first row, then specify 7 more rows to insert
(This technique is detailed under “Insert rows,” p. 63.)
•
•
•
•
Double-click the split-pane control to close the attribute pane
In row 5 for A, enter the value 2
Select the cell with the 1, and from the Edit menu select Copy
Control-click (Windows) or Command-click (Macintosh) to select all the other cells that
should have a 1
• From the Edit menu, select Paste
• Now select the cell with the 2, and from the Edit menu select Copy
• Control-click (Windows) or Command-click (Macintosh) to select all the other cells that
should have a 2
• From the Edit menu, select Paste
2 Datasets Save datasets
You’re done! If you keep StatView’s selection flexibility in mind, you’ll find many similar
opportunities to save time when entering and editing your datasets.
Save datasets
You can save changes to any active dataset by selecting Save from the File menu. If you want
to save the changed dataset under a different name and preserve the original dataset
unchanged, choose Save As from the File menu. If the file is untitled when you choose Save, a
dialog box prompts you to name it.
Choose the file format you want from the choices listed at the bottom of the dialog box.
(Windows only) The normal format that StatView uses is DataSet. You can also choose Excel
or Text for exporting data to other applications.
(Macintosh only) The normal format that StatView uses is StatView Data. You can also
choose Excel or text (for exporting data to other applications), StatView 1.x Data (for exporting to versions of StatView earlier than version 4.1) or SuperANOVA Data (for exporting to
SuperANOVA). It is best to save files as StatView Data unless you plan to transfer data to
another application or to earlier versions of StatView. When you save as StatView Data, you
retain all information about the dataset including formula definitions, criteria, the current
selection, which rows are currently included, and so on. SuperANOVA format is useful for
transferring data to StatView versions 4.0, 4.01, and 4.02, because it retains formula and criteria definitions.
See update documentation for other formats that might be available in your version of StatView. For more information about the Excel file format, see “Importing and exporting,”
p. 99.
Exchange datasets between Windows and Mac versions of StatView
The DataSet Transfer format is a cross-platform dataset format that can be read by both Windows and Macintosh versions of StatView. The DataSet Transfer format preserves all data, formula definitions and values, and criteria definitions. It does not preserve the current selection,
the current inclusion and exclusion of rows, or custom column widths. DataSet Transfer files
have the filename extension . (Windows). Note that DataSet Transfer files save data values
in double precision, which may cause slightly different results for and no Macintosh
versions of StatView, which operate in extended precision. Datasets that are opened or saved
in DataSet Transfer format remain in that format, and you might want to use DataSet Trans-
2 Datasets Save datasets
fer as your usual format if you routinely exchange data between Mac and Windows versions of
StatView.
Moving a dataset from Mac to Windows
In StatView for Macintosh:
• Open the dataset
• From the File menu, select Save As
• From the File Format list, select DataSet Transfer
• Type a filename ending with the extension .
(Including the . extension identifies the file to Windows as a StatView dataset in the
DataSet Transfer format.)
• Click Save
Use PC Exchange or another utility to copy the file onto a floppy disk formatted for Windows
(), or copy it to a Windows volume by using a network connection. Then, in StatView for
Windows:
• From the File menu, select Open
• Locate the file
(If you didn’t include the . extension, you must choose All Files (*.*) from the Files of
Type list.)
• Click Open
Moving a dataset from Windows to Mac
In StatView for Windows:
• Open the dataset
• From the File menu, select Save As
• From the Files of Type list, select DataSet Transfer
• Type a filename ending in the . extension
(Including the . extension identifies the file to PC Exchange as a StatView dataset in the
DataSet Transfer format.)
• Click Save
Copy the file onto a floppy disk and use PC Exchange or another utility to read the disk with
your Macintosh, or copy it to a Macintosh volume by using a network connection. Then, in
StatView for Macintosh:
• From the File menu, select Open
• Locate the file
• Click Open
If you would like to be able to open DataSet Transfer (.) files automatically on Macintosh
by double-clicking them, open the PC Exchange control panel and add an assignment matching . files to StatView:
2 Datasets Close datasets
•
•
•
•
•
•
•
Open the PC Exchange control panel
Click Add
Type the extension: .
Select the application: StatView
Select the document type:
Click OK
Close the control panel
Close datasets
Close a dataset by clicking the close box in the upper left corner of the dataset or by selecting
Close from the File menu. StatView prompts you to save any changes made since last saving
the dataset.
If you attempt to close a dataset whose variables are used in an open view, you will be alerted
to this fact. If you continue and close the dataset without closing the view first, all of the variables from the dataset will be removed from the view. We advise you to close views that use
the variables of a dataset before closing the dataset. In addition, if you close an Untitled dataset
(one not yet saved or a text file that has not been saved as a StatView document) and do not
save it, StatView will not able to match the dataset with any view(s) that use the variables of
that dataset.
Open datasets
To open an existing dataset, select Open from the File menu.
You can choose which types of files are shown in the dialog box from the pop-up menu at the
bottom of the dialog box. Supported Files (Windows) or All Available (Macintosh) displays
files of any format that StatView can read or import. Other choices are any types of files that
can be imported on the current platform. The various dataset types are discussed under “Save
datasets,” p. 70.
See the chapter “Importing and exporting,” p. 99, for more information on importing.
Print datasets
To print a dataset, make it the active (frontmost) window and select Print from the File menu.
If the attribute pane is open, attribute settings and summary statistics print along with the
data. The entire dataset is printed, even if it does not all fit in the window. Row numbers and
variable names always appear on printouts.
2 Datasets Variable attributes
Variable attributes
Here we discuss in detail the five variable attributes and how to change them. Please pay particular attention to the consequences of changing variable attributes.
Type
Data type specifies whether a variable contains real numbers, integers, long integers, strings,
date/time values, currency values, or categories. The default type for a new column is real.
Type
Examples
Description
Real
9.8765
1.2E34
3.141592…
1
–756
7,142
–98,765
3
348,920
John Doe
436-39-9976
Patient #28A
7/ 8/08
July 8, 1908
10:20:13
$142,213.00
£ 113.88
¥872.543
Female
2
Group 1
Numbers with fractional parts. Set the number of decimal places to
display in the dataset with the Decimal Places pop-up menu. (Full
precision is stored and used in all calculations.)
Whole numbers between 32,767 and -32,767, inclusive.
Integer
Long Integer
String
Date/time
Currency
Category
Whole numbers between 2,147,483,647 and -2,147,483,647, inclusive.
Alphanumeric (text) data. Entries in string columns can be as long as
255 characters.
Points in time. Many display formats are available. Regardless of the
format used, date/time values are an exact time: a specific hour,
minute, and second of a specific day, month, and year.
Real data displayed in one of many international currency formats. Set
the number of decimal places to display in the dataset with the
Decimal Places pop-up menu.
Alphanumeric (text) data recording group memberships for individual
observations or cases. You must choose an existing category definition
or create a new one.
Values for each type must fall within the following ranges. All numerical computations are
performed in the fullest precision of the platform you are using, so the ranges of acceptable
values for real numbers vary among platforms. Macintoshes based on 680x0 processors with a
numeric coprocessor () perform calculations in 96 bit extended precision. Macintoshes
based on 680x0 processors without numeric coprocessors (no) perform calculations in 80
bit extended precision. Power Macintoshes () and Windows machines (Win) perform calculations in 64 bit double precision.
2 Datasets Variable attributes
Type
CPU
Minimum
Smallest
fraction
Maximum
Real
FPU
noFPU
PPC
Win
–1.1E4932
±1.9E–4951
1.1E4932
–1.7E308
±5.0E–324
1.7E308
Long integer
–2,147,483,647
2,147,483,647
Integer
–32,767
32,767
Date/time
Friday, January 1, 1904 0:00:01
Monday, February 6, 2040 6:28:15
Categories
Sometimes your data identify particular groups rather than signifying quantities. Data like
this are nominal. You can set any data type to nominal, but category data can be used only in a
nominal variable. When you set a variable’s type as category, you are prompted to provide
information about the groups that make up the variable. For example, to enter the gender of
patients in a study, you define a category in which Gender has exactly two group labels: Male
and Female. The only data that can be entered into this column are Male and Female.
Using a category to enter your nominal data offers you specific advantages over other data
types. The advantages are explained under “Class,” p. 78. See “Categories,” p. 80, for more
information.
Date/time values
It is important to understand the following rules about date and time values:
1. Any dates outside the valid time range are invalid. (However, you can type 0 in a date/time
data cell to get the current date at midnight.) If you attempt to enter or create by formula
any date value outside this range, you get either an error message or a missing value.
2. If you specify only a date without a time, StatView assumes you mean exactly midnight of
that day. If you specify a time without a date, StatView assumes the current day, month,
and year. If you specify only a partial date or time, StatView assumes you mean the very
beginning of that time; for instance midnight of the first day, if you specify a month; midnight of the first day of the first month, if you specify only a year; etc.
3. StatView works with the current date and time set for your system. Be sure you have set the
correct time, date, time zone, etc.
4. If you enter an ambiguous date/time value, such as 8/11 (which could mean either August
11 or 8 November), StatView warns you. A dataset preference lets you suppress this warning; see “Silently accept ambiguous values,” p. 227.
If you are unsure how StatView interprets a value, choose a date/time format that shows more
detail.
2 Datasets Variable attributes
Change types
Exercise caution when changing variable types if you have already entered data in the column.
Some changes in data type cause data loss. For example, changing real variables to integers
rounds values to the nearest integer, e.g. 1.456 becomes 1. If you then change type back to
real, you get integers with zero fractional values, e.g. 1.000.
If you ever change a data type by mistake, immediately select Undo from the Edit menu to
avoid permanent data loss.
Following are the possible consequences of changing data types:
New type
Result of changing from other types
Real
Integers are unharmed.
Long integers are unharmed.
Strings that are real numbers are unharmed (except that numbers exceeding 19 significant
digits lose precision). Other strings are converted to missing.
Date/time values are interpreted as an exact integer number of seconds since the earliest
possible date (varies according to platform).
Currency values are unharmed.
Categories are converted to their underlying codes (indices) 1, 2, 3, …
Reals are rounded up or down to the nearest integer, e.g. 1.234 becomes 1. Values outside
range –32,767 ≤ x ≤ 32,767 are converted to missing.
Long integers outside the range –32,767 ≤ x ≤ 32,767 are converted to missing.
Strings that are valid integers are unharmed. Other strings are converted to missing.
Date/time values are interpreted as an exact number of seconds since the earliest possible date
(varies according to platform). Values greater than 32,767 are converted to missing.
Currency values are rounded up or down to the nearest integer, e.g. ¥1.234 becomes ¥1. Values
outside the range –32,767 ≤ x ≤ 32,767 are converted to missing.
Categories are converted to their underlying codes (indices) 1, 2, 3, …
Reals are rounded up or down to the nearest integer, e.g. 1.234 becomes 1. Values outside the
range –2,147,483,647 ≤ x ≤ –2,147,483,647 are converted to missing.
Integers are unharmed.
Strings that are valid long integers are unharmed. Other strings are converted to missing.
Date/time values are interpreted as an exact number of seconds since the earliest possible date
(varies according to platform). Values greater than 2,147,483,647 are converted to missing.
Currency values are rounded up or down to the nearest integer, e.g. ¥1.234 becomes ¥1. Values
outside the range –2,147,483,647 ≤ x ≤ –2,147,483,647 are converted to missing.
Categories are converted to their underlying codes (indices) 1, 2, 3, …
Reals are converted to their current text representation as set by Format and Decimal Places;
this can result in loss of precision.
Integers are unharmed.
Long integers are unharmed.
Date/time values are converted to their current text representation as set by Format.
Currency values are converted to their current text representation as set by Format; this can
result in loss of precision.
Categories are converted to their group names as given by the current category definition.
Integer
Long Integer
String
2 Datasets Variable attributes
Date/time
Currency
Category
Reals are rounded to an exact integer number of seconds after the earliest possible date (varies
by platform). Values outside the range 0 ≤ x ≤ 4,294,967,295 are converted to missing.
Integers are interpreted as an exact number of seconds after the earliest possible date (varies
by platform). Negative values are converted to missing.
Long integers are interpreted as an exact number of seconds after the earliest possible date
(varies by platform). Negative values are converted to missing.
String values that match valid date/time formats (see the Formats menu) are interpreted
accordingly. Other string values are converted to missing.
Currency values are rounded to an exact integer number of seconds after the earliest possible
date (varies by platform). Values outside the range 0 ≤ x ≤ 4,294,967,295 are converted to
missing.
Category values that match valid date/time formats (see the Formats menu) are interpreted
accordingly. Other string values are converted to missing.
Reals are reformatted (with no loss of data) according to the currency format chosen.
Integers are reformatted (with no loss of data) according to the currency format chosen.
Long integers are reformatted (with no loss of data) according to the currency format chosen.
String values that match valid currency formats (see the Formats menu) are interpreted
accordingly. Other string values are converted to missing.
Date/time values are interpreted as an exact number of seconds since the earliest possible date
(varies according to platform) and are reformatted according to the currency format chosen.
Categories are converted to their underlying codes (indices) with the currency units chosen for
Format, e.g., $1, $2, $3, …
Reals are changed to initial group names that are “Group for” and the character representation
of the real numbers according to the Format and Decimal places settings, e.g. “Group for
1.234.” Underlying values (indices) are assigned according to increasing numeric value.
Categories can have at most 255 levels.
Integers are changed to initial group names that are “Group for” and the integer values, e.g.
“Group for 57.” Underlying values (indices) are assigned according to increasing numeric value.
Long integers are changed to initial group names that are “Group for” and the long integer
values, e.g. “Group for –57,689.” Underlying values (indices) are assigned according to
increasing numeric value. Categories can have at most 255 levels.
Strings are converted to initial group names that are the unique values appearing in the
variable. Underlying values (indices) are assigned in alphabetic order. Categories can have at
most 255 levels. Categories can have at most 255 levels.
Date/time values are changed to initial group names that are “Group for” and the date/time
values, e.g. “Group for 5/10/63.” Underlying values (indices) are assigned according to
increasing numeric value. Categories can have at most 255 levels.
Currency values are changed to initial group names that are “Group for” and the current
representation of the currency values according to the Format and Decimal places settings, e.g.
“Group for 1.234.” Underlying values (indices) are assigned according to increasing numeric
value. Categories can have at most 255 levels.
2 Datasets Variable attributes
Source
Data source identifies the origin of data in the variable. It can be user-entered, created by a
formula, or generated by an analysis.
User Entered
Dynamic Formula
Static Formula
Analysis Generated
Data you enter by hand or import; this is the default.
Data created with Formula or Recode commands. A dynamic formula variable updates if the
variables it uses change, or if there are other changes (e.g. sorting, row insertion) in the
dataset.
Data created by choosing the Static Formula pop-up or Series or Random Numbers commands.
Such formulas do not recalculate automatically, although they can be updated manually.
Changing a dynamic formula to static stops dynamic recalculation of the formula, but you can
change it back to dynamic at any time.
Data generated by an analysis: residuals, fitted and predicted values from a regression, factor
scores from a factor analysis. Factor Analysis, Correlation/Covariance, Survival: Nonparametric,
and Survival: Regression can create a new dataset containing a correlation matrix. See the
appropriate analysis chapter for a discussion of analysis generated variables.
Change sources
Be careful when changing the source of variables that already have data values. Some changes
in source can cause loss of information. For example, changing Formula variables to User
Entered retains the current data values but discards permanently the formula definition.
New source
Result of changing from other sources
User Entered
Values from Dynamic Formulas are saved but the formula definition is lost.
Values from Static Formulas are saved but the formula definition is lost.
Changing from Analysis Generated to User Entered breaks the variable’s link with the analysis
that created it and allows you to save the variable with the dataset (An immediate Undo can
restore the link).
Changing User Entered to Dynamic Formula replaces all data with values generated by the
formula.
Changing a static formula to dynamic forces values to recalculate when changes to the dataset
occur, but you can change it back to static at any time.
Changing from Analysis Generated to Dynamic Formula breaks the variable’s link with the
analysis that created it and new values are computed by the formula. (An immediate Undo can
restore the link.)
Changing User Entered to Static Formula replaces all data with values generated by the formula.
Changing a Dynamic Formula to Static stops dynamic recalculation of the formula, but you can
change it back to dynamic at any time.
Changing from Analysis Generated to Static Formula breaks the variable’s link with the analysis
that created it and new values are computed by the formula. (An immediate Undo can restore
the link.)
You cannot change any other source to Analysis Generated. Only StatView analyses can create
Analysis Generated variables.
Dynamic Formula
Static Formula
Analysis Generated
2 Datasets Variable attributes
Class
Data class describes the information contained in a variable. You can assign variables a nominal, continuous or informative data class. (The differences between nominal and continuous
variables are crucial and are discussed under “Data class,” p. 50.) Class defaults to continuous
unless type is category or string, in which case class defaults to nominal.
Continuous
Nominal
Informative
Continuous data are measurements that have magnitude and rank and can assume any
numerical value over a given interval, such as weights of cars or batting averages of baseball
players. The default class, unless type is category or string.
Real, integer, long integer, currency, and date/time type variables can be continuous.
Nominal data identify group memberships, such as the countries in which cars are built, or
whether baseball players compete in the National League or American League. The default when
type is category or string.
Any type variable can be nominal.
Informative data give case identifications, such as model names, player names, or jersey
numbers.
Any type variable can be informative.
Informative variables are useful only when viewing the dataset. They cannot be used in analyses
or formulas; change class to nominal or continuous if you need to use the data in formulas or
analyses.
Change classes
You can change data class for a variable at any time unless the variable is currently used in an
analysis or formula. Only data class choices compatible with the current data type selection
can be made. Other choices are dimmed (inactive) in the Class pop-up menu.
Changing data class from continuous to nominal can be meaningful for some variables; this
flexibility is discussed in more detail under “Data class,” p. 50. Analyses use variables differently according to their class. When you change a variable from continuous to nominal,
groups are sorted in increasing numerical or alphabetical order.
Although you can use any data type as a nominal variable, category data offer some special
advantages. If you plan to use the variable as both nominal and continuous, choose a non-category type and change the data class. See “Categories,” p. 80 for more information.
2 Datasets Variable attributes
Format
Data format specifies how to display real, currency, and date/time data. The format you
choose affects only the display of the data, not its contents. Values are stored and computations are performed to the fullest precision of your platform, always.
Real
Currency
Date/time
Free Format Fixed
Displays real numbers using Fixed Places format unless the column is
not wide enough to display the entire number. If that occurs, the
number is displayed in scientific notation.
Free Format
Ignores trailing zeroes to the right of the decimal point without regard
to the number of decimal places specified.
Fixed Places
Displays the data using the number of decimal places specified. Data
are not displayed in scientific notation.
Scientific
Displays data in scientific notation using the specified number of
decimal places.
Engineering
Displays the numbers in scientific notation using exponents that are
multiples of e3 and e-3.
Enhanced Free Fixed Displays real numbers like Free Format Fixed, except that it switches to
scientific notation whenever doing so results in a more accurate
representation of the number, e.g. 0.0078 is .008 for three decimal
places in free fixed, but enhanced free fixed shows 7.8E-3.
StatView supports most major international currency formats. Examine the pop-up menu to see
the choices available to you. Your choices vary according to platform, operating system, and
international configuration.
StatView supports most major international date/time formats. Examine the pop-up menu to see
the choices available to you. Your choices vary according to platform, operating system, and
international configuration.
Regardless of format chosen, date/time values are always stored and interpreted as a complete
date—an exact number of seconds since the earliest possible date (which varies by platform).
Change formats
Feel free to choose the format most convenient for the moment. Values are always stored and
used in computations to the fullest precision of the platform you are using. Your format
choice affects only the display of values. Therefore, changing formats is usually harmless.
However, when you exchange data with other applications through the clipboard or text files,
be sure to choose formats that display values in sufficient precision.
We recommend that you choose date/time formats that are complete enough to reveal exactly
how values you enter or compute are interpreted. All date/time values are stored as an exact
time on an exact date, regardless of the format used. Many of the date/time formats hide this
exactness from you. For example, the format “Jan 04” shows the exact time Monday, 6 February 2040 06:28:15 as “Feb 40.”
If you enter an ambiguous date/time value, such as 8/11 (which could mean either August 11
or 8 November), StatView warns you. a dataset preference lets you suppress this warning; see
“Silently accept ambiguous values,” p. 227.
2 Datasets Categories
If you are unsure how StatView interprets a value, choose a date/time format that shows more
detail.
Decimal places
The Decimal Places attribute specifies how many digits after the decimal point to display for
real numbers. Values are always stored in the fullest precision of the platform you are using.
Your choice affects only the display of values.
Changing the number of decimal places to display is always harmless.
Categories
A category is a special variable type that makes nominal data entry faster and more accurate.
The category type allows you to define a named set of labels for the groups of one or more
variables. (Other common terms for groups are cells and levels.) Once you associate a variable
with a category, each value you enter in the column must be one of that category’s defined
group labels. This prevents data entry mistakes. Also, you can use shortcuts to enter group
labels quickly.
For example, you might create a category definition called Color that has the group labels
Red, Yellow, Green, and Gray (in that order) to use for any variables that record color groups.
You cannot enter any other values—such as Redd, Blue, or 4.3—in those variables. You can
enter Red by typing R, r, or 1. You can enter Yellow by typing Y, y, or 2. You can enter Green
by typing GRE, gre, or 3. You can enter Gray by typing GRA, gra, or 4. (Since Green and
Gray both begin with GR, it is necessary to type a third letter.)
You are not required to use the category type for nominal data. Remember, variables of any
type (real, integer, long integer, string, date/time, currency, or category) can have class nominal. However, categories offer several advantages:
1. You can enter data faster. Type the first letter or two of a group name, and StatView finishes the name for you. Or, type the number of the group—1 for the first group label in
the definition, 2 for the second group, etc.—and StatView fills in the label.
2. You can prevent data entry errors. StatView won’t let you enter a value that isn’t defined in
the category.
3. You can save memory and disk space.
You might not want to use the category type for all your nominal class variables. Categories
have three disadvantages:
1. You might not have an exhaustive list of all the group levels you’ll need in advance; in this
case, a string variable might be more convenient.
2. Category definitions are limited to 255 groups. If your variable has more groups than that,
you’ll need to use another type.
3. Variables with type category can only have class nominal or informative. If you might also
want to use the variable as a continuous variable, you should use another type.
2 Datasets Categories
You must use categories in two cases:
1. When you recode a continuous variable to nominal (using cutpoints to group ranges of
values together), you must define a category or choose an existing category. See “Continuous data to nominal groups,” p. 118.
2. When you create compact variables, you must use a category to define its groups. See
“Compact variables,” p. 84.
Finally, whenever possible you should re-use the same category definition with variables that
share the same group names; this reduces storage space and eliminates naming conflicts.
(Using the same labels in two separate category definitions can lead to problems with formulas, criteria, and other data manipulations.)
Create category definitions
Whenever a category is needed (for a category variable, compact variable, or when recoding
continuous data to nominal groups) you see a dialog box:
The scrolling list contains all defined categories. These are categories used in the active dataset
and any other open datasets. You can choose an existing category from this scrolling list or
create a new category. To choose an already existing category, select it and click OK.
For an example of how you might define and use a category, see tutorial chapter, p. 5. Here we
give general directions.
• Choose an open dataset from the Window menu, or select New from the File menu
• If the attribute pane is hidden, double-click the
control above the vertical scroll bar
• Select Category from the Type pop-up menu in the attribute pane for the column
The Choose Category dialog box appears. If categories are listed, you can choose one and
click OK to apply it to the column. If no categories are listed, it means you have not defined
any for this or another open dataset. You must click New to create a new category. The Edit
Category dialog box appears:
2 Datasets Categories
• Type the first group level for the category
• Click Add
• Repeat these steps until you have named all the group levels you need
Group labels can be as long as 255 characters. They appear in the cells of your dataset (and as
sub-headings below compact variable names), and they are used to label analysis and graph
results for their groups. Type the name exactly as you want to see it in the dataset and in analysis results.
• Enter Dogs in the Group label box and click Add or press Return. Dogs appears in the
scrolling list.
• Type a name for the category
Category names can be as long as 255 characters. The name you give appears only in the
Choose Category dialog box; it is never visible in your dataset or view windows.
When you are through, the Edit Category dialog box shows your list of group labels.
To replace or rename a label, select the group label in the scrolling list, type a new name in the
Group label box, and click Replace. To delete a group label, select the group label in the scrolling list and click Delete.
• Click Done to save the category definition
2 Datasets Categories
Enter category data
You have two ways to enter data in a column with type category:
1. Type the first letter of a group label. If the first letter is unique, StatView completes the
label for you. If several labels begin with the same letter, type as many letters as necessary
for a unique match. If no group labels begin with the letter(s) you type, StatView alerts you
to your error.
2. Type the number of the group label—1 for the first label, 2 for the second, and so on—
according to the order in which you defined the labels. StatView fills in the label for you.
For example, suppose you defined group levels Low, Medium and High. You could enter a
Low value by typing L, l, or 1. You could enter Medium by typing M, m, or 2. You could
enter High by typing H, h, or 3. If you typed another letter or number, StatView would alert
you to your error.
Define category levels in the order in which you want results to appear, if such an ordering
exists for your variable; for example, Low, Medium, and High; or Monday, Tuesday, Wednesday, …
Edit category definitions
You can edit categories with the Edit Categories command from the Manage menu.
• From the Manage menu, select Edit Categories
• In the Choose Category dialog box, select the category you want to change
• Click Edit
The Edit Category dialog box appears. This dialog box is exactly like the dialog box used to
create a new category.
• Select the label you want to change
• Type a new value in the Group label box
• Click Replace
To delete a group label, select the group label in the scrolling list and click Delete.
2 Datasets Compact variables
You should only delete group labels that have no data associated with them. If you delete a
group label from a category that is in use, the group does not disappear. Instead, it is replaced
with the next group label and all groups adopt the label of the following group—all the labels
“slide up” one group. The last group label is replaced by a generic “Unlabeled Group #.” For
example, a category called Color contains four group labels: Green, Blue, Red and Black. If all
the group labels are used in a variable, and you delete the group label Red using the Edit Categories dialog box, every occurrence of Red is replaced with Black and every occurrence of
Black is replaced with “Unlabeled group 4.”
See also “How can I reorder category variables?,” p. 238. For more information on how StatView uses group ordering in graphs and analyses, see “How does StatView use ordering in
nominal variables?,” p. 238.
Delete unused categories
You can create a category and later delete the variable that used the category. Doing so does
not delete the category definition itself; it is still available for use with other variables.
To delete an unused category definition:
• Open the dataset that contains the category
• From the Manage menu, select Edit Categories
• Select the category you wish to delete
• Click Delete
• Click Done
You can delete only categories that are not used by any dataset. If you try to delete a category
that is being used, an error message appears.
Compact variables
Recall our discussion of “Data arrangement,” p. 51, in which we introduced the most typical
way to arrange data: one row in the dataset represents one case. For example, we could record
cholesterol readings and gender data for eight people like this:
The principal advantage of this data arrangement is that one row always represents one case.
Every cell in any column across one row describes one individual. We could record weights,
ages, and names and know that each value in a row corresponded to that person.
2 Datasets Compact variables
However, sometimes it is easier to visualize groups when their members fill separate columns,
like this:
You can easily see which readings are male, which are female. Now you identify a cholesterol
reading’s group by its column, not its row.
The advantages of this other arrangement are even more apparent when you have several
nominal variables creating subgroups. Here is the usual way to arrange such data:
Quick! How many male nonsmokers do we have? How many female smokers? It’s not easy to
tell. This arrangement helps:
Now it’s easy. We have two male nonsmokers and one female smoker. This arrangement is also
more compact. What took 8 rows and 3 columns now takes only 3 rows and 4 columns.
StatView lets you record data this way if you prefer. Not surprisingly, StatView’s special structure is called a compact variable, because it expresses the same information in fewer cells.
There are several advantages to using compact variables:
1. Compact variables help you see which values of a continuous variable fall into which nominal group or subgroup.
2. Sometimes raw data are arranged this way, and it is easier to enter data into StatView using
the same arrangement.
3. Compact variables are visually smaller: they take up fewer cells.
4. For repeated measures , StatView requires that your within factor be coded this way.
Please note, though, that there are disadvantages:
1. Compact variables violate the usual assumption of data arrangement: that values on a single row correspond to a single case (observation, subject, patient, individual). The correspondence between values of different continuous variables is lost.
For example, we cannot necessarily enter Ages and Weights for male and female smokers and
nonsmokers and then match up one male smoker’s cholesterol reading with his weight and his
2 Datasets Compact variables
age, unless we were careful to enter the subjects’ numbers in the same order for each compact
variable.
However, this is not always a disadvantage. Sometimes you need to break the one-case-per-row
connection between two variables. Suppose that you want to perform a Kolmogorov-Smirnov
test to compare a variable against a variable that is known to be normally distributed; i.e., you
want to test whether your variable is normally distributed. You don’t want to compare the
variables case for case. Putting the actual and ideal values in two columns of a compact variable lets you get around that problem. (In fact, the Normality Test in the Dataset Templates
folder uses exactly this trick; see “Normality Test,” p. 233.)
Note that when compact variables store within factors for repeated measures , the compact variable must conform to the one-case-per-row rule: each value must belong to the individual case represented in that row of the dataset. All other analyses interpret the data in
compact variables as though they were stored in the usual “long and skinny” continuous and
nominal variable columns.
2. You cannot use the nominal portion of a compact variable in an analysis unless you also
use its continuous portion.
3. The nominal portion of a compact variable must have type category. Usually nominal variables can have any type.
4. You cannot change the type, source, or class of a column that is part of a compact variable;
you must expand the variable, change the attributes, and then recompact the columns.
5. You cannot compact columns of differing types, sources, or classes. You must set matching
attributes before compacting.
If you have not already done so, please read the section “Categories,” p. 80. The following discussions assume you understand categories.
Build compact variables
You already know how to enter data in the usual row-and-column arrangement: you create a
nominal variable in one column, and you enter group names down the column for each case.
Then you create a continuous variable in a second column and enter measurements down the
column for each case. If you have several nominal variables, you simply create more columns
and fill them with grouping variables.
However, if you want to enter data in a compact variable, you need to follow special steps so
that StatView understands that the columns are actually different groups of a single variable.
In this section, we present two exercises, in which you learn step-by-step how to enter the
compact variables we examined above. First, we’ll enter the simple example: the one with just
one grouping variable (Gender). Then we’ll enter the complex example: the one where values
are broken down both by Gender and by Smoking
2 Datasets Compact variables
Simple compact variable
Entering a simple compact variable (a compact variable with only one nominal variable) is a
two-step process.
1. First, you create a column for each group (in this case, male and female).
2. Second, you compact the two columns into a single variable.
We’ll start this exercise with a new, empty dataset. (This isn’t necessary. You can also add compact variables to an existing dataset. If you do, though, please remember that the cells in your
compact variable cannot necessarily be read the way other cells are—they might or might not
belong to the cases that fill each row. Only repeated measures interprets the values as
belonging to their rows; for other analyses, case memberships are assigned as though the separate columns were stacked on top of each other in a single column.)
• From the File menu, select New
Now we name two variables, one for each group.
• Click the cell that reads “Input Column”
• Type a new variable name: Male
• Press Tab to move to the next variable name
• Type a new variable name: Female
All our cholesterol readings are whole numbers, so we give both columns type integer:
• Shift-click both variable names to select both columns
• From the Type pop-up menu for one column, select Integer
Now we can enter the values.
• Click the first input cell
• Type the first male value: 127
• Press Enter
Continue entering all the values. Your dataset should look like this:
2 Datasets Compact variables
Since we have fewer female values than male, the female column has missing values at the bottom.
Now we can compact the two columns into one variable:
• Shift-click both variable names to select both columns
• Click the Compact button in the top left corner of the window
(Or, you can select the two names in the variable browser, and then click the Compact button
in the variable browser.)
• In the Compact Variables dialog box, type a variable name: Cholesterol readings
• Click Compact
• Double-click the attribute pane control
to close the attribute pane
That’s all there is to it. Now take a look at the variable browser. Notice that it shows a single
variable, Cholesterol, with a little triangle in front of it. The triangle indicates that Cholesterol is a compact variable.
• Click the triangle to tip it downward
and reveal the nominal variable within
• Widen the browser so you can read the full variable names
2 Datasets Compact variables
Notice that Cholesterol readings and Category for Cholesterol readings both look like regular
variables. Cholesterol readings has a
class marker for continuous, and Category for Cholesterol readings has an
class marker for nominal.They look like regular variables in the
browser because they work like regular variables in the browser. We’ll learn in “Expand compact variables,” p. 94, that the “parts” of a compact variable each act the way regular variables
do. You select them and apply them to analyses the same way as regular variables.
First, let’s save the dataset:
• From the File menu, select Save
• Specify a filename: Simple Compact Variable
• Click Save
Complex compact variable
Entering a complex compact variable (a compact variable with more than one nominal variable) follows basically the same two step process:
1. First, you create a column for each subgroup; in this case, male smokers, male nonsmokers,
female smokers, and female nonsmokers.
2. Second, you compact the columns into a single variable. However, you must also assign
category definitions for each grouping distinction: a gender category with labels male and
female, and a smoking category with labels smoker and nonsmoker.
Again we’ll start with a new, empty dataset.
• From the File menu, select New
Name four variables, one for each group.
• Click the cell that reads “Input Column”
• Type a new variable name: Male Smokers
• Press Tab to move to the next variable name
• Type a name: Male Nonsmokers
• Press Tab
• Type a name: Female Smokers
• Press Tab
• Type a name: Female Nonsmokers
All our cholesterol readings are whole numbers, so we give all columns type integer:
• Shift-click (or click and drag) all variable names to select all columns
2 Datasets Compact variables
• From the Type pop-up menu for one column, select Integer
Now we can enter the values.
• Click the first input cell
• Type the first male value: 127
• Press Enter
Continue entering all the values. Your dataset should look like this:
Since we have fewer female values than male, the female column has missing values at the bottom.
Now we can compact the two columns into one variable:
• Shift-click or click and drag all the variable names
• Click the Compact button in the top left corner of the window
(Or, select all the names in the variable browser, and then click the Compact button in the
variable browser.)
• Type a variable name: Cholesterol readings
• Click More choices
Now we see the More choices version of the Compact Variables dialog box:
2 Datasets Compact variables
You must assign categories to structure your complex compact variable. (For simple compact
variables, StatView takes care of this for you.) For a complete discussion of category variables,
see “Categories,” p. 80.
The Categories scroll list on the left shows the names of categories that have been defined in
any open datasets. The Chosen scroll list on the right shows the categories that are currently
selected to identify this compact variable (none, yet). “Variables selected” below the “Chosen”
shows the number of variables being compacted. “Cells in compact” below the Categories list
shows how many group labels are defined for any category you select. This is important.
Recall that each column represents one group. Therefore, we need to choose a category with as
many group labels. Or, we need to choose several categories whose group labels combine to
make as many subgroups. (The product of the numbers of cells must equal the number of
variables selected.) Our example has four columns, and they represent four subgroups produced by combining gender and smoking. (2 groups × 2 groups = 4 subgroups.)
The buttons in the middle create categories and move them from one list to another as follows:
Control
Select
Remove
Description
Adds the selected category from the Categories list to the Chosen list.
Removes selected categories from the Chosen scrolling list.
If you select a category by mistake, click Remove to remove it from the definition of the
compact variable.
New
Lets you create a new category which is added to both scrolling lists.
Use New to build a compact variable when categories describing its structure do not already
exist. For more details, see “Create category definitions,” p. 81.
Control-click (Windows) Builds a category definitions for a simple compact variable from the names of the selected
or Command-click
columns. (The Fewer choices dialog box does this transparently for simple compact variables.)
(Macintosh) New
Edit
Lets you edit a selected category in the Categories list. For more details, see “Edit category
definitions,” p. 83.
If you make a mistake in creating a category, use Edit to correct it.
2 Datasets Compact variables
Since we don’t have any categories defined yet, we must create two: one for gender, and one
for smoking. First we define a gender category:
• Click New
• Type a Category name: Gender
• Type a Group label: Male
• Click Add
• Type another Group label: Female
• Click Add
• Click Done
Repeat the process for smoking:
• Click New
• Specify a Category name: Smoking status
• Specify a Group label: Smoker
• Click Add
• Specify another Group label: Nonsmoker
• Click Add
• Click Done
Now “Cells in compact” and “Variables selected” both say 4, indicating that we have successfully assigned categories for the correct number of subgroups (see the picture below). Notice
that we defined the categories in order (gender then smoking) and also defined their groups in
2 Datasets Compact variables
order (male then female, smoker then nonsmoker). This is simpler than it might seem—just
read from left to right in your columns.
• Click Compact
• Click the variable name (Cholesterol readings) to select all four columns
• Click and drag the borders between group names to make the columns narrower
• Double-click the attribute pane control
to close the attribute pane
Again the variable browser shows a single variable, Cholesterol, with a triangle
that it is a compact variable.
• Click the triangle to reveal the nominal variables within
indicating
The nominal variables have the names we gave to their category definitions, and they appear
in the same order as we chose them. Again, Cholesterol readings and its nominal components
all look like regular variables. Cholesterol readings has a
class marker for continuous, and
Gender and Smoking status have
class markers for nominal.
Again, let’s save the dataset:
• From the File menu, select Save
• Specify a filename: Complex Compact Variable
• Click Save
2 Datasets Compact variables
Expand compact variables
Sometimes you might want to unpack compact variables back into simple, regular columns.
Removing the compact structure is easy.
Simple compact variable
For a simple compact variable, all you do is select the compact variable and click the Expand
button. You can do this either in the dataset window or the variable browser.
• From the Window menu, select Simple Compact Variable
(If you closed the dataset, use File/Open to reopen it.)
• Select Cholesterol readings (click its name) in either the dataset or the variable browser
• Click the Expand button in either the dataset or the variable browser
You’re back to the original two columns:
Complex compact variable
Expanding a complex compact variable takes several steps.
• From the Window menu, select Complex Compact Variable
(If you closed the dataset, use File/Open to reopen it.)
• Select Cholesterol readings (click its name) in either the dataset or the variable browser
• Click the Expand button in either the dataset or the variable browser
You’ve unpacked the Smoking levels. Now you need to expand each gender level.
• Select Cholesterol readings Male in either the dataset or the variable browser
• Click Expand in either the dataset or the variable browser
• Select Cholesterol readings Female in either the dataset or the variable browser
• Click Expand in either the dataset or the variable browser
2 Datasets Compact variables
And you’re done.
If you expand a compact variable by mistake, select Undo from the Edit menu.
Analyze compact variables
Now we learn how to work with compact variables in analyses. We assume that you already
know the basics of working with analysis objects in a view window. If not, either review the
chapter “Tutorial,” p. 1, or skip ahead to the chapter “Analyses,” p. 131.
If you closed your Simple Compact Variable and Complex Compact Variable datasets, reopen
them now.
• From the File menu, select Open
• Select a dataset
• Click Open
We’ve already seen that compact variables look like regular variables in the variable browser,
except that their nominal components are indented underneath their continuous components. Small triangle controls ( and ) let you show or hide the built-in nominal parts.
You can select any part of a compact variable by clicking it just as you would a regular variable. You can Add or Remove its parts the same way you would Add or Remove regular variables. You can Split By the groups of a nominal part.
Let’s try a few simple analyses with Simple Compact Variable.
Add both parts
• From the Analyze menu, select New View
2 Datasets Compact variables
• From the analysis browser, double-click Descriptive Statistics
• Choose Basic Statistics and click OK
• In the variable browser, select Simple Compact Variable from the Data pop-up menu (if it
is not already chosen)
• Shift-click or click and drag to select both Cholesterol readings and Category for Cholesterol readings
(If you don’t see Category for Cholesterol readings, click the triangle control )
• Click Add
Descriptive Statistics
Cholesterol readings
192.375
Mean
Std. Dev.
31.622
Std. Error
11.180
8
Count
Minimum
127.000
Maximum
232.000
# Missing
2
Nominal Descriptive Statistics
Category for Cholesterol re…
# Levels
Count
# Missing
2
10
0
Mode
•
Because we Added both variables, both are treated as X variables. We could instead Split By
the nominal part (after we Remove it from its current X role).
• Make sure the analysis object is still selected (still has black handles)
• In the variable browser, select Category for Cholesterol and click Remove
• Click Split By
Descriptive Statistics
Split By: Category for Cholesterol readings
Cholesterol readings, Total
Cholesterol readings, Male
Cholesterol readings, Female
192.375
194.200
189.333
Std. Dev.
31.622
41.385
7.234
Std. Error
11.180
18.508
4.177
8
5
3
Minimum
127.000
127.000
181.000
Maximum
232.000
232.000
194.000
# Missing
2
0
2
Mean
Count
We can work with the Complex Compact Variable similarly. Let’s look at box plots of Cholesterol readings, split by both nominal parts.
• Click in the white space of the view to deselect the tables
• From the analysis browser, double-click Box Plot
• In the variable browser, select Complex Compact Variable from the Data pop-up menu
• Select Cholesterol readings, Gender, and Smoking
(If you don’t see the nominal parts, click the triangle control . Shift-click or click and
drag to select all three parts.)
• Click Add
2 Datasets Compact variables
Female, Nonsmoker
Female, Smoker
Male, Nonsmoker
190
180
170
160
150
140
Male, Smoker
Cholesterol readings
Box Plot
Grouping Variable(s): Gender, Smoking status
250
240
230
220
210
200
You might want to try removing the nominal parts and then reassigning them to the analysis
as Split By variables. The results convey the same information in a different way:
Units
Box Plot
Split By: Gender, Smoking status
250
240
230
220
210
200
Male, Smoker
Male, Nonsmoker
Female, Smoker
190
180
170
160
150
140
Female, Nonsmoker
Cholesterol readings
For information on using compact variables in analyses, see “Compact variable,” p. 40 and
“Repeated measures ANOVA,” p. 82 of StatView Reference.
2 Datasets Compact variables
Importing and exporting
3
StatView can read and write several file types directly, and it can import data saved by other
applications in plain text files. StatView automatically lists any files it can read in the
Open dialog box. If you prefer to see only a certain file type, select that type for List Files of
Type (Windows) or Show (Macintosh).
StatView imports each file into a new dataset. If you need to combine several imported files in
one dataset or add imported data to an existing dataset, you can do so by importing the data,
copying it into the clipboard, and pasting it into the other dataset.
To prevent accidental file loss, the default name for an imported file is the original filename
plus “ (imported).” You can change the name yourself with Save As; be sure to supply a
unique name to avoid replacing the original file by mistake.
You can also exchange data with other applications through the clipboard: Copy data from
one application and Paste it into the other. StatView interprets data in the clipboard using the
same algorithms it uses for importing files.
For transferring data among Windows and Macintosh versions of StatView and StatView for
, use the DS Transfer format. DataSet Transfer preserves all data, formula definitions
and values, and criteria definitions. It does not preserve the current selection, the current
inclusion and exclusion of rows, or custom column widths.
Microsoft Excel
StatView can read and write Excel data files directly. Importing and exporting are as simple as
opening and saving StatView files. See the online document WhatsNew.PDF for the latest
versions of Excel supported by StatView.
Read Excel files
•
•
•
•
From the File menu, select Open
For List Files of Type (Windows) or Show (Macintosh), select Excel
Select the Excel file
Click Open
3 Importing and exporting ASCII text
StatView reads each Excel worksheet into a single StatView dataset, so opening workbooks
with multiple worksheets results in multiple StatView dataset windows. StatView reads only
the values in each cell—it does not import macros, links, or functions, although it does import
the current results of functions. Variable names and types are handled the same way for Excel
import as they are for text import; see “How StatView imports data,” p. 102.
StatView can read all built-in Excel formats and many custom formats and it assigns imported
variables to the nearest equivalent variable types in StatView. Any unrecognized formats are
converted to type real or string. You may change these by using the variable attribute pane; see
“Variable attributes,” p. 73.
Write Excel files
•
•
•
•
From the File menu, select Save As
Choose the Excel file type
Specify a filename and folder location
Click Save
StatView writes the entire dataset as a single Excel worksheet. StatView writes only the values
in each cell—it does not export formulas or criteria. Currency data are written with zero or
two decimal places, depending on the current display in StatView. All other data types are
converted to the nearest equivalent format in Excel.
ASCII text
Most applications can open and save documents in a plain text file format for exchange
with other applications. If you are not sure how to save plain text files from an application,
consult its documentation. In most cases, a Save As or Export command is available in the File
menu. If you have troubles importing, examine the text file with a text editor or word
processor. Be sure to display all special characters and formatting symbols, and if you need to
make corrections, remember to save as plain text.
Import text
StatView expects data in text files to be organized in rows and columns, with each row (case)
on a single line and with values separated by one or more separator (delimiter) characters such
as a tab, comma, or space. By default, StatView expects tab-delimited columns. Values that
contain the delimiter characters should be enclosed in double quotation marks (" ").
(Macintosh) StatView expects carriage returns at the end of each line. To import a text file created on another platform, you must first use a utility such as Apple File Exchange to replace
linefeeds (LF) or carriage returns and linefeeds (CR/LF) with just carriage returns (CR).
• From the File menu, select Open
• Choose Text file type
3 Importing and exporting ASCII text
•
•
•
•
Select a file
Click Open
Set importing options appropriate for your file
Click Import
The default settings are appropriate for most files; most Windows and Mac applications use
the tab-delimited format for text files. Many older programs and programs on other platforms use commas and/or spaces. When in doubt, use a text editor to examine your file.
Items may be separated StatView recognizes tabs, spaces, commas, returns or any
user-entered character as separator characters. If you use returns as separators, you must specify the number of variables.
Convert small integers to Categories If your source application uses integers rather than text
values to code the levels of groups, you might want to use this option. For example, a variable
containing the values 1 and 2 to represent Male and Female can be converted to a category
with two groups, Group 1 and Group 2. After importing, you can edit the category definition
to change its labels to Male and Female. Integer variables are converted to categories only if
the integer variable contains fewer than 255 unique elements and the smallest value falls
between 0 and 6.
Import non-numeric data as type string This option is a safeguard and is checked on by
default. By default, text values are imported with type string. However, you may turn the
option off to import text variables containing repeated group names with type category.
Make variables with errors have type string If your imported dataset has missing values ( . )
you don’t expect, you might want to import again using this option. Often missing or incorrect separator characters can cause values to shift to columns where their type is inappropriate,
which causes error messages or missing values. Any variables with errors are imported as string
variables; this way, all data values are displayed and you can investigate and correct the problems.For more information about data types, see “Type,” p. 73 and “How StatView imports
data,” p. 102.
Export text
StatView can export data to plain text files for use in other applications. Before exporting, you should investigate the format your target application expects (consult its documentation), so you can make the appropriate choices in StatView’s export dialog box.
3 Importing and exporting How StatView imports data
When you save data as text, only the actual displayed values are saved. Be sure to adjust Decimal Places settings before exporting so that real values are saved with sufficient precision.
• Open your dataset in StatView
• From the File menu, select Save As
• Choose Text file type
• Specify a filename
• Click Save
• Choose an appropriate separator character
• Specify whether to include variable names, whether to enclose text values in quotation
marks, and whether to save category values as integer codes
• Click Export
End lines (Windows only) Most Macintosh and applications expect lines in a text file
to have just carriage returns (CR), while most and Windows applications expect both carriage returns and line feeds (CR/LF). This option lets you choose which line ending characters
to use for the exported file.
Missing values Some applications require a particular code for missing values. You can
replace StatView’s missing value symbols ( . ) in one of two ways. Either recode missing values
in StatView with Recode from the Manage menu, or use a text editor to perform a global
search and replace on the exported text file.
How StatView imports data
The following sections provide more detail about how StatView interprets data it imports.
These rules apply to all file formats alike.
Variable names
StatView can import variable names directly only if every variable name contains nonnumeric
characters. (No variable names can be strictly numbers. For example, Year1975 is okay but
1975 would cause problems.)
3 Importing and exporting How StatView imports data
If variable names are not unique, StatView numbers occurrences after the first to ensure that
all names are unique.
Data types
StatView assigns each variable the most appropriate data type based on the number of values
of each type found in the column. (Types are discussed under “Type,” p. 73.) Most variables
contain values of a single type, and StatView assigns that type. When variables contain values
of more than one type, StatView counts how many values have each type and then uses the
following rules:
1. If any numeric type has the highest count, and there is at least one real value, the type is
real. If there is no real value but there is at least one long integer value, the type is long integer. If there are no real or long integer values, the type is integer.
2. If more than half the values are currency or date/time, that type is assigned. If fewer than
half the values are currency or date/time, the type with the next highest count is used.
3. If strings have the highest count, type is string unless there are repeated values. If there are
repeated values and fewer than 256 distinct strings, type is category with group labels in
alphabetical order.
Sometimes, data entry errors or missing separator characters shift different types of data into a
single column. When a data point is incompatible with its column’s type, it is replaced with a
missing value ( . )If a variable has many unexpected missing values, use the import option
Make variables with errors have type string. String variables can contain any data point, so
you can examine the variable to investigate the problem.
Missing values
StatView imports two adjacent separator characters as a missing value. Consider the row:
1 [Tab] 3 [Tab] 5 [Tab] 7 [Tab] [Tab] 11
StatView would import these values as:
1 3 5 7 . 11
However, multiple space separators are not read as multiple missing values, because many
applications use as many spaces as necessary to align columns. Rather, multiple spaces are read
as a single space and a single separator. For example:
38 [space] 4 [space] 12 [space] [space] [space] 19
You might expect the three consecutive spaces to translate as two missing values in six variables:
38 4 12 . . 19
Instead, the spaces are treated as one separator character, leaving four variables:
38 4 12 19
3 Importing and exporting How StatView imports data
Category definitions
Categorical variables with the same levels (group names) share the same category definition.
For example, if two columns both use only the values Mouse, Dog, and Cat, StatView assigns
the same category definition to both. This way you can easily Copy and Paste between the columns.
Example
The following example illustrates data type assignment and the effectiveness of the Convert
small integers to categories choice in the Import dialog box.
Examine the Text File Example in a text editor such as Microsoft Word. Notice that it contains no variable names. (If you save, be sure to save as plain text.)
In StatView, import Text File Example using default settings.
The following table shows how StatView assigns each variable type:
Variable
Type
Reason
Column
Column
Column
Column
Integer
Date/Time
Currency
Real
All values are integer.
All values are date/time.
All values are currency.
Although many values are integer, the variable does contain one real
value.
All values are integer. The three missing values do not affect data type.
1
2
3
4
Column 5
Integer
3 Importing and exporting Older StatView products (Macintosh only)
Column 6
String
Column 7
String
Eight out of ten values are string. There are repeated strings (red and
blue), but we did not turn off the option to Import non-numeric data
as type string.
Nine out of ten values are string and none are repeated. The number
23.7 is merely another string.
You can transfer more of the information from the text file by importing again with different
options.
• Choose Open from the File menu
• Choose Text file type
• Select Text File Example and click Open
• Uncheck Import non-numeric data as type string (turn the option off )
• Check Convert small integers to Categories (turn the option on)
• Click Import
Columns 1, 5, are now category variables with simple group labels. You can change group
labels for categories so they are more informative (see “Edit category definitions,” p. 83). Column 6 is also category; notice that in row 3 the value 1 is interpreted as blue, the first group in
the category, and in row 9 the value 10 is missing, since the category has only four groups.
Older StatView products (Macintosh only)
Many StatView users also use SuperANOVA or older versions of StatView. You can open and
save SuperANOVA and StatView 1.x data files directly with StatView, or you can exchange
data through intermediate text files.
Text
When you save data as text, only the actual displayed values are saved. Be sure to display
enough decimal places to meet your needs. Formula, Recode, Series, and Criteria definitions
are not saved.
3 Importing and exporting Older StatView products (Macintosh only)
Old StatView data
Files saved as StatView Data cannot be read by StatView II, StatView SE+Graphics, or StatView 512+. To export data to any of these packages, save the files in StatView 1.x Data format.
All numeric data are saved in full precision. Formula, Recode, Series, and Criteria definitions
are lost. Data class and format attributes are lost. Compact variables are saved in expanded
format. Date/time and Currency variables can only be saved if they are first converted to type
string.
SuperANOVA data
If you save a dataset in SuperANOVA format, nearly all information is kept intact. We recommend using SuperANOVA as an intermediate format to transfer data to StatView versions
4.00–4.02.
Any current selection (highlighting) of cells, rows, or columns is lost. Row inclusion/exclusion
settings are lost; all rows become included. Certain functions used in formulas are not available in SuperANOVA, although they are interpreted correctly in any version of StatView that
supports them.
If your formulas contain functions that SuperANOVA does not recognize, SuperANOVA
opens the Formula dialog box with the dataset and highlights the unknown function. You
have two choices in this situation:
1. Click Cancel in the Formula dialog box. This retains the computed values in the formula
column. If you save this dataset, you can read it back into StatView with all formula information intact.
2. Change the formula column from Dynamic Formula to User Entered. This removes the
formula definition but preserves its current values. If you save this dataset and read it back
into StatView, the formula definition is lost.
Managing data
4
StatView’s Manage menu offers numerous ways to manage your dataset.
1. Include Row, Exclude Row let you choose which cases (rows) are used in statistical and
graphical analyses.
2. Create Criteria and Edit/Apply Criteria let you define logically which cases (rows) are used
for analyses, e.g., all cases with Weight values less than 200 and Age values greater than 20.
3. Formula, Series, and Random Numbers create new variables by definitions using StatView’s mathematical expression language. For example, you could create a variable of Celsius temperatures from one of Fahrenheit temperatures with a formula like this:
(Temperature – 32)*5/9.
4. Sort reorders cases (rows) according to the values of one or more key variables.
5. Recode creates new variables by grouping the values of continuous variables into nominal
values or by replacing missing values with a specific value.
The other Manage menu commands are discussed elsewhere.
1. Edit Categories lets you change category definitions for group labels and is discussed under
“Edit category definitions,” p. 83.
2. Add Multiple Column enables you to add any number of empty columns to the dataset in
a single step and is discussed under “Manipulate columns and rows,” p. 62.
3. Preferences let you customize StatView’s behavior to suit the way you work and are discussed in “Tips and shortcuts,” p. 221.
Manage multiple datasets
If a dataset window is active (frontmost) when you select a Manage menu command, the
command takes action on that dataset. If a view window is active and several datasets are
open, you must choose which dataset to change.
• Select the dataset you want to manage
• Click Use
4 Managing data Include and exclude rows
To make changes to more than one dataset, repeat your actions on the other datasets in turn.
You can also Copy and Paste formula definitions between datasets.
Include and exclude rows
When you use a variable in an analysis, all the values in that variable are included in the analysis unless you exclude some rows (cases). All rows are included in analyses by default. If you
prefer to restrict your analyses to a subset of the rows in a dataset, you can use Include Row
and Exclude Row commands, Criteria commands, or both. Criteria are discussed separately
under “Create criteria,” p. 124 and “Edit/Apply Criteria,” p. 129.
Use Include Row and Exclude Row to restrict analyses to certain rows. When you exclude
rows or include rows that were excluded, any analysis results in any open view window using
those data automatically recalculate to show the new results (unless you turn Recalculate off;
see “Control recalculations,” p. 138).
• Select the row(s) by clicking row number(s)
To select multiple adjacent rows, Shift-click or click and drag their numbers. To select nonadjacent rows, Control-click (Windows) or Command-click (Macintosh) their numbers.
To select all rows, use Select All Rows from the Edit menu.
• From the Manage menu, select Include Row or Exclude Row
You can tell whether a row is included or excluded by its row number. Included row numbers
appear in regular, dark type. Excluded row numbers are dimmed or grayed. These characteristics are also visible if you print your dataset.
Shortcut Double-click any row number to toggle the row between included and excluded.
Caution Many columnwise functions have a final argument that controls which rows of the
column are used for computations: AllRows, OnlyIncludedRows, or OnlyExcludedRows.
When you use the latter two arguments, be aware that any Include Row, Exclude Row, and
Criteria commands you use will cause these formula variables to recalculate.
Include and Exclude vs. Criteria
Include Row and Exclude Row commands are most useful when you are exploring your data.
For example, you might temporarily exclude a few cases that seem to be outliers. You can eas-
4 Managing data Formula
ily adjust which rows are included until you begin to make sense of your data. At that point,
or when you want to work with subsets systematically according to logical rules (e.g., all rows
with Weight values between 100 and 300), it is better to use criteria commands. Criteria are
also preferable when you need to preserve subsets for future use.
Formula
Formula creates variables through algebraic definitions called formulas. For example, you can
create simple formulas to sum two variables or to log a variable. Or, you can write a complex
formula with many arguments.
Formula variables are dynamically linked to the variables used to define them, so if those variables change, the formula variable automatically updates. (You can turn this link off by
switching the source from Dynamic Formula to Static Formula.) Warning: if you change the
names of variables used in formulas, you must fix the formulas yourself.
• From the Manage menu, select Formula
• Use the browsers and keypad to build an expression
(Or type an expression directly into the text box.)
• Click Compute
Browser order pop-up menus
Definition area (text box)
Variable browser
Function browser
(Windows)
Calculator keypad
The Formula dialog has a variable browser, a function browser, and a calculator keypad for
building expressions interactively. You can also type formulas directly into the definition area,
and as StatView recognizes the variable or function name you are typing, it completes the
name and supplies all the needed parameters.
Window controls
This dialog box behaves like a regular window: you can resize it, use Cut, Copy, and Paste on
the text, change fonts, and move the window behind or in front of other windows.
4 Managing data Formula
Browser order pop-up menus
Definition area (text box)
Variable browser
Function browser
(Macintosh)
Calculator keypad
A Formula dialog box is listed in the Window menu, where you can select it to bring it to the
front. You can double-click the top area beneath the title bar to bring its dataset to the front.
Select Print from the File menu to print a formula definition.
(Macintosh only) The triangle at the bottom of the dialog box is a split-pane control; click
and drag it to resize or close the browser pane. If you drag it all the way to the left, the variable
and function areas disappear; you can still type and use the keypad to create formulas.
Use Attributes if you want to specify variable names and attributes before clicking Compute.
You can adjust attributes afterward in the dataset window if you prefer. See “Variable
attributes,” p. 73.
Variable browser
The variable browser lets you choose variables from the current dataset.
Use the Order pop-up menu to choose how to sort variable names in the scrolling list:
Dataset order
Alphabetical
Variable type
Usage
The order in which variables appear in the dataset’s columns (left to right).
Alphabetical order by variable name, with nonalphabetic names first.
Grouped in order by nominal, continuous, and compact.
Ordered first by variable use in analyses and then in alphabetical order. When a dataset window
is active, ordering is only alphabetical.
As in the main variable browser, variables appear in a scrolling list. Icons next to variable
names indicate their data class:
for continuous and
for nominal (informative variables
cannot be used). Nominal variables have triangle controls. Click a triangle to tip it downward
and reveal group labels. This mechanism provides an easy way to enter a group label
from a nominal variable into a formula, which is particularly useful in formulas with
if…then…else statements.
4 Managing data Formula
Compact variables are shown as several continuous variables; for example, a compact variable
of Male and Female Weight values is listed as two continuous variables, Male Weight and
Female Weight.
To insert a variable name (or a nominal value) in a formula definition, double-click it in the
variable browser.
Function browser
The function browser offers an array of date/time, logical, mathematical, probabilities, random numbers, series, special purpose, statistical, text, and trigonometric functions you can
use for creating variables. You can use the Order pop-up menu to sort functions alphabetically
or by type.
When you order functions by type, each type has a triangle
it downward
and reveal its functions.
control. Click the triangle to tip
Function type
Functions discussed
Date/Time
Date, DateDifference, Day, DayOfYear, Hour, Minute, Month, Now, Second, Time, Weekday,
WeekOfYear, Year
<, <= or ≤, =, >= or ≥, >, <> or ≠, AND, ElementOf, IS, ISNOT, OR, XOR, false,
if…then…else, IsMissing, IsRowExcluded, IsRowIncluded, NOT, true
+, –, *, /, (), ^, +, –, Abs, Average, AverageIgnoreMissing, Ceil, Combinations, CumProduct,
CumSum, CumSumSquares, Difference, Div, DotProduct, e, Erf, Factorial, Floor, Lag, Ln, Log,
LogB, Mod, MovingAverage, Norm, Percentages, Permutations, Pi, π, Remainder, Round, Sqrt,
Sum, SumIgnoreMissing, Trunc
ProbBinomial, ProbChiSquare, ProbF, ProbNormal, Probt, ReturnChiSquare, ReturnF,
ReturnNormal, ReturnT
RandomBeta, RandomBinomial, RandomChiSquare, RandomExponential, RandomF,
RandomGamma, RandomNormal, RandomPoisson, RandomT, RandomUniform,
RandomUniformInteger
BinomialCoeffs, CubicSeries, ExponentialSeries, FibonacciSeries, GeometricSeries, LinearSeries,
QuadraticSeries, QuarticSeries, RowNumber
{ }, (:), [:], (:], [:), <, <= or ≤, >= or ≥, >, ChooseArg, VariableElement
BoxCox, CoeffOfVariation, Correlation, Count, Covariance, GeometricMean, Groups, HarmonicMean,
LogOdds, MAD, Maximum, Mean, Median, Minimum, Mode, NumberMissing, NumberOfRows,
OneGroupChiSquare, Percentile, Range, Rank, StandardDeviation, StandardError, StandardScores,
SumOfColumn, SumOfSquares, TrimmedMean, Variance
Concat, Find, Len, Substring
ArcCos, ArcCosh, ArcCot, ArcCsc, ArcSec, ArcSin, ArcSinh, ArcTan, ArcTanh, Cos, Cosh, Cot, Csc,
DegToRad, RadToDeg, Sec, Sin, Sinh, Tan, Tanh
Logical
Mathematical
Probabilities
Random Numbers
Series
Special Purpose
Statistical
Text
Trigonometric
Note that:
1. Trigonometric functions evaluate arguments or return results in radians (there are 2π radians in 360˚). See “DegToRad(?),” p. 372 and “RadToDeg(?),” p. 405 of StatView Reference
for help converting between radians and degrees.
4 Managing data Formula
2. For logical functions, 0 is false; 1 or any nonzero, nonmissing value is true; and missing is
missing. You can use IsMissing, , and for special handling of missing values.
3. For the statistical functions, unless otherwise indicated, the first argument must be a variable name and remaining arguments can be any value. Many functions let you specify
which rows of the dataset to use in the calculation: AllRows (the default), OnlyIncludedRows, or OnlyExcludedRows. See “Row inclusion,” p. 325 of StatView Reference.
To insert a function in a formula definition, double-click it in the function browser.
Calculator keypad
The calculator keypad offers the most frequently used operators and functions, including the
arithmetic operators +, –, *, and /, and the trigonometric functions sin, cos, and tan.
Button
Function
INV function
HYP function
INV HYP
function
sin
cos
tan
and
+
log
ln
x^y
or
–
=
<
>
not
*
1/x
()
if…
+/–
IsIn
/
sin(?)
cos(?)
tan(?)
? AND ?
?+?
log(?)
ln(?)
?^?
? OR ?
?–?
?=?
?<?
?>?
NOT(?)
?*?
1/?
(?)
if ? then ? else ?
–?
? ElementOf ?
?/?
arcsin(?)
arccos(?)
arctan(?)
NOT(? AND ?)
?+?
10 ^ ?
e^?
? ^ (1/?)
NOT(? OR ?)
?–?
?≠?
?≥?
?≤?
?
.
?
.
.
+?
NOT(?ElementOf?)
.
sinh(?)
cosh(?)
tanh(?)
arcsinh(?)
arccosh(?)
arctanh(?)
To insert an operator or function in a formula definition, click its button. Click first the
button and then another button to insert an inverse functions. Click and a trig button to
insert an hyperbolic trig functions, and click , then , then a trig button to insert inverse
hyperbolic functions.
4 Managing data Formula
Mathematical expression language
The functions found in the browser and keypad constitute a complete mathematical expression language, which is detailed in the chapter “Formulas,” p. 315 of StatView Reference. Consult that chapter for a comprehensive discussion of how expressions are evaluated, how each
function works, and myriad examples.
To see a quick definition for a function, open the Hints window and select the function.
Build definitions
Functions and variables appear in the definition area as you double-click them in the browsers, click them in the keypad, or type them. To insert an element in a particular part of a formula, first click the I-beam cursor in that location.
Most functions require that you supply arguments for the functions. These are represented by
question marks ? in the formula definition area (and the function browser). Arguments are
the objects of operators and functions. When you enter a function into a formula definition,
you need to replace the “?” with the desired argument.
For example, if you click the Log button or double click Log(?) in the function browser,
“Log(?)” appears and “?” is selected (highlighted) in the definition text box. Replace a
selected ? with the desired argument by typing it or selecting it from the keypad or a browser.
To select the next ? for replacement, press Tab. To select the previous ? for replacement, press
Shift-Tab.
Arguments to a function can be constants, variables, or expressions. For example, the function
Sum(Weight, Ln(Age), 10) adds for each row the value of the Weight variable, the natural log
of the Age value, and the number 10. Some functions contain default arguments which you
can change, such as LinearSeries(1, 1), which accepts two arguments. When you enter it into
a formula it appears with a 1 for each of its arguments. You can change these default arguments to any values you want. Arguments are discussed in detail in “Arguments,” p. 323 of
StatView Reference.
Many functions can take a varying number of arguments. Functions of this type contain
ellipses (…) to indicate that they allow any number of arguments. After supplying as many
arguments as you need, you must remove the trailing ellipsis (…).
To learn what is expected for each argument of a function, open the Hints window and select
the function. For a complete discussion of each function and its arguments (and some general
rules), look up the function in the chapter “Formulas,” p. 315 of StatView Reference.
Compute, Save, Cancel
Click the Compute button to create a new variable defined by the formula. Click Cancel,
press Escape, or press Control-Period (Windows) or Command-Period (Macintosh) to cancel
a formula and close the dialog box. If you are editing an existing formula variable, Cancel
reverts to the original definition and Compute recomputes the variable.
4 Managing data Formula
New variables are appended at the right side of the dataset. To move a variable, Copy or Cut
the data, insert an empty column elsewhere in the dataset (see “Insert columns,” p. 62), and
Paste the data into the empty column. To create a formula variable in another location, insert
a column and change its source to Static Formula or Dynamic Formula.
To edit an existing formula, select Dynamic Formula from the variable’s Source pop-up menu.
Some examples
The following are all valid formula expressions:
-3
1+2
1 + (2 - 10)
3 (4+6)
4^2
log(100)
The expression 3 (4+6) means “3 times the quantity 4 plus 6,” and it returns 30. The expression log(100) means “evaluate the base 10 logarithm of the value 100,” and it returns 2.00.
A formula can also operate on variables in the same dataset:
Age / 2
Log(Weight)
A formula of this type is evaluated on a row-by-row basis. For example, the expression “Age /
2” is first evaluated for row number 1 of the dataset, then row number 2, then 3 and so on. If
the Age value in row number 1 is 10, the resulting formula for row number 1 is 5 (10 divided
by 2).
Logical formulas can be created with the if…then…else function, such as:
if Age > 1
then 10
else Age
The result of this formula is 10 for each row of the Age variable with a value greater than 10.
Otherwise the result is the existing value of the Age variable in that row.
Consult the “Formulas,” p. 315 of StatView Reference, for more examples and further discussion.
Exercise
Here we create a new formula variable to average two variables, Triglycerides and Trig-3yrs.
• Open Lipid Data from the Sample Data folder
• From the Manage menu, select Formula
• Start typing a variable name: Triglycerides
4 Managing data Formula
As soon as you type “Trigl” the rest of the variable name is filled in. You type as few characters
as are needed to distinguish a variable from all others.
• Click + on the keypad
• In the Formula window’s variable browser, double-click Trig-3yrs
The selected “?” is replaced by the variable name. The formula now reads:
Triglycerides + "Trig-3yrs"
Variable names, dates, and nominal levels of a category appear in quotation marks if they are
not purely alphabetic or contain spaces. For rules, see “Quotation marks,” p. 325 of StatView
Reference.
• Select the entire formula
• Click the ( ) button on the keypad
The entire expression is enclosed in parentheses, so the formula now reads:
(Triglycerides + "Trig-3yrs")
• Click in the blank area of the text box to deselect the expression
• Click the / operator and then 2 the keypad
The formula is now complete. It reads:
(Triglycerides + "Trig-3yrs")/2
• Click Compute
The new variable, the average of Triglycerides and Trig-3yrs, appears at the right of your
dataset, to the left of the input column.
Shortcuts
As you observed in the exercise, StatView automatically creates placeholders for arguments
and anticipates the rest of a formula or function when you start typing. In a similar way, StatView anticipates arguments for the mathematical operators +, –, *, and /. For example, if you
double-click a variable and then click the + operator, the definition area highlights a ? to indicate that it is ready to take the second argument:
In addition, if any part of a formula is already selected when you insert a function name, the
selection is interpreted as the first argument of any function that can take arguments. For
example, if you select Weight in the formula definition, and click the Sin button you see:
sin(Weight)
4 Managing data Sort data
When you type variable names or functions in the formula definition, you have to type only
enough characters to identify the word uniquely. For example, if you type “we” and you have
a variable named Weight, the remaining characters are automatically entered. However, if you
have a variable named “Weight” and a variable named “Weight1,” you have to type the whole
word, since the letters “we” are not unique. When you begin to type the name of a function,
the function is inserted, along with any arguments, and the first argument of the function is
selected. If StatView anticipates a term incorrectly, simply delete any incorrect character
Errors in formula
If you make an error in a formula definition, you get a warning after you click Compute. The
Hints window advises you about your error, and the formula window highlights the problematic area. Formulas do not compute until their expressions can be interpreted unambiguously.
Most errors involve invalid arguments (e.g., constants where variables are expected), a wrong
number of arguments, missing parentheses, or misspelled function or variable names. Many
common errors can be prevented simply by using the browsers and the keypad to build formulas rather than trying to type formulas by hand.
Any formula with an error will not compute. For a new formula, missing values fill the column until the formula can be computed. If you edit the formula for an existing, valid formula
variable and cause an error, the original definition and its values remain.
For help solving common formula errors, see “Formulas and criteria,” p. 240.
Dynamic vs. static formulas
Formula variables use dynamic formulas by default. If you change data associated with a
dynamic formula, the formula automatically recalculates.
You can change the source of a formula variable from Dynamic Formula to Static Formula in
the attribute pane. Changing formulas to static prevents recalculation. Changing to UserEntered deletes the formula information completely but saves the values. You cannot edit the
data in a Dynamic or Static Formula variable unless you first change it to User Entered. See
“Change sources,” p. 77.
If you delete a variable that is used in a formula, you are alerted to the fact that the variable is
used in a formula definition. If you continue and delete the variable, the formula changes
automatically to static and retains its current values. You can then change the column to userentered or redefine the formula.
Sort data
Sort reorders the rows of a dataset in either ascending or descending order according to the
values of one or more key variables in the dataset. For example, when you sort the rows of
Lipid Data on the values of Cholesterol in ascending order, the subject with the lowest choles-
4 Managing data Recode data
terol value appears in the top row and the one with the highest in the bottom row. Any subjects with missing cholesterol values appear at the end.
• From the Manage menu, select Sort
• Select a variable and click Make Key
(Or select and click Make Key for several variables in order.)
• For each key, click the arrow icon to choose ascending( ) or descending ( ) order
• Click OK
“Ascending” order is from lesser to greater numbers, or from A to Z, and numbers come
before letters. Case and accent marks are ignored when sorting text. Missing values are sorted
as if they were the largest values in a variable. Nested sorts (sorts with more than one key variable) order cases with matching values on the first variable according to values of a second
variable, etc.
Only complete datasets are sorted; if you want to sort only a few rows or a few columns, you
must first extract them to another dataset.
Caution You can unsort data only by immediately selecting Undo from the Edit menu or
typing Control-Z (Windows) or Command-Z (Macintosh). Otherwise you cannot unsort
data unless you took precautions to preserve the order before sorting. For tips on how to preserve a sorting order permanently, see “RowNumber,” p. 417 of StatView Reference.
Recode data
Recode creates new variables two different ways: by grouping the values of continuous variables into nominal values, or by replacing missing values of a nominal or continuous variable
with a specific value. The original variable is unchanged. You cannot recode informative variables or compact variables. (To recode a nominal variable into a different nominal variable,
use a formula; see “if ? then ? else ?,” p. 341 and “ChooseArg(?),” p. 359 of StatView Reference.)
Grouping values of continuous variables lets you derive nominal variables from continuous
data. For example, ranges of temperatures in degrees recode into hot, temperate, or cold;
response times in seconds convert to slow, medium and fast. Date/time data with day/month/
year values can be grouped into seasons.
4 Managing data Recode data
Recoding missing values is useful for preparing a dataset for export to a data analysis package
that expects missing values to be coded a certain way; for example, some packages expect missing values to be coded –99.
• From the Manage menu, select Recode
• Select a variable
• Choose which way to recode
Continuous data to nominal groups
When you choose Continuous values to nominal groups, you must specify a category to
define the group labels to be used for the recoding. You can either select an existing category
or click New to define a new one. Assigning categories in order from least to greatest simplifies
later steps in recoding. For help with categories, see “Categories,” p. 80.
After you create or choose a category, you must specify how to divide the range of continuous
values into groups. A value bar represents the range of data; its top and bottom edges correspond to the variable’s maximum and minimum values.
• Either click breakpoints in the value bar or enter values in the text box
• Use pop-up menus to correct group label assignments
StatView automatically assigns group labels in order according to the category definition.
If your category definition orders labels from least to greatest, Recode assigns groups correctly.
• Click Recode
4 Managing data Recode data
Click Show definition or double-click the triangle
in the lower left corner to open a pane
showing the formula definition for the recode. You can then drag the triangle to resize the
split pane. Click Hide definition or double-click the triangle to close the split pane. Select
Print from the File menu to print the definition. You cannot edit the formula definition.
To change a breakpoint, select it and then drag it or enter a new value in the text box to
change it, or press Backspace (Windows) or Delete (Macintosh) to remove it.
A Recode dialog box is listed in the Window menu, where you can select it to bring it to the
front. You can double-click the top area beneath the title bar to bring its dataset to the front.
Select Print from the File menu to print a formula definition.
If you prefer, you can use Formula to build your own recoding formula; Recode is a shortcut.
Either way, you can use the variable’s Source pop-up menu to view and edit a formula definition, or to change from static formula to dynamic formula or user entered. See “Change
sources,” p. 77. By default, recoded variables are based on dynamic formulas, which means
that changes or additions to the original variable automatically change the recoded variable.
New variables are appended at the right side of the dataset. To move a variable, Copy or Cut
the data, insert an empty column elsewhere in the dataset (see “Insert columns,” p. 62), and
Paste the data into the empty column. To create a recode variable in another location, insert a
column and change its source to Static Formula or Dynamic Formula.
4 Managing data Recode data
Missing values to a specified value
Recoding missing values to a specific value works by building an if…then…else formula. You
must supply a value in place of its question mark (?) placeholder. The value you specify can be
a number, a string, or some other function, such as the mean of the variable.
You can choose any function from the browser at the left. For more information about each
function, refer to the chapter “Formulas,” p. 315 of StatView Reference or examine the Hints
window: when you click a function, the Hints window describes the function and its parameters briefly.
Use Attributes if you want to specify variable names and attributes before clicking Create. You
can adjust attributes afterward in the dataset window if you prefer. See “Variable attributes,”
p. 73.
A Recode dialog box is listed in the Window menu, where you can select it to bring it to the
front. You can double-click the top area beneath the title bar to bring its dataset to the front.
Select Print from the File menu to print a formula definition.
If you prefer, you can use Formula to build your own recoding formula; Recode is a shortcut.
Either way, you can use the variable’s Source pop-up menu to view and edit a formula definition, or to change from static formula to dynamic formula or user entered. See “Change
sources,” p. 77. By default, recoded variables are based on dynamic formulas, which means
that changes or additions to the original variable automatically change the recoded variable.
New variables are appended at the right side of the dataset. To move a variable, Copy or Cut
the data, insert an empty column elsewhere in the dataset (see “Insert columns,” p. 62), and
Paste the data into the empty column. To create a recode variable in another location, insert a
column and change its source to Static Formula or Dynamic Formula.
Exercise
In this exercise, you create a variable that categorizes the risk of heart attack in patients as
high, medium, or low, depending on their measured -Cholesterol values. The lower the
4 Managing data Series
-cholesterol values, the higher the risk of heart attack. Values below 35 denote high risk,
between 35 and 60 medium risk, and 60 and above low risk.
• Open Lipid Data from the Sample Data folder
• From the Manage menu, select Recode
• Select and click Continuous values to nominal groups
• Click New
• Define a category called risk with three group labels, High risk, Medium risk, Low
risk, in order
• Click Done
• Type the value 35 and press Enter (Windows) or Return (Mac)
• Type the number 60 and press Enter (Windows) or Return (Mac)
• Click Show Definition to see the corresponding formula
• Click Recode
The recoded variable is appended to the right side of the dataset. Recoded variables are based
on dynamic formulas, which means that changes or additions to automatically change
the recoded variable.
Series
Series generates new variables with values based on common types of series. Series variables
are based on static formulas, and you can edit them the same way you edit formulas. You can
also use Formula to generate series with dynamic formulas.
• From the Manage menu, select Series
• Double-click a series in the scroll list
• Replace any ? arguments and edit any default parameters to suit your needs
• Specify the number of rows and columns to create
• Click Create
4 Managing data Series
This dialog box behaves like a regular window: you can resize it, use Cut, Copy, and Paste on
the text, and change font. You can double-click the top area beneath the title bar to bring its
dataset to the front. Select Print from the File menu to print a formula definition.
(Windows only) You can move a Series window behind or in front of other windows. It is
listed in the Window menu, where you can select it to bring it to the front.
You can create any number of rows and columns of the same series. By default, Series creates
one variable with the number of rows currently present in the dataset. If you specify a larger
number of rows, rows are added to all columns and filled with missing value symbols ( . ) in
the other columns unless they are formula variables whose definition specifies otherwise.
Use Attributes if you want to specify variable names and attributes before clicking Create. You
can adjust attributes afterward in the dataset window if you prefer. See “Variable attributes,”
p. 73.
For more information about each series, refer to the chapter “Formulas,” p. 315 of StatView
Reference, or examine the Hints window: when you click a series, the Hints window describes
the function and its parameters briefly.
Use the variable’s Source pop-up menu to view and edit a formula definition or to change
from static formula to dynamic formula or user entered. See “Change sources,” p. 77.
New variables are appended at the right side of the dataset.To move a variable, Copy or Cut
the data, insert an empty column elsewhere in the dataset (see “Insert columns,” p. 62), and
Paste the data into the empty column. To create a series variable in another location, insert a
column and change its source to Static Formula or Dynamic Formula.
Exercise
This exercise creates a new dataset with five variables and one hundred observations.
• From the File menu, select New
• From the Manage menu, select Series
• Double-click CubicSeries(1,0,0,1)
• Specify the number of rows: 100
4 Managing data Random numbers
• Specify the number of variables: 5
• Click Create
Five new variables are added to your dataset.
Random numbers
Random Numbers lets you create new variables whose values are generated from a commonly
used distribution. Random Numbers variables are static formula variables and can be edited
accordingly. You can also use Formula to generate random numbers with dynamic formulas.
• From the Manage menu, select Random Numbers
• In the function browser on the left, double-click a distribution
(Or type a distribution name directly into the definition area.)
• Replace any ? arguments and edit any default parameters to suit your needs
• Specify the number of rows and columns to create
• Click Create
This dialog box behaves like a regular window: you can resize it, use Cut, Copy, and Paste on
the text, change fonts, and move the window behind or in front of other windows. You can
double-click the top area beneath the title bar to bring its dataset to the front. Select Print
from the File menu to print a formula definition.
(Windows only) A Random Numbers dialog box is listed in the Window menu, where you
can select it to bring it to the front.
You can create any number of rows and columns of random numbers from the same distribution. By default, Random Numbers creates one variable with the number of rows currently
present in the dataset. If you specify a larger number of rows, rows are added to all columns
and filled with missing value symbols ( . ) in the other columns unless they are formula variables whose definition specifies otherwise.
4 Managing data Create criteria
Use Attributes if you want to specify variable names and attributes before clicking Create. You
can adjust attributes afterward in the dataset window if you prefer. See “Variable attributes,”
p. 73.
For more information about each distribution, refer to the chapter “Formulas,” p. 315 of StatView Reference, or examine the Hints window: when you click a distribution, the Hints window describes the function and its parameters briefly.
Use the variable’s Source pop-up menu to view and edit a formula definition or to change
from static formula to dynamic formula or user entered. See “Change sources,” p. 77.
New variables are appended at the right side of the dataset.To move a variable, Copy or Cut
the data, insert an empty column elsewhere in the dataset (see “Insert columns,” p. 62), and
Paste the data into the empty column. To create a random variable in another location, insert
a column and change its source to Static Formula or Dynamic Formula.
Create criteria
When you use a variable in an analysis, all the values in that variable are included in the analysis unless you exclude some rows (cases). All rows are included in analyses by default. If you
prefer to restrict your analyses to a subset of the rows in a dataset, you can use Include Row
and Exclude Row commands, Criteria commands, or both. Include Row and Exclude Row
are discussed separately under “Include and exclude rows,” p. 108.
Use Criteria to specify algebraically which cases to include in calculations. When you apply a
criterion, any analysis results in any open view window using those data automatically recalculate to show the new results (unless you turn Recalculate off; see “Control recalculations,”
p. 138).
You can tell whether a row is included or excluded by its row number. Included row numbers
appear in regular, dark type. Excluded row numbers are dimmed or grayed. These characteristics are also visible if you print your dataset.
Caution Many columnwise functions have a final argument that controls which rows of the
column are used for computations: AllRows, OnlyIncludedRows, or OnlyExcludedRows.
When you use the latter two arguments, be aware that any Include Row, Exclude Row, and
Criteria commands you use will cause these formula variables to recalculate.
Criteria can be as simple or complex as you like. Criteria are saved when you save the associated dataset. A list of all defined criteria appears in the dataset’s Criteria pop-up menu.
There are four ways to select and define new criteria:
1. From the Manage menu, select Create Criteria
2. From the Manage menu, select Edit/Apply Criteria and click New
3. From the dataset Criteria pop-up menu, select New
4. From the dataset Criteria pop-up menu, select Random
Any method leads you to a Criteria dialog box (except the fourth, which leads you to a random criterion dialog box).
4 Managing data Create criteria
This dialog box behaves like a regular window: you can resize it, use Cut, Copy, and Paste on
the text, change fonts, and move the window behind or in front of other windows.
A Criteria dialog box is listed in the Window menu, where you can select it to bring it to the
front. You can double-click the top area beneath the title bar to bring its dataset to the front.
Select Print from the File menu to print a formula definition.
A criteria definition consists of three parts: a variable, a comparison operator and a value. You
choose these three parts from the scrolling list below the definition area. The scrolling list
coaches you through each step of the definition process by showing you first a list of variables,
then a list of comparison operators, and finally either a list of the levels of a nominal variable
or a value bar for a continuous variable.
To create a complex criterion (one using , , or ), click in the definition area after the
expression and then select a logical conjunction from the list. You may use the logical by
editing the definition.
You can edit definitions by clicking in the part of the definition you want to change. Again,
the scroll list coaches you: it changes to the type of list you need to edit that part of the definition.
You can type a definition directly into the definition box if you prefer. You can print a criterion definition by choosing Print from the File menu.
Define criteria
Defining a criterion is a four-step process: name the criterion, select a variable, choose a comparison operator, and set a value or range of values.
Name the criterion
The default name is “Criteria n.” You should supply a more meaningful name, because you
select and apply criteria by name from the Criteria pop-up menu and the Edit/Apply Criteria.
Also, the name of any criterion in effect appears automatically in the titles of statistical analyses and graphs as a reminder that results are based on a subset of the data.
4 Managing data Create criteria
Select a variable
Double-click a variable from the list (or type its name) to select it. A criterion can be based on
any continuous or nominal variable in the dataset. Select the variable whose values determine
whether cases are included or excluded from analyses. For example, if you want to analyze
only those cases whose Weight value is greater than 160, select Weight.
Choose a comparison operator
Next, choose a comparison operators. For example, if you want to analyze only those cases
whose Weight value is greater than 160, select > for “greater than.”
<
=
>
<> or ≠
<= or ≤
>= or ≥
ElementOf
IS
ISNOT
less than
equal to
greater than
not equal to
less than or equal to
greater than or equal to
is an element of
equal to, or both are missing values
not equal to, or one value missing and the other is not
For a detailed discussion of StatView’s logical operators, see the chapter “Formulas,” p. 315 of
StatView Reference.
What you see for the final step varies according to the variable you select in the first step. For
a continuous variable, you see a value bar; for nominal, a list of its levels (group labels).
Set a value or range with a value bar
A value bar is a linear representation of the range of the variable from its minimum to its maximum. Both extrema are labeled.
The number below Selected value changes as you move the cursor across the bar.
To define a range, click endpoints in the value bar and choose brackets or parentheses at each
end of the value bar to specify closed or open intervals. Brackets [ ] indicate closed intervals,
which include their endpoints. Parentheses ( ) indicate open intervals, which exclude their
endpoints. For example, if a variable contains integers between 1 and 10, the range [4:6] contains the values 4, 5, 6, the range (4:6] contains the values 5 and 6 and (4:6) only contains the
value 5.
4 Managing data Create criteria
To specify a single value, click in the value bar. To change a value, click the vertical line and
drag it to its new location. To specify an interval, click and drag between endpoints.
For =, <> or ≠, or , which take a single value, a vertical line indicates that value.
For <, >, >= or ≥, or <= or ≤ , which take a range, a bracket or parenthesis and a gray fill pattern indicate the included range.
For ElementOf, which takes an interval of a continuous variable, brackets or parentheses and
a gray fill pattern indicate the included range.
To move an existing range, click and drag the entire range across the bar. To change one of the
endpoints of a range, click drag the endpoint to the new position. You can also change the
range values by typing the ranges into the criterion definition.
Choose a level or levels
When the variable is nominal, you see a list of its group labels instead of the value bar.
Double-click one or more group label to select one or more groups. If you need to define a
criterion that includes only those cases with or without a missing value for a certain variable,
use or and a missing value ( . ).
Complex criteria
If you click inside the definition area at the end of a definition, the scrolling list presents a list
of Boolean operators. You can combine as many criteria as you like using , or . To
enter a Boolean operator, double-click it or type its name. You can group expressions by
inserting parentheses into the definition.
4 Managing data Criteria pop-up menu
Parentheses, , , and are discussed in detail in the chapter “Formulas,” p. 315 of
StatView Reference.
Apply, Save, and Select
The buttons at the lower right corner of the Criteria dialog box give you three options when
you are finished creating or editing criteria. All three buttons save the criterion with the
dataset, add it to the Criteria pop-up menu, and bring the dataset to the front.
Save
Apply
Select
Save the criterion and include it in the Criteria pop-up menu.
Evaluate the criterion, save it, and apply it: include in analyses only those rows that evaluate
to true.
Evaluate the criterion, save it, and select (highlight) those rows that evaluate to true. Do not
apply the criterion.
If the criterion definition is incorrect, you cannot apply or save it until you correct the error.
Criteria pop-up menu
The Criteria pop-up menu at the top of the dataset lists all criteria defined for the dataset. A
criterion is dimmed if it has not been saved or applied, if its dialog box is open for editing, or
if it has become invalid because the variable it is based upon has been deleted or renamed.
• Select No Criteria to turn off criteria (to include all rows)
• Select New to define a new criterion
• Select Random to define a random criterion
• Select a criterion to apply it
• Control-select a criterion to select in the dataset rows that would be included by the criterion
No Criteria is the default, indicating that all dataset rows are included in any analysis.
Random criteria use the following dialog box:
Enter a percentage between 0 and 100 for each row to be included. Click OK to create a criterion named “n% Rows Included” and apply it to the dataset. A new random sample is
4 Managing data Edit/Apply Criteria
included each time you select or define a random criterion. If you need to do more complicated random inclusions, see “RandomInclusion(?),” p. 409 of StatView Reference.
A special dialog box lets you create complex random criteria. For example, you might want to
include a random number generator seed so that a random inclusion can be reproduced. See
“RandomInclusion(?),” p. 409 of StatView Reference.
When you close a dataset that contains random criteria, their definitions are saved, but an
exact row inclusion is only saved if the random criterion is in effect (applied) when you save.
Edit/Apply Criteria
You can apply an existing criterion two ways.
1. From the Manage menu, select Edit/Apply Criteria, choose a criterion, and click apply.
2. From the Criteria pop-up menu in a dataset, select the criterion.
You can edit existing criteria with Edit/Apply Criteria only.
• From the Manage menu, select Edit/Apply Criteria
• Select one or more criteria
• Click Edit
Selecting any criterion shows a preview of its definition.
In a criterion’s dialog box, you can either edit a definition directly in the text box, or you can
select part of the definition and make another choice from the scrolling list or value bar. If you
edit a criterion currently applied to the dataset, the dataset immediately reflects the change.
You can also delete criteria so that they are no longer saved with a dataset
• From the Manage menu, select Edit/Apply Criteria
• Select one or more criteria
• Click Delete
You can turn criteria off two ways.
1. From the Manage menu, select Edit/Apply Criteria, select No Criteria, and click Apply.
2. From the Criteria pop-up menu in a dataset, select No Criteria.
4 Managing data Edit/Apply Criteria
Exercise
In this exercise, you create two criteria: one to include only men in analyses, and one to
include only men with low lipid counts.
• Open Lipid Data from the Sample Data folder
• From the Manage menu, select Create Criteria
• Double-click Gender
• Double-click =
• Double-click Male
• Name the criterion Men
• Click Apply
You have just created a criterion to include only those data for male subjects. Now we create
one that includes only men with low lipid counts.
• From the Criteria pop-up menu, select New
• Double-click Gender
• Double-click =
• Double-click Male
• Click after the end of the definition
• Double-click
• Double-click Cholesterol
• Double-click ≤
• Click in the value bar when the Selected Value is 200
• Name this criterion Low Lipid Males
• Click Apply
• From the Criteria pop-up menu, select Men
Only those rows in the dataset with values for men are included. The rest have dimmed row
numbers.
• From the Criteria pop-up menu, select Low Lipid Males
Notice how the included rows change. If you were using this dataset in some analyses, the
tables and graphs in the view would change as you selected different criteria from the pop-up
menu.
Analyses
5
StatView provides two ways of creating statistical analyses (tables and graphs):
1. You can choose analyses from the analysis browser and use the variable browser to assign
variables to roles in the analyses.
2. You can select templates from the Analyze menu and assign variables to them. Templates
are preassembled sets of analysis results.
This chapter discusses the first method: using analysis and variable browsers to construct analyses directly. We discuss the second method in the next chapter, “Templates,” p. 161. That
chapter also shows how to use browsers to build your own templates for the statistics and
graphs you use most frequently.
Once you have created an analysis—either with browsers or with templates—you can change
its parameters or its variable assignments, adopt its variable assignments for another type of
analysis, and clone it into an analysis of different variables. You can split an analysis into separate analyses for each group in a nominal variable, or each subgroup formed by crossing several nominal variables. You can restrict your analyses to a subset of your dataset by including
and excluding rows or by defining criteria for which rows to include.
These techniques apply equally to results created with templates. A result is a result, no matter
how you create it. You can mix both templates and your own analyses in a single view.
Finally we discuss how to print views and how to save views as documents or templates.
Overview
There are several ways to build analyses in the view.
1. Create an empty analysis object with the analysis browser; then, use the variable browser to
assign variables to the empty object. (Or, assign variables first and then create the analysis.)
2. Adopt the variable assignments from one analysis to use with a new analysis you choose
from the analysis browser.
3. Clone a completed analysis to analyze new variables you choose from the variable browser.
5 Analyses Overview
Exercise
A simple exercise shows how this works. This diagram shows the basic sequence of steps.
Create an analysis
by choosing an
analysis from the
analysis browser
and a variable
from the variable
browser.
Adopt a variable
from the histogram
for a different
analysis from the
analysis browser.
Clone the box plot
with a different
variable from the
variable browser.
First we create a new analysis.
• Open Car Data from the Sample Data folder
• From the Analyze menu, select New View
• In the analysis browser under Frequency Distribution, select Histogram and click Create
Analysis
• Accept the default parameters for the histogram by clicking OK
• In the variable browser, select Weight and click Add
Shortcut You can instead select an analysis in the analysis browser, assign variables in the variable browser, and then click Create Analysis. For large datasets or complex computations,
waiting to click the Create Analysis button last can save time, because you don’t have to wait
for calculations after adding each variable.
Second, we adopt the variable assignment (Weight) from this histogram simply by leaving the
analysis selected while we create another analysis—this time a box plot.
• Be sure the histogram is still selected (has black selection handles); if not, click to select it
5 Analyses Overview
• In the analysis browser, select Box Plot and click Create Analysis
Third, we clone the box plot to analyze another variable, Horsepower.
• Be sure the box plot is still selected (has black selection handles); if not, click to select it
• In the variable browser, select Horsepower and Control-Shift (Windows) or CommandShift-click (Macintosh) the Add button
As you can see, result objects help you generate new analyses. They retain the information
used to create them: the analysis you chose, the variables you assigned, and even the parameters you specified (for example, in the histogram above we accepted the default parameters for
how to divide the variable into intervals, and we chose not to add a normal curve). When a
result (object) is selected, this information passes directly to your next analysis, saving steps
you would otherwise have to repeat.
Important All results know which kind of analysis produced them, which parameters were
set, and which variables were involved. If any result is selected when you create another result,
it passes that knowledge to the new result.
To prevent new results from learning such things from old results—i.e., to create completely
different analyses—you must be sure that existing results are not selected (do not have black
selection handles). Click in the empty space of a view to deselect objects.
Determine whether results are selected
Because information from a selected result passes to new results, it is always important to
know whether any results are selected. You can find out three ways:
1. Look at the objects. If they have black selection handles, they are selected. If they do not,
they are not selected.
Not selected
Selected
2. Look at the Results Selected note in the upper right corner of the view.
If no results are selected, this area is blank.
3. Look at the Results browser, and choose Show Selection
To open the Results browser, select Results Browser from the View menu (Windows) or
select Results from the Window menu (Macintosh)
5 Analyses Overview
Edit Analysis
Each analysis presents its own dialog box in which you set analysis parameters: choices you
make to control how the analysis is performed. For example, when you create a histogram,
you can specify how to divide the range into intervals, whether intervals show counts or
cumulative counts, etc. (Since histograms are only one possible result from a Frequency Distribution analysis, the dialog box also has options that apply to the other types of output.)
After the histogram is created, you can click Edit Analysis to return to this dialog box and
change the parameters.
• Select one or more analysis results
• Click Edit Analysis
• Change the parameter settings
• Click OK
The Edit Analysis dialog box for any analysis is the same one you see when you first create the
analysis. Some analyses have no parameters, so Edit Analysis has no effect.
If you change the parameters of an analysis, any other results associated with that analysis also
change. For example, if you create a frequency distribution analysis with both a table and a
histogram, changing the number of intervals of the frequency distribution updates both the
summary table and the histogram.
If you select more than one type of analysis and click Edit Analysis, you see a series of dialog
boxes, one for each type of analysis. Not all analyses have parameters you can change; for
these, Edit Analysis has no effect.
Each analysis has different parameters, so each has its own unique dialog box. For details on
any analysis’ parameters, see its chapter in StatView Reference. Also, take advantage of online
help; see “Help (Windows only),” p. 222 and “Hints window,” p. 222.
Shortcut Alt-double-clicking (Windows) or Option-double-clicking (Macintosh) an analysis
has the same effect as selecting it and clicking Edit Analysis. (Note that double-clicking an
5 Analyses Overview
analysis is the same as selecting it and clicking Edit Display. However, a view preference lets
you switch these shortcuts. See “View preferences,” p. 232.)
Edit Display
You can also edit how each result is displayed. While Edit Analysis changes the parameters—
and therefore the results—of an analysis, Edit Display changes how the results are presented.
For example, you can edit any table to have double borders and format numbers with only
one decimal place. Or, you can transpose a graph (flip it sideways) and give it a different axis
frame. Not all results’ displays can be edited.
• Select one or more analysis results
• Click Edit Display
• Change the display option settings
• Click OK
For more on editing graphs and tables, see “Customizing results,” p. 179.
Shortcut Double-clicking an analysis has the same effect as selecting it and clicking Edit Display. (Note that Alt-double-clicking (Windows) or Option-double-clicking (Macintosh) an
analysis is the same as selecting it and clicking Edit Analysis. However, a view preference lets
you switch these shortcuts. See “View preferences,” p. 232.)
Multiple and compound results
You can assign as many variables to an analysis as you want. The way StatView handles extra
variables varies according to the analysis.
For some analyses, assigning more variables changes simple graphs or tables into compound
tables or graphs that show results for all the variables at once. For example, assigning two variables to a Descriptive Statistics table breaks the table into a compound table with a row for
each variable. Similarly, assigning two variables to a box plot changes it to a compound box
plot, where a single graph frame contains boxes for each variable.
5 Analyses Overview
Descriptive Statistics
Mean
Std. Dev.
Std. Error
Count
Minimum
Maximum
# Missing
Weight
158.653
28.389
2.913
95
107.000
234.000
0
Cholesterol
191.232
35.674
3.660
95
115.000
285.000
0
Box Plot
300
280
260
240
220
200
180
160
140
120
100
Weight
Cholesterol
For other analyses, assigning more variables causes StatView to produce multiple analyses. For
example, assigning two variables to a frequency summary table produces two separate tables,
and assigning two variables to a histogram produces separate histograms for each group.
Frequency Distribution for Weight
Frequency Distribution for Cholesterol
From (≥)
To (<)
Count
From (≥)
To (<)
Count
107.000
119.700
8
115.000
132.000
4
119.700
132.400
13
132.000
149.000
6
132.400
145.100
10
149.000
166.000
11
145.100
157.800
16
166.000
183.000
19
157.800
170.500
12
183.000
200.000
21
170.500
183.200
18
200.000
217.000
15
183.200
195.900
11
217.000
234.000
10
195.900
208.600
3
234.000
251.000
2
208.600
221.300
2
251.000
268.000
4
221.300
234.000
2
268.000
285.000
3
Total
95
Total
95
Histogram
Histogram
22.5
20
18
20
16
14
17.5
15
12
10
Count
Count
8
10
7.5
6
4
5
2.5
2
0
100
12.5
0
120
140
160 180
Weight
200
220
240
100
140
180
220
Cholesterol
260
300
Similarly, you can assign as many Split By variables to an analysis as you want. The way StatView handles extra variables varies according to the analysis.
For some analyses, Split By changes simple tables or graphs into compound tables or graphs
that show results for all the groups at once. For example, adding a Split By variable to a
Descriptive Statistics table breaks the table into a compound table with a column for each
5 Analyses Overview
group. Similarly, adding a Split By variable to a box plot changes it to a compound box plot,
where a single graph frame contains boxes for each group.
Descriptive Statistics
Split By: Gender
Box Plot
Split By: Gender
Weight, Total
Weight, male
Weight, female
240
158.653
169.282
127.208
220
28.389
23.288
16.208
2.913
2.764
3.308
Std. Dev.
Std. Error
95
71
24
Minimum
107.000
107.000
110.000
Maximum
234.000
234.000
190.000
# Missing
0
0
0
Count
200
Units
Mean
180
male
160
female
140
120
100
Weight
For other analyses, Split By produces multiple tables or graphs for each group. For example,
adding a Split By variable to a frequency distribution analysis produces separate summary
tables and histograms for each group.
Count
Histogram
Split By: Gender
Cell: male
ANOVA Table for Weight
Split By: Gender
Cell: male
Alcohol use
DF
Sum of Squares
Mean Square
F-Value
P-Value
3
155.258
51.753
.092
.9644
67
37809.108
564.315
Residual
Model II estimate of between component variance: •
Alcohol use
3
785.596
140
180
Weight
220
Histogram
Split By: Gender
Cell: female
14
Mean Square
F-Value
P-Value
261.865
.996
.4148
20
5256.362
262.818
Residual
Model II estimate of between component variance: •
12
10
Count
ANOVA Table for Weight
Split By: Gender
Cell: female
DF Sum of Squares
20
18
16
14
12
10
8
6
4
2
0
100
8
6
4
2
0
100
140
180
Weight
220
For information on how each analysis uses split-by variables, see the StatView Reference chapter for that analysis.
5 Analyses Overview
Control recalculations
Analysis results and their data are dynamically linked, and results update immediately to
reflect any changes you make to the dataset. You can turn this link off temporarily by turning
off (unchecking) the Recalculate control in the upper left corner of the view window.
When recalculate is on (checked), all tables and graphs are recalculated when:
1. you change the value of a variable in use
2. you delete a variable in use
3. you add, delete, or clear data rows
4. you apply a criteria to the dataset
5. you add or remove variables
6. you change the sort order of the dataset (only affects certain analyses)
If you plan to make several changes to analyses or variables, it is a good idea to turn off recalculation. This way, you can make your changes without waiting for recalculation after each
change.
Force recalculation
Uncheck (turn off ) and then Control-click (Windows) or Command-click (Macintosh) the
Recalculate checkbox to force recalculation of all analyses. Ordinarily, turning on Recalculate
just recalculates those results whose data have changed.
Cancel calculations
Anytime the cursor is a spinning yin-yang
, you can cancel the operation by typing Esc
(Windows) or Command-Period (Macintosh).
Recalculate in the background
You can use other applications while your analysis calculates. StatView can perform calculation in the background, so you can switch to another application.
Placeholder results
StatView ensures that all results appearing on the screen are consistent with the current analyses, variables and state of the dataset. If recalculate is on and the analysis or data are changed,
all tables and graphs are updated. However, if recalculate is not on and the analysis or data
change, tables and graphs are replaced with placeholders until you turn recalculate on. A
placeholder is an empty graph or a box with an X in it.
5 Analyses Analysis windows
ANOVA Table for <None>
Assign a continuous and one or more nominal variables
using the variable browser Add button.
Analysis windows
In this section, we discuss the windows you will use when analyzing data in StatView: the view
window, the variable browser, and the results browser. Each of these windows has controls for
creating and changing analyses.
View window
StatView builds and displays analyses in a special view window. A view window is a living
document window for both graphs and text tables, with an analysis browser for creating analyses on the left and Edit Analysis and Edit Display buttons for modifying results along the
top. The document area scrolls both vertically and horizontally to provide as much room as
you need for a complete presentation.
For a self-guided tour of the view window:
• From the Analyze menu, select For Beginners/View Window Intro
Or, to open a new, empty view window:
• From the Analyze menu, select New View
(Or in any open dataset, double-click the empty rectangle before the first variable name.)
5 Analyses Analysis windows
Click to change
analysis parameters
Click to change
how results are
formatted
How many results
are selected
Click to turn
recalculation
on and off
Show/hide
variable
browser
(Mac only)
Analysis browser
Variable
browser
Message area
(Mac only)
Split-pane control
Selected analysis result
Most of the view window is an empty page area that fills with tables and graphs. This is where
you’ll build statistical analysis tables, draw graphs, and put together presentations. Think of
this part of the view window as your paper.
View window controls
The view window is a normal window. You can move it, resize it, and scroll it the same way as
any other window.
The Recalculate button at the top of the window lets you control how results recalculate, or
update to reflect changes in the dataset. Recalculate is checked on by default. If you want to
suspend calculations temporarily (perhaps you need to edit several variables and don’t want to
wait for dozens of tables and graphs to recalculate), just uncheck Recalculate—click it to turn
it off; see “Control recalculations,” p. 138.
The Edit Analysis button lets you change the parameters of an analysis; see “Edit Analysis,”
p. 134. The Edit Display button lets you change how results are formatted and drawn; see
“Edit Display,” p. 135.
Near the upper right corner, a note tells you whether any results are selected and, if so, how
many. If no results are selected, the area is blank. Knowing whether results are selected is
important when you are creating new analyses, because new analyses adopt variable assignments from any selected results; see “Determine whether results are selected,” p. 133.
The status bar (Windows) or the area underneath the analysis browser tells what StatView is
doing at the moment.
5 Analyses Analysis windows
View window preferences
You can set preferences to customize view windows to suit your style of working. See “View
preferences,” p. 232.
Analysis browser
StatView’s analyses are listed in the analysis browser. The analysis browser lets you create analyses.
The sigma
in the lower left corner of the view window is a split-pane control; click and
drag it to resize the browser pane. Double-click it or click and drag
all the way left to close
the analysis browser pane. When closed, the split-pane control is a right arrow
; doubleclick or click and drag
to reopen the browser pane. A preference lets you choose whether
the analysis browser pane is open or closed by default; see “Application preferences,” p. 225.
To create an analysis, just select the analysis from the analysis browser, then click the Create
Analysis button.
Analyses with triangle controls ( ) can produce more than one type of results or output. Click
a triangle to tip it downward ( ) and reveal a list of possible results. Some even have subcategories of possible results. The triangle controls let you show or hide levels of detail, as seen in
the picture below.
For example, Frequency Distribution analysis can produce summary tables, histograms, Zscore (standardized) histograms, and pie charts.
QC Subgroup Measurements is a more complex example. It has four categories of measurements (Xbar, R, S, and Statistics) and a Summary Table. Each category produces several types of results: line charts, needle charts, bar charts, point charts, and results tables.
Control-click (Windows) or Command-click (Macintosh) any triangle to tip all triangle controls up or down in one step.
5 Analyses Analysis windows
If you select the heading of an item with a triangle control, you get the default results for that
analysis. (To determine what those results are, just tip the triangle downward and see what is
highlighted when you select the heading.)
Show
In the middle part of the browser, a Show pop-up menu lets you select which types of analyses
to show in the browser. All analyses are shown by default.
Basic Statistics and Graphs Only simplify the most common analyses by reducing clutter.
They also speed the process by automatically using the default analysis parameters rather than
presenting a dialog box for you to specify parameters. You can still change the parameters with
Edit Analysis button; see “Edit Analysis,” p. 134.
Survival Analysis and Quality Control restricts your choices to those analyses, since specialists
using those analyses may not need StatView’s more general routines.
Order
An Order pop-up menu lets you choose how to sort analysis items in the scrolling list. Your
Order choice has no effect on how analyses are created.
5 Analyses Analysis windows
Create analysis
For multiple-results items (items with triangle controls), you can select any combination of
one or more results. Click an analysis heading (a triangle item) to select the default results for
that analysis; it doesn’t matter whether the list is shown or hidden. Shift-click or click and
drag to select several adjacent results items. Control-click (Windows) or Command-click
(Macintosh) to select several nonadjacent items.
You can even select items from completely different types of analyses, e.g., you could Controlclick (Windows) or Command-click (Macintosh) to select Histogram from Frequency Distribution and Line Chart from QC Subgroup Measurements/Xbar Statistics.
To perform an analysis, select it in the browser and click the Create Analysis button, or double-click the item in the browser. Most selections are followed by a dialog box in which you
set parameters for the analysis; if you know you want the default parameters, you can bypass
the dialog box by Right-clicking (Windows) or Control-clicking (Macintosh) Create analysis.
Another way to bypass the dialog box is to choose Basic Statistics or Graphs Only from the
Show pop-up menu, but doing so also limits you to those analyses.
Variable browser
Variables in the dataset are listed in the variable browser, a floating window that appears
alongside both dataset and view windows. When you are working in a view window, the variable browser allows you to:
1. Choose variables from open datasets and open new datasets
2. Assign variables to analyses (and specify what role they should play in analyses)
3. Remove variables from analyses
4. Split analyses into separate results for each group in a nominal variable
To show or hide the variable browser, select Variable Browser from the View menu (Windows)
or select Variables from the Window menu, or click the button in the upper right corner of
the dataset and view windows(Macintosh). A preference lets you choose whether the variable
browser is shown or hidden by default; see “Application preferences,” p. 225.
In the middle part of the browser, a Data pop-up menu lets you select among open datasets or
open other datasets. Click on the menu to choose another open dataset, and choose Other to
locate and open a previously saved dataset.
The Order pop-up menu lets you choose how to sort variable names in the scrolling list:
Dataset order
Alphabetical
Variable class
Usage
The order in which variables appear in the dataset’s columns (left to right).
Alphanumeric order by variable name.
Grouped in order by continuous, nominal, informative.
Ordered first by variable use in analyses and then in alphabetical order. When a dataset window
is active, ordering is only alphabetical.
Variables are shown in a scrolling list. Icons next to variable names indicate their data class:
for continuous,
for nominal, and
for informative.
5 Analyses Analysis windows
Compact variables are preceded by a triangle and followed by a
symbol. Click the triangle to tip it downward
and display the category of the variable. These categories are
marked nominal .
Assignment buttons
Each analysis requires certain variables before it can calculate. Notes below empty (placeholder) results tell you what is expected. For example, a box plot coaches you, “To complete
this analysis, assign at least one continuous variable using the variable browser Add Button.”
StatView Reference chapters detail the variable requirements of each analysis.
Add assigns variables to analyses and Remove removes them.
The buttons at the top of the variable browser change according to the analysis you choose.
For most analyses, you use these three buttons:
For most analyses, StatView determines each variable’s role from its class—continuous or
nominal. For example, you add both continuous and nominal variables to an , and
StatView knows that the continuous variable should be the dependent variable and the nominal variables are independent variables (or “factors”). StatView’s ability to assign roles automatically is one of the many benefits of setting attributes for each variable in the dataset; see
“Set attributes,” p. 58.)
However, some analyses have buttons that assign variables to specific roles in an analysis. For
example, for bivariate plots, you need to assign an X Variable for the horizontal axis and a Y
Variable for the vertical axis. For regressions, you need to specify a Dependent variable and
one or more Independent variables. Otherwise, StatView would have no way of knowing
what you intend. These and other specialized buttons are discussed for each type of analysis in
StatView Reference.
Split By shows results separately for each group of a nominal variable, or each subgroup
defined by two or more nominal variables. You can split any analysis. For example, if you have
a Gender variable that divides your dataset into male and female groups, assigning Gender as
a Split By variable in a box plot produces separate boxes for males and females (in many cases
it also produces results for the total sample). You can Remove a Split By assignment to stop
analyzing groups separately.
Assign variables
All variable browser buttons work the same way.
• Select one or more variables
• Click the appropriate button to assign the variable(s)
5 Analyses Analysis windows
Shift-click or click and drag to select several adjacent variables. Control-click (Windows) or
Command-click (Macintosh) to select several nonadjacent variables.
Shortcut Double-click a variable to assign it to the default role—this is equivalent to clicking
the topmost button, whatever that may be. See the Shortcuts card for tips on making other
types of variable assignments.
Usage markers
When a variable is assigned to an analysis, and that analysis is selected in the view, a usage
marker in the variable browser indicates which role the variable is playing. For example, this
browser shows that in the selected analysis, Age is the Y variable, Weight is the X variable, and
the analysis is split by Gender groups. Other variables have no usage markers because they are
not involved in the analysis.
If you select a different result in the view, the usage markers change accordingly. Following are
some common usage markers you might see:
X
Y
G
S
F
C
T
#
!
A continuous variable in any analysis
An independent variable or covariate in a regression
An X (horizontal axis) variable in a bivariate plot
A nominal variable in a frequency distribution or descriptive statistics
A dependent variable in a regression or ANOVA
A Y (vertical axis) variable in a bivariate plot
A grouping or factor variable
A Split By variable
An independent variable or covariate forced into a stepwise regression
An item count variable for QC P/NP charts
A unit count variable for QC C/U charts
A censor variable for Survival analysis
A time to event variable for Survival analysis
A stratification variable for Survival analysis
A variable playing multiple roles (usually because more than one result is selected)
If no result is selected in the view, any usage markers indicate any preassignments for a pending analysis (where you select an analysis in the analysis browser and then assign variables in
the variable browser before clicking Create Analysis in the analysis browser).
Number of variables
Some analyses can handle any number of variables. Some accept only a specific number. Still
others can handle multiple variables with one usage, but only a single variable of another
5 Analyses Analysis windows
usage. The number of variables an analysis requires is the determining factor in what happens
when new variables are assigned to an existing analysis.
For example, an unpaired t-test requires a single continuous and a single nominal grouping
variable. What happens if you assign another continuous variable to the analysis? A new, separate analysis is generated that performs a t-test on the new continuous variable using the
groups identified by the original nominal variable. The result appears as an additional table in
the view. On the other hand, a descriptive statistics table and a correlation matrix analyze
multiple variables. As you assign new variables, the tables simply expand to include the new
variables. For examples of how this works, see “Multiple and compound results,” p. 135
To understand what will happen when you assign new variables to an analysis, you need to
know the number and class of variables it requires. See the StatView Reference chapter for the
data requirements of each analysis.
You can force additional variables to appear in their own tables or graphs by cloning an analysis (see below) rather than simply adding variables to an existing analysis.
Clone analyses
One shortcut for creating subsequent analyses is to clone an analysis: to make another set of
results using the same analysis parameters but different variables. To clone an analysis:
• Select a result in the view
• Select one or more variables in the browser
• Control-Shift-click (Windows) or Command-Shift-click (Macintosh) the appropriate
browser button, such as Add
An example of this appears earlier in the chapter; see “Exercise,” p. 132.
Shortcut Control-Shift-double-click (Windows) or Command-Shift-double-click (Macintosh) variables to clone an analysis with default (topmost button) roles.
Analyze variables in several datasets
The variable browser’s Data pop-up menu lets you choose among several open datasets. Using
this pop-up menu, you can assign variables from several different datasets to a single analysis.
If you assign variables of different lengths (i.e., if you assign variables from datasets with different numbers of rows), StatView does the following to compensate:
• Variables with fewer values are padded with missing values at the end so that all variables
have the same number of cases.
• The excluded rows are the union of the excluded rows for the datasets which contain the
variables. For example if variable A comes from dataset A with rows 3 and 4 excluded, and
variable B comes from dataset B with rows 7 and 8 excluded, rows 3, 4, 7 and 8 will be
excluded from each analysis that uses both variables.
Two analyses are exceptions to these rules—descriptive statistics and one sample analyses
(only if you do not have split-by variables assigned). For these two analyses, no missing values
5 Analyses Analysis windows
are padded and the exclusion applies to each variable individually. If you do have split-by variables assigned, they calculate the same as other analyses.
Results browser
Results in the view window are listed in the results browser, a floating window that appears
alongside the view window. If a view contains a great deal of output or you are working with
several views at once, the results browser makes it easy to keep track of what you have done,
what is currently selected and where particular results are located. The results browser allows
you to:
1. Choose open views and open saved views
2. Locate graphs and tables by location, analysis, or variable
3. Select results one or many at a time
The results browser is closed by default. To open it (if it is closed) or bring it to the front (if it
is hidden), select Results Browser from the View menu (Windows) or select Results from the
Window menu (Macintosh). A preference lets you choose whether the results browser is
shown or hidden by default; see “Application preferences,” p. 225.
The View pop-up menu lets you select among open views or open other views. The name of
the currently active view is shown. Click on the menu to choose another open view, and
choose Other to locate and open a previously saved view.
The Order pop-up menu lets you choose how to sort result names in the scrolling list. By
Analysis sorts results according to the type of analysis. By location sorts results by page, in
order of appearance in the view. By variable sorts results according to the variables assigned to
them (analyses involving more than one variable are listed multiple times in the browser—
once for each variable). Changing browser order has no effect on the order of objects in the
view itself.
Results are grouped under headings appropriate to the Order chosen. Each heading has a triangle control ( ). Click a triangle to tip it upward ( ) and hide its results. Control-click
5 Analyses Analysis windows
(Windows) or Command-click (Macintosh) any triangle to tip all triangle controls up or
down in one step.
The Show pop-up menu lets you choose whether to list all results in a view or only selected
results. Since selection plays such an important role in the analysis process, knowing what is
currently selected helps you understand what will happen when you create a new analysis or
assign or remove variables.
Select results
The Select button at the top of the results browser lets you select and scroll to results in a view.
• Select one or more result titles
• Click Select
Shift-click or click and drag to select several adjacent results. Control-click (Windows) or
Command-click (Macintosh) to select nonadjacent results. Selecting a heading is equivalent
to selecting all the items under the heading.
Shortcut Double-clicking an item is the same as selecting it and clicking the Select button.
When you click Select in the results browser, the view window scrolls to that result (or the first
result, if you selected several) and selects the object or objects, and you can work with them all
at once—clone them, change their variables, delete them, or whatever you need to do.Thus,
the results browser can speed up your editing.
For example, if you have several dozen results involving a key variable, and you want to make
them all green, you could use the results browser ordered by variable, select the heading for
that variable, click Select, and then select green for the foreground color in the Draw palette
to change them all at once.
Also, in a view with many tables and graphs, it might not be easy to find the one you want.
The results browser lets you move to the result you want quickly.
View (Windows only) and Window menu
The View and Window menus (Windows) or Window menu (Macintosh) help you keep
track of all the windows you have open and makes it easy to switch between them.
(Both Macintosh and Windows) The Window menu lists all open datasets, views, and any
open Formula, Series, Random Numbers, Recode, and Create Criteria dialog boxes in front to
back order. The active view or dataset window has a check mark next to it. The Window
menu also has standard commands for managing windows.
(Windows only) The View menu lists:
1. Tool Bar
2. Status Bar
3. Show/Hide Browsers
4. Variable Browser
5 Analyses Analyze subsets
5. Results Browser
6. Draw Palette
7. Hints Window
(Macintosh only) The Window menu also lists:
1. The variable browser and results browser
2. The Hints window
3. The Clipboard
Analyze subsets
Thus far, we’ve discussed how to analyze all the rows of your dataset at once. We’ve shown
how to use Split By to get separate calculations for each group of a nominal variable, or each
subgroup from several nominal variables, and we’ve shown a variety of other analysis controls
in StatView’s view windows.
Sometimes, you want even more control over the data used in analyses. For example, rather
than analyzing males and females in Lipid Data separately, you might want to analyze just
males. StatView’s dataset windows offer still more ways to focus analyses by controlling the
data that go into them.
1. Sort the dataset according to the values of one or more variables. See “Sort data,” p. 116.
For example, if you draw a line plot connecting Weight values graphed against Age values,
you’re likely to get a chaotic mess of criss-crossed lines; however, if you sort the data
according to increasing Age values, the lines fall into place and become meaningful.
Line Chart
240
220
220
200
200
180
160
Weight
Weight
Line Chart
240
180
160
140
140
120
120
100
100
17.5 22.5 27.5 32.5 37.5 42.5
Age
17.5 22.5 27.5 32.5 37.5 42.5
Age
2. Use Include Row and/or Exclude Row to control on a row-by-row basis which rows are
used in calculations. See “Include and exclude rows,” p. 108. For example, the line chart
above has a few outliers with extreme Age values; these commands let you remove those
rows from analyses without removing them from your dataset.
5 Analyses Exercise
Line Chart
Row exclusion: Lipid Data
Line Chart
240
240
220
220
200
180
Weight
Weight
200
160
140
180
160
140
120
120
100
100
17.5 22.5 27.5 32.5 37.5 42.5
Age
18 20 22 24 26 28 30 32
Age
3. Use Criteria to choose by logical expression which rows are used in calculations. See “Create criteria,” p. 124. For example, you might instead restrict your line chart to cases whose
Weight values are under 200 pounds by applying a criterion “Weight ≤ 200.” Again, you
remove rows from analyses but not from the dataset itself. (You can also combine Include/
Exclude and Criteria rules.)
Line Chart
Inclusion criteria: Weight ≤ 200
from Lipid Data
Line Chart
Row exclusion: Lipid Data
240
220
180
Weight
Weight
200
160
140
120
100
18 20 22 24 26 28 30 32
Age
200
190
180
170
160
150
140
130
120
110
100
20
24
28
Age
32
36
Exercise
The exercise below demonstrates the interaction of the analysis and variable browsers and
analysis objects.
Create an analysis, then assign variables
Creating an analysis from scratch is a simple, two step process involving the variable and analysis browsers. To create any analysis, you must select an item from the analysis browser and
assign variables to it from the variable browser. You can use the browsers in either order. Try
both and use whichever feels more comfortable.
• Open Car Data from the Sample Data folder
• From the Analyze menu, select New View
5 Analyses Exercise
First, select an analysis from the analysis browser, then assign variables from the variable
browser. If you are interested in the degree of correlation among several continuous variables
in this dataset, a good place to begin your analysis is with a correlation matrix.
• From the analysis browser, select Correlation/Covariance and click Create Analysis
• Accept the default parameters: click OK
An empty table placeholder (X-box) appears and says that you still need to specify variables.
• In the variable browser, click and drag to select Turning Circle, Displacement, Horsepower, and Gas Tank Size
• Click Add
The analysis calculates and the table updates to show its results.
Correlation Matrix
Turning Circle
Displacement
Horsepower
Turning Circle
1.000
.747
.482
Gas Tank Size
.618
Displacement
.747
1.000
.764
.719
Horsepower
.482
.764
1.000
.666
Gas Tank Size
.618
.719
116 observations were used in this computation.
.666
1.000
Assign variables, then create an analysis
This time you assign variables first, and then create the analysis. (We add another result to the
same view.)
• Make sure that no results are selected (have black selection handles) by clicking in empty
space of the view
• In the analysis browser, select Regression
Notice that the variable browser automatically replaces the Add button with Independent and
Dependent buttons. You use these buttons to assign variables and specify variable usage simultaneously.
5 Analyses Exercise
• In the variable browser, select Displacement and click Independent
• Select Horsepower and click Dependent
X and Y usage markers in the variable browser now show the roles Displacement and Horsepower will play.
• In the analysis browser, click Create Analysis
• Accept the default parameter settings: click OK
The default regression output appears in the view.
Regression Summary
Horsepower vs. Displacement
116
Count
0
Num. Missing
R
.764
R Squared
.584
Adjusted R Squared
.580
25.796
RMS Residual
ANOVA Table
Horsepower vs. Displacement
DF
Sum of Squares
Mean Square
F-Value
P-Value
1
106510.675
106510.675
160.061
<.0001
Residual
114
75859.765
665.437
Total
115
182370.440
Regression
Regression Coefficients
Horsepower vs. Displacement
Coefficient Std. Error
Intercept
Displacement
Std. Coeff.
t-Value
P-Value
50.444
6.744
50.444
7.480
<.0001
.504
.040
.764
12.652
<.0001
Add more results
You generated only the default results for a simple regression. Regression has a triangle next to
it in the analysis browser, indicating that several tables and graphs are available as output. In
this exercise, you add additional output from the regression analysis to the default results.
• Click the triangle next to Regression
Now you can see all the output available for a regression analysis. There are nine results in the
indented list. We also want to see a regression plot for the analysis.
• Make sure at least one of the regression results is still selected (has black handles); if not,
click one to select it
• In the analysis browser, double-click Regression Plot
A scattergram of the two variables and the calculated regression line appears.
5 Analyses Exercise
Regression Plot
300
Horsepower
275
250
225
200
175
150
125
100
75
50
50
100
150
200 250 300
Displacement
Y = 50.444 + .504 * X; R^2 = .584
350
400
Because you had regression results selected, StatView already knew the appropriate analysis
parameters and variable assignments you wanted. (If you double-click Regression Plot with no
results selected, you have to set analysis parameters again and assign variables again.)
Some analysts like to see every possible result for an analysis all at once—for example, regression and tables, plots, interaction plots, residuals, and confidence intervals. Others prefer to look at just a few key results and then decide whether the analysis deserves further
examination; they might try several different variable combinations before finding a satisfactory model and only then will they start looking at residual statistics. StatView accommodates
either style of work. Start by choosing as many or as few results you want, and then add more
results when you want them. By selecting one of the results, you save yourself the trouble of
rebuilding the model.
Add variables to existing analyses
Many analyses can incorporate multiple variables in a single analysis. For example, if you
select the correlation analysis created above, you can add more variables to the matrix.
• Select the correlation matrix by clicking on it
• In the variable browser, select Weight and click Add
The correlation matrix immediately recalculates:
Correlation Matrix
Turning Circle
Displacement
Horsepower
Gas Tank Size
Turning Circle
1.000
.747
.482
.618
Weight
.752
Displacement
.747
1.000
.764
.719
.830
Horsepower
.482
.764
1.000
.666
.707
Gas Tank Size
.618
.719
.666
1.000
.847
Weight
.752
.830
116 observations were used in this computation.
.707
.847
1.000
Other analyses compute new results for additional variables. These new results automatically
retain the analysis parameters but produce separate results. The simple regression analysis created above is such an analysis.
Select any of the three regression tables or the regression plot you created above. The next
variable you assign will use these same analysis parameters.
5 Analyses Exercise
• In the variable browser, select Weight and click Independent
A completely new regression analysis uses Horsepower as the dependent variable and Weight
as the new independent variable. The same four regression results are created (Regression
Summary, Table, Regression Coefficients and Regression Plot), and the same parameter choices are used. Here we show just the new summary table:
Regression Summary
Horsepower vs. Weight
116
Count
0
Num. Missing
R
.707
R Squared
.499
.495
Adjusted R Squared
RMS Residual
28.299
Selecting an existing result saved you the trouble of reassigning Horsepower as the dependent
variable and clicking OK in the Regression dialog box. Any selected analysis forwards information to a new analysis.
Adopt variables for new analyses
The variables in a selected result can be used in a completely different analysis, just as they can
be used to create additional output for the same analysis.
• Click to select the correlation matrix previously created
• In the analysis browser, double-click Frequency Distribution
• Accept the default dialog box settings: click OK
The default output for frequency distribution appears in the view. (Your results appear in a
single vertical column in the view. We rearrange them to conserve space.)
Histogram
Histogram
35
30
30
25
20
Count
Count
25
20
15
15
10
10
5
5
0
0
50
100
150
200 250 300
Displacement
350
400
1500
2000
2500
3000 3500
Weight
4000
4500
5 Analyses Exercise
Histogram
Histogram
35
40
30
35
30
Count
Count
25
20
15
25
20
15
10
10
5
5
0
0
30
32
34
36 38 40 42
Turning Circle
44
46
48
8
10
12
14
16 18 20 22
Gas Tank Size
24
26
28
Histogram
35
30
Count
25
20
15
10
5
0
50
100
150
200
Horsepower
250
300
Any selected results forward their variable assignments to the next results you create.
Split analyses by groups
You can break results down by groups of a nominal variable without reorganizing your
dataset. (Note that StatView also allows you to set criteria to restrict analyses to a subset of
your dataset. See “Create criteria,” p. 124.)
To try this, you can split the correlation matrix into separate matrices for each country.
• Click to select the correlation matrix previously created
• In the variable browser, select Country and click Split By
Now you have a separate correlation matrix for each country represented in the dataset:
Correlation Matrix
Split By: Country
Cell: Japan
Turning Circle
Displacement
Horsepower
Gas Tank Size
Turning Circle
1.000
.760
.649
.752
Weight
.738
Displacement
.760
1.000
.944
.932
.920
Horsepower
.649
.944
1.000
.864
.822
Gas Tank Size
.752
.932
.864
1.000
.908
.738
.920
Weight
30 observations were used in this computation.
.822
.908
1.000
5 Analyses Save a view
Correlation Matrix
Split By: Country
Cell: Other
Turning Circle
Displacement
Horsepower
Gas Tank Size
Weight
Turning Circle
1.000
.448
.313
.564
.603
Displacement
.448
1.000
.845
.791
.859
Horsepower
.313
.845
1.000
.768
.748
Gas Tank Size
.564
.791
.768
1.000
.786
.603
.859
Weight
37 observations were used in this computation.
.748
.786
1.000
Correlation Matrix
Split By: Country
Cell: USA
Turning Circle
Displacement
Horsepower
Gas Tank Size
Weight
Turning Circle
1.000
.679
.450
.581
.765
Displacement
.679
1.000
.801
.658
.793
Horsepower
.450
.801
1.000
.432
.545
Gas Tank Size
.581
.658
.432
1.000
.845
.765
.793
Weight
49 observations were used in this computation.
.545
.845
1.000
This is how easy it is to calculate statistics for different subgroups of your data. It is a flexible
and interactive process, and it follows the way you think. Best of all, you do not need to touch
your dataset.
Save a view
You can save a view at any time:
• From the File menu, select Save or Save As
• Specify a filename and folder location
• Choose a file format
• Click Save
As a view
When you save a view in the default format (*.SVV for Windows or StatView View for Macintosh), you save all aspects of your work — the analyses, the variables used, anything you
have drawn, etc. When you reopen the view using Open from the File menu, you can resume
your work right where you left off.
If you save a view whose dataset is untitled (because you have not saved it), StatView cannot
find the dataset when you later reopen the view. For that reason, StatView warns that you
should save the dataset first.
If you close a dataset whose variables are used in open views, those variables are removed from
the results. StatView warns you and gives you a chance to cancel closing the dataset.
5 Analyses Reopen your work
As a template
You can use any view you save as a template. See the next chapter, “Templates,” p. 161.
If you plan to use the view as a template, consider saving it in the Template folder (Windows)
or StatView Templates folder (Macintosh) or a subfolder of that folder. You can then access it
from the Analyze menu. A view stored elsewhere can be opened as a template through Open
View As from the File menu; see “Assign different variables,” p. 158.
To save disk space, you might prefer not to save calculated results with a view you plan to use
as a template. See “View preferences,” p. 232.
As a text file
You can save views as plain text files for use with word processors such as Microsoft
Word. Text files contain all the text and data from tables but only the titles and notes of
graphs.
As a PICT file
(Macintosh only) You can also save views as files for use in drawing or painting applications, as well as some word processing applications. Such files contain a representation of
all the information in the view (tables, graphs, all text and drawn objects).
As a WMF or EMF file
(Windows only) You can also save views as or files for use in drawing or painting
applications, as well as some word processing applications. Such files contain a metafile representation of all the information in the view (tables, graphs, all text and drawn objects).
Reopen your work
You can reopen any view you save.
• From the File menu, select either Open or Open View As (see below)
• Select a view file
• Click Open
Use original variables
To open your work exactly as you left it, select Open from the File menu. Open reopens the
view in its own window, with its original variable assignments.
5 Analyses Reopen your work
Assign different variables
To open a view with different variables, either from the same dataset or from a new dataset,
select Open View As from the File menu.
When you open a view using Open View As, StatView asks whether to use the original dataset
or a different dataset, whether to add the view’s results to a new view window or the current
(topmost) view window, and whether to offer you a chance to Assign Variables differently:
Open original dataset This choice opens the dataset(s) the view uses. Usually StatView can
find the original dataset, even if it has been renamed or moved. If not, StatView asks you to
find the dataset.
Be applied to different dataset(s) This choice lets you select a different dataset, so you can
use the view as a template for different data.
Create new view This choice displays the results in a new view window.
Add to top view This choice places the results at the end of the topmost (current) view window, after all existing tables and graphs. If no views are open, this choice is dimmed.
Always show Assign Variables dialog box Check (turn on) this option when you want to use
the view as a template for different data.
From the original dataset
If you want to use the original dataset but make different variable assignments, check Always
show the Assign Variables dialog box (turn the option on). The dialog box shows the original
assignments. Drag variables back and forth between the assignment slots and the scrolling list
until you have the assignments you want.
5 Analyses Print a view
From different datasets
You can assign variables from different datasets in one of two ways.
The first method is to choose Be applied to different dataset. StatView asks you to open the
dataset and then presents the Assign Variables dialog box.
The second method is easier when you want to use variables from several datasets including
the original one. Choose Open original dataset, but check Always show Assign Variables dialog box. You can then use the Data pop-up menu in the Assign Variables dialog box to select
different datasets.
The Assign Variables dialog box lists all the variables in the dataset, and all the variable slots
that need to be filled for this view. You assign variables from the variables list into slots by
dragging or double-clicking. See the next chapter, “Templates,” p. 161.
Print a view
You can print the contents of a view. Before you print, scroll through the view to see whether
any tables, graphs, or drawn objects fall on a page break. Page breaks are shown by red hashed
lines. You can avoid splitting results across page breaks by fixing them yourself or by having
StatView fix them for you:
• From the Layout menu, select Clean Up Items
• Click Clean Up
Another thing to check is the number and configuration of pages in your document. Use
Drawing Size from the Layout menu to set the size and shape of the overall document. This
determines how many pages will be printed.
Check Print and copy lines at 1/4 width in the View Preferences dialog box to reduce all line
widths to approximately 1/4 of their specified size. See “View preferences,” p. 232. This
option affects only printed and copied results; there is no discernible difference on the screen.
5 Analyses Print a view
To print a view:
• From the File menu, select Print
Templates
6
StatView view documents—collections of completed analyses and annotations—are two documents in one:
1. You can reopen a view and its original dataset(s) to resume analysis where you left off. You
can continue working with analysis objects (tables or graphs), which are still linked to their
dataset. You can add and remove variables, clone and adopt to build new results, and use
drawing and formatting tools to put results together in a complete presentation.
2. You can open a view and apply it as a template to a different dataset. A template is a collection of one or more analyses and all their data links, parameter settings, layout, and all
other visible characteristics except variable assignments. You simply assign new variables to
use throughout the template, and StatView computes all the results at once.
Views saved in the Template folder (Windows) or StatView Templates folder (Macintosh) are
listed in the Analyze menu for fast, easy use as templates.
How does opening a view differ from applying a template?
Opening a view is the same as opening a document created in any program. In Excel, you
reopen a document and resume working on your spreadsheet. In Word, you reopen your document and resume writing and editing. In StatView, you reopen a view and continue working
with your analysis results.
Applying a template is more like opening a stationery document in Word or Excel, where the
page is blank, but certain things such as your company name and address, margins, headers,
and font choices are set up. But StatView goes even further: a template sets up the analyses,
formatting, annotations, and everything for any number of analyses and variables. For example, you could do an entire drug study, save the view, and then reopen it with data for a different drug. You specify which new variable is like each old variable, and then StatView redoes
the whole analysis with those substitutions.
How can I use templates?
Because a template is simply a view document that is opened a certain way, building a template is simple: you just build a view the usual way, make any formatting changes and annotations you want, and save it. If you want to use it from the Analyze menu, save it in the
Template folder (Windows) or StatView Templates folder (Macintosh). To use a view saved in
other location as a template, select Open View As from the File menu.
6 Templates Use templates
Templates let you do several things:
1. Create any analysis without using the analysis browser or variable browser. StatView has
numerous pre-built templates that perform the analyses in the analysis browser and many
other special combinations of analyses suited for particular tasks. You select templates from
an hierarchical Analyze menu. You can add your own templates to the menu, and you can
reorganize the hierarchy of the Analyze menu to suit your needs.
2. Combine different types of analyses into sets you can compute all at once. For example,
you might build your own template combining QC charts, histograms, cell plots, and your
own special model. Then you can use the template to do these analyses with each
new dataset.
3. Replay complex sequences of analyses, graphs, annotations, and formatting choices consistently and effortlessly. If you have to produce the same sales report each month, build the
report once, save the view, and reuse it as a template with each month’s new sales numbers.
4. Harness the expertise of a consultant. You can take a problem to a specialist who can
assemble the appropriate analyses in a template that you can use over and over again.
5. Build analyses that others can repeat error-free, without your assistance. All they need to
learn is how to open the template and assign the right variables.
Use templates
Templates reduce analyses of any complexity to two simple steps: you select a template, then
you assign variables. StatView does the rest.
If a view window is the active (topmost) window, template results appear in the window
below (after) any previous results. If some other type of window is topmost or if no view is
open, template results automatically appear in a new view window.
• If you want to add results to an existing view, make that view the active window
• From the Analyze menu, select a template
• Drag variables from the browser on the right into the assignment slots on the left
(If necessary, use the Data pop-up menu to open a dataset or choose among open datasets.)
• Click OK
Assign variables to templates
After you select a template, you must assign variables. Fill each assignment slot in the left side
of the Assign Variables dialog box by dragging a variable from the browser on the right.
6 Templates Use templates
Click and drag to assign variables to slots
Choose or open a dataset
Sort variables in
the scrolling list
Variable assignment slots
Variable browser
Variable browser
Use the Data pop-up menu to select among open datasets. The name of the currently active
dataset is shown. Click on the menu to choose another open dataset, and choose Other to
locate and open a previously saved dataset.
Use the Order pop-up menu to choose how to sort variable names in the scrolling list:
Dataset order
Alphabetical
Variable class
Usage
The order in which variables appear in the dataset’s columns (left to right).
Alphabetical order by variable name, with nonalphabetic names first.
Grouped in order by continuous, nominal, and informative.
Variables already mapped to assignment slots appear at the top; remaining variables appear in
alphabetical order.
Variables appear in a scrolling list. Icons next to variable names indicate their data class:
for continuous and
for nominal. (Informative ( ) variables are not listed, because you
cannot assign informative variables to analyses or templates.)
Compact variables have triangle controls and
symbols. Click the triangle to tip it downward
and display the category of the variable, marked nominal .
An M usage marker appears next to any variable that has been mapped to an assignment slot.
Template list
Labeled slots in the Template list show the various roles variables play in the template. Hints
for each slot tell how the variable(s) are used.
6 Templates Use templates
Icons to the left of each slot indicate which class the variable(s) must have:
for continuous,
for nominal, and for compact. Since markers in the variable browser show which class
each variable has, it is easy to match variables to slots correctly. You cannot put a nominal variable in a continuous slot, or a continuous variable in a nominal slot. You can drag entire compact variables into compact variable slots, and you can drag the nominal and continuous
portions of compact variables into any slots calling for nominal and continuous variables.
Template slots are flexible:
1. You do not need to use every slot; some can remain empty.
2. You can assign as many variables to each slot as you want. Each slot grows to accommodate
as many variables as you assign. StatView produces multiple or compound results as
needed to analyze all the variables you assign; for details, see “Multiple and compound
results,” p. 135.
Assign variables to slots
You can assign variables to slots in any of several ways.
1. Click and drag a variable from the list into a slot.
2. Double-click a variable to assign it to the highlighted slot. Then, the next slot is selected
and you can double-click to assign variables to it.
3. Control-double-click (Windows) or Command-double-click (Macintosh) to assign several
variables to the current (selected) slot.
4. Click and drag to move a variable from one slot to another.
Press the Tab key to move the selection from the currently highlighted slot to the next slot
immediately below it. Press Shift-Tab to move the selection to the previous slot.
Remove variables from slots
If you assign a variable to the wrong slot by mistake, you can remove it three ways:
1. Click the variable in the slot and press Delete.
2. Drag the variable from the slot back to the variable list.
3. Double-click the variable in its slot.
Manipulate results
When you finish assigning variables and click OK, results appear in a view. If the active (topmost) window is a view, results appear in that view after existing results. If the top window is
not a view, results appear in a new, untitled view.
If the Recalculate box in the view is unchecked (turned off ), empty graph and table placeholders (X-boxes) appear rather than completed results. When you are ready to see your
results, check the Recalculate box (turn it on). See “Control recalculations,” p. 138.
6 Templates Use templates
You can manipulate template results the same way as any other results. See the previous chapter, “Analyses,” p. 131, for instructions on using analysis and variable browsers and the Edit
Display and Edit Analysis buttons. Also see the next two chapters, “Customizing results,”
p. 179, and “Drawing and layout,” p. 203. For instructions on working with each type of
analysis and its results, see its chapter in StatView Reference.
Exercise
In this exercise, you apply one of StatView’s installed templates to generate a basic set of
descriptive statistics from these data, then continue by adding results from a regression template.
Please close any datasets or views before starting this exercise.
• From the Analyze menu, select Descriptive Statistics and then Descriptive Statistics
(Point to Descriptive Statistics, and then select Descriptive Statistics from the submenu.)
• Open Car Data from the Sample Data folder
• Double-click to assign Weight, Turning Circle, Displacement, and Horsepower
The slot has a
marker, indicating that you can only assign continuous variables to it. Try
double-clicking a nominal variable ( ). An alert tells you that the class of the variable is
incorrect for that particular slot.
• Click OK
6 Templates Use templates
A new view shows this table of basic descriptive statistics:
Descriptive Statistics
Mean
Std. Dev.
Std. Error
Count
Minimum
Maximum
2957.629
535.664
49.735
116
1695.000
4285.000
0
38.586
3.132
.291
116
32.000
47.000
0
Displacement
158.310
60.409
5.609
116
61.000
350.000
0
Horsepower
130.198
39.822
3.697
116
55.000
278.000
0
Weight
Turning Circle
# Missing
Now we use a regression template to determine whether a linear relationship exists between
gas tank size and the weight of the car. Because a dataset is already open, we won’t need to
choose a new one.
• From the Analyze menu, select Regression/Regression--Simple
• Drag Gas Tank Size to the Dependent slot
• Drag Weight to the Independent slot
• Click OK
Our view is still active, so the regression results appear underneath the table we already had.
6 Templates Manage templates
Regression Summary
Gas Tank Size vs. Weight
116
Count
0
Num. Missing
R
.847
R Squared
.717
.715
Adjusted R Squared
RMS Residual
1.643
ANOVA Table
Gas Tank Size vs. Weight
DF Sum of Squares
Mean Square
F-Value
P-Value
1
780.014
780.014
288.914
<.0001
Residual
114
307.779
2.700
Total
115
1087.793
Regression
Regression Coefficients
Gas Tank Size vs. Weight
Coefficient
Std. Error
Std. Coeff.
t-Value
1.858
.860
1.858
2.161
.0328
.005
2.860E-4
.847
16.997
<.0001
Intercept
Weight
P-Value
Regression Plot
28
Gas Tank Size
26
24
22
20
18
16
14
12
10
8
1500
2000
2500
3000 3500
Weight
Y = 1.858 + .005 * X; R^2 = .717
4000
4500
Now we have a Regression Summary, an Table, a Regression Coefficients table, and a
Regression Plot.
Manage templates
The Analyze menu contains an hierarchical menu of templates. These are prebuilt templates
for producing most of StatView’s analyses and graphs, organized according to type of analysis.
6 Templates Manage templates
This menu is dynamic—you can rearrange it simply by rearranging the contents of the Template folder (Windows) or StatView Templates folder (Macintosh). This flexibility lets you
organize your StatView templates for the way you like to work. The default organization of
the menu reflects the way templates are installed in folders within the main folder:
Rearrange templates
You may change the Analyze menu hierarchy simply by rearranging the organization of files
and folders inside the Template folder (Windows) or StatView Templates folder (Macintosh).
• Rearrange how templates are stored within the Template folder (Windows) or StatView
Templates folder (Macintosh)
Use the Explorer or File Manager (Windows) or Finder (Macintosh) to create a new folder
and file organization. You may nest folders insider each other, up to five folders deep.
• From the Analyze menu, select Rebuild Template List
Group related templates into folders according to categories that make sense to you. You
might want to rearrange templates according to the type of data they use, or according to the
types of tests they perform, or perhaps according to your current projects. You can add more
folders, add more templates, put folders inside folders (as many as five layers deep), and drag
files or entire folders to the Recycle bin (Windows) or trash (Macintosh). You can even use
aliases (Macintosh only) to point to template files (but not folders) stored elsewhere.
6 Templates Build templates
When saving your own views, you might want to use the Create New Folder button (Windows) or the New Folder button (Macintosh) in the Save dialog box to create project folders
inside the Template folder (Windows) or StatView Templates folder (Macintosh).
You should not move the template folder itself. This main folder should remain at the top
level of the StatView folder. If you move or rename the template folder, StatView asks you to
locate it the next time you use a template. StatView then remembers the new location and the
new name.
If you change the name or location of the template folder, the only way to restore its default
name and location is to discard the StatView Library file. StatView builds a new Library containing the default folder name and location. Note that you lose all preferences you have set,
as these are saved in the Library file.
Update the Analyze menu
Any time you add new templates or rearrange templates within the main template folder, you
must update the Analyze menu:
• From the Analyze menu, select Rebuild Template List
StatView examines the folder structure inside the template folder and then builds an hierarchical menu. Folders and files are alphabetized.
Build templates
You are not limited to templates provided with StatView. You can also make custom templates
of your own. The previous chapter, “Analyses,” p. 131, discusses how you can create your own
analyses from scratch and save them as templates. The next chapter, “Customizing results,”
p. 179, shows how to use Edit Display to format table and graph results.
Once you are skilled in these areas of StatView, you are ready to design basic templates. If you
want to design templates for reports and presentations, you should also become familiar with
the topics in the chapter “Drawing and layout,” p. 203.
If you need help with the parameters and variable requirements for a particular analysis, see its
chapter in StatView Reference.
Template tips
When you create a view to reuse as a template, there are several things to take into consideration. Some characteristics that are helpful in working views get in the way in templates, and
vice versa.
6 Templates Build templates
Give variables general, meaningful names
You use the Assign Variables dialog box to assign variables from any dataset to the slots in the
template. The templates list contains separate slots for each variable used in the view you save
as a template. Therefore, when you create your template, consider giving your variables
generic names that could apply to any dataset rather than names that have a meaning only in
a specific dataset. The picture below shows both:
Generic variable names
Specific variable names
Slots take their names from the variables used to create the template, so you may want to
rename the variables in your dataset while you’re creating a template. You might create a
dummy dataset with generic names you can use for template construction. Variables used to
build templates needn’t contain data.
When the Assign Variables dialog box first appears, it pre-assigns any variables to slots with
matching names. So, if you are repeating an analysis on datasets with the same variable names,
it is worthwhile to use specific variable names in the template. This saves you the trouble of
dragging variables into slots and removes still another opportunity for error.
Do not save results
You can save disk space by not saving results with views you plan to use as templates. In View
Preferences, uncheck Save analysis results with view (turn the option off ). The option takes
effect for the next view you create; it does not change a view already created. Remember to
turn this option back on after creating templates so that your regular views retain their results.
See “View preferences,” p. 232.
Turn Recalculate off
You may want to disable calculation when adding results from several templates to one view
so you do not have to wait for each set of results to calculate before you can add results from
another template. See “Control recalculations,” p. 138.
Format information
In a few cases, formatting information saved with a template does not apply to all output:
1. For analyses that generate multiple results (rather than compound results) for additional
variables, formatting information applies only to the number of tables or graphs present
when the template was created. See “Multiple and compound results,” p. 135.
2. For analyses that generate multiple results (rather than compound results) for the groups of
Split By variables, formatting information is retained only for the first group of the Split By
variable. See “Multiple and compound results,” p. 135.
6 Templates Build templates
Note that many default formatting instructions can be globally set using View, Table and
Graph preferences.
Change templates
The easiest way to change a template is to Open it from the File menu, make your changes,
and save it again. To avoid renaming the variable assignment slots, either use the original
dataset or create a new dataset with the same generic names.
Exercise
This exercise shows you how to build two simple templates. One generates a customized
graph, and the other generates a custom analysis with special parameter settings.
Customize a graph
If you are writing an article for publication, you may want all your scattergrams to have
exactly the same format. You can customize a single scattergram, save it in the Template folder
(Windows) or StatView Templates folder (Macintosh), and use the template to create all the
scattergrams. There is no need to repeat all the formatting steps for each new scattergram.
First, change one of the preference settings so the template you create uses less hard disk space.
• From the Manage menu, select Preferences
• Select View and click Modify
• Uncheck Save analysis results with view
• Click OK
• Click Done
When you use a scattergram template, the Assign Variables dialog box contains slots for the
variables assigned to each axis. We want these slots to have generic names, so we’ll use variables named X variable and Y variable.
• Open Tree Data from the Sample Data folder
• Rename Trunk Girth to be X Variable
(Click the variable name cell, type the new name, and press Tab.)
• Rename Weight to be Y Variable
(Don’t forget to press Enter or Return.)
• From the Analyze menu, select New View
• In the analysis browser under Bivariate Plots, select Scattergram and click Create Analysis
• Click OK to accept the default parameters
• In the variable browser, select X Variable and click the X Variable button
• In the variable browser, select Y Variable and click the Y Variable button
The scattergram appears in the view.
6 Templates Build templates
Scattergram
Y Variable
2750
2500
2250
2000
1750
1500
1250
1000
750
500
250
0
150
200 250 300 350 400 450 500 550
X Variable
Now we remove the title, customize X and Y axis lengths, change the font and size of the axis
values and labels, and change the position of major and minor tick marks.
• Make sure the graph is selected and click Edit Display
• Uncheck Show title (turn the option off )
• Specify a Vertical measurement: 2 inches
• Specify a Horizontal measurement: 2 inches
• Click OK
• Shift-click to select the axis labels and scales
• In the Text menu, change Font to Helvetica (or your favorite) and change Size to 12
6 Templates Build templates
Y Variable
2500
2000
1500
1000
500
0
150
250
350 450
X Variable
550
• Shift-click to select the X and Y scales
• Click Edit Display
• Click More Choices and use pop-up menus to select major and minor tick marks that
straddle axes:
• Click OK and repeat these choices for the second axis
• Click in the empty space of the view to deselect the graph
6 Templates Build templates
2500
Y Variable
2000
1500
1000
500
0
150
250
350
450
550
X Variable
You have finished customizing the graph and are ready to save this view as a template.
• From the File menu, select Save
• Specify a filename: My Scattergram
• Choose some location in the Template folder (Windows) or StatView Templates folder
(Macintosh)
• Close both the view and the dataset (do not save changes)
You are now ready to use this template to format a new scattergram. You can use this template
with any dataset.
• Open Car Data from the Sample Data folder
• From the Analyze menu, select Rebuild Template List
• From the Analyze menu, select My Scattergram
(If you chose a subfolder in the Template folder (Windows) or StatView Templates folder
(Macintosh), the template appears under that heading in the hierarchical Analyze menu.)
• Drag Turning Circle to the X Variable slot
• Drag Displacement to the Y Variable slot
• Click OK
A new view opens, and a scattergram with the same format appears.
6 Templates Build templates
400
Displacement
350
300
250
200
150
100
50
30
34
38 42
Turning Circle
46
• Close this view and Car Data (do not save changes)
In view preferences, you might want to restore the option Save analysis results with view.
Modify an existing template
A template lets you name and save all the parameters and output of a particular analysis. You
can modify parameters and add results to any of the templates that ship with StatView. You
can also start from scratch and build your own analysis template with the parameters and
results you desire.
We will modify the Regression--Simple template that ships with StatView. That template
includes a scattergram with a regression line, and we want a template that also draws 95%
confidence bands for the regression line. Also, we want to add a plot of residuals vs. fitted values. Again, we want to use generic variable names.
• From the File menu, select New
• Name the first variable Dependent
(Click the Input Column cell, type Dependent, and press Enter or Return)
• Name the second variable Independent
• From the Analyze menu, select Regression/Regression--Simple
• Drag Dependent to the Dependent Variable slot and Independent to the Independent
Variable slot
• Click OK
The view window fills with a number of empty analyses. Notes beneath the placeholders read,
“There were not enough observations to compute this result.” That’s not surprising; our
dataset has no cases. It doesn’t matter, though; we can still make our changes and save a new
template.
• Make sure at least one of the empty results is still selected
• Click Edit Analysis
• Click More Choices
• Check Slope (turn the option on) for Plot confidence bands
• Click OK
6 Templates Build templates
• In the analysis browser under Regression, double-click Residuals vs. Fitted
We’ve changed the regression plot to include confidence bands, and we’ve added a plot of
residuals vs. fitted values. Now, we can save our view as a new template.
• From the File menu, select Save
• Specify a filename: Regression--Simple, conf
• Choose a location inside the Template folder (Windows) or StatView Templates folder
(Macintosh) (perhaps the Regression folder)
• Click Save
StatView warns that you haven’t saved your dataset. Since you don’t intend to use the empty
dataset again, that doesn’t matter.
• Click OK
• Close both the view and the dataset
You are now ready to use this template with any dataset to perform a simple regression.
• From the Analyze menu, select Rebuild Template List
• From the Analyze menu, select Regression/Regression--Simple
• Open Car Data from the Sample Data folder
• Drag Gas Tank Size to the Dependent slot
• Drag Weight to the Independent slot
• Click OK
6 Templates Build templates
A new view with simple regression results appears. Note that the regression plot includes confidence bands, and we also have a plot of residuals against fitted values. We’ve rearranged the
results to fit the page.
ANOVA Table
Gas Tank Size vs. Weight
Regression Summary
Gas Tank Size vs. Weight
116
Count
0
Num. Missing
R
.847
R Squared
.717
Adjusted R Squared
.715
RMS Residual
DF
Sum of Squares
Mean Square
F-Value
P-Value
1
780.014
780.014
288.914
<.0001
Residual
114
307.779
2.700
Total
115
1087.793
Regression
1.643
Regression Coefficients
Gas Tank Size vs. Weight
Coefficient Std. Error
Intercept
Weight
Std. Coeff.
t-Value
1.858
.860
1.858
2.161
.0328
.005
2.860E-4
.847
16.997
<.0001
Residuals vs. Fitted
28
26
6
24
22
4
Residual Gas Tank Size
Gas Tank Size
Regression Plot
95% Confidence Bands
20
18
16
14
12
10
8
1500
P-Value
2
0
-2
-4
-6
2000
2500
3000 3500
Weight
Y = 1.858 + .005 * X; R^2 = .717
4000
4500
8
10
12
14
16
18
20
Fitted Gas Tank Size
22
24
In view preferences, you might want to restore the option Save analysis results with view.
6 Templates Build templates
Customizing results
7
StatView includes all the features of a graphing program, with numerous features enabling
you to enhance the clarity and visual impact of your graphs and tables.
1. You can set global preferences that establish defaults for every graph and table you create.
Before producing any results for a presentation, you should set preferences to suit your
most general needs. For example, if you are preparing a journal article, you should set preferences to match your results to that journal’s style guidelines.
2. Edit Display lets you change tables and graphs individually. Many options duplicate those
that you can set globally with preferences, so Edit Display provides a way to override your
default settings for specific graphs. Other options for controlling features specific to certain
result types or data situations are unique to Edit Display, because they are options that can
be modified only locally, one result at a time.
3. Draw tools let you change lines, colors, fill patterns, etc. used in graphs and tables.
4. Finally, a complete palette of drawing and text tools lets you modify, annotate, and amplify
the information shown in graphs and tables. Layout tools help you arrange results on the
pages of a presentation. StatView’s drawing and layout tools are discussed in the next chapter, “Drawing and layout,” p. 203.
This chapter discusses preferences briefly and then shows how to use Edit Display and Draw
tools to customize individual tables and graphs. For graphs, you can change number formats,
axis bounds, tick marks, interval widths, labels and symbols, grid lines, fills, colors, patterns,
line widths and text formats. You can also transpose the horizontal and vertical axes. For
tables, you can change number formats, borders, row heights, fonts, sizes, and styles, lines and
thicknesses, colors, and pen patterns. You can also transpose rows and columns.
Preferences
Preferences let you establish global settings for graphs and tables. Your preference settings
determine the defaults used for every graph and table you create. By contrast, Edit Display lets
you change these and other settings for any single graph or table you select.
Before producing any results for a presentation, you should set preferences to suit your most
general needs. You should establish through preferences the usual measurements, fonts, and
colors you expect to see. You should decide in advance whether you want square or rectangular graphs, big points or little points, differing colors or fill patterns. You should decide
7 Customizing results Edit Display dialog boxes
whether you like tables with borders or without, single- or double-spacing, few or many decimal places. If you are planning to publish your results, you should set preferences to match
any style rules your publication may have established.
Preferences are discussed in detail in a later chapter, “Tips and shortcuts,” p. 221. Here we
merely call your attention to the choices available.
See “Graph preferences,” p. 228, to learn how to set default height and width, numeric formatting for scales, axis frames (how many edges are drawn around a graph), point size and
types (e.g., circles, squares, diamonds, stars, etc.), fill patterns (blank, solid, hatched, checkered, etc.), and colors. Also choose how compound graphs (see “Multiple and compound
results,” p. 135) should distinguish between variables or groups: by different point types, by
different colors, or by different fill patterns.
See “Table preferences,” p. 231, to learn how to set numeric formatting, borders, and linespacing.
See “View preferences,” p. 232, to learn how to control for both tables and graphs the default
font and the thickness of lines in printed output.
Edit Display dialog boxes
The Edit Display button at the top of the view window lets you customize any graph or table
in a view window:
• Click to select the graph or table
• Click Edit Display
Shortcut Double-clicking a result has the same effect as selecting it and clicking Edit Display.
Note that both Right-double-clicking and Alt-double-clicking (Windows) or Option-doubleclicking (Macintosh) an analysis is the same as selecting it and clicking Edit Analysis. However, a view preference lets you switch these shortcuts. See “View preferences,” p. 232.
• Choose the options you want
• Click Show to preview your changes
• Click OK to apply your changes
7 Customizing results Clipboard commands
Subsequent sections, “Graphs,” p. 183 and “Tables,” p. 197, discuss these dialog boxes in
detail.
Preview changes
Both formatting dialog boxes have a Show button which lets you preview formatting changes
as you make them. After choosing options, click Show to see the effects of the options on the
graph or table in the view. The dialog box is still open for you to adjust your choices. Click
OK to implement the changes, or click Cancel to abandon all changes, close the dialog box,
and return the graph or table to its original state.
Undo changes
Any formatting changes you make, whether through Edit Display, drawing tools, or layout
tools, are reversible. If you make a mistake, choose Undo immediately to return your graph to
its previous state. You can only Undo the single most recent action. To undo earlier actions,
you must retrace your steps—e.g., return to Edit Display and restore previous settings.
Clipboard commands
You can use standard Edit menu commands with tables and graphs. However, please note that
any StatView table or graph copied into the clipboard becomes a static picture when pasted
back into a view. This picture is not a dynamic object. You can no longer use Edit Display or
Edit Analysis, change variable assignments, or update results with criteria, inclusion, or Recalculate. You should not use clipboard commands to move objects around.
7 Customizing results Clipboard commands
Recalculate controls all the objects in a view at once, so using static pictures is a handy way to
maintain a view of data in several states at once. If you want to compare results with criteria or
inclusion against those without (for example), Copy and Paste the results as a picture. Next,
change the dynamic object (the original results). Finally, compare the two results side by side.
(An alternative is to extract a subset to a different dataset and create results with variables from
that smaller dataset alongside results from the full dataset’s variables. Note that StatView lets
you work in many views and datasets at once.)
Cut and Copy
Cut removes a selected object or component (a table or graph, or a part of one) from the view
and places a copy into the clipboard. Copy places a copy of a selected object or component in
the clipboard but leaves the original in the view unharmed.
If you mistakenly Cut a graph title or legend, you can restore it with Edit Display’s Show title
and Show legend options.
Duplicate
Duplicate places a second copy of a selected object or component (a table or graph, or a part
of one) in the view, below and to the right of the original. Duplicate is equivalent to using
Copy and then Paste.
Clear
Clear removes a selected object or component (a table or graph, or a part of one) from the
view but does not place a copy in the clipboard. You can select and clear the following components: titles, entire legends (not parts of legends), axis labels, and notes.
If you select and clear a plot (the representation of a variable or group within a graph), axis,
whole graph, or whole table, the entire table or graph is cleared.
If you mistakenly Clear a graph title or legend, you can restore it with Edit Display’s Show
title and Show legend options.
Paste
Paste places the contents of the clipboard in the view, at the point of the most recent mouse
click. If the most recent mouse click location is no longer visible, Paste centers the pasted
object(s) in the visible portion of the view.
If you resize a pasted picture, you can restore its original size by double-clicking the object.
7 Customizing results Graphs
Graphs
You can edit many aspects of a graph’s appearance. Some formatting changes apply to an
entire graph, others to particular components of a graph. To make changes to an entire graph,
you select the entire graph and click Edit Display. To change a component of a graph, you
select just that component and click Edit Display. To make still other changes, you select
graphs or components and work with Draw tools.
This diagram identifies many major graph components.
Title
Major ticks
Minor ticks
Graph frame (axes)
Scattergram
150
Plot points
Legend symbols
140
130
Plot lines
Axis labels
Y Variables
120
Legend text
110
Systolic BP
100
Diastolic BP
90
80
Grid lines
70
60
50
Axis values
100
120
140
160 180
Weight
200
220
240
Notes
Systolic BP = 117.445 + .038 * Weight; R^2 = .025
Diastolic BP = 70.272 + .047 * Weight; R^2 = .019
This table explains each component:
Title
Frame
Interior
X axis
Y axis
Axis values
Tick marks
Axis labels
Plot
Grid lines
Plotted lines
Legend
The text above a graph that identifies the analysis, variables, and criteria or row inclusion in
effect.
The set of axes that border a graph—a closed rectangle or L-shape
The area inside a graph but outside the plot
The horizontal or X-axis (abscissa)
The vertical or Y-axis (ordinate)
The numbers or words along an axis that label points on the axis
Small hatch marks along an axis that identify intervals of the scale
Text below the X axis and left of the Y axis that indicate what variable or quantity is plotted
on that axis
The points, bars, lines, or boxes that represent a single variable or group in a graph
Vertical and horizontal dotted lines at each major tick interval
Regression lines, confidence bands, or normal distribution curves superimposed on a graph
Symbols and text identifying how variables or groups are depicted in the graph
7 Customizing results Graphs
Notes
Reference lines
Text below a graph, such as a regression equation or a message explaining why the graph is
empty
Lines indicating means, standard deviations, or other computed values
Select graphs
With a whole graph selected you can:
1. Change thickness, color, and pen pattern for all lines in the graph.
2. Change the color of the whole graph.
3. Add a color or fill to the graph’s interior.
4. Use Edit Display to change the graph as a whole.
If the cursor isn’t an arrow, first choose the selection tool from the Draw palette.
To select an entire graph, click directly on the frame or interior of a graph. Do not click a bar,
point, line, text item, or any other component.
To select several graphs, Shift-click them, or click and drag a marquee around them.
You can also use the Results Browser to select objects; see “Select results,” p. 148.
Black handles show that a graph is selected. You can also check the Result Selected note in the
upper right corner of the view, or use Show Selection in the Results browser:
7 Customizing results Graphs
Select components
If the cursor isn’t an arrow, first choose the selection tool from the Draw palette.
To select a component, click that component directly. Shift-click to select several components
at once.
Black selection handles show when certain types of components are selected, while dotted
lines show selection for other types of components.
This table shows how to select each graph component and which tool to use to change an
aspect of the component.
Component
How to select it
Tool
Font, size, style, alignment, and angle of text items (titles,
legend text, axis labels, axis values, notes)
Color of text items
Axis frame type
Line width, pen type, color of graph frame
Color and fill of graph interior
Line width, pen type, color
Bounds, intervals, scales, numeric format
Length, width, and position of tick marks
Whether and where grid lines appear
Line width, pen type, fill pattern, point type, point size, color
of a plot (box, bar, point, or line)
Thickness, pen type, and color of plotted lines
Click the text
Text menu
Click
Click
Click
Click
Click
Click
Click
Click
Click
Draw palette
Edit Display
Draw palette
Draw palette
Draw palette
Edit Display
Edit Display
Edit Display
Draw palette
the text
the frame
the frame
blank space inside the graph
the axis numbers
the axis numbers
the axis numbers
the axis numbers
the plot (box, bar, point, or line)
Click the line
Draw palette
7 Customizing results Graphs
Orientation and frame of legend
Click anywhere in the legend
Point type, point size, fill pattern, and color of legend symbols Click the symbol
Edit Display
Draw palette
Overlay graphs
You can superimpose a graph on another to create a double layer graph. Select one graph and
drag it into position over the other graph. If one plot hides another, adjust the plot’s fill
attributes and consider using Move to Front and Move to Back commands from the Layout
menu. Also consider deleting or making invisible redundant scales, axes, etc.
Resize graphs
To resize any graph, select the whole graph, then click and drag one of its selection handles to
a new location. Drag a corner handle to resize a graph’s height and width at once; drag a side
handle to change height or width alone.
All components of the graph move to stay in the same relative location to the graph.
Move graphs or components
You can move an entire graph and most components of a graph: the title, legend, axis, axis
labels, notes. If you move the axis, it is constrained to the respective horizontal or vertical
direction. If you move the graph as a whole, all components move together and stay in the
same positions relative to each other.
• Click and drag the graph or component
Do not drag selection handles; dragging handles resizes rather than moves the graph or component.
Shortcut You can use cursor arrow keys to move any selected graph or graph component. If
the grid is turned on, each keystroke moves the object one grid unit in the direction of the
arrow. If the grid is turned off, each keystroke moves the object one screen pixel. In this context, “grid” refers to an underlying grid in the view window itself, not the grid lines that can
be used to show tick intervals inside a graph’s interior; for more information, see “Turn Grid
On/Off,” p. 217.
7 Customizing results Graphs
Change text items
You can change the font, size, style, and color of any text item in a graph: graph titles, notes,
axis labels, axis values, and legend text. You can also change the alignment and orientation of
any text item except in legends. You can change components individually or all at once.
To format or edit a text component, select only that component. To select several text items,
Shift-click to select them at the same time. Then, use Text menu items to change the font,
size, style, justification (left-alignment, right-alignment, or centering), and rotation. Use the
pen color tool in the Draw palette to change the color of text components. Use the text tool in
the Draw palette to edit the contents of a text item.
You cannot edit axis scale values with text tools.
If you use the text tool to edit any text, that text no longer updates when the graph updates.
Change overall structures
While StatView displays many different graphs, they share a common overall structure, which
can be changed with the Graph dialog box. You can choose a graph frame, transpose two axes,
hide or show titles and legends, and set the height and width for any graph. To use the Graph
dialog box:
• Select the entire graph (click its frame)
• Click Edit Display
Any changes you make in this dialog box apply only to the selected graph. If you want to
change several graphs, select them all at once. Click Edit Display for a series of Graph dialog
boxes, one for each graph, in the order in which you selected the graphs.
Frame Choose from three different styles in the pop-up menu.
7 Customizing results Graphs
Flip horizontal and vertical axes Check this option (turn it on) to transpose the horizontal
and vertical axes, changing the orientation of the graph.
Y
X
X
Y
Bounds include extra lines Check this option (turn it on) to ensure that default axis bounds
do not exclude calculated lines (such as the three standard deviation lines in univariate charts).
Show legend Check this box to display the graph legend.
Show title Check this box to include titles showing analysis type, variables assigned, and criteria/row inclusion in effect.
Dimensions Specify the horizontal and vertical dimensions in inches, centimeters, picas or
points.
Numbers Choose a number of decimal places for numbers in axis scales (see “Decimal
places,” p. 80). Check Always have leading digit to include a leading zero in fractional values
(e.g., 0.25).
Choose box styles
You can choose from among four different box styles for box plots:
• Inside a box plot, click the plot (the actual box-and-whisker)
• Click Edit Display
The default style uses regular boxes and includes outliers as points. The second style uses regular boxes but excludes outliers. The third style uses boxes with notches showing the 95%
confidence interval for the median and includes outliers. The fourth choice uses notched
boxes but excludes outliers.
Connect or separate lines for univariate line plots
You can choose whether all points in univariate line plot are connected with a single line, or
with a separate line for each group. Examples of both are shown below; the default is separate
line segments for each group.
• Inside a univariate or cell line chart, click the plot (one of the lines)
• Click Edit Display
• Turn the option on or off
7 Customizing results Graphs
• Click OK
Univariate Line Chart
Split By: Gender
Univariate Line Chart
Split By: Gender
240
240
220
220
200
180
male
160
female
Weight
Weight
200
180
male
160
female
140
140
120
120
100
100
Observations
Observations
Connect or separate lines for cell line charts
You can choose whether all points in cell line charts are connected with a single line, or with a
separate line for each variable. Examples of both are shown below; the default is to connect
the variables.
• Inside a cell line chart, click the plot (one of the lines)
• Click Edit Display
Cell Line Chart
Grouping Variable(s): Smoking History
220
210
210
200
200
190
180
160
150
150
Weight: pipes
170
160
Weight-3yr: no
Weight-3yr: quit
Weight-3yr: cigarettes
Weight-3yr: pipes
170
Weight: pipes
180
Weight-3yr: no
Weight-3yr: quit
Weight-3yr: cigarettes
Weight-3yr: pipes
190
Weight: no
Weight: quit
Weight: cigarettes
Cell Mean
220
Weight: no
Weight: quit
Weight: cigarettes
Cell Mean
Cell Line Chart
Grouping Variable(s): Smoking History
7 Customizing results Graphs
Change axes
StatView uses three different types of axes: a numeric axis for displaying continuous measurements, a cell axis for displaying information on groups or subgroups, and an ordinal axis for
displaying the order of a point in a dataset. Axis values appear at major tick intervals along
both vertical and horizontal axes.
1500
2000
2500
3000
3500
4000
4500
Numeric axis
Small
Sporty Compact Medium
Large
Cell axis
0
20
40
60
80
100
Ordinal axis
Bivariate plots can have either numeric or cell axes for both the X and Y axes. Univariate plots
always have an ordinal X axis and can have either a numeric or cell Y axis. Frequency distributions, percentile plots, and comparison percentiles always have two numeric axes. Cell plots
and box plots have a cell X axis and a numeric Y axis. Pie charts have no visible axes.
Each type of axis has its own dialog box. To edit an axis:
• Click axis numbers to select an axis
• Click Edit Display
• Choose options
• Click OK
Axis values can be rotated using commands Rotate Right and Rotate Left from the Text menu.
Note that long axis values are legible only when they are perpendicular to the axis.
Numeric axes
StatView offers two dialog boxes for numeric axes: one with fewer choices and one with more
choices.
7 Customizing results Graphs
Bounds Specify maximum and minimum values.Check Include Zero if you want StatView
to calculate its own bounds but ensure that zero is included in those bounds.
Use the lock controls to choose whether these values should be locked ( ) so that any recalculations of the graph (for changing data conditions) do not change them, or unlocked ( ) so
that recalculations do change the values as needed. If you specify a value, that value is locked
by default. Click a lock to toggle from locked to unlocked, or vice versa.
Major and minor intervals Specify how wide the interval between major tick marks should
be, and specify how many minor intervals you want between major tick marks. For example,
the following axis has major intervals of 500 and 2 minor intervals within each major interval:
1500
2000
2500
3000
3500
4000
4500
When you first create a graph, intervals default to widths appropriate to the bounds. If the
axis bounds change, major and minor interval widths automatically update. You change the
intervals by typing in the text boxes. The Fewer choices dialog box has a pop-up suggesting
“good” major interval widths.
Use the lock controls to choose whether these values should be locked ( ) so that any recalculations of the graph (for changing data conditions) do not change them, or unlocked ( ) so
that recalculations do change the values as needed. If you specify a value, that value is locked
by default. Click a lock to toggle from locked to unlocked, or vice versa.
Tick marks Choose the placement for major and minor tick marks from pop-up menus.
Specify a length in points for major and minor tick marks. It is common to make major tick
marks longer than minor tick marks. Specify the width (thickness) for major and minor tick
mark lines in pixels.
7 Customizing results Graphs
Scale Axis scales are linear by default, or you can choose logarithmic scales of base e, 10, or 2.
Grid lines Choose whether to display grid lines at major or minor ticks, at zero, or not show
any grid lines. Horizontal and vertical grid lines can help show where values fall.
Numbers Choose numeric format and number of decimal places (see “Format,” p. 79 and
“Decimal places,” p. 80). Check Ensure leading digit to include a leading zero in fractional
values (e.g., 0.25). (To change formatting for a date/time axis, change the display format for
the date/time variable in the dataset attribute pane.)
Cell axes
Your formatting choices for cell axes are not as extensive as for numeric axes. You can change
the style of tick marks, the position of axis values, how many of them are shown, and determine whether or not to show grid lines. There is only one dialog box for cell axes. To make
any of these changes, select the axis by clicking on its values and click the Edit Display button.
The following dialog box appears:
Axes for nominal variables are inherently different from numeric axes since a cell axis does not
define a range of values but instead lists the labels of groups or the names of variables. Cell
axes use tick marks to identify different groups. The tick marks for a cell axis have no relation
to a numeric width.
Small
Sporty Compact Medium
Large
Tick marks Choose the placement for tick marks.
Stagger Choose the stagger pattern that makes axis labels most legible.
Show Choose how many labels to show.
Below are some of the possibilities:
7 Customizing results Graphs
For more information on how StatView orders the groups in a cell axis, see “How does StatView use ordering in nominal variables?,” p. 238, and “How can I reorder category variables?,” p. 238.
Ordinal axes
Ordinal axes are used only for univariate plots. By default, ordinal axes have no tick marks nor
scale values. By default, ordinal axes show the order of points in a dataset only by relative position. Check Show ticks and values (turn the option on) if you want to see a numeric scale for
row numbers. (Note: to select an ordinal axis, click carefully just below the axis line, away
from the Observations label.)
7 Customizing results Graphs
Univariate Line Chart
Univariate Line Chart
Large
Medium
Medium
Type
Type
Large
Compact
Compact
Sporty
Sporty
Small
Small
0
20
40
60
80
Observations
Observations
100
Change legends
Compound graphs—graphs that depict several variables or groups within a single axis
frame—have legends that identify how each variable or group is distinguished. (See “Multiple
and compound results,” p. 135.) A legend serves as a key to the graph, and you can use it to
change how lines, points, bars, etc. are drawn in the interior of a graph.
To change the overall format of a legend:
• Click the legend to select it
• Click Edit Display
Layout Choose vertical, horizontal, or two-column orientation for the legend. Each are
shown below:
Small
Sporty
Compact
Medium
Small
Sporty
Compact
Medium
Large
Small
Sporty
Compact
Medium
Large
Large
Frame Check options on and off to control whether and how the legend is framed. Possibilities are shown below.
7 Customizing results Graphs
Japan
Japan
Japan
Japan
Japan
Other
Other
Other
Other
Other
USA
USA
USA
USA
USA
Once you change the layout and frame style of the legend, you may want to move it below or
above the graph (particularly with horizontal legends). You can move it by selecting the legend
and dragging it to a new location anywhere in the view.
You can change legend text items with the text tool in the Draw palette and commands from
the Text menu. If you cut or clear a legend, you can bring it back by selecting the entire graph
and clicking Edit Display.
Change plotting symbols
For a scattergram, you can change point style, size, and color. For a bar chart, pie chart or box
plot, you can change fill patterns, colors, lines, and pen patterns. For a line chart you can
modify lines and points. There are two ways to select the plotting symbols of a graph.
1. Select the interior of the graph
2. Select symbols in the legend
(You can change all the symbols by selecting the entire legend. For example, you could
change every single point to a particular size or color)
Once a plot is selected, use Draw palette tools to make changes.
Point styles and sizes
Points are the plotting symbols in scattergrams, line charts, percentile plots, compare percentile plots and in box plots. To change a point, select it and choose a type and/or size from the
Draw palette. Choose the null symbol (ø) for invisible points, which are often desirable for
line plots.
Fill patterns, pen patterns, and line thicknesses
The Draw palette’s fill, pen, and line tools are handy for calling attention to items in graphs.
You can thicken lines and fill them with patterns, or add patterns to the plotted shapes within
a graph. You can also add a fill to the interior of a graph, making the plot itself stand out
more.
7 Customizing results Graphs
Fill You can add a pattern to the interior of an entire graph, or to bars in a bar chart and histogram, slices of a pie chart, and boxes of a box plot. To add a fill to a graph’s interior, select
the entire graph and choose a pattern from the fill pop-up menu.
Pen pattern For any line, you can choose from sixteen pen-type choices. All lines default to a
solid pattern. Pen patterns have greater visual impact with thicker lines. (PostScript printers
interpret some patterns as halftones, so a single pixel screen line may print as a gray line with
some patterns.)
Line thickness You can change the thickness for the following lines: a graph frame, tick
marks, boxes in a plot, pie chart divisions, bars in a chart, the simple and polynomial regression lines and the normal curve of a histogram. All line widths default to a single point line.
(To print hairlines, see “View preferences,” p. 232.) Choose the top, dotted line for invisible
lines.
Change colors
Pop-up menus at the bottom of the Draw palette let you choose colors for the pen, fill, and
background (the empty view area outside graphs). For each component you select, the pen
and fill color menus change different aspects of the graph.
Pen
Fill
Background
Control-click (Windows) or Command-click (Macintosh) to select both pen and fill colors at
once.
7 Customizing results Tables
The table below describes the components that can be selected and what each pop-up menu
controls.
Component
How to select
Pen color changes
Fill color changes
Frame
Click the frame
The interior of the graph
Axis
Click an axis value
Plot
Regression line or
normal curve
Legend symbol
Legend as a whole
Click the plot
Click the line
All lines connected to the frame
including axis tick marks
Axis values, axis line, tick marks,
grid lines
Points or lines in the plot
The line
Click the symbol
Click the interior of
the legend
Click the text
Points or lines in the plot
The fill of bars, boxes or pies
Points or lines in the plot, legend The fill of bars, boxes or pies
text
The text
Any text item
The fill of bars, boxes or pies
Tables
You can edit many aspects of a table’s appearance. Some formatting changes apply to the
entire table, others to a particular component of a table. To make changes to an entire table,
you select the entire table and click Edit Display. To make other changes, you select tables or
components and work with Draw palette tools.
This diagram identifies major table components:
Title
Column labels
Borders
Correlation Matrix
Row labels
Weight
Cholesterol
Triglycerides
HDL
LDL
Weight
1.000
-.022
.108
-.276
.057
Cholesterol
-.022
1.000
.401
.352
.962
.108
.401
1.000
-.278
.489
-.276
.352
-.278
1.000
.083
.489
.083
1.000
Triglycerides
HDL
Note
LDL
.057
.962
95 observations were used in this computation.
Select tables
With a whole table selected you can:
1. Change thickness, pen pattern, and color of all lines in the table.
2. Change the color of text for the whole table.
3. Change the font, size, style, alignment, and angle for all text components.
4. Use Edit Display to change the graph as a whole.
If the cursor isn’t an arrow, first choose the selection tool from the Draw palette.
7 Customizing results Tables
To select an entire table, click directly on the borders or interior of a table. Do not click a title
or note.
To select several tables, Shift-click them, or click and drag a marquee around them.
You can also use the Results Browser to select objects; see “Select results,” p. 148.
Black handles show that a table is selected. You can also check the Result Selected note in the
upper right corner of the view, or use Show Selection in the Results browser:
Select components
If the cursor isn’t an arrow, first choose the selection tool from the Draw palette.
To select a component, click that component directly. Shift-click to select several components
at once.
Black selection handles show when components are selected.
7 Customizing results Tables
This table shows how to select each table component and which tool to use to change an
aspect of the component:
Component
Borders, line-spacing, and orientation of entire table
How to select it
Click a row or column label or
anywhere inside the table
Line thickness, pen pattern, and color of entire table
Click a row or column label or
anywhere inside the table
Font, size, and style of values inside the table, row labels, Click a row or column label or
and column labels
anywhere inside the table
Font, size, style, alignment, and angle of title and notes
Click the title or notes
Color or text of title
Click the title
Font, size, style, alignment, and angle of note
Click the note
Color or text of note
Click the note
Tool
Edit Display
Draw palette
Text menu
Text menu
Draw palette
Text menu
Draw palette
Resize tables
You can resize tables several ways:
1. Resize the whole table by dragging selection handles.
2. Change column widths one at a time by dragging column borders.
3. Choose a different font size for the whole table from the Text menu. See“Change text
items,” p. 200.
4. Change row heights with Edit Display. See “Row height,” p. 201.
Resize whole table select the whole table, then click and drag one of its selection handles to a
new location. Drag a corner handle to resize a table’s height and width at once; drag a side
handle to change height or width alone.
Change column widths To change the width of any column (including the borderless column of row labels), position the cursor over a column border. When the cursor changes to a
cross-arrow ( ), click and drag the border to a new location.
7 Customizing results Tables
Move tables or components
You can move an entire table, its title, or its note(s). If you move the table as a whole, its title
and notes move together and stay in the same positions relative to each other.
• Click and drag the table or component
Do not drag selection handles; dragging handles resizes rather than moves the table or component.
If you want to move only the title or the note, select whichever one you want to move and
drag it to a new location. Moving a title or note has no effect on the body of the table.
Shortcut You can use cursor arrow keys to move any selected table or table component. If the
grid is turned on, each keystroke moves the object one grid unit in the direction of the arrow.
If the grid is turned off, each keystroke moves the object one screen pixel. For more information about the grid, see “Turn Grid On/Off,” p. 217.
Change text items
You can change the font, size, style, and color of text inside tables, row and column labels,
titles, and notes. You can also change the alignment and orientation of table titles and notes.
You can change text components individually or all at once.
To format or edit a text component, select only that component. To select several text items,
Shift-click to select them at the same time. To select all text items at once, select the entire
table. Then, use Text menu items to change font, size, style, alignment, or angle. Use the pen
color tool in the Draw palette to change the color of text components. Use the text tool in the
Draw palette to edit the contents of a text item.
You cannot edit table values or labels with text tools.
7 Customizing results Tables
If you use the text tool to edit any text, that text no longer updates when the analysis updates.
Change overall structure
While StatView produces many different types of analyses in tables, they share a common
overall structure, which can be changed with the Table dialog box. You can change a table’s
numeric formatting, borders, and row heights, and you can change its orientation.
To use the Table dialog box:
• Select the entire table
• Click Edit Display
Numbers Choose numeric format and number of decimal places (see “Format,” p. 79 and
“Decimal places,” p. 80). Check Always have leading digit to include a leading zero in fractional values (e.g., 0.25).
Table format Choose a set of borders from the pop-up menu, or select Other to design your
own.
Select Other to get a Borders dialog box in which you can design your own table format. First
choose a line style, then click any border that should use the style.
Row height Specify a line-spacing for the table, e.g., 1 for single-spacing, 2 for double-spacing, etc. The base height for single-spacing varies according to font size.
Transpose rows and columns Check this option (turn it on) exchange rows and columns,
thus making a wide table tall or vice versa.
7 Customizing results Tables
Descriptive Statistics
Weight
Mean
Std. Dev.
Std. Error
Count
158.653
28.389
2.913
95
Minimum
107.000
Maximum
234.000
# Missing
0
Descriptive Statistics
Mean Std. Dev.
Weight
158.653
28.389
Std. Error
Count
Minimum
Maximum
# Missing
2.913
95
107.000
234.000
0
Change line thicknesses and pen patterns
The Draw palette’s pen and line tools are handy for calling attention to tables or reducing the
visibility of borders in tables. You can thicken lines and change their pen patterns.
Line Thickness You can change the thickness for border lines. Table borders default to a single point line. (To print hairlines, see “View preferences,” p. 232.) Choose the top, dotted line
for invisible lines.
Pen pattern You can choose from sixteen pen-type choices. Table borders default to a solid
pattern. Pen patterns have greater visual impact with thicker lines. (PostScript printers interpret some patterns as halftones, so a single pixel screen line may print as a gray line.)
Change colors
Pop-up menus at the bottom of the Draw palette let you choose colors for the pen and fill.
Use the pen color tool to change the color of text inside a table, and the fill color to change
the color of table borders. To change the color of a title or note, select it directly and change
the pen color. Control-click (Windows) or Command-click (Macintosh) to select both pen
and fill colors at once.
Pen
Fill
Drawing and layout
8
StatView includes many drawing features to help you customize the results of your analyses.
Using StatView as your drawing program has two advantages:
1. You can change data and analyses, updating results automatically, without having to
rework presentations.
2. You can save your finished presentation as a template to apply to other datasets.
In this chapter, we discuss Draw tools you can use to add lines, shapes, and text to complete
and enhance your results. Then we discuss Layout tools that let you assemble your customized
tables and graphs in an attractive, full-color presentation.
The previous chapter (“Customizing results,” p. 179) discusses how you can use Edit Display
and tools from the Text menu and Draw palette to customize StatView’s graphs and tables.
Draw tools
Tools in the Draw palette let you draw shapes and type text in the view. Other Draw palette
tools let you customize these shapes and text, as well as tables and graphs. (Using drawing
tools to customize graphs and tables is discussed in the previous chapter, “Customizing
results,” p. 179.)
8 Drawing and layout Draw tools
(Windows only) To show the Draw palette, select Draw Palette from the View menu. Drag its
title bar to reposition it.
(Macintosh only) The Draw menu is a tear-off palette. Click the menu, then quickly and
smoothly drag it to a new location. (If you hesitate or drag too slowly, StatView might mistake
your movement for an attempt to select a tool.) Drag its title bar to reposition it. If you prefer,
you can use Draw tools from the menu; you do not have to tear off the palette.
You can place the Draw palette anywhere on the screen, so that it is handy but does not
obstruct your results.
Select objects
The selection tool
activates the usual arrow cursor, which lets you select and move tables,
graphs, shapes, and text.
Add text objects
You can add text anywhere in the view, to label or comment on a result, or to modify a text
component of a result.
• From the Draw palette, select the text tool
• Click where you want to enter text
• Type your text; press Enter (Windows) or Return (Macintosh) to start a new line
As you type, the box expands to the right and downward to hold your text.
Drag selection handles Select the selection tool, select a text object, and drag its selection
handles to resize a text box. After you resize a text box yourself, its width becomes fixed; any
further text you add wraps to additional lines to stay within the established width. (You must
reselect the text tool to add more text.)
You can also set the width of a text object in advance: rather than clicking once and beginning
to type, click and drag a box with the text tool and then start typing.
8 Drawing and layout Draw tools
Change text objects Use Text menu commands to format text objects you add with the text
tool, or to customize text components of graph and analysis objects (see “Change text items,”
p. 187 and p. 200).
You can change font, size, style, and justification (left-alignment, right-alignment, or centering) used in text objects. Just select characters with the text tool or a whole text object with the
selection tool, and then choose commands from the Text menu.
You can rotate entire text objects left or right (to make text sideways or upside-down). Just
select the text object(s) with the selection tool, then select Rotate Left or Rotate Right commands from the Text menu. You can edit rotated text just as you do normal text. While you
are editing rotated text, StatView displays the text in normal position. When you are finished
editing, the text again appears rotated. You cannot rotate just selected characters.
Use the pen color tool in the Draw palette to change the color of selected characters or
objects; see “Change colors,” p. 212.
Draw objects
You can draw the following shapes:
Shape
Tool
Keyboard modifiers
text
line
Hold the Shift key while drawing to constrain to a 45 or 90 degree angle.
arc
Hold the Shift key while drawing to constrain to an arc from a circle.
rectangle
Hold the Shift key while drawing to constrain to a square.
rounded rectangle
Hold the Shift key while drawing to constrain to a rounded square.
ellipse
Hold the Shift key while drawing to constrain to a circle.
polygon
Hold the Alt key (Windows) or Option key (Macintosh) while drawing to preview
a closed polygon.
Hold the Alt key (Windows) or Option key (Macintosh) while drawing to preview
a closed spline.
spline
To draw a shape other than a polygon or a free-form curve:
• Select the tool for that shape
• Click and drag until the shape is the desired size
The cursor changes back to the selection tool as soon as you release the mouse. To return to
the previous tool, hold the Control key (Windows) or Command key (Macintosh).
A corner/center control lets you draw some shapes beginning either in the shape’s center or at
its corner. To choose the starting point of a rectangle, rounded rectangle, ellipse, arc or line,
8 Drawing and layout Draw tools
click the control to toggle it between the two different states:
draws and reshapes objects
from center to corner, and
draws and reshapes objects from corner to corner.
You can resize and reshape most shapes by selecting the shape and dragging one of its black
selecting handles. Hold the Shift key while you drag to constrain movement vertically, horizontally, or at a 45˚ diagonal. Check the state of the corner/center control before resizing or
reshaping.
Rounded rectangles
After drawing a rounded rectangle, you can use Edit Display to change how corners are
rounded.
• Select the drawn shape
• Click Edit Display
You can either round the ends of the rectangle for an oval, or you can round just the corners
with an arc of the radius you choose. The unit of measure for the radius is either inches or
centimeters, depending on your Custom Rulers settings (see “Custom Rulers,” p. 217).
Arcs
After drawing an arc, you can reshape it by dragging its selection handles or using Reshape
from the Edit menu.
Drag selection handles Click and drag any of the eight black selection handles to change the
shape of an arc.
Reshape mode Select Reshape from the Edit menu to switch to Reshape mode, and select it
again to exit Reshape mode when you are finished. In Reshape mode, the cursor changes to a
reshaping crosshair ( ). Reshape mode lets you change the way an arc is defined. Usually,
arcs are determined as the arc quarter section that inscribes the rectangle, so no matter where
you drag the corners of the rectangle, the arc you get is just 90 degrees of a circle; see the left
8 Drawing and layout Draw tools
figure. By comparison, in Reshape mode the arc is constrained to the same circle, but you can
choose a bigger or smaller angle of the circle, as in the right figures.
Shortcut (Macintosh only) Hold the Control key to switch temporarily to Reshape mode,
and release the key to exit Reshape mode.
Polygons
The polygon tool lets you draw open or closed polygons. A closed polygon is one that has no
gaps—it ends where it starts. An open polygon is one with an “empty” edge. Below, the left
figure is closed and the right is open.
To draw a polygon:
• Select the polygon tool
• Click (and release) at the starting point
• Click where you want the next vertex
• Continue clicking each new vertex
• To finish, either click the starting point (for a closed polygon) or double-click a final point
(for an open polygon)
Preview While you’re clicking vertices, hold the Alt key (Windows) or Option key (Macintosh) to preview what a closed polygon would look like—in other words, to see what the final
shape would look like if you were to finish by clicking the starting point. To force closure,
hold the key while double-clicking the final vertex.
Drag selection handles Click and drag any of the eight black selection handles to resize a
polygon.
8 Drawing and layout Draw tools
Reshape Select Reshape from the Edit menu to switch to Reshape mode, and select it again
to exit Reshape mode when you are finished. In Reshape mode, the cursor changes to a
reshaping crosshair ( ), and you can:
1. Change the shape of a polygon: click and drag any vertex to a new location.
2. Open a closed polygon: Control-Alt-click (Windows) or Command-Option-click (Macintosh) the line segment you want to remove.
3. Close an open polygon: Control-Alt-click (Windows) or Command-Option-click (Macintosh) either the starting point or the finishing point.
4. Remove a vertex to reduce the number of edges: Alt-click (Windows) or Option-click
(Macintosh) the vertex.
5. Add a vertex to any edge: Alt-click (Windows) or Option-click (Macintosh) the edge
where you want the vertex
Shortcut (Macintosh only) Hold the Control key to switch temporarily to Reshape mode,
and release the key to exit Reshape mode.
Splines
The spline tool lets you draw open or closed free-form curves based on cubic splines, similar
to Bezier curves. An open curve is one that doesn’t start and end at the same point. Below, the
left figure is closed and the right is open.
8 Drawing and layout Draw tools
•
•
•
•
•
Select the spline tool
Click (and release) at the starting point
Click where you want the first vertex (the first change of direction)
Continue clicking each new vertex
To finish, either click the starting point (for a closed curve) or double-click a final point
(for an open curve)
Preview While you’re clicking vertices, hold the Alt key (Windows) or Option key (Macintosh) to preview what a closed curve would look like—in other words, to see what the final
shape would look like if you were to finish by clicking the starting point. To force closure,
hold the key while double-clicking the final vertex.
Drag selection handles Click and drag any of the eight black selection handles to resize a
curve.
Reshape Select Reshape from the Edit menu to switch to Reshape mode, and select it again
to exit Reshape mode when you are finished. In Reshape mode, the cursor changes to a
reshaping crosshair ( ), and you can:
1. Change the shape of a curve: click and drag any single vertex to a new location. Or, select
any vertex to see its velocity handles (tangents) and then drag those handles to change the
angles of the arcs connecting that vertex to adjacent vertices.
Velocity handles
Vertices
As you drag the end of a velocity handle, you change both the angle of the line and the velocity of the curve at that point; the curve redraws so that the line is still tangent. Usually, the
opposite velocity handle remains aligned to the one you are dragging, but you can hold the
Alt key (Windows) or Option key (Macintosh) while dragging to leave the opposite handle
fixed, thus creating a corner.
8 Drawing and layout Draw tools
2. Open a closed curve: Control-Alt-click (Windows) or Command-Option-click (Macintosh) the line segment you want to remove.
3. Close an open curve: Control-Alt-click (Windows) or Command-Option-click (Macintosh) either the starting point or the finishing point.
4. Remove a vertex: Alt-click (Windows) or Option-click (Macintosh) the vertex.
5. Add a vertex to any curve: Alt-click (Windows) or Option-click (Macintosh) the edge
where you want the vertex.
Shortcut (Macintosh only) Hold the Control key to switch temporarily to Reshape mode,
and release the key to exit Reshape mode.
Import objects
You can paste objects from other applications into the view.
• In the other application, copy text or a picture
• In a StatView view window, paste the object
Pasted text can be manipulated the same was as text created by StatView. However, you cannot manipulate a picture except to resize it by dragging its black selection handles. To return a
resized picture to its original size, double-click it.
8 Drawing and layout Draw tools
Change fill patterns, pen patterns, and line types
The Draw palette’s fill, pen, and line tools let you change the appearance of drawn objects.
You can fill shapes with patterns, change lines to arrows, and change the thickness and pen
pattern of lines.
Fill pattern Select any drawn shape (except a line) and choose a fill pattern to add a pattern to
its interior. Choose None for a transparent (empty) fill. (None and white fill are not the
same.) Closed shapes fill as you would expect; open curves and polygons fill as though a line
connected the first and last vertices, and open arcs fill as though lines connected their endpoints to their center points.
Pen pattern Select any drawn shape and choose a pen pattern to change the appearance of its
edges. All lines default to a solid pattern. Pen patterns have greater visual impact with thicker
lines. (PostScript printers interpret some patterns as halftones, so a single pixel screen line
might print as a gray line with some patterns.)
Line thickness Select any drawn shape and choose a line thickness for its edges. All line
widths default to a single point line. (To print hairlines, see “View preferences,” p. 232.)
Choose the top, dotted line for invisible lines.
8 Drawing and layout Layout tools
Arrow Select any drawn line or arc and choose one or two arrowheads. You cannot add
arrowheads to the other kinds of shapes.
Change colors
Pop-up menus at the bottom of the Draw palette let you choose colors for the pen, fill, and
background (the empty view area outside graphs). You can change the pen color for any
object, including text, and you can change the shape color for any object you can fill. You can
also change the background of the entire view.
Pen
Fill
Background
Control-click (Windows) or Command-click (Macintosh) to select both pen and fill colors at
once.
Color preferences
You can use Color Preferences to change StatView’s color palette. StatView can display any
color in each slot of the color palette; the number of colors available depends on your monitor. If you have a monochrome monitor, you can still use colors with a color printer. See
“Color Palette preferences (Macintosh only),” p. 226.
Layout tools
Commands in the Layout menu let you manage page layout and arrange, move, lock, group,
overlay, and clean up objects. Layout tools apply also to drawn objects grouped to analysis
results.
8 Drawing and layout Layout tools
Control page layout
Drawing Size from the Layout menu lets you control how many pages wide and tall your view
is. As you produce results, StatView automatically adds new pages to the bottom of the view,
and then starts a second column of pages, etc. If you want a view to be wide rather than tall,
you must create the additional pages using the Drawing Size dialog box. You can also use
Drawing Size to remove blank pages after deleting results.
• From the Layout menu, select Drawing Size
• Click and drag to indicate the page layout you want
• Click OK
Each white rectangle represents one page in your document. Pages are added to or removed
from the active view when you click OK. StatView can handle both portrait and landscape
printer settings for page orientation.
You cannot set the drawing size smaller than the number of pages needed by any results currently present. A view preference lets you limit drawing size for printing or export to other
applications; see “View preferences,” p. 232.
Arrange objects
Clean Up Items from the Layout menu lets you neatly arrange graphs, tables, and drawn
objects in the view. This command always works with all results in a view; it is not necessary
to select objects before using Clean Up Items
• From the Layout menu, select Clean Up Items
8 Drawing and layout Layout tools
Clean up by Choose whether to keep objects in their current order or to sort them by analysis type.
Distance between items Specify how far apart to space each item. The distance you specify is
rounded to the nearest grid unit if the grid is on (see “Exercise,” p. 215). The default distance
is 0.25 inches.
Ignore page breaks By default, Clean Up Items forces extra space between objects as needed
to keep objects from being split over page breaks; avoiding page breaks is preferable for printing, unless you need to tile especially large objects across several pages, e.g., for a poster. However, some people prefer to check this option (turn it on) while working on analyses to save
screen space. On the screen, page breaks are depicted with dotted red lines.
Align to left margin By default, Clean Up Items doesn’t reposition items horizontally. You
can check this option (turn it on) to align all items along a left margin determined by the
Horizontal distance setting.
Additional alignment commands appear in the Draw palette; see “Align to Grid,” p. 218 and
“Align Objects,” p. 218.
Move objects
To move objects individually, select the object and drag it to a new location. Be careful not to
drag black selection handles; dragging selection handles resizes objects. If you accidentally
resize an object, immediately select Undo from the Edit menu.
(Here as in other chapters, objects are tables, graphs, table or graph components, drawn
shapes, or text items. Most objects can be arranged, moved, and edited with the same basic
techniques. For drawing and layout purposes, all objects work the same way unless a particular
type of change would destroy the nature of the object. For example, you cannot edit numbers
in a table (wrong numbers would do you no good), and you cannot move a plot outside its
graph frame (a plot would be meaningless outside its axis context).
Lock and unlock objects
You can lock any object to prevent it from being moved or edited accidentally. A locked object
cannot be moved, edited, resized, or reshaped. The black selection handles for a locked object
are grayed or dimmed. However, you can still select and copy objects, change variable assignments, and change analysis parameters. StatView still recalculates results if their data condition changes.
• Select the object
• From the Layout menu, select Lock
To unlock a locked object so you can again move or edit it:
• Select the object
• From the Layout menu, select unlock
8 Drawing and layout Layout tools
Group objects
You can select two or more objects and group them together so they act as one object. You can
group any combination of results, drawn shapes, and text items. If you use Draw tools to
make modifications to results, you might want to group them to those results so that they
move together and stay intact when you Clean Up or rearrange results. Unless text additions
and shapes are grouped with their tables and graphs, they do not move together.
• Select the objects
• From the Layout menu, select Group
To ungroup grouped objects:
• Select the group (or several groups)
• From the Layout menu, select Ungroup
You can also group grouped objects together. Ungrouping compound groups works one
“group level” at a time. For example, if you group a pair of objects, then group another pair of
objects, and finally group the two grouped pairs, later ungrouping the foursome produces two
grouped pairs that could in turn be ungrouped.
When you change variables for grouped results, it affects all the results.
Overlap and overlay objects
Objects in the view are layered in front of previously created objects. (The last object you create or draw is “on top” or “at the front.” Each previous object is one layer behind its successor.) If objects do not overlap, this layering is irrelevant. However, if objects overlap, the
objects in front obscure objects behind. You can re-layer objects with Draw tools and Layout
menu commands.
To move an object, select it and choose the appropriate command or tool. If you select several
objects, they move as a group.
Draw palette
Layout menu
Action
Move to back
Moves the selected object all the way back, behind all other objects
Move to front
Moves the selected object all the way forward, in front of all other
objects
Sends the object one layer back
Brings the object one layer forward
Move Backward
Move Forward
Exercise
This exercise shows how to accentuate a table by layering it above a drawn, filled rectangle to
create a frame.
• Create any graph or table, e.g., a Descriptive Statistics analysis
• In the Draw palette, select the rectangle tool
8 Drawing and layout Layout tools
• Click and drag to draw a rectangle around the table
• Make sure the rectangle is still selected (has black selection handles)
• Select a fill pattern from the Draw palette
Don’t be alarmed! Your filled rectangle should now be in front, completely hiding the table
behind it.
• Make sure the rectangle is still selected
• Click the Move to back tool in the Draw palette
• Select the rectangle tool and draw a smaller rectangle around the table
• Choose a solid white fill for this rectangle
(Make sure the smaller rectangle is still selected)
• From the Layout menu, select Move Backward
(Make sure the smaller rectangle is still selected)
Now you have a layer of three objects: a table in front, a white rectangle in the middle, and a
gray rectangle at the back.
8 Drawing and layout Layout tools
Descriptive Statistics
Mean
Weight
158.653
Std. Dev.
28.389
Std. Error
2.913
Count
95
Minimum
107.000
Maximum
234.000
# Missing
0
Rulers and grid lines
Ruler and grid commands in the Draw palette help you align objects neatly.
Show/Hide Rulers Choose whether to show horizontal and vertical rulers along the top and
left edges of the view. When rulers are visible, hatch marks in the rulers show exactly where
your cursor is positioned at that instant, which helps you draw and move objects precisely.
To move the origin (zero) of a ruler, click and drag the zero-position tick mark. To reset the
origin back to the edge of the window, click the box in the upper left corner where the rulers
intersect.
Turn Grid On/Off Choose whether to have objects snap into alignment with an even grid in
the view window. The grid affects objects you create and objects you draw. Grid lines are
spaced at each inch or centimeter, depending on your system configuration and Custom Rulers setting, and objects snap into alignment at each tick division along the ruler (not just at
the drawn grid lines). The grid is on by default.
If you create or position an item when the grid is off, you can later snap it to the grid by
selecting the object(s), turning the grid on, and selecting Align To Grid.
Show/Hide Grid Lines Choose whether to make grid lines visible in the view window. Grid
lines are never printed.
Show/Hide Page Breaks Choose whether to make page breaks visible in the view window.
Custom Rulers Select Custom Rulers if you want to change the ruler measurement units,
grid spacing, or the colors used for page breaks and grid lines.
8 Drawing and layout Layout tools
For example, below is the upper left corner of a view window in which rulers and grid lines are
shown. Using Custom Rulers, we specified centimeter ruler units and two divisions per centimeter. We turned Align to Grid on, which forces the cursor to align to a ruler tick mark at all
times—notice the dotted lines in the rulers showing exactly where the cursor is located.
Align to Grid Align to Grid snaps selected objects into alignment with the grid. (You must
turn the grid on to use this command.) Objects align by the rectangle they inscribe—in other
words, what aligns to the grid is the smallest rectangle you could draw around every part of
the object, including titles, legends, notes, etc., with a tiny margin. You can see this rectangle
when you start to drag the object.
Align Objects Align Objects lets you align selected objects vertically and horizontally.
• Select the objects you want to align
• Select Align Objects from the Draw palette
• Choose whether to align or distribute objects according to their tops, bottoms, rights, lefts,
middles, or sizes
• Click Align
8 Drawing and layout Layout tools
As you make choices, the sample objects in the corner move to demonstrate how your choices
will affect the objects. The choices above centered all the objects and distributed them vertically for even graphs.
You can quickly bring together two objects that are far apart in the view by selecting them in
the Results Browser and then using Align Objects.
8 Drawing and layout Layout tools
Tips and shortcuts
9
Tool Bar (Windows only)
New
New dataset
Ope view
n
Save file
Prin
t
Cut
Cop
y
Past
e
Und
o/Re
Sele do
ct
Sele All
ct A
Show ll Ro
w
Form Selecti s
o
u
Edit la n
/
Sort Apply C
r
Edit data iteria
C
Clea ategor
n
i
Vari Up es
able
Resu Bro
w
l
Drawts Brow ser
s
Hint Palett er
e
s
Help
The StatView tool bar provides one-step access to many of the most frequently-used StatView
commands. To hide or show the tool bar, select Tool Bar from the View menu.
If you forget the function of a tool, pause with the cursor positioned over the tool for a tip.
Help
StatView offers a number of ways to get help online, while you’re working.
1. Hints (both Windows and Macintosh)
2. Help (Windows only)
3. Status bar (Windows only)
4. Tool tips (Windows only)
5. Apple Guide (Macintosh only)
6. Balloon Help (Macintosh only)
Each of these systems meets a different need:
Hints give suggestions about what you are doing in StatView—how to use a new window,
how to complete an analysis, what to do next, how to resolve an error, etc.
Help has brief discussions of the StatView environment (its windows, commands, and general
organization) and gives general advice and step-by-step instructions for common tasks. Win-
9 Tips and shortcuts Help
dows Help is a hypertext system: you can click any highlighted words or phrases to get brief
definitions or to jump to related topics.
Status bar messages, Tool tips, and Balloon Help teach you the functions of items you see on
the screen: menu items, buttons, and so on.
Apple Guide answers questions about how to do things by leading you step-by-step through
the process—if necessary, asking you questions along the way, pointing out where you should
look, and even doing steps for you.
Hints window
The Hints window is a floating window that contains helpful information about every item
on the screen. You can make it visible any time by selecting Hints Window from the View
menu (Windows) or Hints from the Window menu (Macintosh). The Hints window appears
automatically in some situations, but does not close automatically. You can hide it by clicking
its close box. You can resize it and move it anywhere on your screen.
You can also use Hints Preferences to control when the window automatically appears. When
you are first learning StatView, it might be helpful to keep the Hints window visible so you get
instant feedback on how to use the program.
The Hints window displays two different levels of helpful information. Interface hints (Windows) or Balloon hints (Macintosh) appear in the Hints window when you click on an item of
interest in the dataset, a view or a dialog box. Similar information is available through Balloon
help (see below). Informational hints offer more detailed information. They explain the following features:
1. definitions of the functions in the Formula, Recode, Series, Random Numbers and Criteria dialog boxes
2. variable usage for template slots in the Assign Variables dialog box
3. dimmed options in analysis dialog boxes when you edit an analysis
4. error messages
Help (Windows only)
Help offers brief discussions of StatView’s windows, menus, dialog boxes, and commands. It
also gives step-by-step instructions on how to complete common tasks in StatView. StatView’s
Help is a hypertext system, in which you can navigate freely between topics by clicking underlined words. To start Help, press F1 or select a command from the Help menu.
9 Tips and shortcuts Help
Status bar (Windows only)
The Windows status bar at the bottom of the main StatView window describes menu items
and buttons in the dataset, view, and browser windows. The status bar also informs you of the
progress of StatView’s calculations.
status bar
To show or hide the status bar, select Status Bar from the View menu.
Tool tips (Windows only)
To learn the function of a tool on the tool bar, pause with the cursor positioned over a tool.
Apple Guide (Macintosh only)
StatView harnesses the power of Apple Guide active assistance with its own StatView Guide.
StatView Guide goes beyond the passive information found in typical online help systems,
enabling you to learn while you work. Rather than searching through lengthy help text, you
can simply follow StatView Guide’s step-by-step instructions and actually complete the task
while you learn. StatView Guide gives you the same sort of help you get when an expert sits
down with you and not only explains things but shows you what to do: it guides you from
start to finish as you create any statistical test, table, or graph in StatView.
Use StatView Guide
To use StatView Guide, launch StatView and select StatView Guide from the Help menu on
the right side of your menu bar.
9 Tips and shortcuts Help
This launches StatView Guide. Click Topics for an overview:
Select a topic and phrase and click OK to begin. StatView Guide leads you step by step
through the analysis you want to complete:
For more information about how to use Apple Guide, switch to the Finder and select About
Apple Guide from the help menu.
Balloon help (Macintosh only)
Macintosh Balloon help explains almost all program features: the choices in dialog boxes, buttons in the view and dataset windows and all browsers, all the parts of the dataset and views.
To use balloons:
• Select Show Balloons from the Help menu on the right end of the menu bar
Menu commands are only described by balloons (and status bar messages in Windows). All
other balloon help is duplicated in the Hints window.
9 Tips and shortcuts Preferences
Error messages
When an error occurs, StatView generates an error message. The Hints window automatically
appears to display the error message, often an explanation of why the requested action cannot
be completed. In the Hints Preferences dialog box, you can set an option to have StatView
beep when it displays an error message.
Alert messages
An alert message warns you of potentially dangerous situation or advises you of the consequences of an action you requested. Alert messages sometimes appear in a box with a single
OK button. You can set a preference to have these appear in the Hints window instead, which
automatically opens when there is an alert message to display. The advantage to this setting is
that your work is not interrupted by an alert box, yet you still see the alert message.
Preferences
You can set preferences that govern the behavior of many different parts of StatView.
• From the Manage menu, select Preferences
• Select the type of preferences you want to change
• Click Modify
When you are finished setting preferences, click Done.
All preferences are stored in the StatView Library. If you move or delete the Library, all preferences return to their original settings. While this can be a convenient way to undo numerous
changes, you should be aware of the other effects of discarding your Library file; see p. 233.
Application preferences
Application preferences affect the overall application.
9 Tips and shortcuts Preferences
Windows zoom (Macintosh only) Occupy full screen tells StatView to make its windows as
large as your monitor allows. Leave room for Finder icons lets you see your hard disk, the
Trash, etc. along the right edge. Your choice takes effect the next time a new window is
opened.
Browsers’ appearance Choose the font and size you want for the variable, analysis, results,
and function browsers. You can type a specific size not in the pop-up menu. Your choice takes
effect the next time you open StatView.
Initially hide which browsers? Usually, the analysis and variable browsers are automatically
shown; the results browser is only shown when you ask for it. Check any browser you don’t
want to see; uncheck any browser you do want to see.
Use System’s Temporary Folder Check Use System’s Temporary folder if you want temporary files stored inside the temporary folder (Windows) or the System folder’s temporary
folder (Macintosh). Uncheck the option if you want to store them in the StatView folder.
(Temporary files are written to store information from memory-intensive operations.)
Color Palette preferences (Macintosh only)
StatView can display any color in each slot of the color palette; the number of colors available
depends on your monitor. If you have a monochrome monitor, you can still use colors with a
color printer.
On a color system, you can edit the color palette:
9 Tips and shortcuts Preferences
• Click the color slot you want to change
• In the standard color picker, specify a new color
• Click OK
Your changes take effect immediately.
Dataset preferences
Enter key moves When you type a value and press Enter on the numeric keypad, the cursor
either moves down to the cell in the next row of the same column, moves right to the same
row in the next column, or stays in place, according to your choice. Your choice takes effect
immediately. While editing, you can use cursor arrow keys (up, down, left, right) to enter a
value and move a different direction.
Font and Size Choose the font and size you want the dataset to use. You can type a specific
size. Your choice takes effect for the next new dataset. You can change any individual dataset
with the Text menu.
Decimal places Choose how many decimal places you usually want to see for variables with
type real. Your choice takes effect for the next new column. You can change individual columns with the Decimal Places pop-up menu in the attribute pane.
Silently accept ambiguous values If you enter an ambiguous date/time value, such as 8/11
(which could mean either August 11 or 8 November), StatView can either warn you, or
silently trust that you know what you’re doing.
When opening datasets from other platforms StatView stores real numbers and does its
computations to the fullest precision of the machine you are using. This precision varies
between platforms (see “Type,” p. 73). When you import a dataset created on another platform, StatView usually recomputes dynamic formulas so that its values are computed the way
they would be computed on your current platform. If you prefer, they can be converted to
static formulas that are not recomputed. (See the online documentation for details about file
formats that can be opened by your version of StatView.)
9 Tips and shortcuts Preferences
Formula preferences
Font and Size Choose the font and size you want the formula window to use. You can type a
specific size. Your choice takes effect for the next new formula window. You can change any
individual Formula window with the Text menu.
Enlarging the font size beyond 12 or 14 point might render the buttons in the keypad of the
Formula dialog box illegible.
If you want to use formulas to work with double-byte text strings, such as with Kanji characters, you must set the Formulas font to an appropriate font, such as Osaka.
Graph preferences
Graph preferences let you change the default display for all graphs, while Edit Display lets you
fine-tune each graph individually.
9 Tips and shortcuts Preferences
Default size Specify length of the vertical (Y) and horizontal (X) axes by typing values and
choosing scale units (inches, centimeters, picas or points). Graphs can be resized individually.
Default numbers Choose the numeric format and number of decimal places to display along
axes, titles, notes, and labels. To include a zero before the decimal point (e.g. 0.25 instead of
.25), check Always have leading digit.
Default frame Select which graph frame (which combination of axes) you want.
Default point size Choose a size from the points in the Default Point Size pop-up menu.
Order in which to choose points, fills, and colors Choose the order in which you want
point types, fills, and colors to be chosen for graphs. Click and hold the item you want to
modify, then select a choice from the pop-up menu and release the mouse button. Do not
drag across the bar itself. As you change the position of one color, point, or fill in the order,
the others adjust; for example, if you choose black for your first variable, the item that is currently black changes to the color that had been first.
Distinguish cells by For compound graphs (see “Multiple and compound results,” p. 135)
that show more than one group variable, StatView automatically assigns a different point
type, color, or fill pattern to each variable so that they can be easily distinguished. Choose
which parameter you want to vary between variables. For example, choose color if you want
different variables to have the same point type and fill pattern but different colors.
9 Tips and shortcuts Preferences
Hints preferences
Display hints window when it contains Check Interface hints (Windows) or Balloon hints
(Macintosh) if you want to see hints for buttons, menu commands, and other interface items.
Check Informational hints if you want to see general informational hints. Leave both options
unchecked if you don’t usually want to see any hints at all.
Font and Size Choose the font and size you want the hints window to use. You can type a
specific size.
Initially show hints window Check this option if you want StatView to show the Hints window automatically each time it starts. Uncheck it if you prefer not to see hints.
Beep for each error message Check this option if you want StatView to beep when displaying error messages. Uncheck it if you want error messages to appear silently.
Show alert messages in hints window Check this option if you want to see error messages in
the hints window rather than in alert boxes.
Survival Analysis preferences
9 Tips and shortcuts Preferences
Use “More choices” dialog as default By default, you see the “Fewer choices” versions of the
nonparametric and regression model dialog boxes. If you do not routinely need to edit the
“More choices” parameters, leave the boxes unchecked. If you prefer to see all the parameters
each time, check the boxes. Each dialog box lets you switch freely between more and fewer
choices; your choices determine what you see first.
Retain covariate matrix after regression calculations StatView can either save or discard the
intermediate covariate matrices it computes. Retaining the matrices consumes ; discarding
them saves but can slow down the subsequent calculations of additional model results.
Censor variable = 0 means observation is This option specifies how your censor variable is
coded. If you choose Uncensored, 0 values in the censor variable are taken to mean that corresponding event times are uncensored, and any other (nonzero) values in the censor variable
indicate censored event times. If you choose Censored, the opposite is true: 0 values indicate
censored event times, and any nonzero values indicate uncensored event times.
Table preferences
Table preferences govern the way table results are displayed by default. In this context, tables
are results from any statistical analysis that take the form of words and numbers arranged in
rows and columns—as opposed to graphs, which are results from any analysis that take picture form, such as scattergrams and box plots. (“Tables” include but are not limited to contingency tables.)
You can change the appearance of any individual table by clicking Edit Display.
Default numbers Choose the numeric format and number of decimal places to display in
tables. To include a zero before the decimal point (e.g. 0.25 instead of .25), check Always have
leading digit.
Table format This option lets you choose how borders are drawn between rows and columns.
Choose an appearance type from the pop-up menu.
Row height Specify how many lines of text to use for each row; e.g., choose 1 for single-spacing, 2 for double-spacing, etc.
9 Tips and shortcuts Preferences
View preferences
View preferences govern the way view windows behave, print, and save. Your choices take
effect with the next new view window.
Font and Size Choose the font and size you want the view window to use. You can type a
specific size.
These settings affect any results you generate with the analysis browser, including table and
graph titles, numbers, axis labels, and legends. You can override these settings for any individual table or graph element with the Text menu. Your choice also controls the defaults used for
the Draw palette’s text tool.
Print and copy lines at 1/4 width Check this option on to reduce all single line widths to
approximately one quarter of their specified size when they are printed with most printers.
Otherwise lines are single-pixel lines. Your choice also affects tables, graphs or drawn objects
that are copied and pasted into another application. Your choice takes effect immediately and
applies to existing as well as subsequently-drawn objects. The option does not affect screen
display.
Limit document size (Windows) Check this option (turn it on) to limit the number of pages
in view documents; this prevents out of memory problems when printing by establishing a
maximum document size of approximately 54"×54" that should work trouble-free for any
300dpi printer. Uncheck the option (turn it off ) if you need to print larger documents.
(Macintosh) If you save your views as files and read them into MacDraw II, you need to
constrain the document size so it does not exceed the capabilities of MacDraw II. Clicking
Limit document size to MacDraw II limits the total number of pages in a view to the number
of pages that MacDraw II can contain. (MacDraw drawing size is 9 pages high by 13 pages
across on a LaserWriter, a bit less than 100"×100"; StatView’s document size is 23 pages high
by 30 pages across, about 227"×227".)
Save analysis results with view By default, calculations are saved when you save a view so the
results do not need to be recalculated when the file is reopened with its original dataset. You
can turn this option off to save disk space. If you create a view to use as a template, it makes
sense not to save results so the template file is smaller.
9 Tips and shortcuts StatView Library
Templates appear using view text defaults Usually when you use a template, the text of its
output is formatted the way it was when you saved the template. This is what you would
expect a template to do. You might, however, wish to override these settings and use the
default text settings from view preferences. This is useful when you use templates provided
with StatView and want their results to match analyses already in the view.
Copy tables and graphs Usually when you copy a table or graph, a (Windows) or
(Macintosh) graphic version of that result is copied, so that you can paste the result into any
application and have it look the same. Check this option (turn it on) to copy the result both as
text and as a graphic object; one advantage to turning this option on is that you can paste
analysis results (tables) into datasets for further study.
Double-click on table/graph Usually double-clicking a table a graph in the view is a shortcut
to clicking the Edit Display button; Right-double-clicking or Alt-double-clicking (Windows)
or Option-double-clicking (Macintosh) is a shortcut to Edit Analysis. You can switch the
shortcuts by choosing Edit Analysis for double-click.
StatView Library
StatView stores information in a Library in the StatView folder. The Library contains all preference settings and information the program needs to speed up certain operations (for example, application preferences and category definitions). It also stores the locations of the
Templates and Tools folders. If the Library file is discarded or misplaced, StatView creates a
new one with default preference settings. You will have to specify preference settings again.
Example Views and Datasets
In your StatView folder is a folder of example views and datasets that demonstrate special
ways of working with StatView. To try these examples, open the view files in StatView.
Dataset Templates
Also in your StatView folder is a folder of “dataset templates.” These are datasets that use special formula variables and criteria to compute specialized statistics.
Normality Test
StatView gives you a number of useful techniques for evaluating how well continuous data
conform to a normal distribution. Some common techniques are:
1. Plot a histogram of the variable with a normal curve (see “Frequency Distribution,” p. 13
of StatView Reference).
2. Plot a frequency distribution of the variable’s Z-scores (see “Frequency Distribution,” p. 13
9 Tips and shortcuts Dataset Templates
of StatView Reference).
3. Calculate the variable’s skewness and kurtosis (see “Descriptive Statistics,” p. 1 of StatView
Reference).
Unfortunately, none of the preceding techniques gives an objective criterion upon which to
decide whether a distribution is normal. Therefore, StatView provides a pair of dataset and
view templates for checking normality.
First, paste into the template a copy of the continuous variable you want to check.
• In the original dataset, select the variable (double-click its name)
• From the Edit menu, select Copy
• Open the Normality Test template from the Dataset Templates folder
• Click the first cell in the Actual column of the Measurement compact variable
• From the Edit menu, select Paste
A formula automatically computes Ideal Normal values from a normal distribution with the
same mean and standard deviation as the variable you pasted.
Next, we use the K-S Normality Test template to test the hypothesis that your Actual values
and the computed Ideal Normal values come from the same distribution.
• From the Analyze menu, select QC Analyses/K-S Normality Test
The Assign Variables dialog box appears and automatically assigns the variables to the proper
slots, since the variables and the slots share the same names
• Click OK
9 Tips and shortcuts Dataset Templates
A new view shows a Kolmogorov-Smirnov table and two histograms with normal curves.
If the result of the K-S test is significant (i.e., p < 0.05), then the Actual and Ideal variables are
probably not from the same distributions. This implies that the Actual variable is not normally distributed, because the Ideal variable is. You should be aware, however, that the K-S
test is sensitive to outliers, so you should inspect your data for such cases. The histograms with
fitted normal curves let you compare the distributions visually.
Compute Bartlett’s Test and Compute Welch’s Test
Bartlett’s test is a test of homogeneity of variances among groups. A significant p value means
that group variances are not equal. Welch’s test is a robust one-way . Use it instead of
one-way when Bartlett’s test shows that group variances are not equal. Both templates
work the same way; we’ll demonstrate Bartlett’s with the Lipid Data.
• From the File menu, select Open
• Select Lipid Data from the Sample Data folder
• Click Open
• From the File menu, select Open
• Select Compute Bartlett’s Test from the Dataset Templates folder
• Click Open
In the left pane, you must provide the counts, means, and standard deviations on separate
rows for each group in your model. The easiest way to do this is to copy and paste results from
means table analysis:
• From the Analyze menu, select New View
• From the analysis browser under , select Means Table
• Click Create Analysis
• Click OK to accept the default analysis parameters
• Select a continuous variable (Weight) and click Add
• Select a nominal variable (Gender) and click Add
9 Tips and shortcuts Dataset Templates
Means Table for Weight
Effect: Gender
Count
Mean
Std. Dev.
Std. Err.
male
71
169.282
23.288
2.764
female
24
127.208
16.208
3.308
Then, copy the resulting table as text and paste it into an empty dataset. First, be sure that you
have view preferences set to allow copying the table as text:
• From the Manage menu, select Preferences
• Select View and click Modify
• If it is unchecked (turned off ), check Copy tables/graphs as both text and metafile Windows) or Copy tables/graphs as both and (Macintosh) and click OK
• Click Done
• From the Edit menu, select Copy (be sure the means table is still selected)
• From the File menu, select New
• Click in the first empty data cell
• From the Edit menu, select Paste
Now delete the extra cells and change the columns of numbers to have type real:
• Click the variable name cell for Column 5 to select the standard error column
• From the Edit menu, select Delete
• Click and drag over the first three row numbers to select the rows with title text
• From the Edit menu, select Delete
• Select Columns 2, 3, and 4 by dragging over their names
• From the Type pop-up menu for one of the columns, select Real to change all three
• To the warning about loss of data, click Yes
Select the data and paste it into the dataset template:
• Click and drag to select all data cells
• From the Edit menu, select Copy
9 Tips and shortcuts Common questions
• From the Window menu, select the Compute Bartlett’s/Welch’s test window
• Select the empty data cells in the first four columns
• From the Edit menu, select Paste
Finally, read the results from the variables on the right pane of the window.
Make your own dataset templates
Examine the formulas and criteria used in these dataset templates to get ideas for your own
dataset templates. Instructions for building dataset templates are given under “Build dataset
templates,” p. 240.
Common questions
Dataset
How can I record dataset comments?
You can easily annotate datasets by adding one or two string variables to the dataset and typing your comments in those columns. You might record the source of the data and any notes
on methodology that you will need to know later. For example, we could document the
Candy Bars Data this way:
To prevent yourself from accidentally trying to use the variable(s) as nominal data, be sure to
change the class to informative. Also, note that you can copy the cells and paste them into
your view document to make the same information accessible in a presentation.
9 Tips and shortcuts Common questions
How does StatView use ordering in nominal variables?
StatView automatically sorts the levels of a nominal variable for its graphs and tables—from
left to right or bottom to top in graph scales, or from top to bottom in tables. For numeric
nominal variables (those with type Real, Integer, Long Integer, Date/Time, or Currency), that
means that levels appear from smallest to greatest. For string nominals, that means levels
appear in alphabetic order. Category variables are sorted according to the order in which levels
are defined. If you define Categories manually using Edit Categories before entering data, that
means the order in which they appear in the scrolling list. If you import data or enter data in
a variable and then change its type to Category, StatView automatically defines the levels of
the Category from the values in the variable, sorted in alphabetical order.
Box Plot
Split By: Category
Descriptive Statistics
Split By: Category
Continuous, Total
8.86
Continuous, Friday
6.09
Continuous, Monday
10.15
Continuous, Saturday
8.97
Continuous, Sunday
7.63
Continuous, Thursday
5.94
Continuous, Tuesday
8.08
Units
Mean
Friday
30
25
20
15
10
5
0
-5
-10
-15
Monday
Saturday
Sunday
Thursday
Tuesday
Wednesday
Continuous
Continuous, Wednesday 15.18
There is one exception to this rule: Pareto Analysis charts and tables show cells in decreasing
order of frequency, i.e., groups with the most cases first, least cases last:
Pareto Chart
Counts: Continuous
Pareto Table for Category
Counts: Continuous
Count
160
Count
120
80
Wednesday
46
Monday
30
Saturday
27
Tuesday
24
Sunday
23
Thursday
18
Friday
17
Thursday
Friday
0
Saturday
Tuesday
Sunday
40
Wednesday
Monday
Category
Note: StatView’s statistical calculations are not influenced by order in nominal variables—the
numerical results are the same no matter how your groups are ordered. In other words, StatView’s nominal variables are not ordinal variables.
How can I reorder category variables?
Alphabetical order is not always the best order for informational displays. Generally you
should sort information in statistical displays according to the meaning of your data. For
example, if you want to demonstrate that groups of patients showed increasing effects from
treatments, you might want to sort those groups from least affected to most affected in your
9 Tips and shortcuts Common questions
plots of the effects. Or, if you are examining sales patterns for each day of the week, you might
want to show those days in calendar order.
You might think you could make changes to the order of labels by directly editing your graph
or table. However, this is not possible. Instead, you must first create a new column in the StatView data set and then redo your analysis with that variable.
• First, determine the order you want; if the list is long or hard to remember, you might
want to write it down
• Open your dataset and scroll to the variable you want to reorder
• Insert a column to the right of this column and name it
• Open the attribute pane (if it is closed) by double clicking the control in the upper right
corner
• Change the Type of this newly inserted column to Category
• When asked to Choose Category for the column, click New
One at a time, enter the labels for each group, in the order you determined. (Be sure to type
each label exactly as it appears in the variable—don’t change spelling, spacing, capitalization,
etc.)
•
•
•
•
•
•
Click Done
Change the type for the old variable to String, and change its class to Informative
Select the old column by clicking its name
From the edit menu, select Copy
Select the new column by clicking its name
From the Edit menu, select Paste
Now you have a new copy of your old column. It should look the same; however, in the new
column, the levels of the category are ordered according to your definition. Any graphs or
tables you produce with this variable will show its levels in that order.
9 Tips and shortcuts Common questions
Box Plot
Split By: Self-defined
Descriptive Statistics
Split By: Self-defined
Mean
8.86
Continuous, Sunday
7.63
Continuous, Monday
10.15
Continuous, Tuesday
8.08
Continuous, Wednesday 15.18
Continuous, Thursday
5.94
Continuous, Friday
6.09
Continuous, Saturday
8.97
Units
Continuous, Total
30
25
20
15
10
5
0
-5
-10
-15
Sunday
Monday
Tuesday
Wednesday
Thursday
Friday
Continuous
Saturday
Formulas and criteria
How can I edit formulas?
From the Source pop-up menu, select Dynamic or Static Formula again. This reopens the
Formula window so you can edit the formula definition. When you’re done making changes,
click Compute. Control-click (Windows) or Command-click (Macintosh) Compute to calculate the formula without closing the Formula window.
How can I edit criteria?
From the Manage menu, select Edit/Apply Criteria. Select the criterion you want to change
and click Edit. When you’re done making changes, click Apply to use the criterion, Save to
save changes without applying the criterion, or Select to highlight all rows meeting the criterion. Control-click (Windows) or Command-click (Macintosh) Apply to apply the criterion
without closing the Criteria window.
Copy and Paste your favorite formulas
If you find yourself using the same formulas over and over, you might want to Copy them
from the Formula window and Paste them into a text document or the Scrapbook (Macintosh). Then you can quickly reuse them in any dataset.
Build dataset templates
If you regularly need to use the same formulas or criteria on different datasets—for instance,
for a monthly report—you can build a dataset template. Create a dataset with all the variable
names, attributes, and formulas you use every week.
9 Tips and shortcuts Common questions
Delete all the rows in the dataset, and save it. (You might want to make this file read only
(Windows) or lock this file or make it Stationery using Get Info (Macintosh), so that you
don’t accidentally save over the template with some month’s data.)
Now, each week, import the data into a new dataset and Copy all the cells. Open the template, Paste in the data, and save under a new filename.
When is it faster not to use formulas?
Sometimes it’s faster not to use formulas. For example, if you want to recode all the missing
values in a dataset with many variables, it might be faster to export or Copy and Paste the data
into a word processor, do a global find-and-replace to change all missing values ( . ) to your
new code (say, –999), then import or Paste the data back into StatView.
How can I add confidence intervals or error bars to a plot?
Use a formula to calculate your favorite type of confidence interval or error bar for your Y
variable. Then add and subtract those values to the values of your Y variable. Plot all three
variables against the X variable, and then edit the display of the plot to use appropriate symbols for the upper and lower confidence or error values.
Suppose you have summary data like these below entered from a published table, and you
want to do a cell plot of group means with standard deviation error bars.
Ordinarily you could use one of the cell plots, but they plot means and error bars computed
from raw data. Since you have only the statistics, you must instead compute error values with
formulas and then draw a bivariate scattergram.
• Use formulas to compute the upper and lower error bar values:
"Group mean" + "Group sd"
"Group mean" – "Group sd"
9 Tips and shortcuts Common questions
From the Analyze menu, select New View
• From the analysis browser under Bivariate Plots, select Scattergram and click Create Analysis
• Click OK to accept the default plotting parameters
• Assign Group mean, Upper, and Lower to be Y variables; assign Group to be an X variable
• Use Draw tools to change plotting symbols
Scattergram
Y Variables
4000
3800
3600
3400
3200
3000
Upper
Group mean
2800
2600
2400
2200
2000
1800
Lower
A
B
C
Group
D
E
Our plot uses triangle symbols for the error values; you can choose others. You might also
want to delete the legend and use the text tool to change the labels.
How can I generate subgroup and labeling variables?
Subgroup data often are recorded in sequence with the same number of measurements per
subgroup. Under these circumstances, you could type, copy and paste all of the values for the
subgroup variable. But since the values in the measurement variable follow a defined pattern,
it is much easier to use a formula to generate the values of the subgroup variable.
Suppose, for instance, there are 8 measurements in each of 15 subgroups, and all measurements from a subgroup are consecutive. This means that the first 8 measurements are from
subgroup 1, the next 8 from subgroup 2 and so on. The formula to create these values is:
1+Div(RowNumber–1, 8)
or, more generally:
1+Div(RowNumber–1, X)
where X is the number of measurements per subgroup.
Another pattern in which the measurements could be recorded is that the first measurement
from each subgroup is recorded in sequence, then the second measurement from each subgroup, and so on. For the example above with 8 measurements from each of 15 subgroups,
this means that the first 15 measurements are from subgroups 1–15, as are next 15 measure-
9 Tips and shortcuts Common questions
ments, and so on, for a total of 8 sequences of measurements from subgroups 1–15 (for a total
of 120 rows). The formula to create these values of the subgroup variable is:
1+mod(RowNumber–1, 8)
or, more generally,
1+mod(RowNumber-1, X)
where X is the number of measurements per subgroup.
No matter which of these patterns fits your data, once the subgroup numbers are generated,
you should make the variable’s class nominal; the variable is then ready to be used in any analysis that takes a subgroup variable. If you wish to give the subgroups alphanumeric names
(e.g., Sample 1, Sample 2,… etc.), simply create a category in which the ordering of the group
labels corresponds with the numeric values of the subgroups. For instance, if the groups are
weeks, then make the variable’s Type: Category, and create a category whose group labels are:
Week 1, Week 2, …, Week 14, Week 15. See “Categories,” p. 80, for more information on
creating and using categories.
How can I create event times (elapsed time) from start and end times?
You can easily compute event time variables from survival data containing start times and end
times.
Suppose you have data on patients suffering from epilepsy. You are interested in whether a
particular treatment significantly affects the time that elapses until a patient’s next seizure. In
this example, each patient has entered the study on a different date. The event time for each
patient will be the elapsed time in days from the date of entry into the study until the date of
that patient’s next seizure (or the date of censoring, which will be the last day of the study).
Your data might look like this:
You can use the DateDifference(?,?,?) to compute event times or elapsed times from these
data.
DateDifference("End Date", "Entry Date", 4)
The third argument specifies which time units to use: 1 for years, 2 for months, etc. In this
case, we specify 4 for time in days.
9 Tips and shortcuts Common questions
QC analysis
How can I draw box plots of subgroup measurements?
Many QC analysts find that box plots give a useful summary of the distribution of subgrouped data. To generate a box plot quickly, simply select a completed subgroup measurement result (such as an Xbar chart) from the view, then double-click Box Plot in the analysis
browser. This adopts variable assignments to produce a single chart with box plots for each
subgroup in the same order as those in the QC result.
Xbar Line Chart
Control Limits: 3 Sigma
Box Plot
Grouping Variable(s): Date
74.35
74.3
74.25
03.26
03.25
03.26
03.25
03.24
03.23
03.22
03.19
03.18
03.17
03.16
03.15
73.85
73.8
03.24
LCL = 73.964
73.96
03.23
74
73.98
74.05
74
73.95
73.9
03.22
74.02
03.19
Center = 74.044
74.04
74.2
74.15
74.1
03.18
74.06
03.17
74.08
03.16
74.1
03.15
UCL = 74.124
74.12
Seat tube angles
Mean of Seat tube angles
74.14
Date
How can I add histograms with normal curves to my capability analyses?
It is often useful to plot a histogram with a normal curve to evaluate whether data are normally distributed. Many QC analysts also like to plot a histogram with a normal curve
together with their tables of capability indices. This allows easy visualization of the positions
of target values and upper and lower specification limits relative to the actual distribution of
the data. Simply select a table of capability indices and adopt its variable assignment for a histogram: in the analysis browser under Frequency Distribution, double-click Histogram. In the
Frequency Distribution dialog box, check Show normal comparison (turn it on).
How can I get more information about differences among subgroups?
For subgroup measurement data, analysis of variance can often provide a more fine-grained
comparison of differences among subgroups. For instance, an with post hoc tests can
tell you specifically which subgroups have mean values that differ significantly from the others. Please consult the chapter “ANOVA,” p. 73 of StatView Reference.
Can I work with compact variables?
Sometimes, data are recorded so that values from each subgroup are in a different variable
(column). StatView’s flexible data handling allows you to use data in this format simply by
compacting all of the subgroups into a single compact variable.
Suppose, for instance, your measurements (or attribute counts) fall into 8 subgroups, each
with 10 measurements in separate variables. The data might look something like this:
9 Tips and shortcuts Common questions
To compact these variables, select all eight of them, then click the Compact button in the
upper left corner of the dataset. When the Compact Variables dialog appears, type in a name
for the compacted variable, then click Compact. The compacted variable will look similar to
the following:
When your data are arranged this way, you must add both the continuous and nominal portions of the compacted variable to the chosen analysis, as pictured below.
Data arranged this way can be used in any QC analysis that uses subgroup variables, i.e., QC
subgroup, p/np and c/u analyses. You can also use the continuous portion of any compact variable in individual measurement analyses. If you do use a compact variable for the nonconformity and subgroup variables in p/np or c/u analyses, any Item or Unit Count variables you use
should match the number of cases in the continuous portion of the compact. (In the example
given above, the continuous portion of the compact variable has 10 × 8 = 80 cases.)
Survival analysis
How can I estimate the survival function at other covariate values?
You might wish to evaluate certain regression models for particular covariate values. Suppose,
for instance, you would like to evaluate the survival function for the proportional hazards
model you computed in the example of the individual who smokes 18 cigarettes per day (on
average) and has a type A personality (see “Exercise,” p. 191 of StatView Reference). From the
9 Tips and shortcuts Common questions
exercise, the model coefficients table (with results displayed to 9 decimal places) for that
model is:
Model Coefficients for Time
Censor Variable: Censor
Model: Proportional Hazards
DF
Coef
Std. Error
Coef/SE
Chi-Square
P-Value
Exp(Coef)
Cigarettes
1
.013809261
.007746646
1.782611662
3.177704337
.0746
1.013905049
Personality Type: A
1
.624020567
.272504339
2.289947269
5.243858496
.0220
1.866417032
Using the saved values of the baseline survival function, it is a straightforward task to write a
formula in StatView that will compute the survival function for specific covariate values of
your own choosing.
To save the baseline survival function to a dataset,
• Select one or more of the regression model results in the view, then click the Edit Analysis
button. (Note that the following change to the regression models parameters could be
made at the time of analysis creation, as well.)
The fewer choices version of the Survival: Regression Models dialog box now appears.
• Click the More Choices button. This brings up the more detailed version of the Survival:
Regression Models dialog box.
• To save the baseline values to a dataset, check the Create baseline survival dataset checkbox, then click OK.
Because formulas cannot be created in datasets created by analyses, you must copy the Time
and Cum. Surv. variables from the Baseline Survival Table dataset and paste them into a new
dataset. (For clarity, you might want to change the names of the variables in the new dataset to
Event Time and Baseline Cum. Surv., respectively.) In this new dataset, create 2 new columns,
one called Coefficients and the other called Covariate values. This new dataset should then
appear as below:
9 Tips and shortcuts Common questions
From the Model Coefficients Table you know that the coefficient associated with cigarette
consumption is 0.013809261 and that associated with type A personalities is 0.624020567.
Type these two numbers into the first and second rows of the Coefficients variable. (Because
these coefficients are to be used as exponents, errors introduced by rounding will be greatly
exaggerated. For this reason, we recommend that you record coefficient values to at least 6
decimal places.)
Now, because you want to compute the survival estimate for a person with a type A personality who consumes 18 cigarettes per day, enter 18 and 1 on the first and second rows of the
Covariate values variable. Note that if the person had a type B personality, you would enter 0
in the second row. The dataset should then appear as below:
The final step is to create a formula that uses all of this information to compute the survival
estimate. From the appendix “Algorithms,” p. 433 of StatView Reference, you can see that the
equation for evaluating a proportional hazards model at particular covariate values is
Ŝ ( T i ;z i ) = [ Ŝ 0 ( T i ) ]
e
β̂′z i
where Ŝ 0 ( T i ) is the baseline survival function. So, the StatView formula for evaluating this
function is the following:
"Baseline Cum. Surv." ^ e ^ DotProduct(Coefficients, "Covariate values")
Note that DotProduct(?,?) is a Mathematical function.
Now, simply click Compute, and the results are displayed in “Column 5.” You can, of course,
rename this formula column whatever you like and then save the dataset. If you would also
like to plot this computed survival function, assign “Event Time” as an X variable and the formula column as a Y variable to a bivariate chart.
If you frequently need to evaluate proportional hazards models at particular covariate values,
you should probably save this dataset for later use as a sort of template. We suggest that you
delete all of the rows before saving as a template: that way, the next time you use it, all you will
need to do is paste in the new baseline data, then type in the new coefficient and covariate values. You might wish to make the formula column static, so that it will not recompute as you
are typing in each of the new coefficient and covariate values. Once you are ready to compute
the survival function, reopen the formula dialog box, then click Compute.
As you might have guessed, you can also use these same techniques to evaluate any of the
parametric models at particular covariate values. For example, from information provided in
9 Tips and shortcuts Common questions
the appendix “Algorithms,” p. 433 of StatView Reference, we know that the formula for evaluating an exponential regression model at particular covariate values is
Ŝ ( T i ;z i ) = e
–Ti e
– µ̂ – β̂′z i
where µ̂ is the estimate of the intercept parameter. The StatView formula for evaluating this
function would then be:
e^–("Event Time" * e^(–MuHat – DotProduct(Coefficients, "Covariate values")))
where MuHat is the estimated value of the intercept parameter (type the number instead of
“MuHat”). You’ll notice from this equation that you do not need an estimate of the baseline
survival function to evaluate parametric models, but only the event times. Similar equations
can be constructed for the other parametric models as well, though the others (Weibull, lognormal and loglogistic) require specification of a scale parameter as well. The complete equations for these other models are in the appendix “Algorithms,” p. 433 of StatView Reference.
How can I make comparisons among coefficients for linear hypotheses?
Sometimes, you might need to determine if the contribution of a particular group level, or
weighted combination of group levels, to a survival regression model differs significantly from
that of another group level, or weighted combination of group levels. Suppose, for instance,
you have a covariate in a regression model called “Treatment,” the levels of which are “Treatment 1,” “Treatment 2,” and “Control.” A simple example of a test of a linear hypothesis
would be testing whether the contribution to the model of the “Treatment 1” group is significantly different from that of the “Control” group. A more complex example might test
whether an evenly weighted combination of the groups receiving treatments 1 and 2 is significantly different from the “Control” group. If you are familiar with the techniques of analysis
of variance (), you will recognize that these hypotheses are contrasts. Using the information provided by survival regression models in the Coefficient Covariances Table, you can
evaluate such hypotheses.
In their most general form, such contrasts can be computed as follows. If the linear hypotheses for the regression coefficients β (a vector) are expressed in the form H 0 :Hβ = c , where
H is a matrix (of rank r) of weights for the hypotheses, and c is a vector of constants, then the
Wald chi-square statistic (with r degrees of freedom) is given by:
2
χ = [ Hβ̂ – c ]′ [ HV̂ ( β̂ )H′ ] [ Hβ̂ – c ]
For the less general case of testing for the equality of two coefficients β i and β j , H is a vector
with all elements equal to 0 except H i = 1 and H j = – 1 and c = 0 . The chi-square statistic in this case has 1 degree of freedom and is given by
2
( βi – βj )
2
χ = ----------------------------------------V 11 + V 22 – 2V 12
This equation is applied as follows. Suppose that you compute a regression model that gives
results such as these in StatView:
9 Tips and shortcuts Common questions
Model Coefficients for Time (days)
Censor Variable: Censor var
Model: Proportional Hazards
DF
Coef
Treatment
3
Std. Error
•
Coef/SE
Chi-Square
P-Value
•
•
4.549512
.2079
Exp(Coef)
•
Treatment 1
1
-.522397
.409513
-1.275654
1.627294
.2021
.593097
Treatment 2
1
.019237
.347218
.055402
.003069
.9558
1.019423
Treatment 3
1
.298397
.339070
.880045
.774479
.3788
1.347697
Coefficient Covariances for Time (days)
Censor Variable: Censor var
Model: Proportional Hazards
Treatment: Treatment 1
Treatment: Treatment 2
Treatment: Treatment 1
.167701
Treatment: Treatment 2
.067560
.120561
Treatment: Treatment 3
.067107
.066885
Treatment: Treatment 3
.114969
The variable “Treatment” has 4 levels: treatments 1–3, and a control group. The data were
entered so that the coefficients displayed are all relative to that for the control group, whose
coefficient is 0. (See “Coefficient Initial Values dialog box,” p. 182 of StatView Reference for
details.) Notice that these results are displayed to 6 decimal places; this is recommended to
avoid loss of precision in the following calculations.
Suppose that you wish to test the hypothesis that the coefficient for treatment 1 is the same as
that for treatment 3. The Wald chi-square statistic would therefore be:
2
( – 0.522397 – 0.298397 )
--------------------------------------------------------------------------------------- = 4.538
0.167701 + 0.114969 – 2 ( 0.067107 )
Then, to compute the p value associated with this chi-square value, use the following formula
in StatView:
1 – ProbChiSquare(4.538,1)
In this example, the p value is 0.033. You would therefore conclude that the coefficients from
treatments 1 and 3 are significantly different at the 0.05 level.
How can I create step function plots?
In some cases, such as when you would like to plot confidence limits about a Kaplan-Meier
survival estimate, you might wish to create your own step function plots. Unfortunately, this
plot type is not directly supported in StatView. Using a few simple steps, however, you can
create your own step function plots using the bivariate line chart.
These steps can be summarized as follows:
• Copy the variables (including the censor variable) for which you want to create step functions, then paste them into a new dataset.
If you were creating a step plot of the cumulative survival function, you would copy the
“Time,” “Cum. survival,” and “Status” variables from the dataset created by the analysis. If
you want to plot confidence limits, copy the upper and lower confidence limit variables as
well. (Survival results can be saved to datasets for both nonparametric analyses and regression
9 Tips and shortcuts Troubleshooting
models; for more information, see the chapters “Survival: Nonparametric,” p. 143, and “Survival: Regression,” p. 167 of StatView Reference.)
• Delete the censored cases from the new dataset.
You could do this in a variety of ways. Probably the easiest way is to define a criterion for the
censored cases (e.g., “Censor 1”), then use that criterion to select only the censored cases,
then delete these cases. (Hold the Control key while selecting a criterion from the Criteria
pop-up menu.)
• In the new dataset, select and copy all rows of all variables.
• Paste the rows in the input row at the bottom of the new dataset.
• Sort the new dataset by “Time” (ascending sort) and “Cum. survival” (descending sort), in
that order. Generally, the dataset should be sorted first by whatever variable will be on the
horizontal (X) axis of your step plot and second by the variable that will be on the vertical
axis. (Sort by group, time, and survival in that order if you want separate survival function
plots for different groups.)
• Copy the entire “Time” variable in the new dataset.
• Insert an empty row before the first row in the new dataset.
• Paste the Time variable back over itself by clicking on the name of the “Time” variable,
then choosing Paste from the Edit menu.
• In a view window, plot “Time” as an X variable, and “Cum. survival” and confidence limits
variables (if desired) as Y variables on a bivariate line chart.
• Change the point size to ø for the symbols associated with the lines. This removes the symbols from the plot and gives a clean step function, showing only lines.
Troubleshooting
Here we provide tips and troubleshooting information to help you use StatView more efficiently and solve problems you might have with the application. Answers to many questions
can be found in the Hints window and these manuals.
General problems
Results appear incorrect
1. Results might seem incorrect if you have too few significant digits displayed in your tables.
Change the number of decimal places displayed with the Preferences command in the
Manage menu. Choose Table, click Modify, and change the default number of decimal
places. To change a single table, select the table and click Edit Display.
2. All statistical routines in StatView have been validated using standard datasets against standard references as well as other commercially available software packages. If you feel that
there is an error, please send us information about what you feel is incorrect and why. If
you have compared the result to that of another application, please send us the input and
9 Tips and shortcuts Troubleshooting
output from that package as well.
Out of memory
If StatView does not have enough memory to perform an operation, it alerts you with a dialog
box. If this happens, you need to increase the amount of memory available to StatView.
Unexpected results
StatView’s behavior in the view is largely dependent on what results are selected. If StatView
creates several tables and graphs when you expect only one, it is probably using variables or
analyses from results that are selected in a part of the view not visible in the window. Open the
Results browser from the View menu (Windows) or Window menu (Macintosh) to see which
results are selected, and look at the Results Selected note in the upper right corner of the window to see the number of results currently selected. See “Determine whether results are
selected,” p. 133.
Grouped objects can account for unexpected numbers of results appearing. You might intend
to add a variable to a single result but effectively assign it to several. If you used the Group
command in the Layout menu to group graphs and tables, selecting one of the objects effectively selects them all. The next action you take in the view then applies to all objects in the
group. See “Group objects,” p. 215.
Random crashes
If the program appears to crash somewhat randomly, try throwing away the StatView Library
file; see “StatView Library,” p. 233. Take note that doing this restores all default preference
settings.
(Windows only) If discarding the Library file does not help, try restarting with the plainest
possible configuration. Boot with a generic set of start-up files, and be sure to check whether
any recent changes to your hardware or network configuration could be involved.
(Macintosh only) If discarding the Library file does not help, try restarting without loading
system extensions. This will reveal whether the difficulty is simply an incompatibility between
StatView and an extension or control panel in your system. To restart without extensions,
choose Restart from the Special menu, then hold down the Shift key until the start-up screen
appears with the message “Extensions off.” Also be sure to check whether any recent changes
to your hardware or network configuration could be involved.
Problem-solving techniques
If you encounter a problem using StatView or do not understand something about the program, we recommend that you follow these steps:
• If you get an error hint when trying to do something, follow the instructions in the Hints
window to solve the problem. In the Formula dialog box, Hints give information about
functions that might prove helpful. See “Hints window,” p. 222.
9 Tips and shortcuts Troubleshooting
• Read this book, using the table of contents or index to locate information.
• See if your question is addressed in this chapter.
• If your question involves setting up an experiment, see if one of the sample datasets provided with the program mirrors your situation. If the problem disappears, you might have
a problem in the structure of your dataset. Review the data requirements in the StatView
Reference chapter for that analysis. Make sure each variable’s attribute settings are correct
(see “Variable attributes,” p. 73). If you imported your data from another application,
examine it for possible importing errors.
• Try again with the simplest possible system configuration. On Windows, reboot with plain
startup files. On Macintosh, restart and hold the Shift key until you see the message
“Extensions off.” If the problem disappears, try adding things back one at a time to isolate
the problem.
• Try reinstalling StatView. A change in your system or network configuration could have
caused a problem, or an application file might have become corrupted.
Importing
It is important to identify the correct separator characters to make the importing process simple and trouble-free. A separator character is a character that occurs between data points and
tells StatView where a data point in one column ends and the next begins. Separator characters also define the end of rows in the dataset.
If you are not certain what separator characters are used in a text file you are importing, open
the file in a word processing application and choose the setting that enables you to see formatting characters within the document. Formatting characters or gremlins are non-textual characters that indicate tabs, spaces, paragraphs and so forth. Each word processing application
represents gremlins a little differently, so check the user manual for your application to see
how they appear.
If a separator character other than a Tab is used, such as a comma, StatView needs to know.
Problems can arise if an improper separator is used in the source file, or if you tell StatView to
use a separator character that does not match the one used in the source application.
Spaces as separators
If you choose spaces and the text file contains strings with spaces within an individual entry,
StatView expects the spaces to indicate separate data points. For example, it would be a mistake to import this text file with spaces as a separator:
Employee Age
Kate Bishop 46
David Wong 19
In this dataset, spaces appear not only between data points but also inside them. StatView
would import this text file as the following three variable dataset:
9 Tips and shortcuts Troubleshooting
As you can see, StatView split the employee names in two. To remedy this, you could either
separate data points with some other character besides spaces (such as Tabs), or place double
quotation marks around distinct data points having spaces within them.
The text file should look like this:
Employee <tab> Age
Kate Bishop <tab> 46
David Wong <tab> 19
or this:
"Employee" "Age"
"Kate Bishop" "46"
"David Wong" "19"
Commas as separators
Another example of an incorrect choice would be to import the following file without specifying commas as a separator:
Name,Age
Yukito,32
Setsuko,35
Armita,30
Choosing Tab, for example, tells StatView to import the file as a one variable dataset:
Remedies for common errors
1. If some values in certain rows are shifted to the right, see if the source text file contains
groups of the separator character you used (two commas, for instance). If it does, edit out
the extra separator characters from the source text file and import the file into StatView
again.
2. If some values are shifted to the left in a file imported with space separators, you used a
space separator to indicate a missing value. Two or more spaces are condensed into one. If
two or more spaces are grouped together, edit those out of the source text file. Type a
period with a space on either side into the source file where the missing value belongs and
import the file again.
3. If you have an empty data cell (without a missing value symbol), you probably chose the
9 Tips and shortcuts Troubleshooting
return character to separate values on a line. Since duplicate returns are not compressed
into a single missing value ( . ), your data will be imported improperly. Check the text file
to see if there are any duplicate return characters and remove them.
4. If you want to import a variable of mixed data type (real, integer and string, for instance)
or one with errors, choose Make columns with errors have type string in the Import dialog
box. This setting turns a variable of mixed data type or a variable with field errors into a
variable with a String data type. You can import the dataset and examine the variable to see
what caused the errors. Correct the errors and change the variable to the appropriate data
type (through the attribute pane).
5. If you have an inordinately large number of missing values in your dataset, check to see if
the source text file has formatting characters in it such as dollar signs, percent signs, etc.
This is more likely to occur if you import a text file from a spreadsheet application such as
Excel.
6. If you are importing a dataset with several nominal variables that share the same group
level names, you should import these variables as type String rather than Category. Make
sure that the Import non-numeric data as type String option is checked in the import dialog box. This prevents StatView from creating multiple categories with the same group
level names.
Printing
If you are having problems related to printing, following these guidelines might remedy the
situation.
• Try printing from another application to determine if it is indeed a printing problem or if
the problem lies only in the use of StatView.
• Make sure you have your printer and printer drivers correctly installed.
• Some printers require that you install and use special screen fonts; otherwise you might get
misaligned print or odd spacing.
• Be sure that enough memory is available for printing.
Formulas and criteria
When I click compute, nothing happens. Why?
• Does the Hints window offer any help? The Hints window tells you when more or fewer
arguments are needed, when an argument is the wrong type (such as a variable when a
number is expected), and so on.
• Are any variable names or function names misspelled?
• Are you missing any parentheses? You might need to add parentheses to control the order
of operations. Extra pairs of parentheses are rarely harmful. StatView highlights
unmatched parentheses, so you can fix them. Often error messages about the wrong number of arguments are due to a problem with parentheses.
9 Tips and shortcuts Troubleshooting
• Do you have quotation marks around variable names containing spaces? Around text values such as e and π, which are also function names?
Why do I get a column of missing values?
• Are any variable or function names misspelled?
• Does the formula variable have the correct type? New variables have type real by default;
you might need to change this to date/time, category, string, or currency before you’ll see
the results you want.
• Are you missing any parentheses?
• Are any text values misspelled?
• Are all arguments listed in the correct order?
• Do you have quotation marks around variable names containing spaces? Around text values such as e and π, which are also function names?
• Do your variable names contain “reserved words”? Function names, operators, and category level names should not be used in variable names. (Many examples in this reference
break this rule so that dataset illustrations are easier to interpret.) For a list of function
names, see the table of contents.
• If you can’t figure out what might be wrong, Copy just the columns the formula needs,
Paste them into a new dataset, and try your formula there. If it works, then the problem
has to do with naming conflicts (reserved words, variable name changes, etc.). If you don’t
have time to figure out where that naming conflict is, Copy the results and Paste them into
the full dataset as a user-entered variable.
Why is my recoded variable wrong?
• Does your original variable have any missing values? Look at Missing Cells in the attribute
pane. Use the Recode command or use a formula with “if IsMissing(var)” if you need to
recode missing values to a special group such as “unknown.” Consider using and
instead of = and ≠.
• Does your original variable have more values than you thought? Look at Minimum and
Maximum in the variable attribute pane. (For nominal variables, which don’t have summary statistics, sort on the variable and look for any unexpected values.)
• Did you use “else” to set your last group? If so, any values in the original variable that you
forgot end up in that group.
• Did you forget that strings are case-sensitive? “A” and “a” are different values!
• Is your original variable a category variable? If so, be sure to use if…then…else statements
rather than arithmetic functions.
See “if ? then ? else ?,” p. 341 of StatView Reference for some ways to handle these problems.
9 Tips and shortcuts Troubleshooting
Why do I get Formula and Criteria windows when I open a dataset?
These open windows indicate definition errors that you need to fix before StatView can compute the variables.
• Did you rename any variables used in formula or criteria definitions? You need to update
those formulas or criteria to use the current names.
• Did you edit any category definitions for variables used in formula and criteria definitions?
You need to update those formulas or criteria to use the current level names from the new
category definition/s.
• Do your variable names contain “reserved words”? Function names, operators, and category level names should not be used in variable names. (Many examples in this reference
break this rule so that dataset illustrations are easier to interpret.)
• Was the dataset created in SuperANOVA? Certain functions unique to SuperANOVA cannot be computed in StatView. Edit the definition to use StatView functions and click
Compute.
• Was the dataset created in a newer version of StatView? SuperANOVA and older versions
of StatView have fewer functions; check to see whether you’re using any functions that
your program doesn’t support. (StatView warns you about any such formulas before saving
to older file formats.)
• Was the dataset created on a different type of system? Different platforms do their computations in different levels of precision. Formulas calculated in one version need to be recalculated in another. To suppress recalculations between platforms, choose the Convert
dynamic formulas to static option in Dataset Preferences:
• Was the dataset created with a foreign system? Correct the separator characters used
between arguments of a function to match the character used on your system. (To learn the
correct character, look at functions listed in the Formula dialog box.)
The separator character varies according to the international number format in use. For
example, a formula with period decimal characters uses commas, but a formula with
comma decimal characters uses semi-colons:
RandomNormal(1.5, 3.0)
RandomNormal(1,5; 3,0)
• Try clicking Compute. If it doesn’t work, open the Hints window and check for error messages.
Index
Index
SR=StatView Reference, US=Using StatView
Symbols
A
– ,
#
( ) –
( ]
* ,
**
+ ,
. see missing values
/
/*
< ,
<>
= ,
> ,
?
[ )
[ ]
^
{ }
≠ ,
≤ ,
≥ ,
π
¬
… ,
÷
abbreviations see syntax
abort calculations
abscissa see X axis
absolute value
accelerated failure time ,
actuarial analyses –,
–,
Add Multiple Columns
add results
add variables ,
multiple vs. compound
results –, ,
tutorial example
also see assign variables
add vertex ,
addition , , , –
unary
adjusted R squared
adopt variable assignments –
tutorial example –
alert messages ,
algorithms –
Align Objects
Align to Grid
alignment , , ,
–
allow changes see Unlock
AllRows , , –
alpha
control limits
c/u analyses
individual measurements
Numerics
0
1
Index SR=StatView Reference, US=Using StatView
p/np analysis
range or moving range
subgroup measurements
error see type I error, significance level
alphabetize see Sort
alternate mouse button
ambiguous data class
analyses
clone
compact variables –
example , –,
–, , ,
create –
by hand or with templates
exercises –
tutorial example –
dialog box hints
multiple vs. compound
results –, ,
objects –
overview , –
parameters , –,
tutorial example
template exercises
tutorial example –
variable requirements
variable requirements also see data requirements under specific analysis
analysis browser –
exercises –
open, close
analysis generated variables
correlation matrix
data source
factor scores
regression
survival regression analysis
analysis of variance
analysis of covariance models ,
–, –
analysis of variance models , ,
–
data requirements –
dialog box –
discussion –
exercises –
hypothesis testing –
interaction plots , –,
,
Latin square ,
means tables
model building –
multivariate models –,
–
nonparametric –
post hoc tests
randomized complete
block –
repeated measures models –,
–, –, –,
–
results
templates
tutorial example –
analysis windows –
View, Window menus –
also see analysis browser, results browser,
variable browser, views
Analyze menu
New View , ,
rearrange –
Rebuild Template List
templates ,
analyze subsets –
see analysis of variance
angle ,
see analysis of variance
Apple Guide , ,
application preferences –
Arabic characters , ,
arc functions
arc tool –
ArcCos
ArcCosh
ArcCot
ArcCsc
ArcSec
ArcSin
ArcSinh
ArcTan
ArcTanh
arguments , –,
arithmetic operators
Index SR=StatView Reference, US=Using StatView
arrange results , –
arrow tool
tutorial example
also see selection tool
ascending sort see Sort
assign variables
dialog box –,
exercises –
from other analyses see adopt
templates ,
variables
assign from other analyses see adopt
assignable causes ,
association see correlation, covariance
asterisk , ,
double
attribute pane –, –,
change attributes
control ,
set attributes –
show
tutorial example
autocorrelation
automate analyses see templates
Average
average , ,
AverageIgnoreMissing
avoid errors
axis
bounds , ,
cell dialog box
colors
decimal places ,
frames , , ,
grid lines ,
labels ,
logarithmic and linear scales
move
numeric dialog box
numeric formats ,
ordinal dialog box
rotate text
select
three types
tick marks , –
transpose
values
B
background calculation
background colors
backward stepwise regression see regression
Balloon help , –,
bar charts
fill patterns
frequency distribution
univariate plots
also see cell plots
Bartlett’s chi-square
Bartlett’s test of sphericity
Bartlett’s test template –
baseline cumulative hazard plot
baseline cumulative survival plot
baseline estimates, Kaplan-Meier
baseline hazard
baseline ln cumulative hazard plot
baseline survival table
Basic Statistics
batch mode see templates
beep for error messages
bell-shaped curve
Bernoulli distribution
beta distribution
beta see type II error
between subjects
Bezier curves see spline tool
bimodal distribution
binary logistic regression
binary operators see operators
binomial distribution , ,
BinomialCoeffs
bivariate plots –
axis types
confidence intervals , ,
, ,
correlation ,
cubic spline , , –,
data requirements
dialog box
discussion –
error bars
Index SR=StatView Reference, US=Using StatView
exercises , –
fitted lines –
interaction plots
lowess , –,
multiple variables
nominal data
results
split-by variables
strategy –
supersmoother , –,
templates
exercise
black selection handles , , ,
–, , ,
–,
blocking factor ,
Bonferroni/Dunn –,
Boolean operators
Boolean variables
borders
dialog box
tables , ,
box plots , , , ,
axis labels vs. legend text
change style
data requirements
dialog box
discussion
exercise
results
subgroups
templates
tutorial example
BoxCox
braces
brackets
breakpoints see Recode
Breslow-Gehan-Wilcoxon test ,
browser see analysis browser, formula browser, results browser, triangle controls,
variable browser
C
C class marker see class marker
C usage marker see usage markers
c/u analyses see QC c/u analysis
calculations
background
cancel
control –
precision
save results with view
calculator keypad
cancel calculations
Candy Bars Data –
capability analysis , –,
dialog box ,
table
capability indices
Cpk
Cpm
example
indices , ,
individual measurements analysis
k (centering index)
parameters
caret
case number
case-control studies
case-sensitive
casewise operation –,
–
categories , –
add
advantages
compact variables
create
example
data type ,
delete ,
disadvantages
edit –
enter data
how StatView uses order –
import ,
multiple
nominal data class ,
problems from editing
recode , ,
reorder levels –
required , ,
Index SR=StatView Reference, US=Using StatView
tutorial example
CDF
Bernoulli
binomial
chi-square
F
inverse
chi-square
F
normal
t
normal
t
Ceil
cell axes
dialog box
labels
tick marks
cell normality
cell plots
axis labels vs. legend text
cell bar chart picture
cell point chart picture
data requirements
dialog box
discussion
exercise
results
templates
censor
nonparametric analyses ,
pattern plot
regression methods ,
center-justify shapes ,
central limit theorem
central tendency
Average
AverageIgnoreMissing
GeometricMean
HarmonicMean
Mean
Median
Mode
TrimmedMean
change
analysis parameters –
appearance of results
criteria
data class ,
data source
data type –
formulas
templates
variable names
characteristic roots
Chinese characters , ,
chi-square
contingency tables
data requirements
distribution ,
results
choose group(s) see Criteria
ChooseArg
chords
class markers , , –
compact variables ,
tutorial example
class see data class
classify results see Split By
Clean Up Items ,
tutorial example
Clear , –
Clipboard ,
import pictures, text
transfer data
clone analyses –,
tutorial example –
closed interval
closed polygon
closed spline
coded raw data , ,
coded summary data –,
coefficient correlations table
coefficient covariances table
coefficient of determination see R squared
coefficient of variation ,
CoeffOfVariation
colinearity ,
collection of analyses see templates
color palette preferences –
colors
axis
graph frame
graph text
Index SR=StatView Reference, US=Using StatView
graphs
grid
page break
plots
preferences –
shapes
table text
tables ,
tutorial example
view background
column attributes see attributes
column charts see cell plots
columns
add multiple columns
insert
labels
selecting
transpose into rows
vs. variables
widths in tables
columnwise operation , ,
–, –
Combinations
combinations
combine analyses
combine datasets see merge
combine functions
combine levels
combine strings
command syntax see syntax
commas
comment
common intercepts test
common problems see troubleshoot
common questions –
dataset –
formulas –
QC analysis –
survival analysis –
common slopes test
communality summary
Compact , ,
compact variables , , –,
, , , –
advantages
analyses –
example , –,
–, , –
categories
compact
create ,
complex example –
simple example –
disadvantages –
expand , –
QC analyses –
repeated measures analysis of
variance ,
triangle controls ,
compare distributions
box plots
compare percentile plots
data requirements
dialog box
discussion
exercise
results
templates
comparison operators
complete
complex criteria ,
compound vs. multiple
results –, ,
Concat
conditional transformation
confidence intervals –
bivariate plots , , ,
chi-square test
interaction plots
logistic regression , ,
–
mean difference , –,
one sample t-test
proportional hazards models
survival curves
survival regression analyses
univariate plots
unpaired comparisons
connect lines
constants –
π
e
consultant
Index SR=StatView Reference, US=Using StatView
contingency coefficient
contingency tables
data requirements –
dialog box
discussion
exercise
results
templates
continuous data class
control charts –
lines –
control limits
3-sigma rule
QC subgroup measurements
analysis
violations –
convert data types
convert values see Recode
coprocessor
Copy –, , –
as text and picture ,
unusual selection shapes –
copy analysis with new variables see clone
copy variable assignments see adopt
corner/center control
correct errors
Correlation
correlation , ,
data requirements
dialog box
discussion
exercise , ,
factor analysis
Kendall rank
matrix
results
Spearman rank
templates
Cos
Cosh
Cot
Count
count
Covariance
covariance ,
data requirements
dialog box
discussion
exercise ,
matrix
results
templates
covariates
proportional hazards models
survival functions ,
Cramer’s V
crash
create
analyses –
by hand or with templates
templates –
tutorial example –
category
tutorial example –
compact variables
criteria –
graphs –
tables –
templates –
exercise –
Create Analysis ,
exercises –
tutorial example
Create Criteria –,
Criteria –, –,
–, –,
analyses –
Boolean operators
choose level(s)
compare results with different
complex ,
delete
Edit/Apply ,
example
hints
names
pop-up menu , , –
print definitions
random
set values
subtitles
troubleshoot –
turn off
tutorial example –
Index SR=StatView Reference, US=Using StatView
vs. Include/Exclude Row
windows at Open ,
also see row inclusion
critical values see , inverse
cross-hair cursor see Recode
cross-platform compatibility ,
crosstabs see contingency tables
Csc
cube root
cubic spline , , ,
–,
CubicSeries
CumProduct
CumSum
CumSumSquares
cumulative distribution function see
cumulative hazard function
cumulative hazard plot ,
cumulative survival plot
currency
data type , –
formats ,
cursor movement see dataset preferences
curve tool see spline tool
Custom Rulers
custom templates –
exercise –
custom tests for special causes
dialog box
save as template
customize
graphs –, –
results –
shapes –
tables –
text –
CUSUM analysis
charts , , ,
individual measurement analyses
results ,
Cut , –
unusual selection shapes –
cutpoints
also see Recode
D
D usage marker see usage markers
data
Copy
Cut, Clear, Delete
enter
manage –
select
subsets see Criteria, Include Row, Exclude Row, Sort, row inclusion
also see dataset
data class , ,
change ,
continuous
discussion
example
in examples
informative ,
nominal , –
data format
currency
date/time
engineering
enhanced free fixed
fixed places
free format
free format fixed
in examples
scientific
data loss
change type
when pasting
data organization , –
arrangement
class –
compact variables
example
structure –
Data pop-up menu
Assign variables dialog box
variable browser , ,
data source , , –
analysis generated
change
dynamic formula
in examples
Index SR=StatView Reference, US=Using StatView
static formula
user entered
data type , –, ,
–, ,
category –,
change –
convert
currency ,
date/time ,
import ,
in examples
integer ,
long integer
real ,
string , –,
dataset
add columns ,
close
common questions –
copy
cut
delete
edit –
insert columns
paste
preferences
print
renamed
save
scroll
split pane control
summary pane see attribute pane
transfer between Windows and
Macintosh ,
troubleshoot
window
windows –
Dataset Templates –
custom
Date
date/time
data type ,
fix imported values ,
format
formats , , –
functions –
Date
DateDifference
Day
DayOfWeek
DayOfYear
Hour
Minute
Month
Now
Second
Time
Weekday
WeekOfYear
Year
group by month
missing values
valid data range , ,
–
DateDifference
Day
DayOfWeek
DayOfYear
decimal characters
decimal places
graphs
in examples
see dataset preferences
tables ,
defaults see preferences
defect variable
degrees ,
degrees of freedom
DegToRad
Delete ,
categories
Criteria
variables
delimiters , –
denominator df
density plot
Dependent
dependent variables –
descending Sort see Sort
descriptive statistics , –
data requirements
dialog box
discussion
exercise
Index SR=StatView Reference, US=Using StatView
results
template exercise –
templates ,
tutorial example
design of StatView
determine whether results are
selected –
deviance
deviance residuals , ,
df see degrees of freedom
dichotomous logistic regression
Difference
difference , ,
unary
differing results
dimensionality reduction
direction of operation –,
–
directory of results see results browser
disk space ,
distribute space
distributions see , random numbers functions
Div
divide continuous into groups see Recode
division , ,
document formulas
document size
limit
documents vs. templates –
dose response
DotProduct
dotted lines
dotted red line see page breaks
double asterisk
double-byte strings
manipulating , ,
double-click row numbers see row inclusion
double-spacing see line spacing
Draw palette , –, ,
–
arc tool –
arrow tool
tutorial example
also see selection tool
corner/center control
curve tool see spline tool
ellipse tool
fill color
tutorial example
fill pattern
grid
line tool
tutorial example
line widths
pen color
tutorial example
pen pattern
polygon tool , –
rectangle tool
rounded rectangle tool –
selection tool , ,
spline tool –
tear-off menu
text tool –
tutorial example
drawing and layout –
Drawing Size ,
dialog box
DS Transfer file format ,
Dunnett’s
Duplicate –
Durbin-Watson
dynamic formulas , –,
data source
also see Formula
dynamic links
analysis objects
Analyze menu
formulas ,
graph text
reopen views
results and data –
tables
E
e ,
also see hyperbolic functions
edit
criteria
data –
tutorial example
Index SR=StatView Reference, US=Using StatView
formulas
table text
Edit Analysis –, , ,
shortcut
tutorial example –
Edit Categories –
Edit Display , –,
–, , , ,
, , ,
dialog boxes –
Edit/Apply Criteria , ,
effects
eigenvalues
table
ElementOf , ,
ellipse tool
ellipses ,
empty cell see missing values
empty graphs ,
empty tables , ,
engineering format
enhanced free fixed format
enter data –
tutorial example , –
values –
equal
equamax
Erf
error bars –
cell plots
interaction plots
error function
error messages , ,
beep
Formula
error of intercept
error-free analyses
Euclidean norm
evaluation –
event time variable , ,
discrete vs. continuous
nonparametric analyses
pattern plot
regression model survival plots
regression models ,
survival regression models
Example Views and Datasets
examples , –
Excel import/export –,
tutorial example –
excess risk
Exclude Row –
analyses –
compare results
subtitles
vs. Criteria
also see row inclusion
exclusion see Criteria, Include Row, Exclude
Row, row inclusion
exclusive OR
Exercises
Expand ,
expand compact variables –
expected value
exponential distribution
exponential function ,
exponential model –,
exponential regression ,
ExponentialSeries
exponentiation
export
Excel , –
missing values
previous StatView versions
SuperANOVA
text –,
expression , –
expression language
extended precision
extra-Binomial variation
extract text
F
F distribution ,
factor
factor analysis
basic output
data requirements
dialog box
Index SR=StatView Reference, US=Using StatView
discussion
exercise
factor extraction methods
factor loadings ,
factor scores
oblique solution
results
save factor scores
summary table
templates
transformation methods
unrotated solution
Factorial
factorial design
factors see category, nominal data
false ,
features
FibonacciSeries
file formats , , , –
file size ,
filename
fill patterns
color
colors ,
graph interior
graphs ,
shapes
final communality estimate
find and replace
Fisher’s exact test
Fisher’s ,
tutorial example
Fisher’s r to z transformation ,
fitted lines see bivariate plots
fitted values –
fix page breaks
tutorial example
fix page breaks see Clean Up Items
fixed places
flip see transpose
Floor
fonts
graphs
tables –
views ,
Food Guide Pyramid
Force button
stepwise regression
survival regression models
force recalculation –
foreign versions
format
date/time data –
graphs –
multiple columns
tutorial example
numeric data
tables –,
templates ,
also see data format
Formula –, , ,
–
analysis generated variables
build definition
common questions –
compute
date/time data
dialog box
dynamic links ,
edit ,
errors
examples –
hints
import from SuperANOVA
missing values
preferences
print definitions
shortcuts
troubleshoot , –
tutorial example –
variable attributes
windows at Open ,
fractional values , , ,
, , ,
F-ratio ,
free format
free format fixed
free-form curves see spline tool
frequency distribution ,
data requirements
dialog box
discussion
exercise
interval settings
Index SR=StatView Reference, US=Using StatView
results
templates
tutorial example
Frequency Summary Table –
Friedman test
F-statistic
F-test see unpaired comparisons
function browser ,
G
G usage marker see usage markers
Games-Howell
gamma distribution
Gaussian distribution
generate data ,
also see Series, Random Number, Formula
generator seed see random numbers
generic variable names for templates
geometric mean
GeometricMean
GeometricSeries
global null hypothesis tests table
golden ratio
graph defaults see preferences
Graph dialog box
graphs
align
arrange –
axes
axis bounds
axis frame
axis frames , ,
axis labels
axis values
bivariate plots –
box plots
cell plots
chart of types
colors
compare percentile plots
create –
by hand or with templates
customize –
decimal places
Edit commands
edit text
fill color
fill patterns ,
fonts
format
frames ,
grid lines , ,
group
height ,
interior , ,
layers
legends , , ,
–,
line patterns
line widths ,
list in analysis browser
lock
move ,
move components
notes ,
numeric formats
overlay
pen color
pen patterns ,
percentile plots
plots ,
plotted lines ,
point colors –
point types
point types and sizes
preferences –, –
reference lines
resize
select
select components
template exercise
text color ,
tick marks ,
titles , ,
ungroup
univariate plots
unlock
width ,
X axis
Y axis
Graphs Only
greater than
greater than or equal to ,
Index SR=StatView Reference, US=Using StatView
gremlins
grid , ,
colors
spacing
grid lines , ,
Group
unexpected results
group labels see category
group variable
nonparametric analyses
grouped regression
Groups
groups –, , , ,
,
choose see Criteria
nonparametric analyses
also see compact variables, Split By
growth regression ,
G-statistic
H
hairlines
half-open interval
harmonic mean
HarmonicMean
Harrington-Fleming test ,
Harris image analysis
hashed red lines see page breaks
hatch marks see tick marks
hazard function
hazard plot ,
height
graphs
tables –
help , , –
helpful hints see troubleshoot
heterogeneous variances
Hide Grid Lines
Hide Page Breaks
Hide Rulers
hierarchical Analyze menu
Hints , –
balloon
formulas
informational
interface
preferences ,
templates (Assign Variables)
window
Histogram , –,
capability indices
normal curve
tutorial example
histograms see frequency distribution
historical values
homogeneity of slopes
homogeneity of variances ,
horizontal see casewise
Hotelling-Lawley trace
Hour
hyperbolic arccosine
hyperbolic arcsine
hyperbolic arctangent
hyperbolic cosine
hyperbolic sine
hyperbolic tangent
hyperbolic trig functions
hypothesis testing –
hypothesized mean
hypothesized variance
I
I charts , ,
I class marker see class marker
if…then…else ,
tutorial example
ignore characters
illustrations in manual
impact
import
categories ,
data type ,
date/time values –,
–
dialog box
examples –
Excel
tutorial example –
missing values , –
non-numeric data as type String
pictures
Index SR=StatView Reference, US=Using StatView
previous StatView versions
separator characters –
SuperANOVA ,
text –
tutorial example –
troubleshoot –
variable names
in control ,
Include Row –
analyses –
compare results
subtitles
vs. Criteria
inclusion see Criteria, Include Row, Exclude
Row, row inclusion
incomplete
incorrect results
Independent
independent variables –
index of results see results browser
individual measurements analysis see QC
individual measurements analysis
inequality –
informational hints
informative data class , ,
input column , ,
input row
insert columns
insert rows –
integer data type ,
interaction effects ,
interaction plots , , –,
,
tutorial example
also see cell plots
intercept –, –,
Interface hints
interior
graphs
tables
international datasets ,
international system configurations
interquartile range
intervals –,
frequency distribution
inverse see
inverse functions see arc functions
inverting matrices
invisible lines
see interquartile range
,
IsMissing ,
,
IsRowExcluded
IsRowIncluded
item count variable
iterated principal axis factor
extraction
iteration history table
J
Japanese characters , ,
joint significance tests table
jump point
K
Kaiser image analysis
Kaplan-Meier ,
Kendall rank correlation
data
data requirements
exercise
Kendall’s tau
key see legends
keyboard shortcuts ,
draw shapes
Edit Analysis, Edit Display
move graphs
move tables
see StatView Shortcuts card
Kolmogorov-Smirnov test ,
data requirements
template
Kruskal-Wallis test
data requirements
exercise
kurtosis ,
L
Lag
Index SR=StatView Reference, US=Using StatView
lag
lambda ,
landscape page
Latin square design –
layers
exercise
Layout tools –
tutorial example
least significant difference (Fisher’s
protected)
Left Justify ,
left to right evaluation
legends –, –
color
frame
layout
move
orientation
show
symbols ,
text
Len
length of string
length of vector
leptokurtic
less than ,
less than or equal to ,
levels see categories
Library , , ,
life table method
likelihood ratio test , ,
Likert scale, reverse
limit document size
line charts
cell plots
connect lines
Line Plot dialog box
univariate plots
also see bivariate plots and univariate plots
line patterns
graphs
tables
line spacing
tables ,
line tool
tutorial example
line widths
graphs ,
shapes
tables ,
linear algebra
DotProduct
Norm
linear axis scale
linear predictor ,
standard error
LinearSeries
listwise deletion
Ln
ln cumulative hazard function , ,
localized versions
locally weighted scatterplot smoother see
lowess
locate results see results browser
Lock
Log
log odds
logarithmic axis scale
logarithmic regression
logarithms , –
also see hyperbolic functions
LogB
logical expressions see Criteria, Formula
logical operators , –
ElementOf
equal
exclusive OR
false
greater than
greater than or equal to
if…then…else
IsMissing
IsRowExcluded
IsRowIncluded
less than
less than or equal to
not equal
true
Index SR=StatView Reference, US=Using StatView
logistic regression –
assumptions
binary
case-control studies
confidence intervals , ,
–
data requirements
dialog box
dichotomous
discussion –
estimating coefficients
exercises ,
iterations
multiple –,
nominal data coding
polytomous , ,
random samples
reference level
results
simple –,
templates
loglogistic model
lognormal model ,
LogOdds
logrank (Mantel-Cox) test ,
long integer data type
lowess , –,
tension ,
see Fisher’s
M
M usage marker
MacDraw II
size limit
macros see templates
see median absolute deviation
magnitude
main effects
manage data –
tutorial example –
Manage menu
commands , , –
Preferences
manage templates –
see analysis of variance
manipulate columns and rows –
Mann-Whitney U test
data
exercise
see analysis of variance
Mantel-Cox test ,
Mantel-Haenszel test ,
marquee select ,
martingale residuals , ,
mathematical expression language
mathematical functions
absolute value
addition
Average
AverageIgnoreMissing
Ceil
Combinations
CumProduct
CumSum
CumSumSquares
difference
Div
division
DotProduct
e
Erf
exponentiation
Factorial
Floor
Lag
Ln
Log
log
LogOdds
Mod
MovingAverage
multiplication
negative
Norm
parentheses
Percentages
Percentile
Permutations
Pi
positive
Remainder
Round
Sqrt
Index SR=StatView Reference, US=Using StatView
subtraction
Sum
SumIgnoreMissing
SumOfColumn
SumOfSquares
Trunc
matrix inversion
Maximum
maximum , ,
Mean
mean , , , –, ,
,
confidence interval around
one sample t-test
mean difference confidence interval
mean square
means tables ,
tutorial example
measure string values
measurement units
Median
median ,
median absolute deviation ,
memory requirements ,
merge
datasets
files
graphs
mesokurtic
message area
method default
Microsoft Excel see Excel
Minimum
minimum , ,
minus , , ,
Minute
Missing Cells
also see missing values
missing values –, , ,
, –, ,
–, , ,
–,
date/time data ,
formulas
import , –
in criteria
multiple datasets
Recode ,
recode
Mod
Mode
mode
model building ,
model coefficients table
modify templates
modulus
Month
Most
mouse shortcuts
also see StatView Shortcuts card
move
graphs
objects
table components
tables
Move Backward –
Move Forward –
Move to Back ,
Move to Front ,
moving range
MovingAverage
MR charts , ,
multiple
multiple categories
multiple comparisons see post hoc tests
multiple logistic regression –,
multiple regression , ,
multiple vs. compound
results –, ,
multiplication , ,
N
N class marker see class marker
name variables see variables
natural logarithm
negation
negative
also see absolute value
nest functions
nested groups
new dataset
tutorial example
Index SR=StatView Reference, US=Using StatView
New View , ,
nominal data
bivariate plots
coding
nominal data class , ,
–,
also see category, Split By
nonconformity variable
c/u analyses
p/np analyses
nonlinear regression –, –
also see logistic regression
nonparametric tests
data
data requirements
dialog box
discussion
exercises
Friedman test
Kendall’s tau
Kolmogorov-Smirnov test
Kruskal-Wallis test
Mann-Whitney U test
one sample sign test
paired sign test
results
Spearman rank correlation
coefficient
templates
ties
Wald-Wolfowitz runs test
Wilcoxon signed rank test
Norm
normal count
normal curve
normal distribution ,
curve on histogram
definition
normality ,
Normality Test ,
not enough memory ,
not equal
notation
keyboard/mouse shortcuts
notation see syntax
notched box plots
notes
move
tables
Now
np charts , ,
nth root
null hypothesis –
number of cases
number of seconds see date/time functions
NumberMissing
NumberOfRows
numerator df
numeric axes
bounds
dialog boxes
tick marks
numeric data
numeric formats
axes
graphs
tables ,
numeric intervals
numeric precision
nutrition labels
O
object-oriented technology ,
objects
align
clean up –
group
layers
lock
move
ungroup
unlock
oblique factor scores , , ,
odds
off-diagonal
old StatView data
omnibus tests
one
one sample analysis
data requirements
dialog box
Index SR=StatView Reference, US=Using StatView
discussion –
exercise
nonparametric
results
templates
t-test
one-case-per-row data –
OneGroupChiSquare
OnlyExcludedRows , ,
–
OnlyIncludedRows , ,
–
Open , –,
dataset
tutorial example
view
use different variables
views –
use different dataset
use original variables
open interval
open polygon
open spline
Open View As –,
operators –
addition
division
exponentiation
multiplication
negative
parentheses
positive
subtraction
order of operations –,
Order pop-up menu
analysis browser
Assign variables dialog box
function browser
results browser
variable browser , ,
ordinal axes ,
ordinate see Y axis
orientation
page
also see transpose
orthogonal factor solution ,
out of control
out of memory ,
outliers ,
and variance
box plots
in descriptive statistics
output list in analysis browser
ovals
overlay
graphs
graphs, tables
P
p value
analysis of variance
contingency tables
correlation
one sample t-test
paired comparisons
regression
regression intercept
unpaired comparisons
z test
p/np analyses see QC p/np analysis
page breaks ,
color
print
show/hide
page orientation
paired comparisons
data
data requirements
dialog box
discussion –
exercise –
nonparametric –
paired t-test
results
templates
z -test
z-test
pairwise deletion
parametric models –
parentheses , ,
intervals
Pareto analysis , ,
Index SR=StatView Reference, US=Using StatView
data requirements –
dialog box –
discussion
exercise –
results
partial correlation ,
partial F-ratio
Pascal’s triangle
Paste , , –
imported pictures and text
results into datasets
unusual selection shapes –
Paste Transposed
patterns see pen patterns
Pearson correlation ,
pen color
pen patterns
colors ,
graphs ,
shapes
tables ,
Percentages
Percentile
percentile plots
percentiles
convert raw scores to
data requirements
dialog box
exercise
find several at once
results
templates
percents of column totals table
percents of row totals table
period see missing values
Permutations
permutations
ordered ,
unordered
Peto-Peto-Wilcoxon test ,
phi coefficient
Pi
Pillai’s trace
placeholders , , ,
formulas
plateau
platykurtic
plots
colors
plotted lines
color
see Fisher’s
plus , , , –
point charts see scattergrams
point colors –
point sizes ,
point types ,
Poisson distribution
polygon tool , –
polynomial regression , –
polytomous logistic regression ,
,
population statistics
portrait page
positive
post hoc tests , –,
assumptions
Bonferroni/Dunn
cell contributions table
Dunnett’s
Fisher’s
Games-Howell
interaction effects
purposes
repeated measures
Scheffé’s F ,
Student Newman Keuls
Tukey-Kramer
type I errors
pound signs
power , , ,
power regression
precision
predicted values –,
preferences –
application –
color palette –
dataset
formula
graph –
graphs –
hints ,
Survival Analysis –
table –, ,
Index SR=StatView Reference, US=Using StatView
view , , –,
–
presentation ,
tutorial example –
prevent changes see Lock
prevent errors
prevent recalculation –,
preview format changes
previous versions’ data
primary pattern solution
principal components analysis
principal values see arc functions
print
Criteria definitions
dataset
Formula definitions
line widths ,
presentation
tutorial example
Random Numbers definitions
Recode definitions –
Series definitions
troubleshoot
views –
prior probability
probabilities functions
ProbBinomial
ProbChiSquare
ProbF
ProbNormal
Probt
ReturnChiSquare
ReturnF
ReturnNormal
ReturnT
probability value see p value
ProbBinomial
ProbChiSquare
ProbF
problems see troubleshoot
ProbNormal
Probt
process
process capability analysis
product , ,
product limit method (KaplanMeier)
product-limit method (KaplanMeier)
progress bar
proportional hazards models , ,
baseline hazard
coefficients
confidence intervals
covariate values
residuals plots
significance tests
stratification
stratified
protected least significant difference see
Fisher’s
Q
QC analysis
common questions –
example
introduction –
QC c/u analysis
c/u charts , ,
control limits
data requirements , –
dialog boxes –
discussion –
exercise –
nonconformity variable
results –
standardize inspection criteria
subgroups
templates
QC individual measurements analysis
capability analysis
data requirements
dialog boxes –
discussion –
exercise –
results –
templates
tests for special causes
QC p/np analysis
control limits
data requirements , –
Index SR=StatView Reference, US=Using StatView
dialog boxes
discussion –
exercises –
p charts , , , ,
results –
standardize inspection criteria
subgroup variables
templates
QC subgroup measurements analysis
data requirements –
dialog boxes –
discussion –
exercises –
results –
templates
tests for special causes
QuadraticSeries
quantile plots
QuarticSeries
quartiles
quartimax
question marks ,
questions see common questions
quotation marks , ,
quotient
R
R (partial correlation coefficient)
R charts , ,
R squared
radians , ,
radius for round corners
RadToDeg
raise to powers
random criteria , ,
Random Numbers –, ,
hints
print definitions
unique
RandomBeta
RandomBinomial
RandomChiSquare
RandomExponential
RandomF
RandomGamma
RandomGaussian
RandomInclusion
randomized complete block design ,
RandomNormal
RandomPoisson
RandomT
RandomUniform
RandomUniformInteger
Range ,
range ,
ranges –,
Rank
rank tests –, , ,
raw data
contingency tables exercise
factor analysis
real data type ,
rearrange templates –
Rebuild Template List –
exercise
Recalculate –, ,
background
templates
recalculate see dynamic formulas
reciprocal powers
Recode –, , , ,
,
categories ,
dialog boxes ,
example
examples –
hints
missing to specified value
missing values
print definitions –
troubleshoot
tutorial example –
record macros see templates
rectangle tool
recycle formulas
recycle results see template
reference level
reference lines
reference structure solution
regression –
Index SR=StatView Reference, US=Using StatView
data requirements
dialog boxes ,
discussion
error distribution
error of intercept
exercises , , –
exponential ,
growth ,
line equation
lines see bivariate plots
logarithmic
models
multiple , ,
nonlinear –, –
also see logistic regression
plots
polynomial , –
power
residual plots
residuals
results ,
simple , ,
stepwise , –,
t value
templates , , ,
exercise –,
with procedure
also see logistic regression
regroup ,
relations –
ElementOf
equal
greater than
greater than or equal to
less than
less than or equal to
not equal
relative frequencies
relative risk
Remainder
remainder
remark
Remove
remove variables
templates
tutorial example
rename datasets
reopen view –
reorder category variable –
repeat analyses see templates
repeated measures analysis of variance see
analysis of variance
reserved words –
Reshape , –
spline curves
residual mean square
residuals , –
plots ,
proportional hazards models
saving and plotting
resize
columns
graphs
imported pictures
pasted object
shapes
tables –
text
restrict computations see Criteria, Include
Row, Exclude Row, row inclusion
results
accuracy
align
clean up –
group
incorrect
layers
list in analysis browser
lock
move
selected
unexpected
ungroup
unlock
validation
results browser –
selected results –
tutorial example
Results Selected note –,
resume work –,
ReturnChiSquare
ReturnF
Index SR=StatView Reference, US=Using StatView
ReturnNormal
ReturnT
reuse formulas
reuse results see template
reverse-code Likert scale
rho see Harrington-Fleming, Spearman
Right Justify
right mouse button
right to left evaluation
right-justify shapes
root
nth
square
root curve
roots greater than one
Rotate Left/Right
rotate text
axis values
rotation methods
Round
Round Corners dialog box
rounded rectangle tool –
rounded squares
row and column organization see data organization
row exclusion see Criteria, Include Row, Exclude Row, row inclusion
row heights ,
row inclusion , , –,
, –,
multiple datasets
subtitles
also see Criteria, Include Row, Exclude
Row
row labels
row numbers, dimmed , , ,
,
RowNumber
rows
selecting
transpose into columns
row-wise see casewise
Roy’s Greatest Root
rs (range span)
rulers
S
S charts , , ,
compared to R charts
S usage marker see usage markers
sample size
sample statistics
save
analysis results with view ,
–,
datasets
tutorial example
Excel
file formats , –
template, tutorial example ,
text
views –
tutorial example ,
Save As see save
scattergrams
cell plots
compare percentiles plot
confidence intervals
error bars
factor plots
format
regression plots
residual plots
scree plot
templates
example
univariate plots
also see bivariate plots, univariate plots
Scheffé’s F ,
scientific format
score residuals ,
score test ,
Scrapbook
scree plot
search
Sec
Second
second mouse button
seed see random numbers
Select
select
graph components
Index SR=StatView Reference, US=Using StatView
graphs
rows and columns
shapes
table components
tables
variables
Select a Dataset dialog box
selected results –
selection handles , –,
–, , ,
–,
selection tool ,
semi-colons
separator characters –,
–
importing
serial autocorrelation
Series –, ,
example
hints
print definition
series functions
BinomialCoeffs
CubicSeries
ExponentialSeries
FibonacciSeries
GeometricSeries
LinearSeries
QuadraticSeries
QuarticSeries
sets –,
braces
75% variance rule
shapes
arcs –
colors
corner/center control
curves see spline tool
ellipses
fill patterns
line widths
lines
ovals
pen patterns
polygons , –
rectangles
reshape
resize
rounded rectangles –
rounded squares
select
spline curves –
squares
starting point
text –
shortcuts see StatView Shortcuts card
Show ,
Show Balloons
Show Definition
Show Grid Lines
Show Page Breaks
Show pop-up menu
analysis browser
results browser
Show Rulers
Show Selection , –
side by side column charts
sigma limits
sign of coefficients
sign test ,
exercise
significance level
discussion –
post hoc tests
also see p value
simple logistic regression –,
simple regression , ,
Sin
single-byte strings
manipulating , ,
single-spacing see line spacing
singular matrix
Sinh
Size
skewness , ,
slash ,
slope ,
slots for variables
see squared multiple correlation
smooth
smoothing see bivariate plots
snap to grid –
Index SR=StatView Reference, US=Using StatView
solve problems see troubleshoot
Sort –, ,
analyses –
turn off
tutorial example
Undo
source see data source
space
Spearman rank correlation coefficient
data
Spearman rank correlation coefficient
(rho) ,
Special Causes Definitions table
special purpose functions
( ), [ ], ( ], [ ), [ ]
<, >, ≤, ≥
{ }
ChooseArg
VariableElement
specification limits
sphericity
spline tool –
Split By , , ,
tutorial example –
split pane control ,
Recode
Sqrt
square root
squared multiple correlation ,
squares
SS[e(i) – e(i–1)]
stabilize variance
stack order of objects
stagger tick marks
standard deviation , ,
bars on interaction plot
lines on univariate plot
standard error
bars on interaction plot
descriptive statistics table
lines on univariate plot
standard error of the mean ,
StandardDeviation
StandardError
standardize ,
standardized regression coefficients
StandardScores
Static Formula , –
data source
reason to use , ,
also see Formula
stationery see templates
statistical functions
BoxCox
CoeffOfVariation
Correlation
Count
Covariance
GeometricMean
Groups
HarmonicMean
Maximum
Mean
Median
Minimum
Mode
NumberMissing
NumberOfRows
OneGroupChiSquare
Range
Rank
RowNumber
StandardDeviation
StandardError
StandardScores
TrimmedMean
Variance
statistics texts, recommended
status bars , ,
StatView 4.x data
StatView Guide
StatView II/SE+Graphics file format
StatView Library , ,
categories
StatView Templates folder ,
step function plots
stepwise regression , –,
F-to-enter
F-to-remove
survival analysis ,
Strata button
survival regression models
Index SR=StatView Reference, US=Using StatView
stratification variable
nonparametric analyses ,
regression models
strike-through text
string data type , –,
string functions see text functions
Student-Newman-Keuls
Style
style sheets see templates, preferences
subgroup measurements analysis see QC
subgroup measurements analysis
subgroup variables ,
differences
formulas
subject (group)
subsets of data see Criteria, Include Row,
Exclude Row, row inclusion
Substring
subtitles for inclusion
subtraction , ,
unary
Sum
sum , , ,
sum of squares , ,
algorithms
SumIgnoreMissing
summary data
summary pane see attribute pane
summary statistics ,
tutorial example
SumOfColumn
SumOfSquares
SuperANOVA
file format
formulas
import/export ,
superimpose graphs
supersmoother , –,
suppress recalculation –,
survival analysis
common questions –
example –
functions , , ,
introduction
nonparametric methods
data requirements –
dialog boxes –
discussion –
exercise –
results
templates
plot with confidence intervals
preferences –
regression methods
data requirements –
dialog boxes –
discussion ,
exercise –
results –
stepwise
templates
symbols see point types
syntax
arguments –,
combine functions
constants –
expression
order of operations –
placeholders
quotation marks ,
row inclusion –
variables –
system configuration
troubleshoot
system crash
system software , , –
T
t distribution ,
T usage marker see usage markers
t value
one sample t-test
paired t-test
regression
unpaired t-test
table defaults see preferences
Table dialog box
tables
align
arrange –
borders , ,
colors ,
column widths
Index SR=StatView Reference, US=Using StatView
components
create –
by hand or with templates
customize –
decimal places ,
Edit commands
edit text
fonts –
format , ,
group
height and width –
interior
layers
line spacing , ,
line widths ,
list in analysis browser
lock
move ,
move components
notes
number format
numeric formats
pen patterns ,
preferences –, ,
resize –
row and column labels
row heights ,
select
select components
structure
text alignment –
text angles –
text colors
titles
transpose ,
ungroup
unlock
tails
F-test
one sample analysis
paired comparisons
unpaired t-test
Tan
Tanh
target value
Tarone-Ware test ,
Template folder ,
templates –
assign variables
dialog box
combine analyses
create –
exercise –
dataset
exercises –, ,
formats ,
generic variable names
graph formats
manage –
modify ,
exercise
open
pre-assigned variables
rearrange –
repeat analyses
save
save views
tips
variable slots
vs. views –
temporary files
tension ,
test differences among covariate
levels
test normality , , ,
tests for special causes –
c/u analyses ,
false signal
I analyses
individual measurements
individual measurements
analyses
p/np analyses , –
subgroup measurement analyses
subgroup measurements analysis
text
attributes
colors , , ,
edit graph text
edit table text
import/export –
tutorial example –
resize
rotate
Index SR=StatView Reference, US=Using StatView
Save As
views and templates
see text tool
text editor
text functions –
ChooseArg
Concat
Find
Len
Substring
Text menu ,
text tool , –
tutorial example
thickness see line widths
tick marks , , –
stagger
ties
Time ,
time functions see date/time functions
time series functions
Correlation
Difference
Lag
MovingAverage
times see multiplication, date/time
titles
graphs
inclusion subtitles
move
show
tables
tool bar
Tool tips ,
transform data see Formula, Recode
transformations
BoxCox
Difference
Ln
Log
LogB
LogOdds
transpose
axes
page
rows and columns
tables ,
tutorial example
trend
triangle controls
analysis browser
compact variables , , ,
Formula dialog box –
templates
tutorial example
trigonometric functions
ArcCos
ArcCosh
ArcCot
ArcCsc
ArcSec
ArcSin
ArcSinh
ArcTan
ArcTanh
Cos
Cosh
Cot
Csc
DegToRad
example dataset
RadToDeg
Sec
Sin
Sinh
Tan
Tanh
trimmed mean
TrimmedMean
troubleshoot –
formulas and criteria ,
–
general problems –
import –
print
Recode
system configuration
true ,
Trunc
truth tables –
t-test see paired comparisons, unpaired comparisons, one sample analysis
Tukey-Kramer
Turn Grid On/Off
Index SR=StatView Reference, US=Using StatView
turn off Criteria
tutorial –
two-way table ,
type I error –,
type II error –
U
u charts , , , ,
UE in variable name
uncensored
Undo
graph/table formats
Sort
unexpected results
Ungroup
uniform distribution –
unique random integers
univariate plots
axis types
confidence intervals
connect lines
data requirements
dialog box
discussion
exercise
Line Plot dialog box
ordinal axes
results
templates
Unlock
unpaired comparisons
data
data requirements
dialog box
discussion
exercise
nonparametric
nonparametric test
results
templates
unrotated factor solution ,
unsort data
update Analyze menu
update see dynamic formulas
usage markers , , ,
tutorial example
user entered data source
V
valid range
date/time data , , –
each data type
integer data
validation of StatView results
variability
CoeffOfVariation
StandardDeviation
StandardError
Variance
variable attributes see attribute pane
variable attributes in examples
variable browser , –,
–
buttons
exercises –
Force button
Formula dialog box
keyboard shortcuts see StatView Shortcuts card
X Variable button
Y Variable button
variable names, rules
variable summary pane see attribute pane
variable symbols see usage markers, class
markers
variable types see data type
VariableElement
variables –
assign
delete
names
change
generic for templates
tutorial example
requirements also see data requirements
under specific analysis
slots for templates
vs. columns
Variables dialog box
variable-wise see columnwise
Variance
Index SR=StatView Reference, US=Using StatView
variance ,
chi-square test
comparison
test homogeneity
varimax
vectors
also see variables
velocity handle
vertical alignment
vertical see columnwise
View menu –
View pop-up menu
views
background color
clean up –
document limits
documents vs. templates
Edit commands
file formats –
fonts
grid lines
hairlines
Open –
use different datasets
use different variables
use original variables
preferences , , –,
–
print –
rulers
save results ,
save templates
save views as views
vs. templates –
window , –
Results Selected note
violations of control limits
W
Wald test , ,
Wald-Wolfowitz runs test ,
Weekday
WeekOfYear
Weibull model –, ,
Welch’s test template –
Western Electric rules
Westgard rules
width
graphs
tables –
Wilcoxon signed rank test
data
exercise
Wilks’ Lambda
Window menu –
within subjects
X
X axis
X boxes ,
X usage marker see usage markers
X Variable
Xbar charts , , , ,
Y
Y axis
Y usage marker see usage markers
Y Variable
Year
yin-yang cursor , ,
Z
zero
z-scores ,
z-test see paired comparisons