1
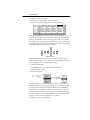
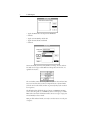
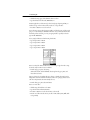
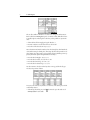
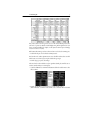
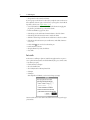
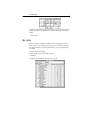
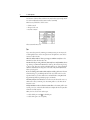
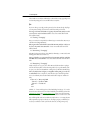
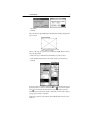
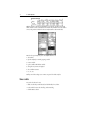
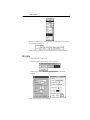
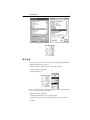
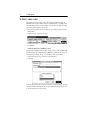
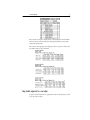
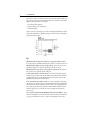
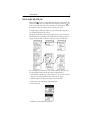
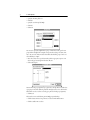
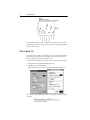
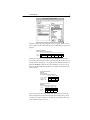
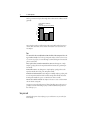
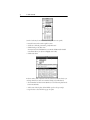
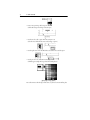
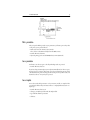
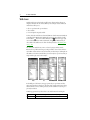
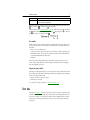
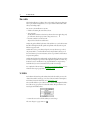
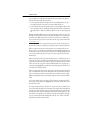
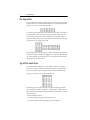
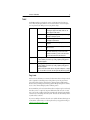
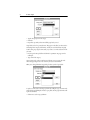
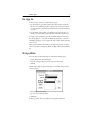
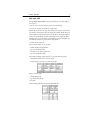
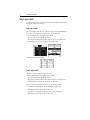
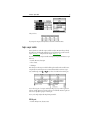
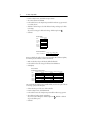
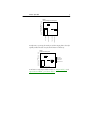
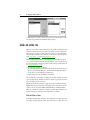
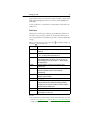
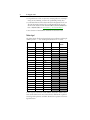
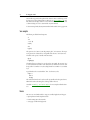
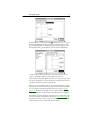
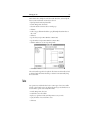
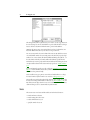
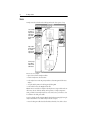
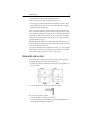
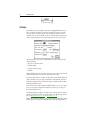
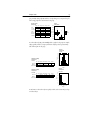
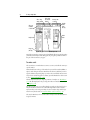
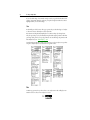
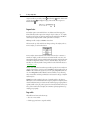
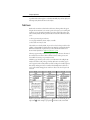
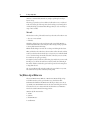
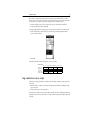
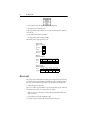
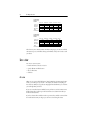
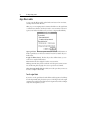
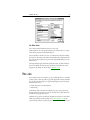
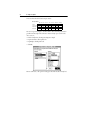
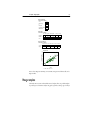
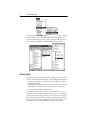
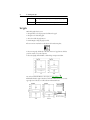
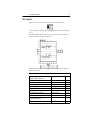
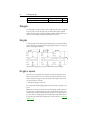
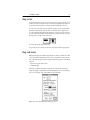
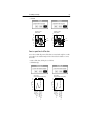
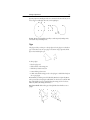
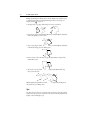
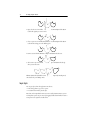
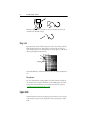
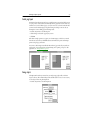
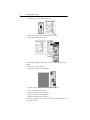
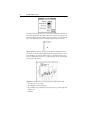
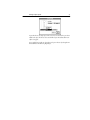
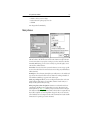
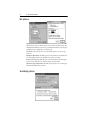
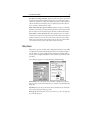
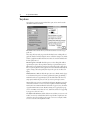
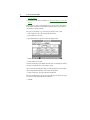
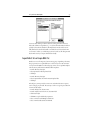
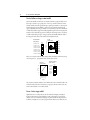
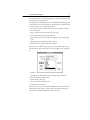
7 Customizing results Graphs Flip horizontal and vertical axes Check this option (turn it on) to transpose the horizontal and vertical axes, changing the orientation of the graph. Y X X Y Bounds include extra lines Check this option (turn it on) to ensure that default axis bounds do not exclude calculated lines (such as the three standard deviation lines in univariate charts). Show legend Check this box to display the graph legend. Show title Check this box to include titles showing analysis type, variables assigned, and criteria/row inclusion in effect. Dimensions Specify the horizontal and vertical dimensions in inches, centimeters, picas or points. Numbers Choose a number of decimal places for numbers in axis scales (see “Decimal places,” p. 80). Check Always have leading digit to include a leading zero in fractional values (e.g., 0.25). Choose box styles You can choose from among four different box styles for box plots: • Inside a box plot, click the plot (the actual box-and-whisker) • Click Edit Display The default style uses regular boxes and includes outliers as points. The second style uses regular boxes but excludes outliers. The third style uses boxes with notches showing the 95% confidence interval for the median and includes outliers. The fourth choice uses notched boxes but excludes outliers. Connect or separate lines for univariate line plots You can choose whether all points in univariate line plot are connected with a single line, or with a separate line for each group. Examples of both are shown below; the default is separate line segments for each group. • Inside a univariate or cell line chart, click the plot (one of the lines) • Click Edit Display • Turn the option on or off